DOI:10.32604/cmc.2021.017952
| Computers, Materials & Continua DOI:10.32604/cmc.2021.017952 | |
| Article |
EA-RDSP: Energy Aware Rapidly Deployable Wireless Ad hoc System for Post Disaster Management
1Department of Electrical and Computer Engineering, COMSATS University Islamabad, Attock, 43600, Pakistan
2Division of Computer and Electronics Systems Engineering, Hankuk University of Foreign Studies,Yongin-si, 17035, Korea
3Department of Information and Communication Engineering, Inha University, Incheon, 22212, Korea
*Corresponding Author: Kyung-Sup Kwak. Email: kskwak@inha.ac.kr
Received: 18 February 2021; Accepted: 26 March 2021
Abstract: In post disaster scenarios such as war zones floods and earthquakes, the cellular communication infrastructure can be lost or severely damaged. In such emergency situations, remaining in contact with other rescue response teams in order to provide inputs for both headquarters and disaster survivors becomes very necessary. Therefore, in this research work, a design, implementation and evaluation of energy aware rapidly deployable system named EA-RDSP is proposed. The proposed research work assists the early rescue workers and victims to transmit their location information towards the remotely located servers. In EA-RDSP, two algorithms are proposed i.e., Hop count Assignment (HCA) algorithm and Maximum Neighbor Selection (MNS) algorithm. The EA-RDSP contains three types of nodes; the client node sends information about casualty in the disaster area to the server, the relay nodes transmit this information from client node to server nodes via multi-hop transmission, the server node receives messages sent by client node to alert rescue teams. The EAM-RDSP contains three types of nodes; the client node sends information about casualty in the disaster area to the server, the relay nodes transmit this information from client node to server nodes via multi-hop transmission, the server node receives messages sent by client node to alert rescue teams. The proposed EA-RDSP scheme is simulated using NS-2 simulator and its performance is compared with existing scheme in terms of end-to-end delay, message delivery ratio, network overhead and energy consumption.
Keywords: Disaster management; neighbor selection; device-to-device communication; multi-hop relaying; energy efficiency
A few decades ago, wireless communication emerged as a fastest diffusing technology in the world where cellular communication placed its remarkable positon. Today, its usage has spread from the rural to the urban areas and according to a report [1], the number of active cellular subscription in the world is about 8 billion and approximately half of those active users have been added since last year, especially in the urban areas. Currently, the number of subscribers has become larger than the total number of population of the world. The reason is everyone has more than one subscription because different operators offer attractive data plans. In many developing and under developing countries, many wired systems have been replaced with wireless cellular networks because of their stress free usage and low capital cost. However, due to the occurrence of natural and man-made disasters, these cellular communication infrastructures and services are destroyed or severely damaged. For example during the Hurricane Odile that struck Baja California coasts in Mexico [2], many towns were destroyed and many electrical & communication infrastructures were disrupted. Because of the Hurricane, practically 90 percent of the population encountered electric and interaction dilemmas. Because of this harm, aid companies encountered problems that include lack of interaction with the sufferers and among each other. The communication among rescue teams, and paramedics is vital; specifically, the feedback of first rescue responders is remarkably critical when you look at the post disaster situations. From networking viewpoint, main aim is always to re-establish the interaction between rescue teams and very first responders. One good way to overcome these problems is always to place network elements, such as relays, access points, or routers to establish a temporary network on demand [3]. This needs a system that is certainly rapidly deployable to perform the required relief efforts, including helicopters and first responders on the floor that can save many lives. In inclusion, to guarantee the safety of survivors in the region that is disaster-affected, it is very important to manage stranded people's requests in a manner that is appropriate to provide a picture of the total injuries, relocation strategy, emergency requirements, and so forth [4,5]. Additionally, in an attempt to quickly deliver and handle food as well as other resources to displaced inhabitants, the need for a reliable temporary network that is certainly very easy to deploy and relies on radio waves instead of a data cable would be described as a choice that is good for interaction in disaster situations [6].
In this work, energy aware rapidly deployable system for post-disaster management (EA-RDSP) is proposed. The proposed EA-RDSP aims to lower the waiting times for sending the rescue teams and victim's destination information towards the control server. EA-RDSP consists of Dynamic ID Assignment (DIA) algorithm and Minimum Maximum Neighbor (MMN) algorithm. In addition, the EA-RDSP enables relay nodes to dynamically select their hop counts from servers and after that each relay node selects best forwarders towards the control server to attenuate end-to-end and message delivery delays. Eventually, client device could be used to transmit victim's information via Wi-Fi to the control server, which then alerts emergency rescue teams to present meals and other resources to displaced and trapped survivors.
The rest of this paper is organized as follows. Section 2 summarizes the related work. Section 3 explains the architecture of the proposed scheme. Section 4 describes the performance evaluation and compares the performance of the EA-RDSP with the existing scheme. Finally, Section 5 provides the concluding remarks.
In post-disaster scenario, whenever the telecommunication infrastructure is completely demolished, then in such scenarios, it becomes very challengeable and crucial to improve the emergency reaction time. In such circumstances, the purpose of rescue members would be to make contact with the tragedy survivals to provide first-aid services. Therefore, implementation and upkeep of such a network must certainly also be effortless. To help survivals in the disaster area, different disaster management systems have been proposed by the researchers in the literature.
Researchers in [7,8] demonstrated the necessity of quickly deployable networks in disaster circumstances, and offered a survey of different schemes providing sufficient post-disaster crisis solutions. Jahir et al. [7] additionally looked over the networking variables that are necessary inside a catastrophe environment, such as routing overhead, topology administration, energy savings, and multimedia bandwidth usage. Reina et al. [8] provided an outline of basic ad hoc network that can be utilized in the disaster area and could alleviate the disaster consequences and protect life. Lin Shan et al. [9] has presented decentralized network concept where the intermediate devices communicate with each other independent of any infrastructure. Various devices such as GPS, sensors and transceivers interact without centralized coordination. Ghaznavi et al. [10] has proposed the concept of a rescue base station (RBS). RBS is Global System for Mobile Communications (GSM) compatible, and solar power operated device. The proposed system contains several disconnected RBS devices. The RBS provides GSM facility to subscribed individuals which lie within its coverage location.
Pezeshkian et al. [11] has proposed a system which is very helpful in military situations like war condition or attacking the gangster area. In proposed system, mobile robots that utilize sensor nodes are deployed in incident zone. However, sensor nodes have limited range, and robot can affect them badly as the robot moves around snags. A robot-assisted scheme has been proposed by the Nguyen et al. [12–14]. It is used to assist the intermediate nodes send a message over a long distance between source and destination. The proposed system is based on mesh topology that creates an autonomous broadband wireless network. The Suzuki et al. [15] has proposed an ad hoc airborne communication scheme using balloons. Multi-hop ad hoc network is created by balloons in space. Internet is accessed through an internet gateway deployed in the misadventure zone. Internet services are provided to the rescue workers by connecting with flying balloons. GPS receiver is carried by every balloon which is used to locate the balloon's position. A Movable and Deployable Resource Unit (MDRU) has been proposed by Sakano et al. [16,17]. After the disaster, the resources are moved toward the tragedy location with the help of MDRU where the temporary network is established to provide services for the exchange of necessary information. All the required equipment is carried by the van to create ad hoc communication system in the disaster zone.
Many other deployment schemes have been proposed by the researchers in [18–25]. SUPER-MAN is proposed in [18] that utilizes mobile ad hoc network (MANET). The key goal of this system was to disseminate building condition status and resource requests information towards control sever. The disaster assessment information is stored in radio frequency identification (RFID) tags. A MANET of RFID tags is created, which utilizes the dynamic source routing (DSR) protocol to enable RFID tags communicate with control server. Hu et al. [19] has proposed ground penetrating radar (GPR) that automatically identifies, locates, and characterizes vacant place within the incident zone. Based on radar signal patterns, radargrams are pre-processed for segmenting the vacant spaces boundaries. Confidence intervals of 95 % are created around segmented boundaries to search for uncertainties.
The Souryal et al. have introduced the concept of breadcrumbs in [26–29]. Breadcrumbs are tiny relay devices. These small devices primarily serve to transfer packets through edge nodes. In the crisis zone, these tiny devices and mobile radios are carried by the rescue team's leaders to connect with command centre. Static ad hoc network is created by placing the breadcrumb relays on demand. The breadcrumb assures trustworthy communication over an enlarged coverage zone and reduces the network separation probability. Extensive research has been carried out to resolve the breadcrumb deployment problem. Researchers have defined different deployment algorithms; nonetheless they all have some common characteristics. Link quality is checked by some algorithms by measuring the signal-to-noise ratio (SNR) [26], bandwidth [27], or received signal strength indicator (RSSI) [28]. An automatic breadcrumb dispenser is suggested in [29] to address this issue. An algorithm based on Utility Function (UF) that sets criteria for the automatic deployment of new breadcrumbs is proposed. The algorithm based on UF operates as follows: to start the algorithm, the requester broadcasts a support message. After a support message has been sent, all the requester's neighbors send their data (number of breadcrumbs) to the requester. The requester determines the value of each of the utility functions of its neighbors following a predefine timeout. To deploy a new breadcrumb, the requester transmits a drop message to a neighbor with the highest UF value.
The most critical constraint in rapidly deployable networks is energy. The nodes energy depletes very soon due to continuous creation of connection with other nodes and transmitting the critical information from source to destination and towards the command Centre. Thus low data rates in addition to limited energy resources are believed to be less efficient in the emergency situations. Therefore, depleting the battery of a node might have tragic outcomes in these networks and hence energy-efficient routing protocols are inevitable in disaster area networks due to the finite power supply of wireless devices [30–36]. For this purpose, Uddin et al. [5] proposed an energy-efficient multi-copy disaster response network routing protocol that takes advantage of naturally recurring network mobility and communication patterns, developed by emergency workers, survivors, volunteers and their vehicles to reduce the number of control messages required to achieve an acceptable delivery ratio and prolong the life of battery-operated devices. By finding recurrent contacts and forming a routing table that uses these repeated contacts to send a message to a destination, their protocol greatly reduces the need for large numbers of control messages. Mukherjee et al. in [30] has proposed the multicast routing protocol which is self-managing and energy efficient. In this protocol, route is selected by using the waste energy cost metric (WECM). To maintain an energy efficient and self-healing routing structure, Self-Stabilizing, Shortest-Path spanning Tree for Energy efficiency protocol (SS-SPST-E) is utilized. Zhang et al. in [31] has proposed leisure degree adaptive routing (LDAR) by presenting a new combined metric “lifetime-aware leisure degree”, which reflects the transmission state, the remaining energy, and energy drain rate in a node as a whole. Using this protocol, the network lifetime could be prolonged and improves the performance of emergency networks. In [33–36], clusters based algorithms are introduced to optimize energy requirements in wireless networks. In these algorithms, the nodes form clusters, which then select Cluster Head (CH) which gathers data from all other nodes and directly communicates with Base Station. In [33], the cluster head is selected by taking into account different optimization variables such as distance, delay, and energy used by different nodes. It uses Rider Optimization Algorithm (ROA) to select best cluster head based on best fitness value. In [34], the authors have proposed radial-shaped clustering (RSC) to solve energy and scalability issues in wireless networks. The deployment structure is divided into multiple virtual concentric rings, and each ring is further divided into sectors called clusters. The node closest to the midpoint of each sector is selected as the cluster head. Each sector's data are aggregated and forwarded to the sink node through angular inclination routing. The authors in [35] elaborated that the energy utilization of the network is of importance and has to be optimized. Several factors like residual energy, temperature, the load of Cluster Head (CH), number of alive nodes, and cost function affect the energy consumption of wireless nodes. Hence, they have proposed a hybrid Whale Optimization Algorithm-Moth Flame Optimization (MFO) to select optimal CH, which in turn optimizes the aforementioned factors.
The breadcrumb strategies use existing routing protocols that have already been developed for mobile ad hoc networks; however, this is not a perfect solution. This is because breadcrumbs are battery operated devices. Therefore, there is a drawback of using these existing routing protocols as they consume more power and can drastically reduce the battery life of relay devices. Lifetime of the breadcrumb's battery can be increased and efficiently utilized by designing the network protocol in such a manner that will maintain a shortest multi-hop path between command server and rescue team which guarantees minimum message overhead and maximum delivery ratio. Furthermore, data about the location of first responders is not provided to the command centre by the use of existing breadcrumb schemes. Hence, in post-disaster circumstances, locating the casualties and emergency service members becomes challenging for the command centre.
Therefore, main contribution of this study includes a development of light weight routing protocol for rapidly deployable systems that not only delivers request messages to command server by using novel routing schemes but also incorporates victims’ location coordinates in a request message that will be utilized by command server to calculate total distance towards victim by utilizing Haversine formula [37]. In our previous work [38], RDSP scheme was proposed for pos-disaster management. It reduced the control messages’ overhead to deliver the request messages with a minimum end-to-end delay and an increased message delivery ratio in post disaster situations. The RDSP system, however, handles communication between multiple clients and a single server, but cannot handle multiple servers. Multiple servers may be installed in emergency situations to provide survivors with different types of services, including emergency vehicles, food, transport and first aid services. In addition, the energy needs of relay nodes are not taken into account by the RDSP system, thus depleting the battery of relay nodes faster. Therefore, EA-RDSP is therefore proposed in this work, which reduces the overhead of control messages considering the energy requirements of relay nodes to transmit the request messages with a minimum end-to-end delay, network overhead, energy consumption, and an improved message transmission ratio in post-disaster situations.
3 System Architecture of the EA-RDSP Scheme
In this section, the architecture of EA-RDSP scheme is presented. There are some key elements which are utilized by this scheme so that average waiting times of transmitted victim's information towards server can be minimized. Key elements of our proposed EA-RDSP are given below:
• Client Node: Client nodes are used by rescue team members and victims to establish communication among rescue team members, servers and victims. These nodes are also used for sending feedback about the emergency situation. Client nodes utilize Wi-Fi technology to send victims’ position information to the server nodes by using the relay nodes.
• Relay Node: Relay nodes are the intermediate nodes that are deployed at 100 m distance from each other. It is used for relaying messages transmitted by the client node towards the servers and vice versa. These nodes are connected in a manner that guarantees the shortest path to the server nodes.
• Server Node: Server node controls and manages the whole rescue operation. All the messages transmitted by client nodes are received by server node to alert rescues team members. It also takes care of the feedback sent by the rescue team members.
After the occurrence of the disaster, the whole deployment scenario of the EA-RDSP is shown in Fig. 1. When disaster occurs, deployment of client, relay and server nodes is performed with the help of rescue team members. Firstly, different servers for example, server A, B, and C are installed in incident area to control the whole operation. After this, rescue team members will move forward to deploy relays at the regular interval of 100 m until any casualty is observed. Then, client node which is carried by rescue team member is used to transmit casualty and location information towards the server nodes by multi-hop transmission via relay nodes. This 100 m distance is chosen because relay nodes use Wi-Fi technology that has approximately 100 m transmission range. However this transmission range can be enlarged by the use of some other technologies like WiMax etc. Server nodes manage all the request messages coming from the client nodes and send back acknowledgement messages to client nodes to ensure the reception of request messages.
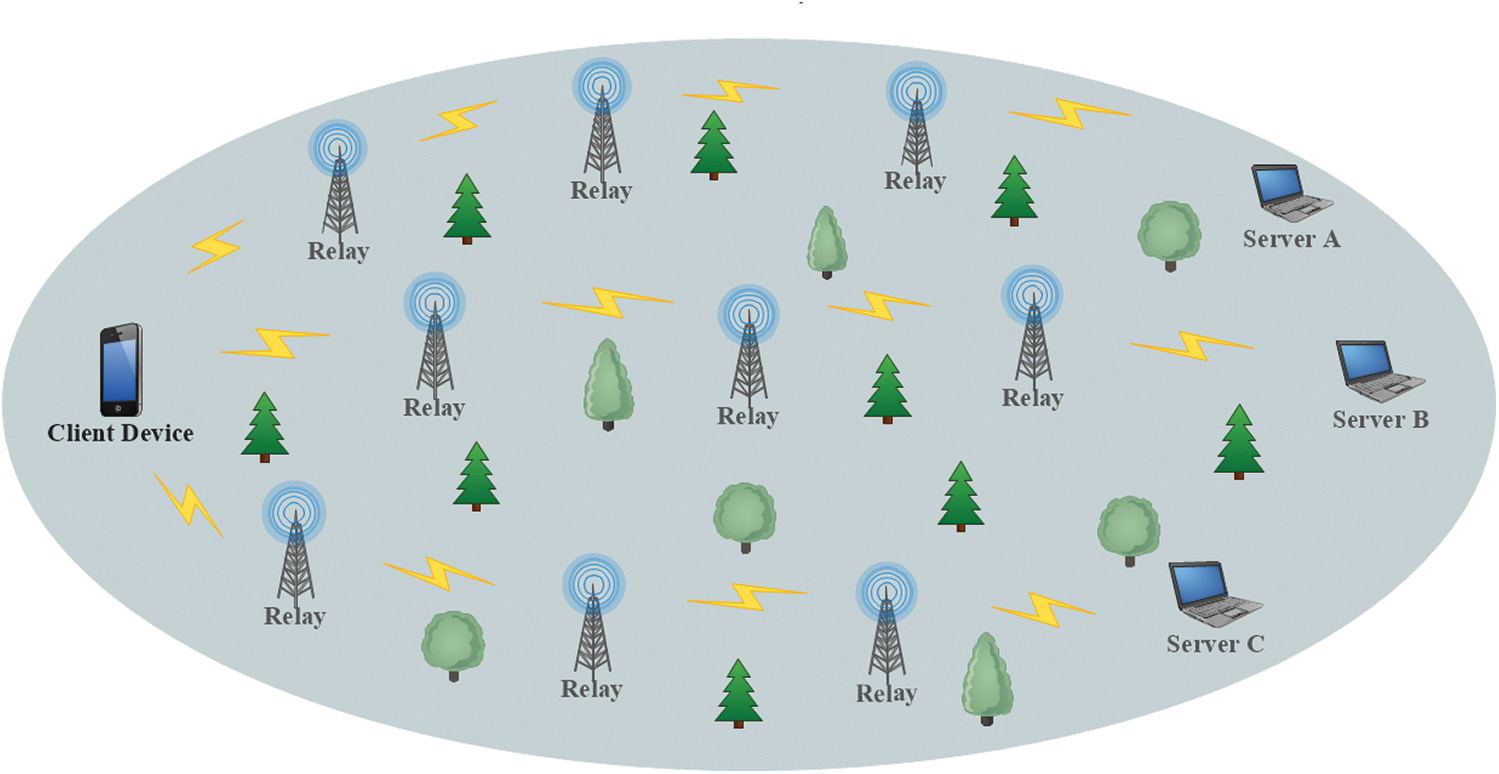
Figure 1: Deployment Scenario of the EA-RDSP Scheme
A flow chart of the server node is presented in Fig. 2. According to the flow chart, after the initialization, the server node waits for the arrival of request messages. If a request message arrives, the server node sends back an acknowledgment message to the client node via relay nodes and generates an alarm message to alert the rescue teams. Server node also finds the distance from the client node by using the Haversine [32] formula given in Eq. (1) where θ is the latitude and
Fig. 3 shows the flow chart of relay node. After initialization, relay node waits for arrival of message. If beacon message arrives, relay node applies the Hop count Assignment (HCA) algorithm (explained later in Section 3.1) to generate its own hop count (HC). Then, the Maximum Neighbor Selection (MNS) algorithm is utilized that selects a neighbor relay having maximum HC (explained later in Section 3.2). However, if the request message (containing desired server information) arrives, the relay node checks neighbor information table for desired server. If the information regarding desired server exits in the neighbor table, then the relay node connects with the minimum HC neighbor (in case multiple neighbor exits) towards desired server because that neighbor would be much closer to desired server (as will be explained later in Section 3.2). However, if an ACK message arrives, relay node selects maximum HC neighbor to transmit ACK message back to client.
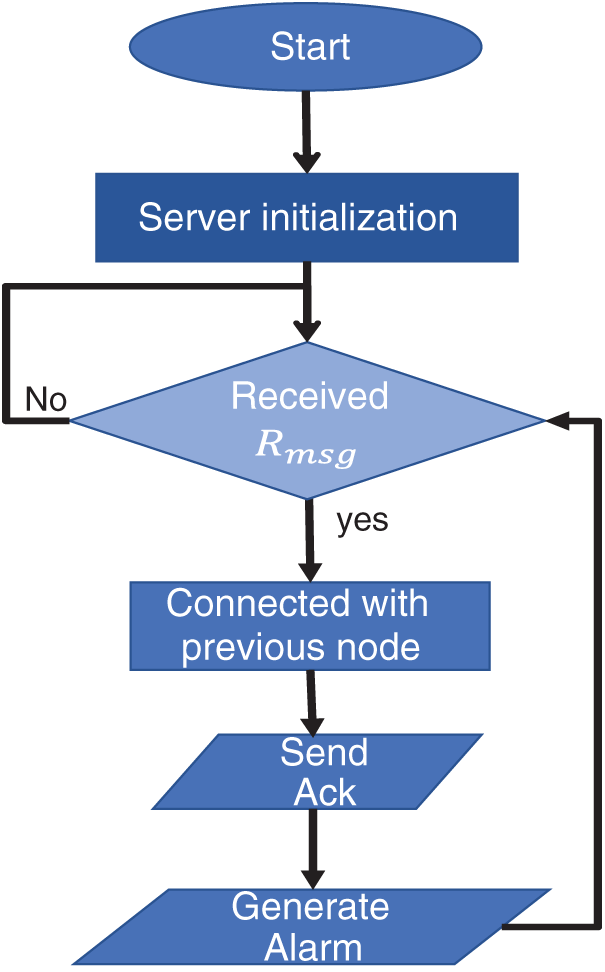
Figure 2: Flow chart of server node
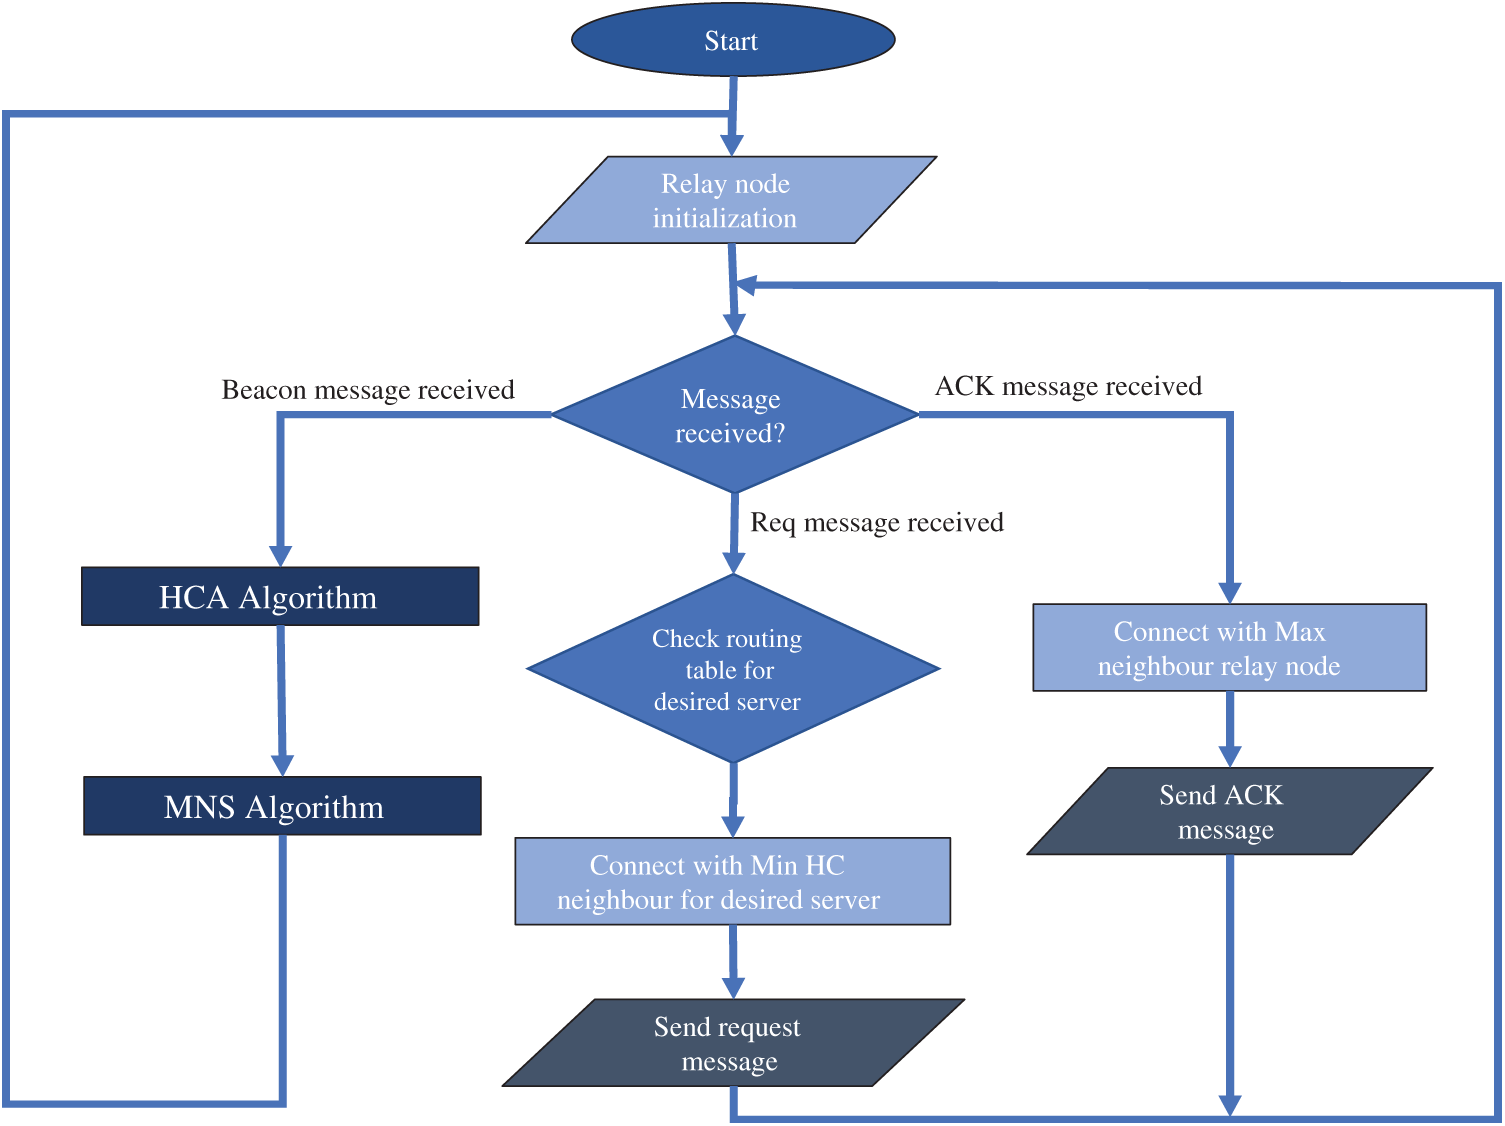
Figure 3: Flow chart of relay node
3.1 Hop Count Assignment (HCA) Algorithm
Fig. 4 displays a sample network topology to illustrate the operation of the HCA algorithm. It contains three server nodes i.e., two A servers and one B server. To provide a common service, the two A servers are deployed while server B provides some other service. In our proposed work, different type of servers would be deployed to accommodate different types of requests coming from the client nodes. For examples, type A server is used to accommodate food related requests whereas type B server can be used to handle ambulance or first aid related requests. In this topology, only single client node is present. Some relay nodes are also deployed i.e., X, Y, Z, I, J, K, L, M, N, O, P, Q and R as shown in Fig. 4.
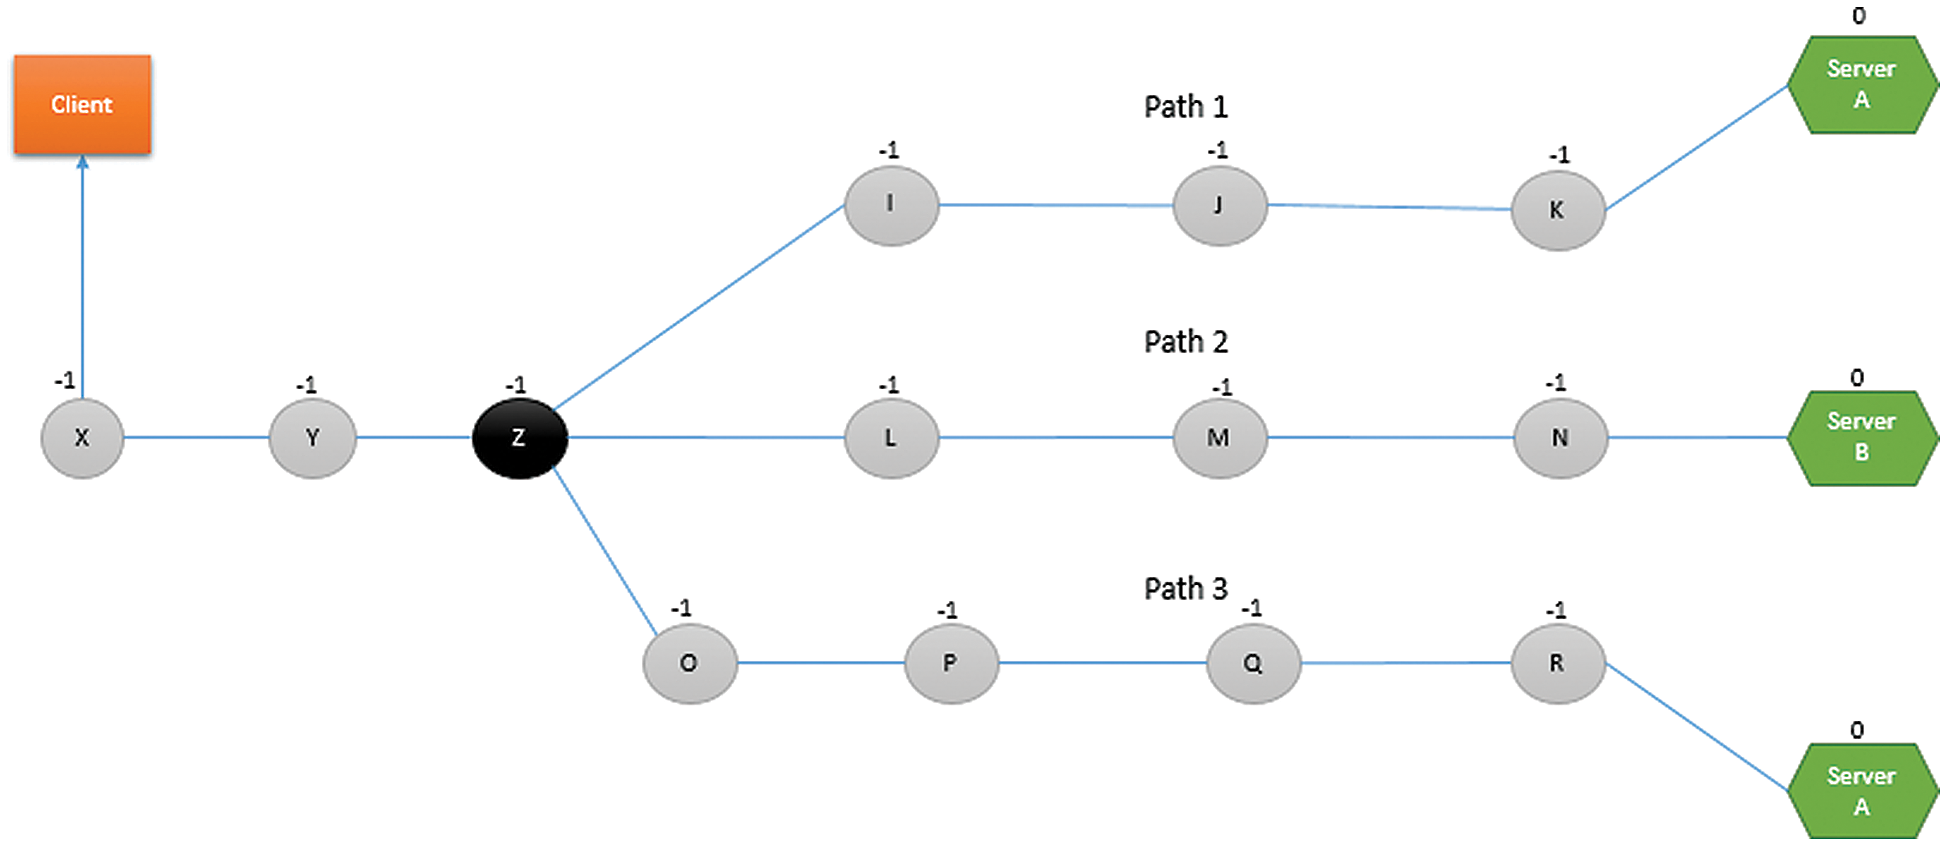
Figure 4: Initial Status of the nodes
HCA algorithm is used by relays to calculate their hop distance from the server. Initially, it is assumed that server has hop count (HC) equal to zero i.e., HC = 0 and all the deployed relay nodes have HC = −1 (where −1 corresponds to unknown information). All the servers and relays will share their HC information with each other via beacon messages. The beacon message contains source ID, destination ID and HC information. According to Fig. 5, the relay node K will receive a beacon message from both the server node A (containing source ID = A, destination ID = A and HC = 0) and relay node J (containing source ID = J, destination ID = −1 and HC = −1). Then, relay K will select the positive minimum hop count, i.e., 0 sent by server node and increments it by 1 to calculate its hop count. Therefore, the hop count of the relay node K becomes 1 i.e., HC = 1. Afterwards, the relay node k will store the beacon information received from the server node in its routing table as follows: Next hop = A, destination ID = A and HC = 1 which indicates that the server A is located at 1-hop distance from node k.
Similarly in the same fashion, according to the Fig. 6, the relay node J will receive beacon message from both the relay node K (containing source ID = K, destination ID = A and HC = 1) and relay node I (containing source ID = I, destination ID = -I and HC = −1). Then, relay J will select the positive minimum hop count, i.e., 1 sent by node K and increments it by 1 to calculate its hop count. Therefore, the hop count of the relay node J becomes 2 i.e., HC = 2. Afterwards, the relay node J will store the beacon information received from the relay node K in its routing table as follows: Next hop = K, destination ID = A and HC = 2.
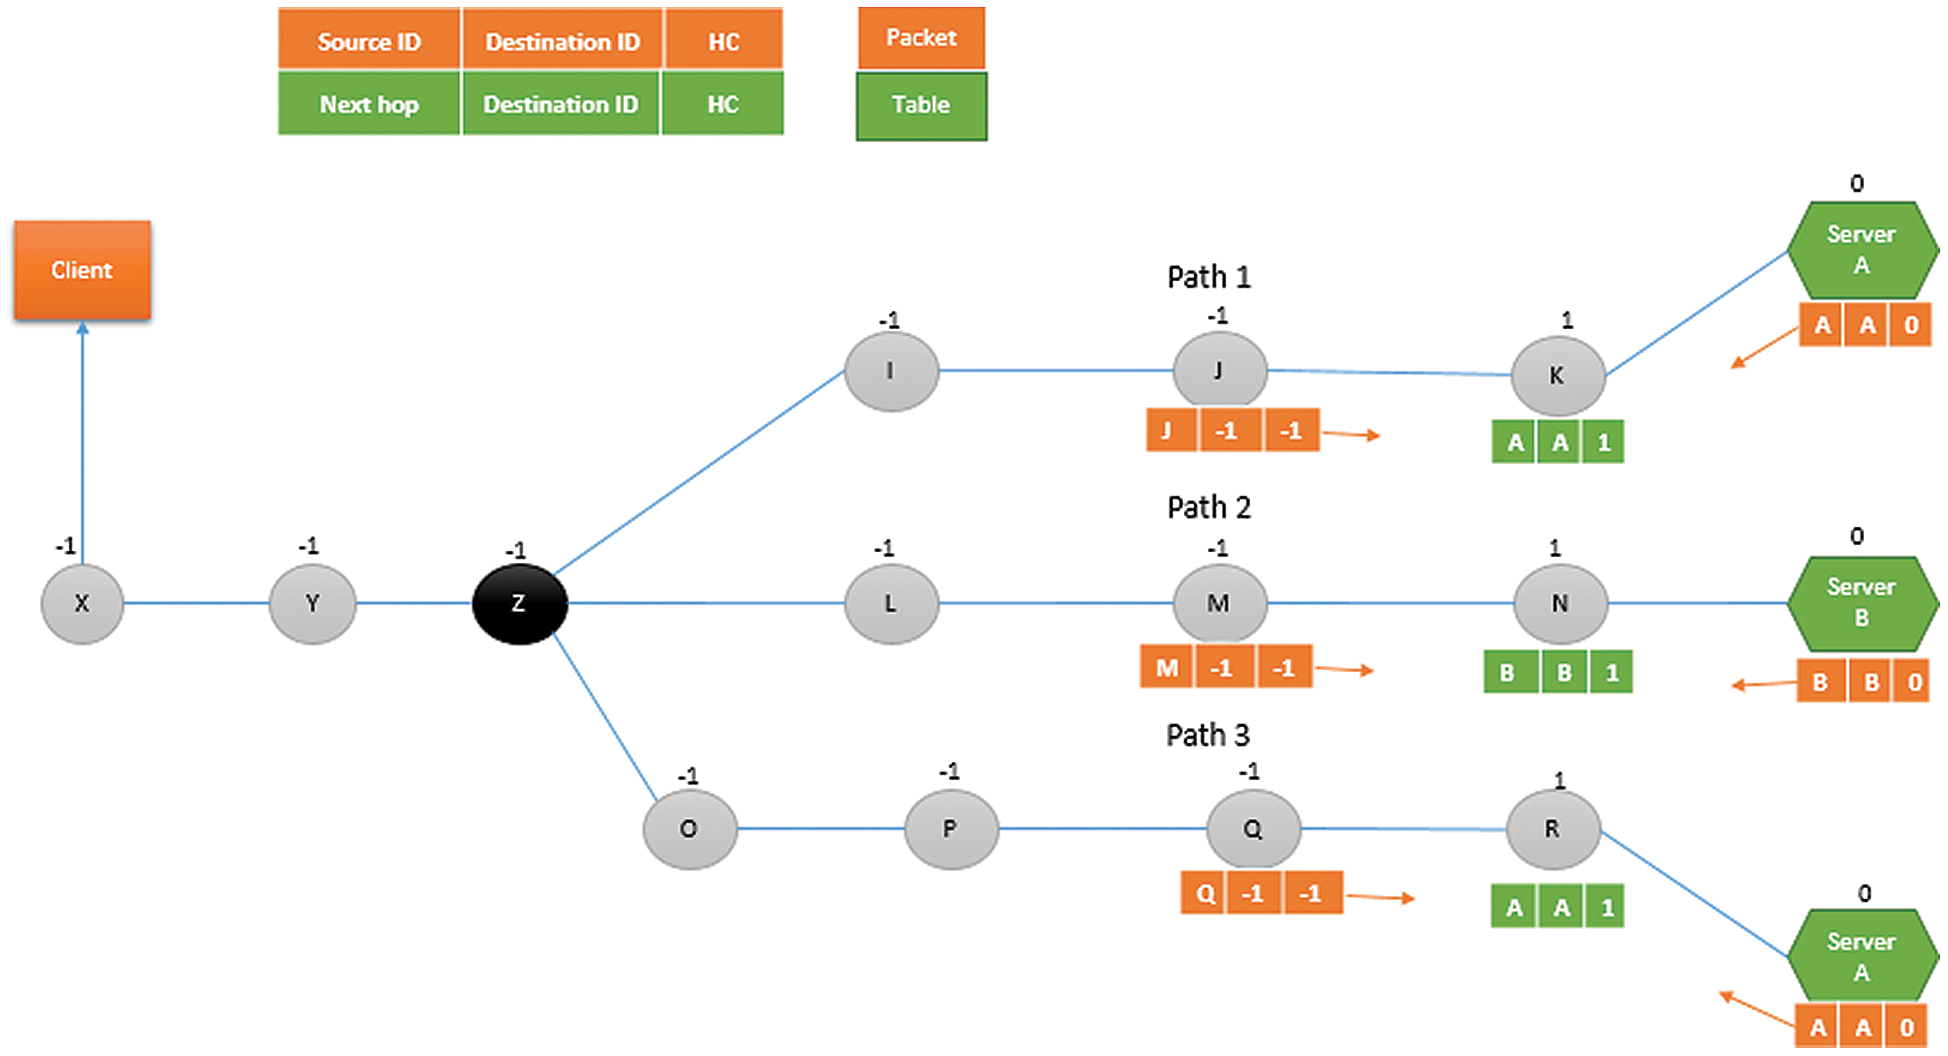
Figure 5: Working of HCA Algorithm
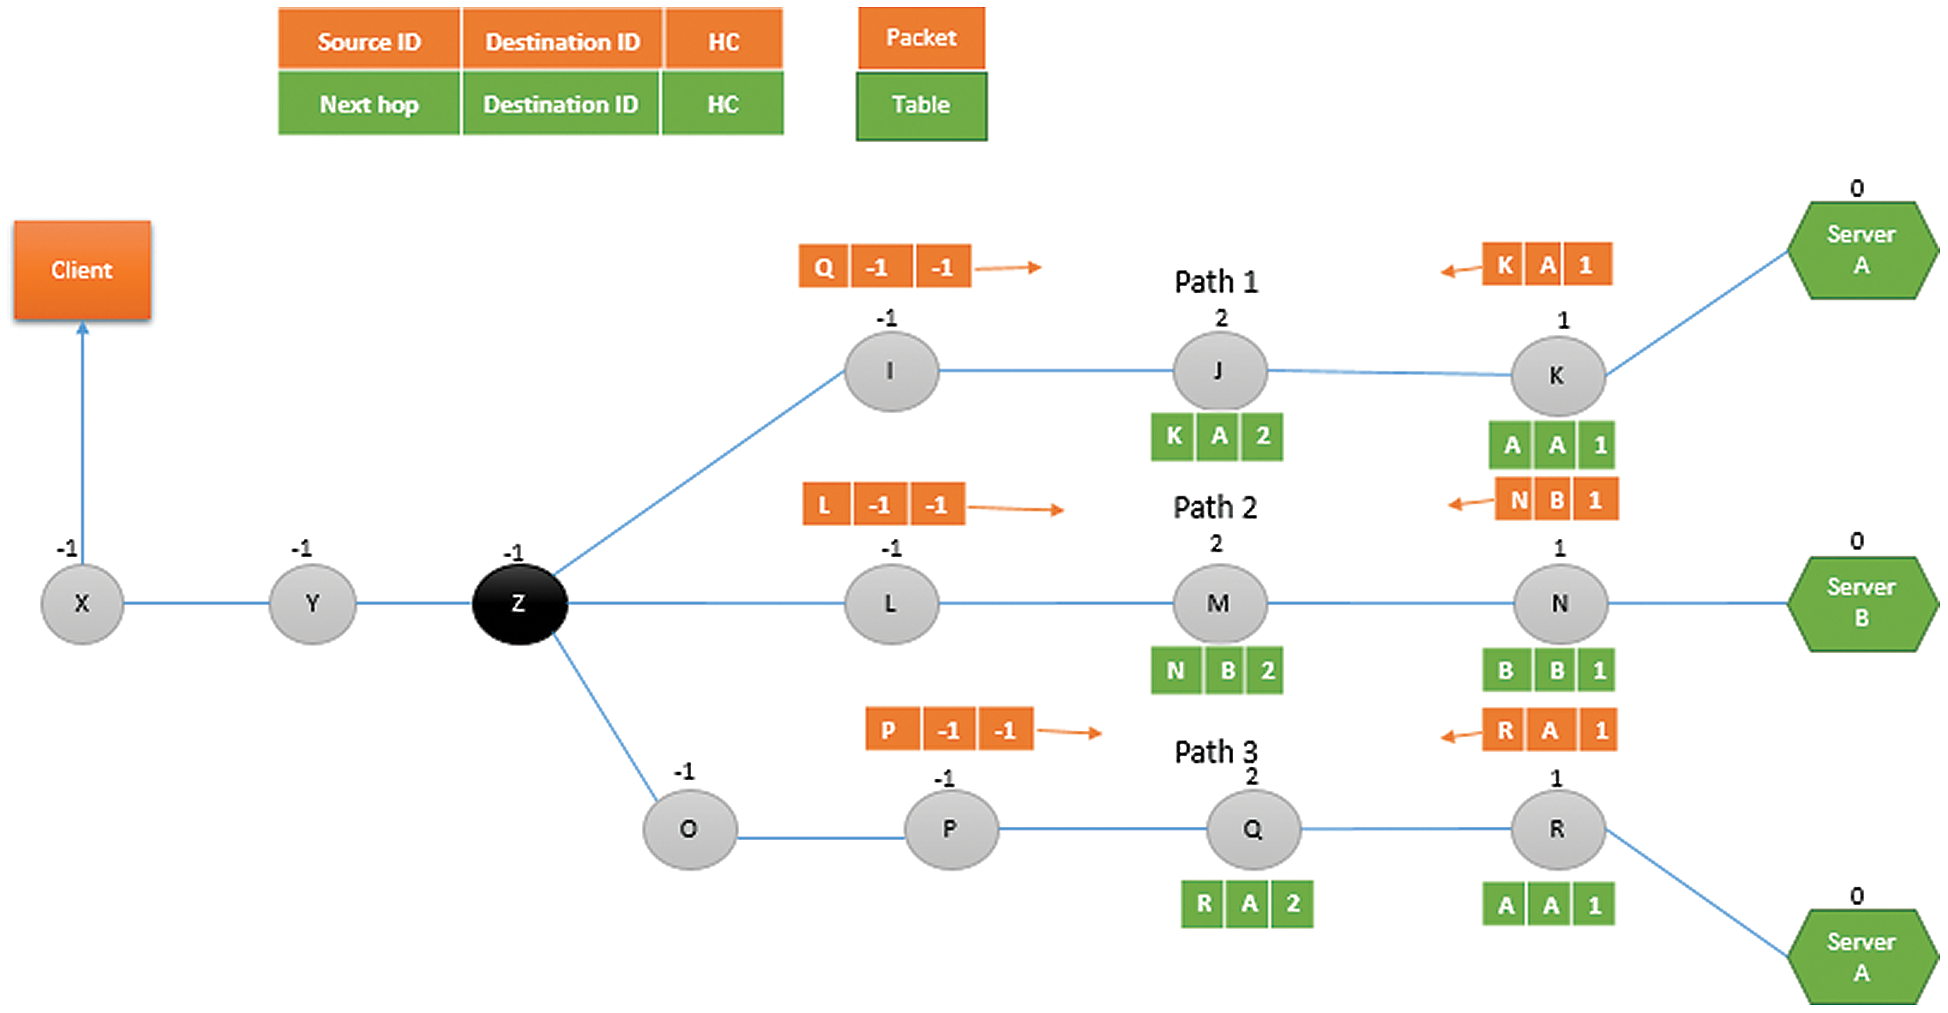
Figure 6: Finding hop counts of relay nodes
Finally, as shown in Fig. 7, the relay node Z will share its complete routing table information with node Y. However, if a node contains multiple paths towards same servers then it will share only a single path having maximum HC information towards a specific server. For example, the routing table of node Z contains multiple paths towards server A, therefore, node Z will only share Z-A-5 (containing maximum HC information towards server A) and will also share Z-B-4 in its beacon message. After receiving beacon message from node Z, node Y will create its routing table. Afterwards, after receiving beacon message from node Y, node X will create its routing table. Eventually, node X will share its information with the client. Now the client can send request message towards server A or B. For example, if a client needs to send request message to server A, then it will forward request message to relay node X. Relay node X will check its routing table and finds out that the next relay node that would forward the message towards server A is relay node Y. Therefore, relay node X will forward it to relay node Y. Similarly, relay node Y will check its routing table and will forward the message towards relay node Z. Afterwards, relay node Z checks its routing table and finds out that two paths exits towards server A i.e., through relay node I having HC = 4 and relay node O having HC = 5. Therefore, relay node Z selects minimum HC neighbor relay node I to forward the message towards server A. If a node Z receives a request message for server A and both the paths towards server A are having same hop count, then in that case there are two possible scenarios. First, node Z can select the first minimum hop count path from internal table. However, the drawback of such approach is that only that particular path is always chosen for the transmission of request message and the second path having same hop distance is ignored. In the second case, if node Z chooses one of two available paths at random, both paths are more likely to be chosen equally. As a result, our proposed EA-RDSP uses the second method and selects available paths at random. Similarly, the remaining relay nodes (I, J, K) will check their routing tables and forward the message until it is received by server A.
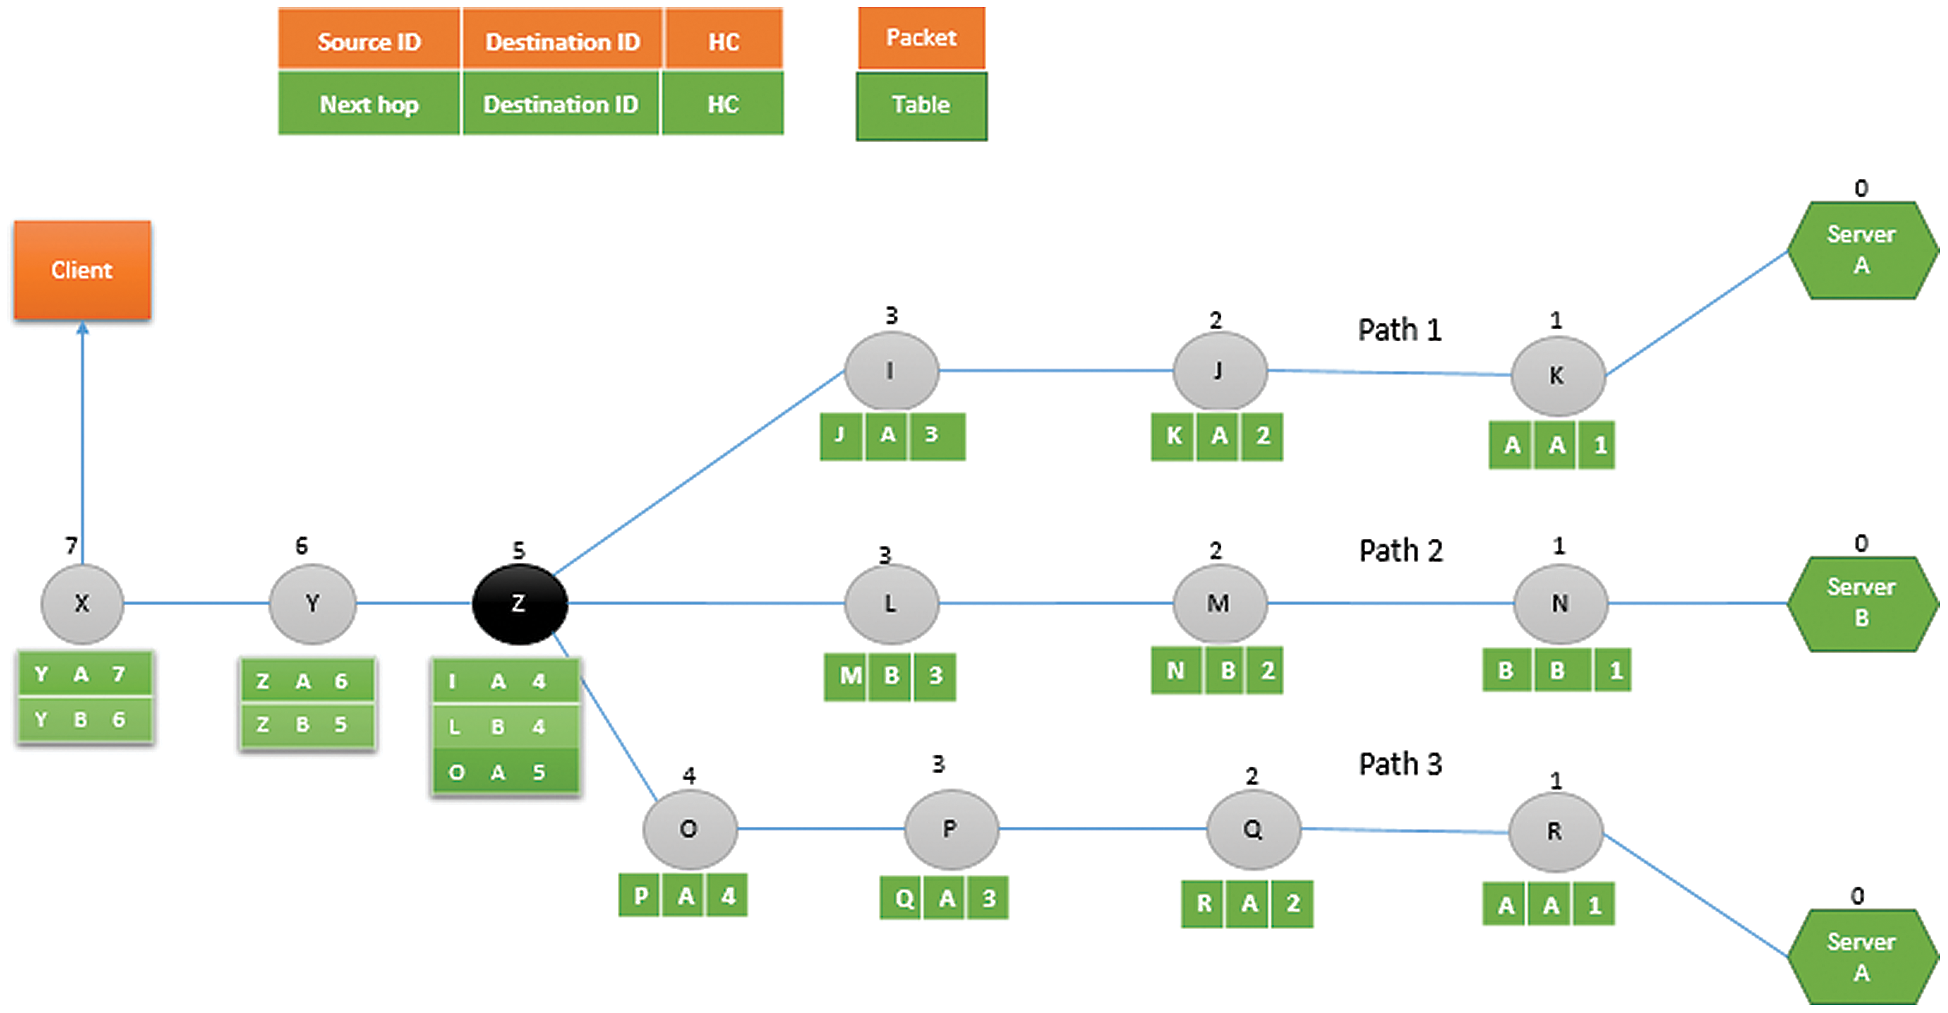
Figure 7: Relay nodes find their hop count
3.2 Maximum Neighbor Selection (MNS) Algorithm
Fig. 8 illustrates the working of MNS algorithm. According to Fig. 8, the relay node K will receive beacon messages both from the server node A (containing source ID = A, HC = 0) and relay node J (containing source ID = J, HC = 2). After applying MNS algorithm, relay K will select source ID = J as a maximum hop count neighbor. Similarly, the relay node J will receive beacon messages both from the node K (containing source ID = K, HC = 1) and relay node I (containing source ID = I, HC = 3). After applying MNS algorithm, relay J will select source ID = I as a maximum hop count neighbor. In a same fashion, all the relay nodes will select their maximum hop count neighbors as shown in Fig. 8.
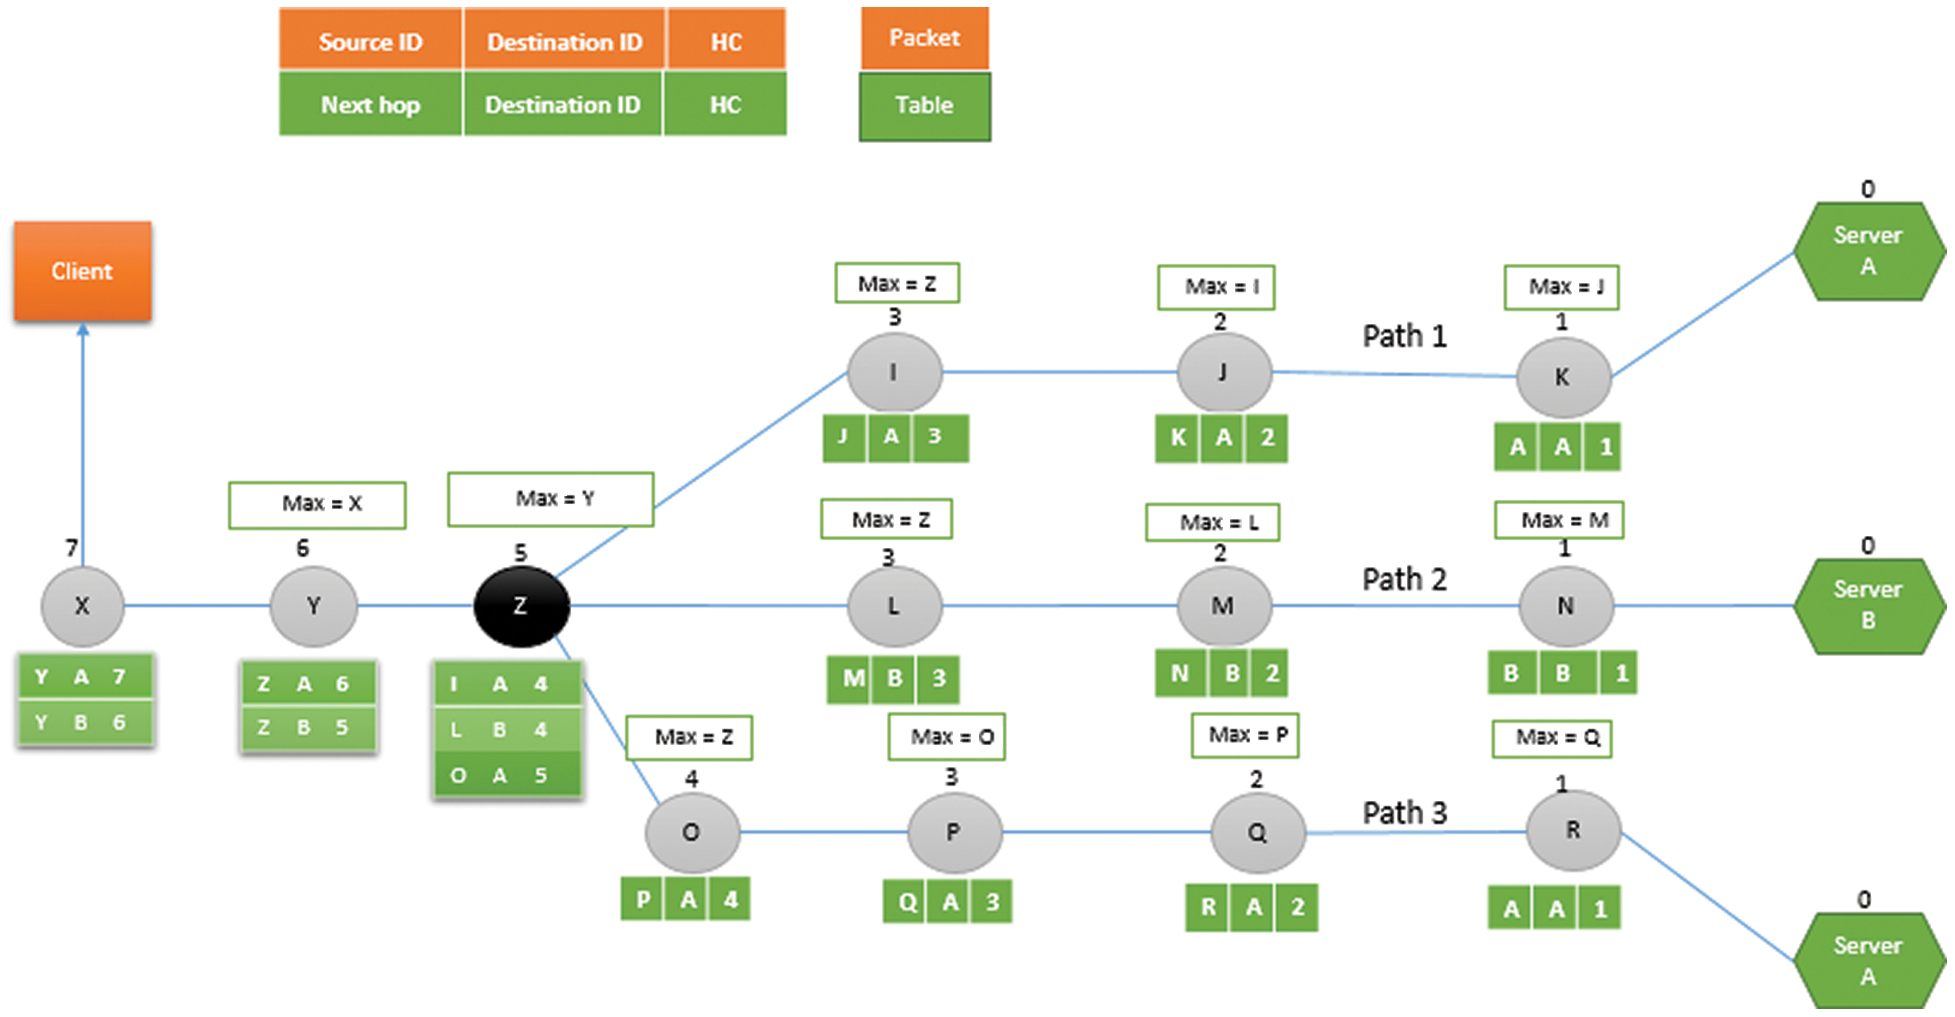
Figure 8: Relay nodes selecting maximum hop count neighbour
This section compares the performance of the proposed EA-RDSP scheme with that of the UF scheme [29] by deploying different numbers of nodes within NS-2 simulation tool.
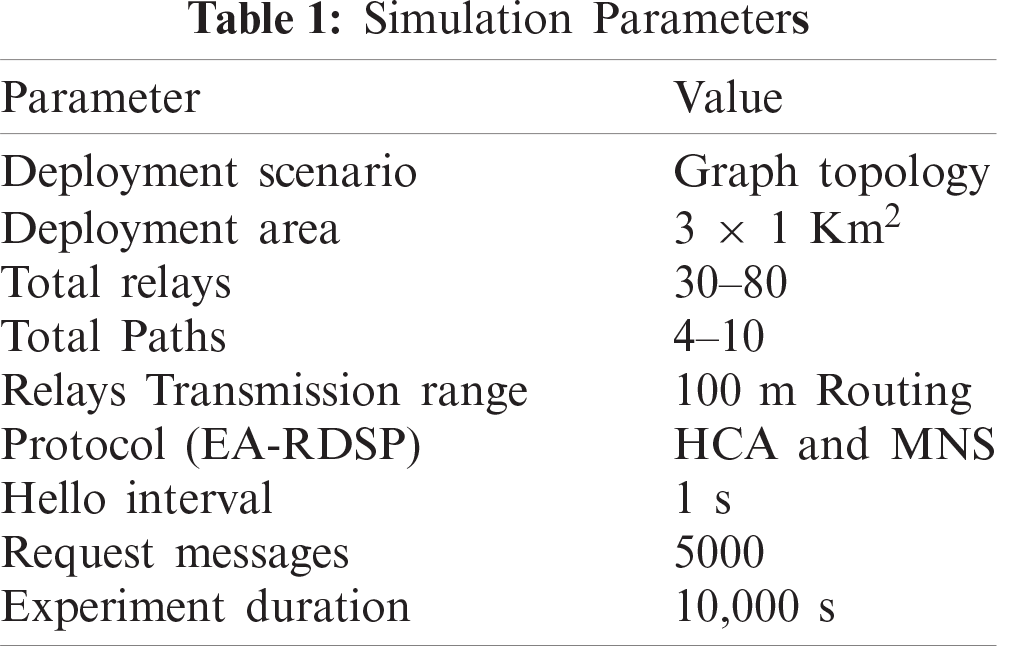
The proposed EA-RDSP scheme is implemented using NS-2 simulation tool. For simulation purpose, a graph topology having the total area of 3 × 1 Km² is selected. Around 30 to 80 nodes are deployed and 4 to 10 paths are created with in deployment area. A deployment scenario of 30 nodes along with three source nodes S1, S2, S3 and three destination nodes D1, D2 and D3 is shown in Fig. 9. In this figure, node 0, node 4 and node 10 are designated as D1, D2 and D3 respectively whereas; node 22, node 26 and node 29 are designated as S1, S2 and S3 respectively. Similarly, three source nodes S1, S2 and S3 and three destination nodes D1, D2 and D3 are selected in the graph topology of 40, 50, 60, 70 and 80 nodes. A transmission range of 100 meters is selected for each relay node that is equivalent to WiFi [39–42] standard. To find shortest possible routes between client and server nodes, the proposed EA-RDSP scheme utilized HCA and MNS algorithms. A hello interval of 1 s is selected. Five thousands request messages are generated by the client node to test the routing protocol in highly loaded environment in terms of request messages. The experiment duration was set at 10,000 s. The results presented for each graph topology are averaged over 5 repeated experiments The Simulation parameters are summarized in Tab. 1.
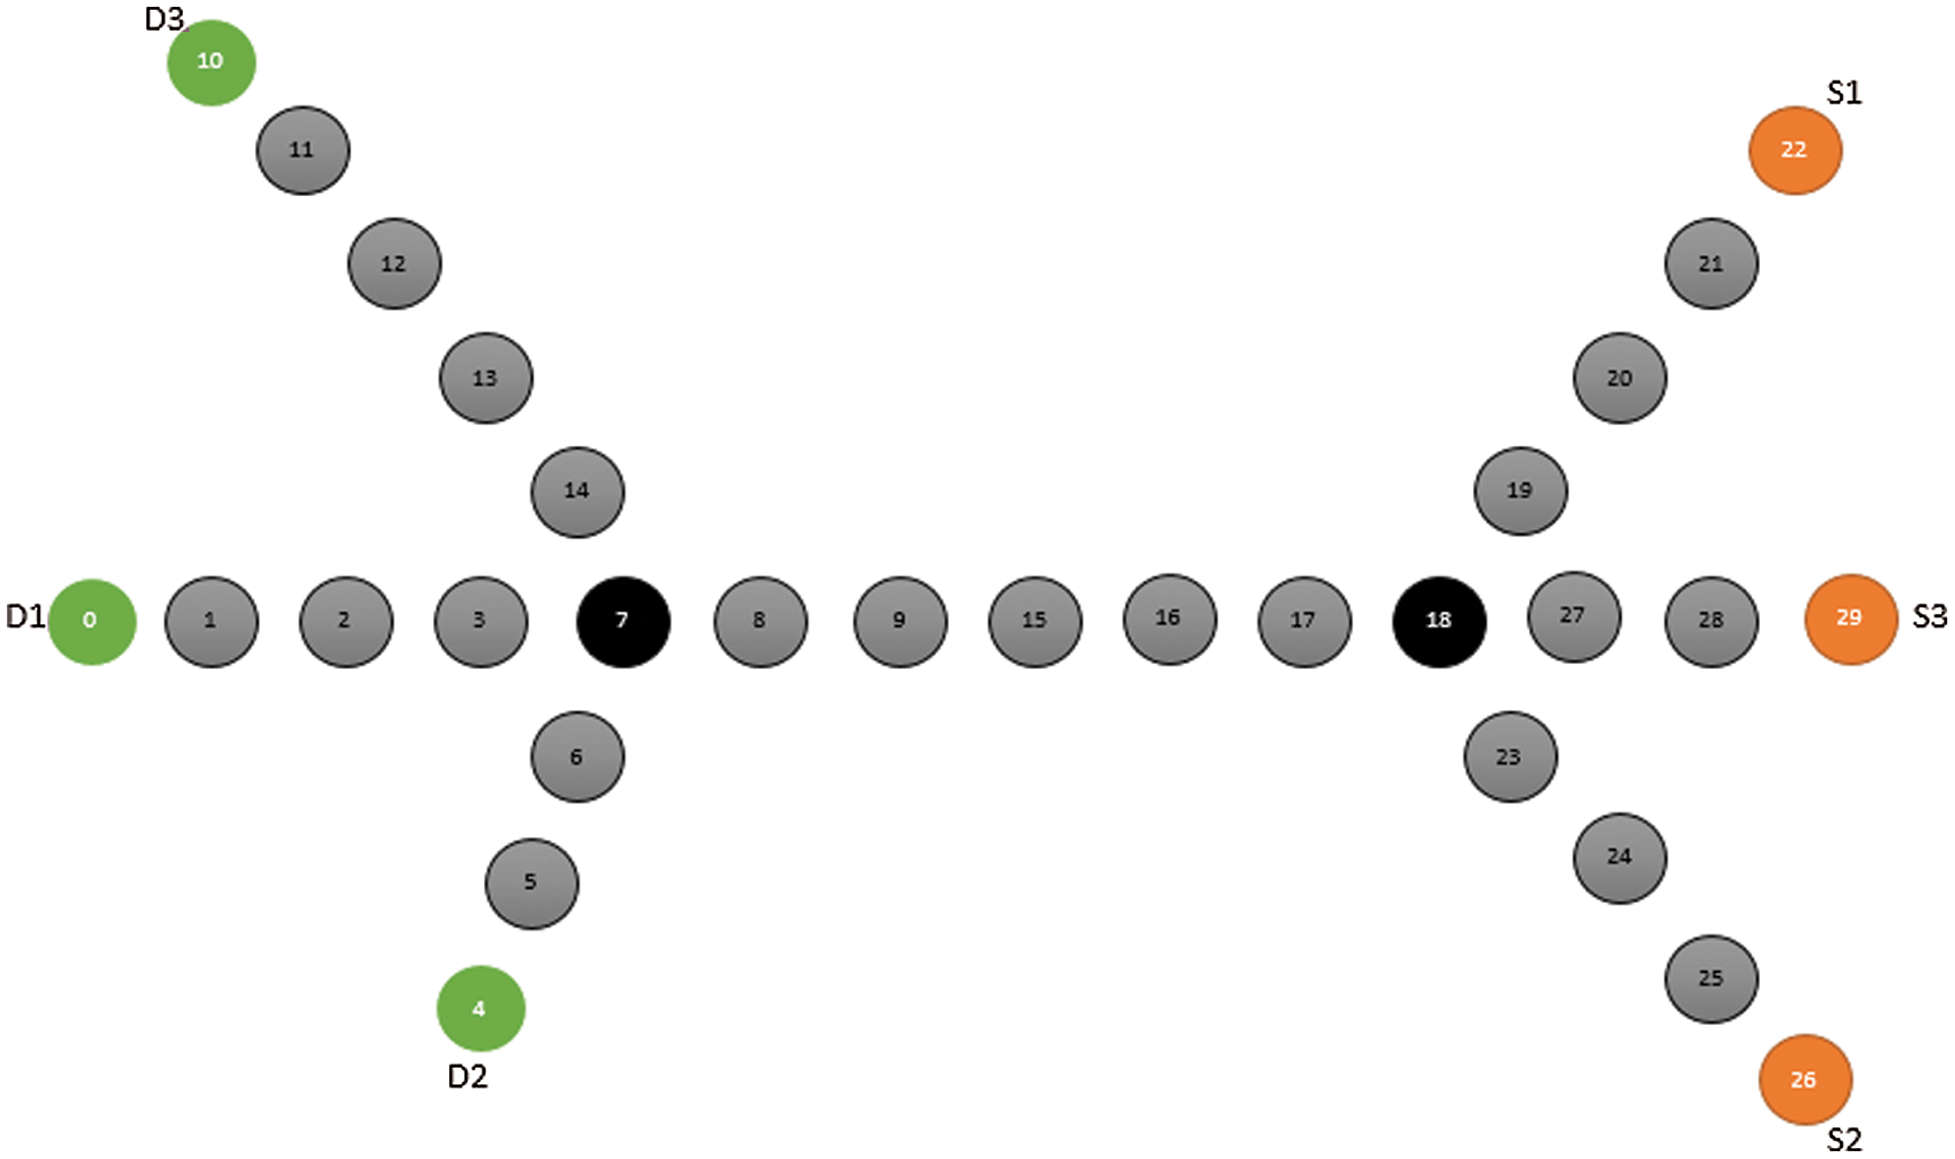
Figure 9: Graph topology of 30 nodes
The following metrics are used to compare the performance of the proposed EA-RDSP scheme with that of UF scheme.
• End-to-end delay: refers to average time it takes for a request message sent from client node to reach server node as given in Eq. (2).
• Message delivery ratio: refers to percentage of messages successfully received by server node. It is calculated as the ratio of the number of request messages received by server node over total number of request messages sent by the client node as given in Eq. (3).
• Network overhead: refers to the size of hello messages sent by relay nodes in different nodes densities.
• Total energy consumption: refers to the total energy consumed by relay nodes in different node densities.
• Distance covered: refers to average distance covered by request message between client node and server node.
Fig. 10 compares average end-to-end delay of EA-RDSP and UF scheme from source-1 to destination-1 (S1-D1) based on different number of node densities. The nodes density and average end-to-end delay are taken along x-axis and y-axis respectively. Both protocols show that the average end-to-end delay increases as the number of nodes increased across the path between S1-D1. To elaborate, in proposed EA-RDSP scheme, the end-to-end delay (78 ms) for 30 nodes is smaller than that of 40 nodes (99 ms). Likewise, the end-to-end delay for 40 nodes (99 ms) is smaller than that of 50 nodes (112 ms). This is because, when the number of relay nodes increases across a particular path, the processing and transmission time of messages also increases but more intermediate relays offer long-distance coverage benefit. Compared to UF scheme, the proposed EA-RDSP scheme achieved around 31.54% lower end-to-end delays for all node densities. However, the differences in the average end-to-end delay between the two protocols were higher with a heavy nodes density than with a light node density. This was because UF experienced more beacon collisions as the nodes density increased, in contrast to EA-RDSP. This is due to the fact that UF scheme is based on a DSDV protocol that requires all the relays to periodically exchange hello messages and entire routing tables, which leads to frequent contention and collisions among neighboring relays. In such cases, the relays must wait for a busy channel to become idle before performing any transmission. On the other hand, the EA-RDSP system avoids the formation and exchange of long routing tables. Each node only shares with the neighbor relays the information of its hop count towards a specific server. However, if a node is present at intersection of two paths, then it shares the information of its hop count from both servers. Therefore, sharing minor information with neighbor relays eventually reduces collisions among neighboring relays and causes a decrease in the end-to-end delay.
Fig. 11 compares average end-to-end delay for EA-RDSP and UF scheme from source-2 to destination-2 (S2-D2). Both protocols show that the average end-to-end delay increases as the number of nodes increased across the path between S2-D2. To elaborate, the end-to-end delay (83 ms) for 30 nodes is smaller than that of 40 nodes (101 ms). Likewise, the end-to-end delay (101 ms) for 40 nodes is smaller than that of 50 nodes (119 ms). This is because, when the number of relay nodes increases across a particular path, the processing and transmission time of messages also increases but more intermediate relays offer long-distance coverage benefit. Compared to UF scheme, the proposed EA-RDSP scheme achieved around 30.9% lower end-to-end delays for all node densities.
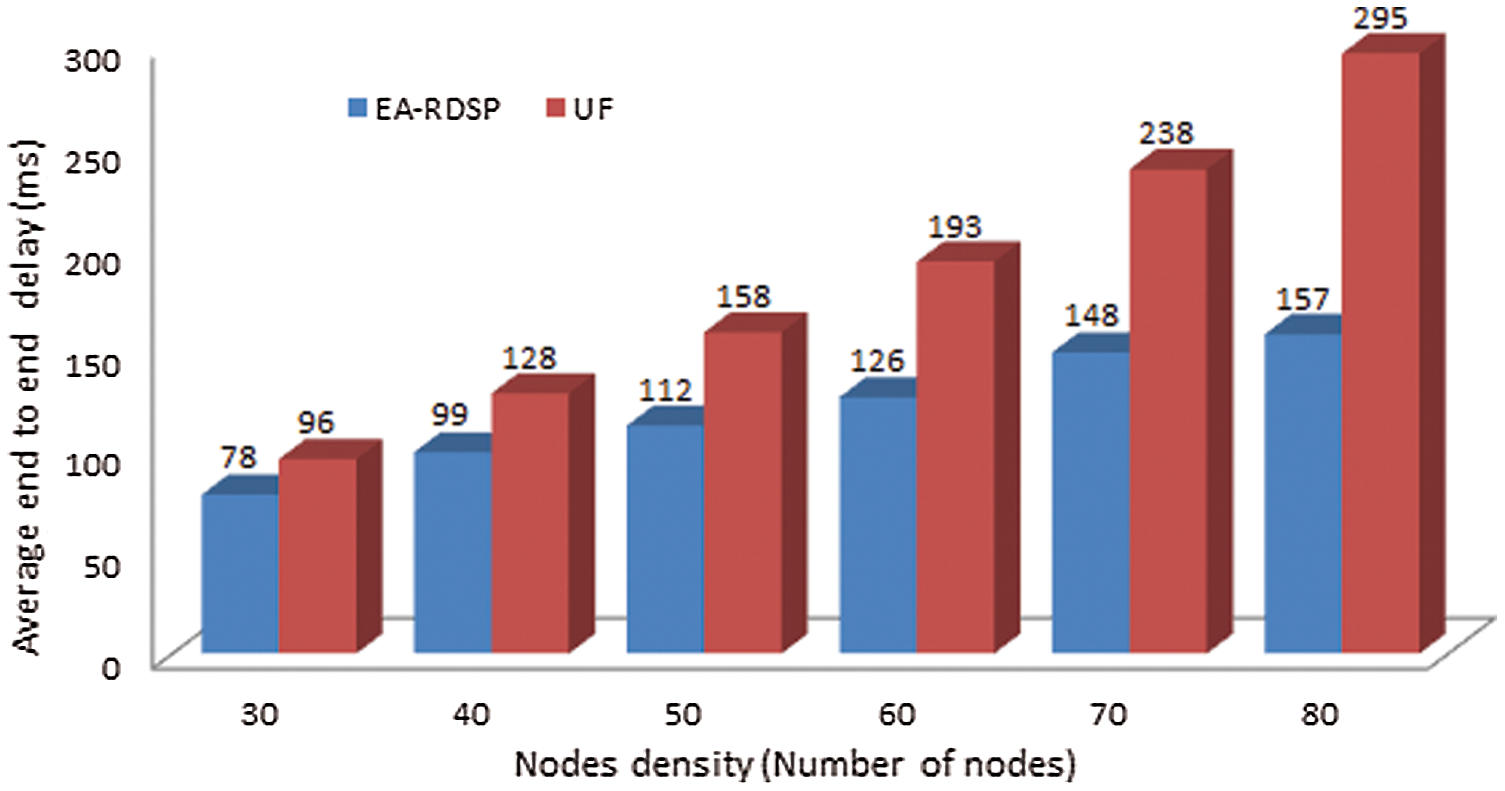
Figure 10: Comparison of average end-to-end delay from S1-D1
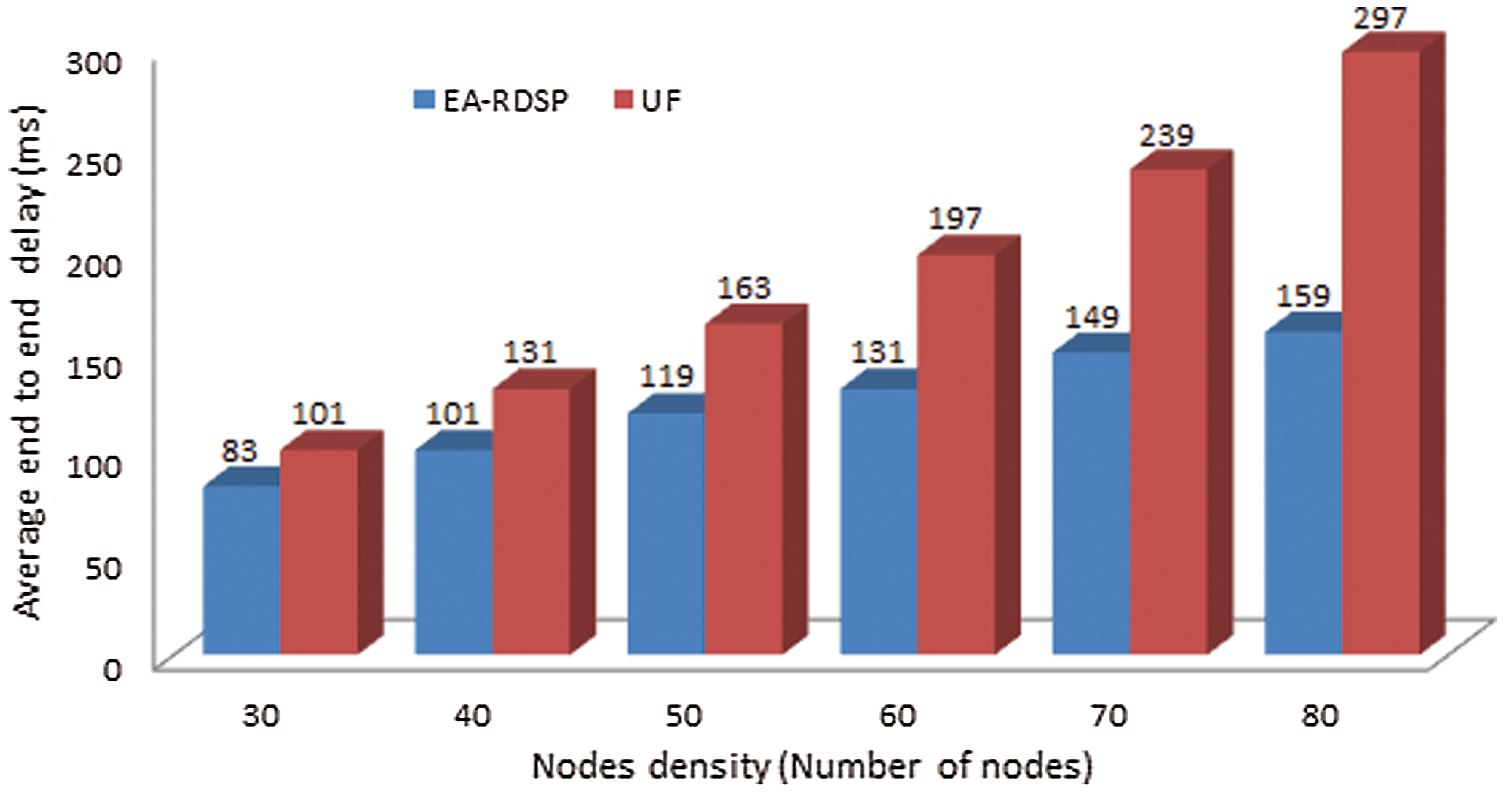
Figure 11: Comparison of average end-to-end delay from S2-D2
Fig. 12 compares average end-to-end delay for EA-RDSP and UF scheme from source-3 to destination-3 (S3-D3). Both protocols show that the average end-to-end delay increases as the number of nodes increased across the path between S3-D3. To elaborate, the end-to-end delay (70 ms) for 30 nodes is smaller than that of 40 nodes (75 ms). Likewise, the end-to-end delay (75 ms) for 40 nodes is smaller than that of 50 nodes (94 ms). This is because, when the number of relay nodes increases across a particular path, the processing and transmission time of messages also increases but more intermediate relays offer long-distance coverage benefit. Compared to UF scheme, the proposed EA-RDSP scheme achieved around 35% lower end-to-end delays for all node densities.
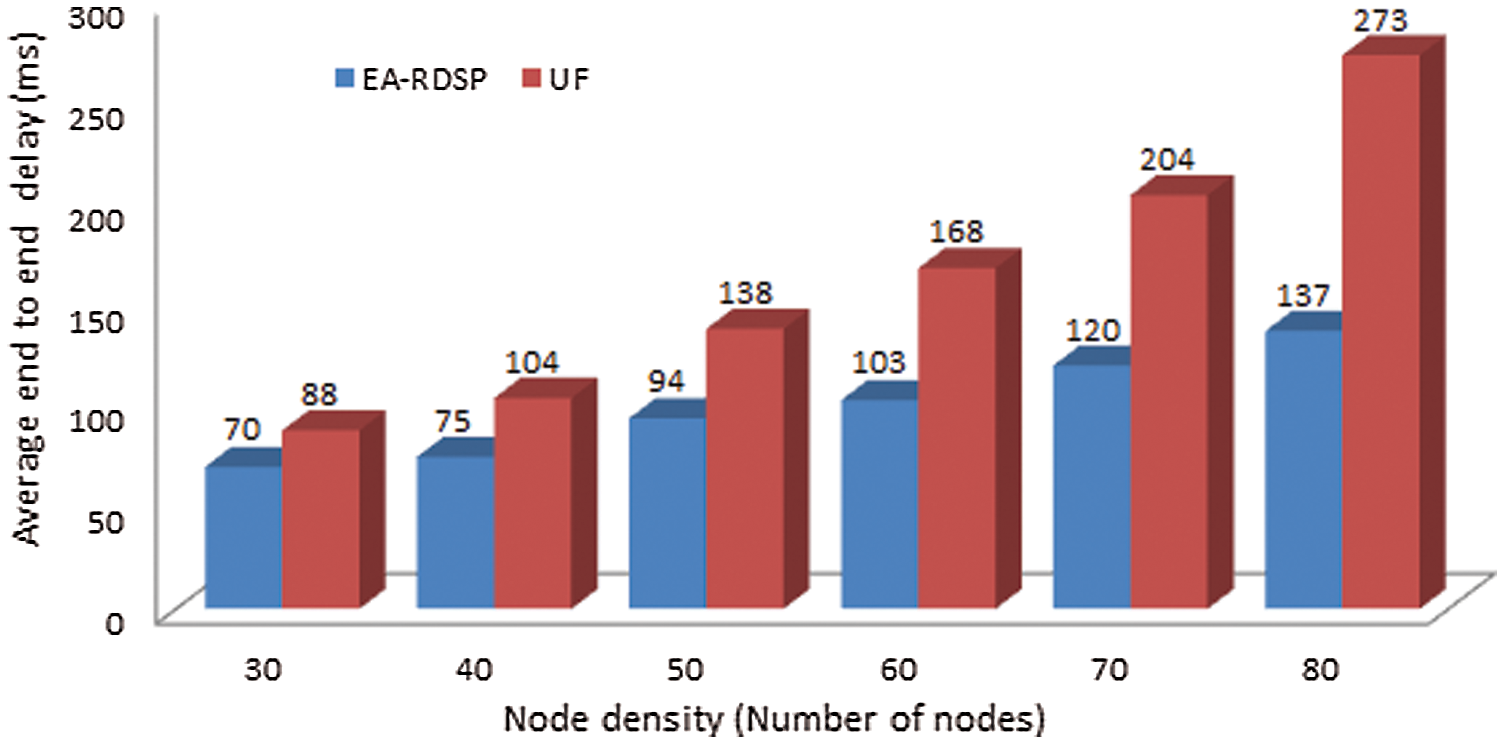
Figure 12: Comparison of average end-to-end delay from S3-D3
Fig. 13 compares message delivery ratio for EA-RDSP and UF scheme from source-1 to destination-1 (S1-D1) based on node density. The figure shows that the message delivery ratio for both systems decreases as the number of relays increased across the path. To elaborate, in EA-RDSP scheme, the packet delivery ratio for 30 nodes (100%) is greater than that of 40 nodes (98%). Similarly, the packet delivery ratio of 40 nodes (98%) is greater than that of 50 nodes (96%). Likewise, the packet delivery ratio of 50 nodes (96%) is greater than that of remaining nodes densities (60, 70 and 80). This was because when the number of relay nodes increases across a particular path, the frequent contention and collisions of messages among neighboring relay nodes also increases which eventually reduces packet delivery ratio. However, EA-RDSP system achieved around 8.73% higher message delivery ratio than UF scheme across all the nodes densities particularly at high node densities because it avoids exchange of long routing tables thus reduces collisions among neighboring relays and hence achieves higher message delivery ratio.
Fig. 14 shows that the message delivery ratio for both systems decreases as the number of relays increased across the path. To elaborate, in EA-RDSP scheme, the packet delivery ratio for 30 nodes (98%) is greater than that of 40 nodes (97%). Similarly, the packet delivery ratio of 40 nodes (97%) is greater than that of 50 nodes (94%). Likewise, the packet delivery ratio of 50 nodes (94%) is greater than that of remaining nodes densities (60, 70 and 80). This was because when the number of relay nodes increases across a particular path, the frequent contention and collisions of messages among neighboring relay nodes also increases which eventually reduces packet delivery ratio. However, EA-RDSP system achieved around 7.21% higher message delivery ratio than UF scheme across all the nodes densities particularly at high node densities.
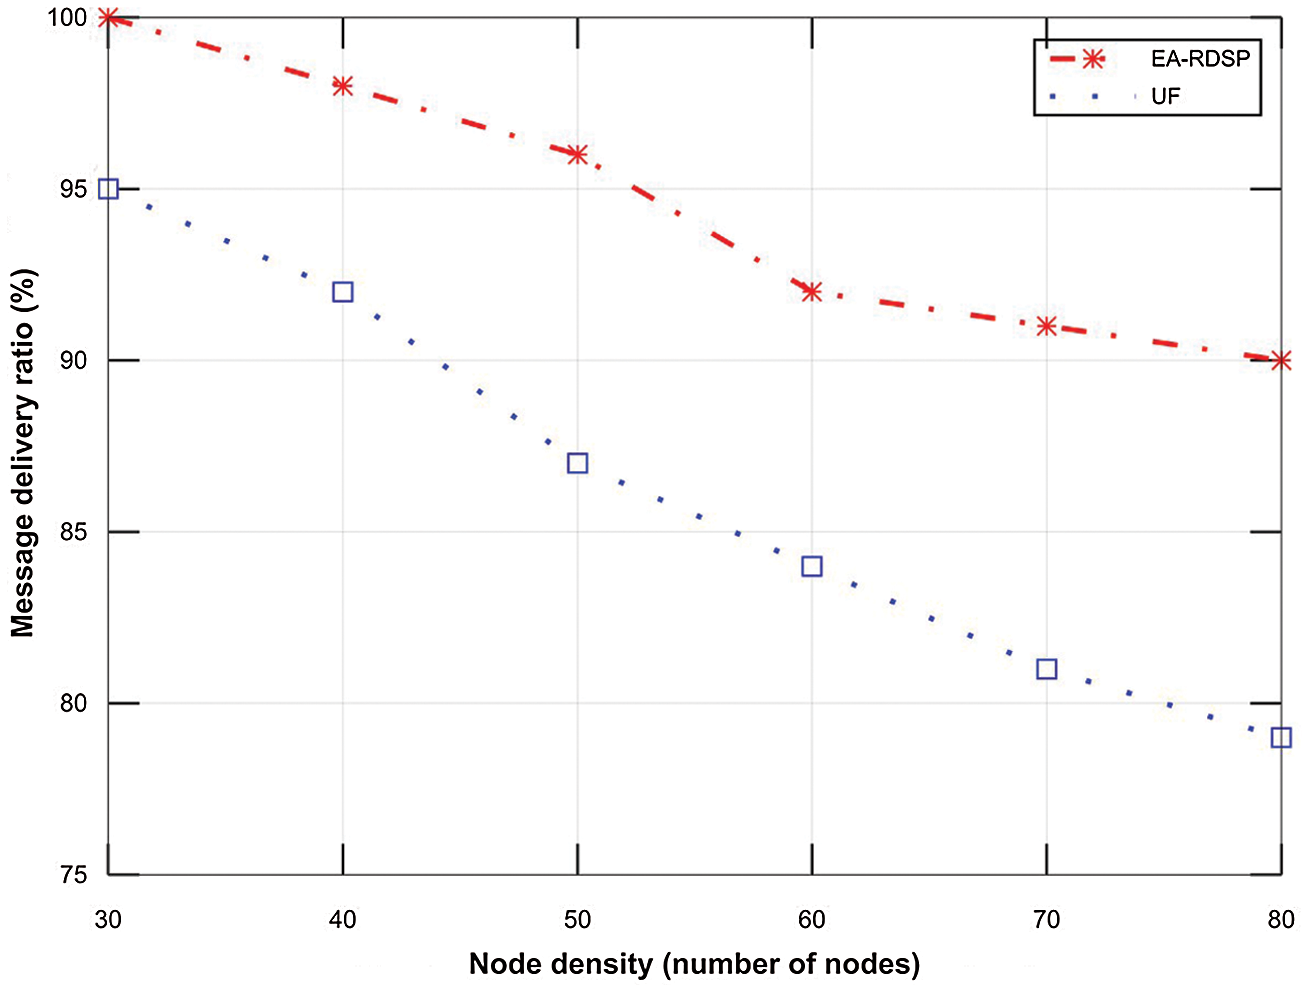
Figure 13: Comparison of the message delivery ratio from S1-D1
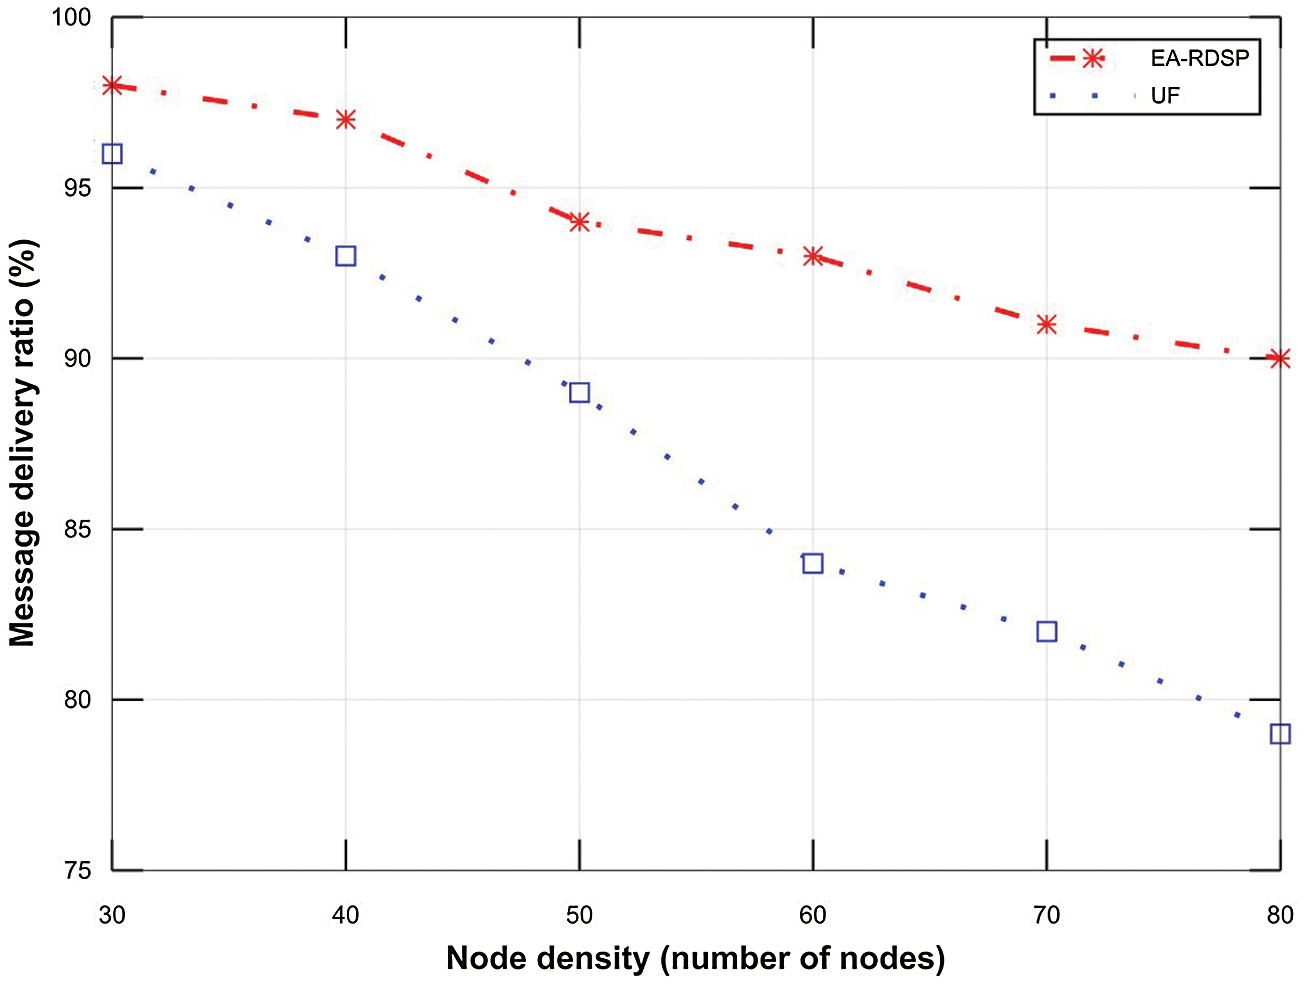
Figure 14: Comparison of the message delivery ratio from S2-D2
Fig. 15 compares message delivery ratio for EA-RDSP and UF scheme from source-3 to destination-3 (S3-D3) based on node density. The figure shows that the message delivery ratio for both systems decreases as the number of relays increased across the path. To elaborate, in EA-RDSP scheme, the packet delivery ratio for 30 nodes (99%) is greater than that of 40 nodes (98%). Similarly, the packet delivery ratio of 40 nodes (98%) is greater than that of 50 nodes (96%). Likewise, the packet delivery ratio of 50 nodes (96%) is greater than that of remaining nodes densities (60, 70 and 80). This was because when the number of relay nodes increases across a particular path, the frequent contention and collisions of messages among neighboring relay nodes also increases which eventually reduces packet delivery ratio. However, EA-RDSP system achieved around 5.43% higher message delivery ratio than UF scheme across all the nodes densities particularly at high node densities.
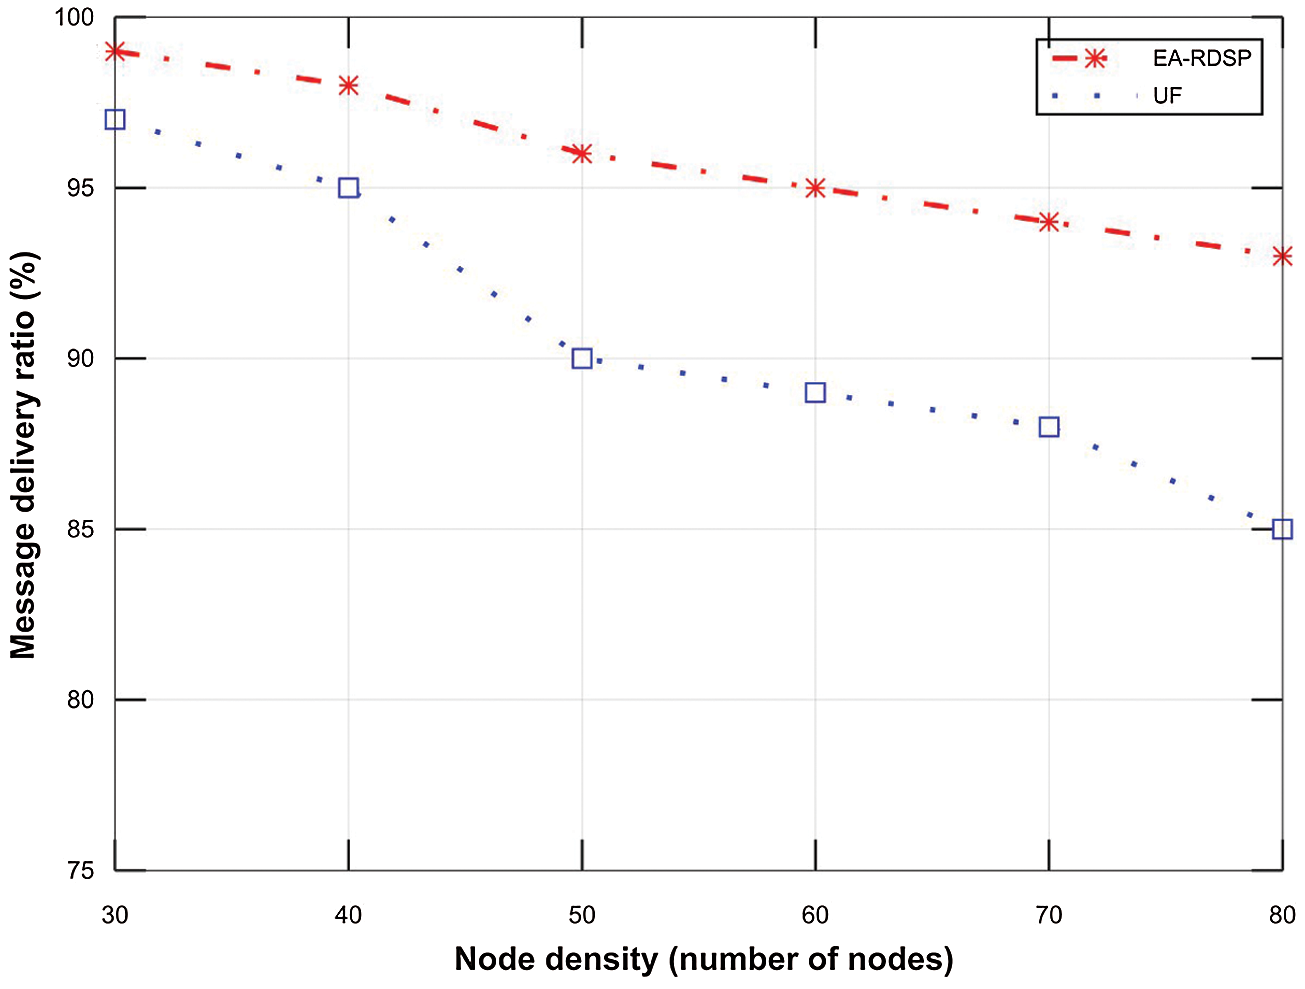
Figure 15: Comparison of the message delivery ratio from S3-D3
A comparison of network overhead for EA-RDSP and UF schemes is shown in Fig. 16. It shows that the size of hello message in UF scheme increases exponentially. This is because in UF scheme, each node periodically exchange entire routing table to maintain the whole network information at each relay node. To elaborate, each relay node contains routing information to reach any other relay node in the whole network. Therefore, when the number of nodes increases, the size of hello message containing the whole routing table information also increases. In contrast, the EA-RDSP system, the size of the hello message changes slightly due to the absence of exchange of whole routing tables. In EA-RDSP scheme, each node only maintains the information of its hop count distance towards a specific server and does not contain any information to reach any relay node in a network.
The total energy consumed in different node densities is illustrated in Fig. 17. It is evident from the figure that energy consumption increases with the increase in number of relay nodes in the network. However the energy consumption in case of proposed EA-RDSP scheme increased linearly in contrast to the UF scheme which is increasing exponentially with the increase in node density. The reason for large energy consumption in UF scheme is that as illustrated in Fig. 16, the size of hello message in UF scheme is increasing exponentially due to the exchange of entire routing information among neighbor relays. As a result, with the increase in hello message size, more energy is consumed for the transmission of large messages which in turn increases the total energy consumption of all the nodes in the network. However in proposed EA-RDSP scheme, the size of the hello message does not increase exponentially with the increase in number of relay nodes in the network. Therefore, it results in linear energy consumption for different node densities.
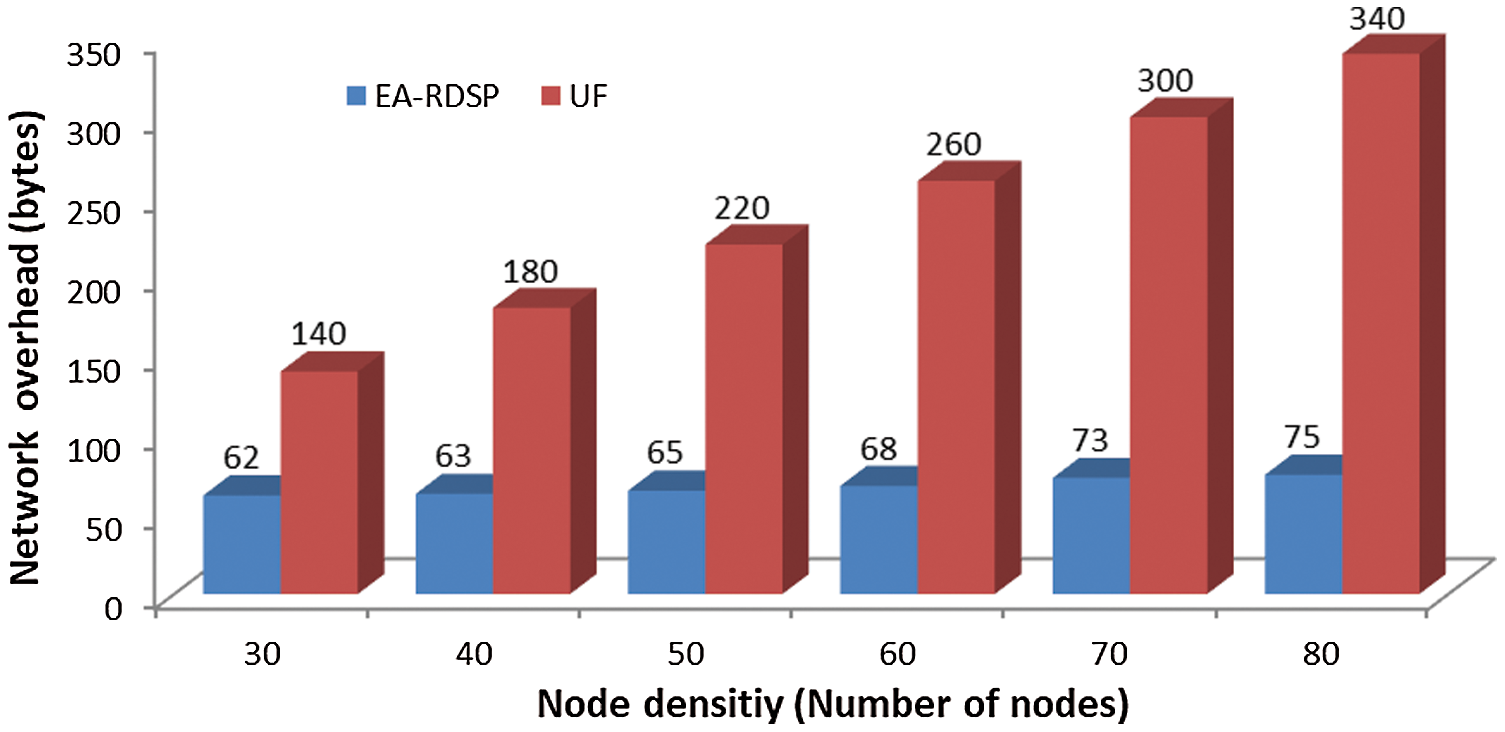
Figure 16: Network overhead
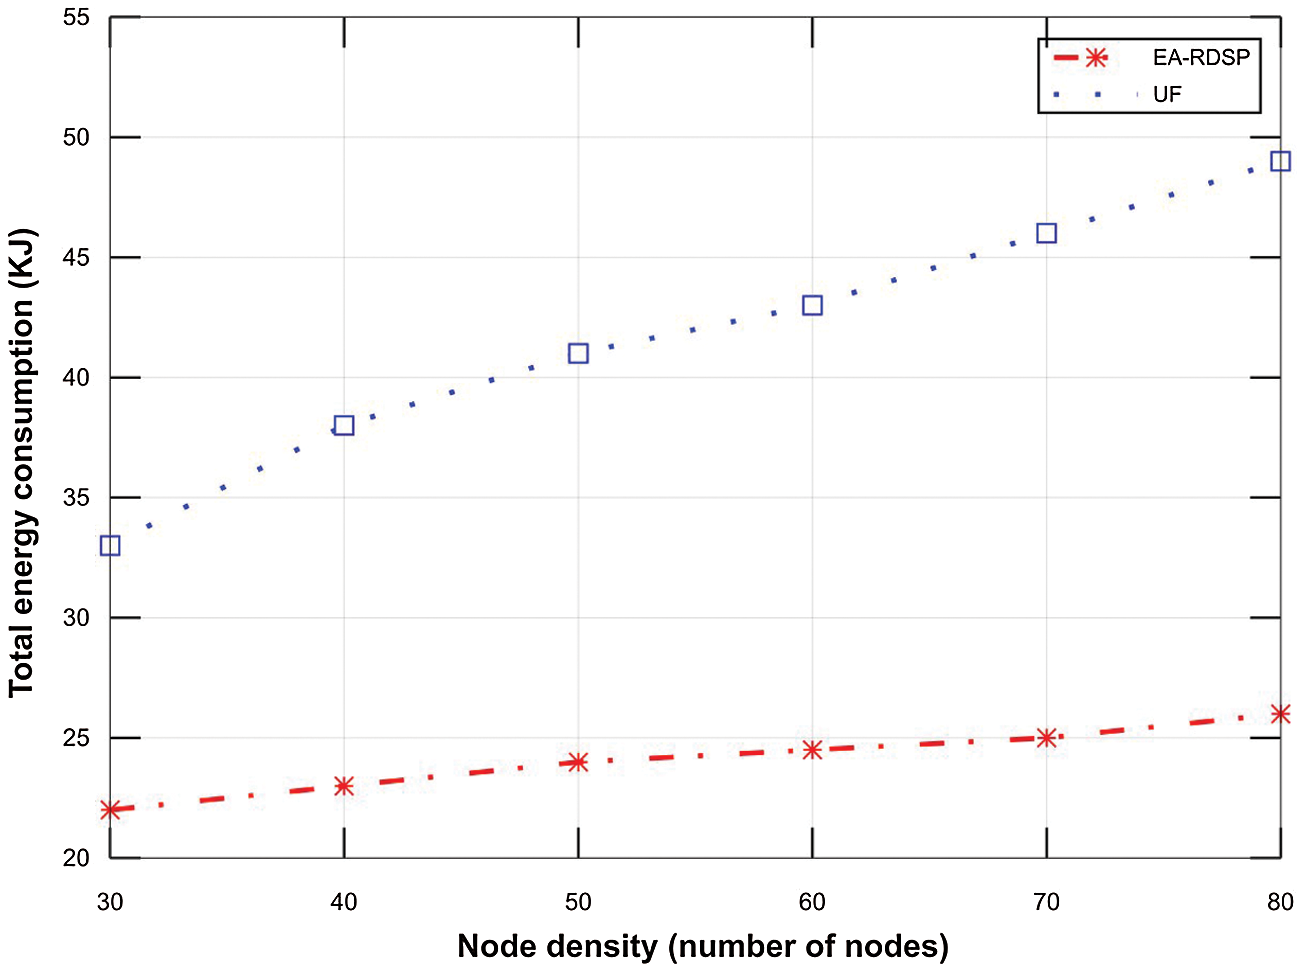
Figure 17: Total energy consumption in different node densities
Fig. 18 shows the average distance covered by the request messages from S1-D1, S2-D2 and S3-D3. It shows that when there are 30 nodes, the distance covered is 988 meters. Similarly, the distance covered increases from 1469 to 3039 meters as the number of nodes increases from 40 to 80. Fig. 18 indicates that as number of nodes increases, there is increase in covered distance and vice versa. Average distance between the source and destination nodes is same for both schemes; therefore the covered distance values are same for both the schemes.
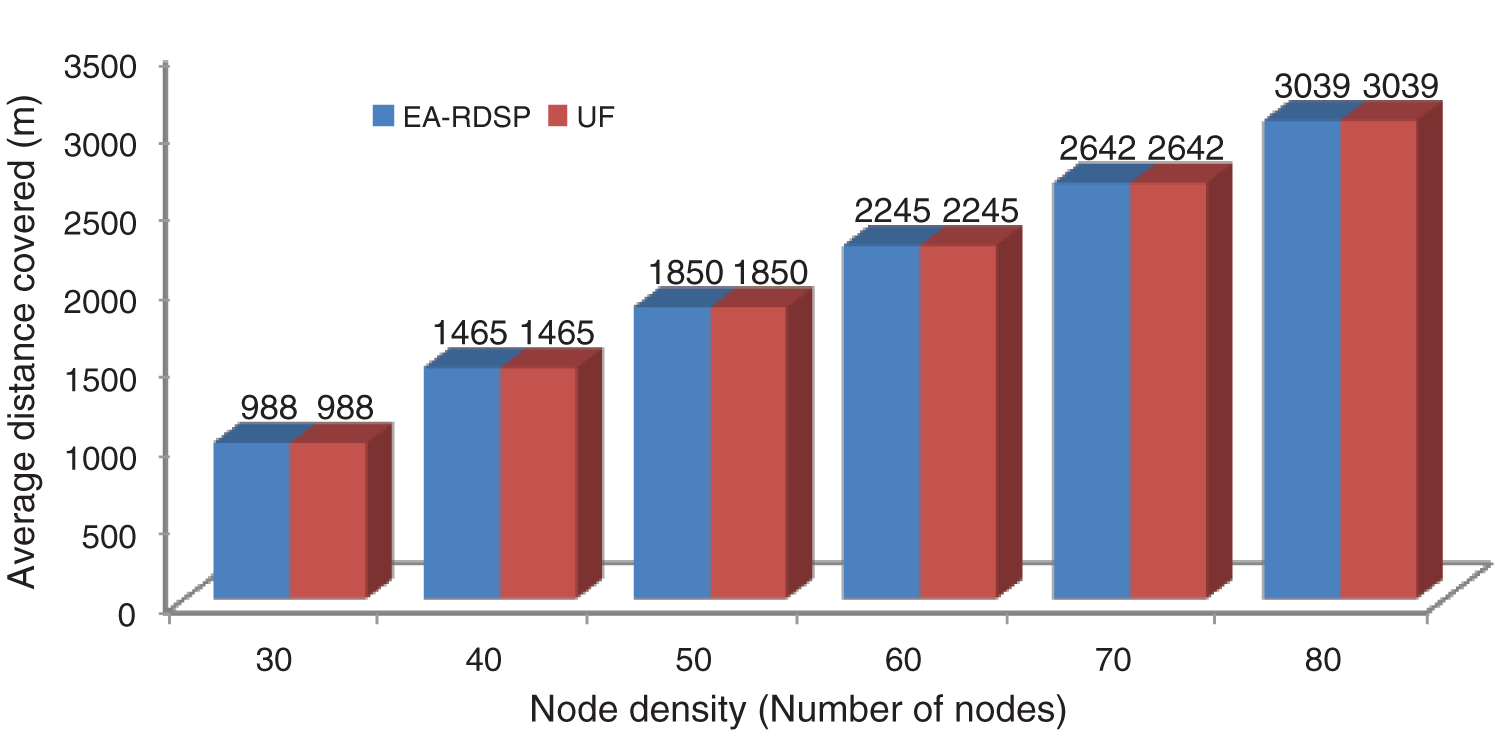
Figure 18: Average distance covered
In this study, an EA-RDSP was proposed that aims to reduce the average waiting times for transmitting the request messages containing rescue groups and victim's location information towards the control server. Additionally, unlike existing schemes, the EA-RDSP does not rely on the periodic exchange of entire routing tables. However, the proposed EA-RDSP scheme enables intermediate nodes to store hop count information towards the server and then each intermediate node selects the best forwarders towards the control server to minimize end-to-end delays. The experiments are performed for three different servers and clients to provide three different services. The numbers of deployed nodes are varied from 30 to 80 nodes between clients and server to cover a varying distance from 988 to 3039 meters. Results of simulation experiments demonstrate that with the proposed EA-RDSP scheme, a request message generated by the client device can reach the server device with a minimal delay in both light and heavily deployed paths compared to the existing UF system. In addition, the results confirmed that the EA-RDSP outperforms the UF scheme under various relay densities in terms of the end-to-end delay, message delivery ratio, and hello message overhead. The limitation of the proposed EA-RDSP system is that it cannot send audio and video messages. Therefore, in our future work, a client device would be used to send audio and video messages.
Funding Statement: This work was supported by National Research Foundation of Korea-Grant funded by the Korean Government (Ministry of Science and ICT)-NRF-2020R1A2B5B02002478).
Conflicts of Interest: The authors declare that they have no conflicts of interest to report regarding present study.
1. B. Sanou, “Measuring the information society report,” in Proc. WTIS, Geneva, Switzerland, pp. 1–204, 2018. [Google Scholar]
2. D. M. Vila, M. A. Jaimes, A. P. Estrada, A. Lopez, E. Reinoso et al., “Effects of hurricane odile on the infrastructure of baja california Sur, Mexico,” Natural Hazards, vol. 91, pp. 963–981, 2018. [Google Scholar]
3. K. Mase, “How to deliver your message from/to a disaster area,” IEEE Communications Magazine, vol. 49, no. 1, pp. 52–57, 2011. [Google Scholar]
4. K. Miranda, A. Molinaro and T. Razafindralambo, “A survey on rapidly deployable solutions for post-disaster networks,” IEEE Communications Magazine, vol. 54, no. 4, pp. 117–123, 2016. [Google Scholar]
5. M. Y. S. Uddin, H. Ahmadi, T. Abdelzaher and R. Kravets, “A low-energy, multi-copy inter-contact routing protocol for disaster response networks,” in Proc. SECON, Rome, Italy, pp. 1–9, 2009. [Google Scholar]
6. W. Guo and X. Huang, “Mobility model and relay management for disaster area wireless networks,” in Proc. WASA, Dallas, USA, pp. 274–285, 2008. [Google Scholar]
7. Y. Jahir, M. Atiquzzaman, H. Refai, A. Paranjothi and P. G. Lopresti, “Routing protocols and architecture for disaster area network: A survey,” Ad Hoc Networks, vol. 82, pp. 1–14, 2019. [Google Scholar]
8. D. Reina, M. Askalani, S. Toral, F. Barrero, E. Asimakopoulou et al., “A survey on multihop ad hoc networks for disaster response scenarios,” International Journal of Distributed Sensor Networks, vol. 11, no. 10, pp. 647037, 2015 [Google Scholar]
9. H. Li, L. Shan, T. Matsuda and R. Miura, “Design and deployment of infrastructure-independent D2D networks without centralized coordination,” in Proc. ISWCS, Brussels, Belgium, pp. 376–380, 2015. [Google Scholar]
10. I. Ghaznavi, K. Heimerl, U. Muneer, A. Hamid, K. Ali et al., “Rescue base station,” in Proc. ACM DEV-5, San Jose, CA, USA, pp. 53–62, 2014. [Google Scholar]
11. N. Pezeshkian, H. G. Nguyen and A. Burmeister, “Unmanned ground vehicle radio relay deployment system for non-line-of-sight operations,” in Proc. ICRA, Wurzburg, Germany, pp. 501–506, 2007. [Google Scholar]
12. C. Q. Nguyen, B. C. Min, E. T. Matson, A. H. Smith, J. E. Dietz et al., “Using mobile robots to establish mobile wireless mesh networks and increase network throughput,” International Journal of Distributed Sensor Networks, vol. 8, no. 8, pp. 1–13, 2012. [Google Scholar]
13. S. Jia, Z. M. Fadlullah, N. Kato and L. Zhang, “ECO-Udc: An energy efficient data collection method for disaster area networks,” in Proc. IC-NIDC, Beijing, China, pp. 130–134, 2017. [Google Scholar]
14. M. Li, H. Nishiyama, N. Kato, Y. Owada and K. Hamaguchi, “On the energy-efficient of throughput-based scheme using renewable energy for wireless mesh networks in disaster area,” IEEE Transactions on Emerging Topics in Computing, vol. 3, no. 3, pp. 420–431, 2015. [Google Scholar]
15. H. Suzuki, Y. Kaneko, K. Mase, S. Yamazaki and H. Makino, “An ad hoc network in the sky, skymesh, for large-scale disaster recovery,” in Proc. IEEE VTC, Montreal, QC, Canada, pp. 1–5, 2006. [Google Scholar]
16. T. Sakano, S. Kotabe, T. Komukai, T. Kumagai. Y. Shimizu et al., “Bringing movable and deployable networks to disaster areas: Development and field test of MDRU,” IEEE Network, vol. 30, no. 1, pp. 86–91, 2016. [Google Scholar]
17. T. Ngo, H. Nishiyama, N. Kato, T. Sakano and A. Takahara, “A spectrum- and energy-efficient scheme for improving the utilization of mdru-based disaster resilient networks,” IEEE Transactions on Vehicular Technology, vol. 63, no. 5, pp. 2027–2037, 2014. [Google Scholar]
18. A. Y. Chen, F. Pena-Mora, A. P. Plans, S. J. Mehta and Z. Aziz, “Supporting urban search and rescue with digital assessments of structures and requests of response resources,” Advanced Engineering Informatics, vol. 26, no. 4, pp. 833–845, 2012. [Google Scholar]
19. D. Hu, S. Li, J. Chen and V. R. Kamat, “Detecting, locating, and characterizing voids in disaster rubble for search and rescue,” Advanced Engineering Informatics, vol. 42, pp. 100974, 2019. [Google Scholar]
20. F. Pena-Mora, A. Y. Chen, Z. Aziz, L. Soibelman, L. Y. Liu et al.,“ Mobile ad hoc network-enabled collaboration framework supporting civil engineering emergency response operations,” Journal of Computing in Civil Engineering, vol. 24, no. 3, pp. 302–312, 2010. [Google Scholar]
21. A. Y. Chen, F. Pena-Mora and Y. Ouyang, “A collaborative GIS framework to support equipment distribution for civil engineering disaster response operations,” Automation in Construction, vol. 20, no. 5, pp. 637–648, 2011. [Google Scholar]
22. P. S. Crawford, M. A. Al-Zarrad, A. J. Graettinger, A. M. Hainen, E. Back et al., “Rapid disaster data dissemination and vulnerability assessment through synthesis of a web-based extreme event viewer and deep learning,” Advances in Civil Engineering, vol. 2018, pp. 7258156, 2018. [Google Scholar]
23. V. G. Menon, J. P. Pathrose and J. Priya, “Ensuring reliable communication in disaster recovery operations with reliable routing technique,” Mobile Information Systems, vol. 2016, pp. 9141329, 2016. [Google Scholar]
24. N. S. VO, A. Masaracchia, L. D. Nguyen and B. C. Huynh, “Natural disaster and environmental monitoring system for smart cities: Design and installation insights,” Transactions on Industrial Networks and Intelligent Systems, vol. 18, no. 16, pp. 156001, 2018. [Google Scholar]
25. L. D. Nguyen, A. Kortun and T. Q. Duong, “An introduction of real-time embedded optimisation programming for UAV systems under disaster communication,” Transactions on Industrial Networks and Intelligent Systems, vol. 18, no. 17, pp. 156080, 2018. [Google Scholar]
26. M. R. Souryal, J. Geissbuehler, L. E. Miller and N. Moayeri, “Real-time deployment of multi hop relays for range extension,” in Proc. MobiSys, San Juan, PR, USA, pp. 85–98, 2007. [Google Scholar]
27. A. Wolff, S. Subik and C. Wietfeld, “Performance analysis of highly available ad hoc surveillance networks based on dropped units,” in Proc. IEEE HST, Waltham, MA, USA, pp. 123–128, 2008. [Google Scholar]
28. J. Q. Bao and W. C. Lee, “Rapid deployment of wireless Ad Hoc backbone networks for public safety incident management,” in IEEE GLOBECOM 2007 - IEEE Global Telecommunications Conf., Washington, DC, pp. 1217–1221, 2007. [Google Scholar]
29. H. Liu, Z. Xie, J. Li, S. Lin, D. J. Siu et al., “An automatic, robust, and efficient multi-user breadcrumb system for emergency response applications,” IEEE Transactions on Mobile Computing, vol. 13, no. 4, pp. 723–736, 2014. [Google Scholar]
30. T. Mukherjee, G. Varsamopoulos and S. Gupta, “Self-managing energy efficient multicast support in MANETs under end-to-end reliability constraints,” Computer Networks, vol. 53, no. 10, pp. 1603–1627, 2009. [Google Scholar]
31. X. Zhang, X. Gao, D. Shi and D. K. Sung, “Lifetime-aware leisure degree adaptive routing protocol for mobile ad hoc networks,” in Proc. ICWMC'07, Guadeloupe, French Caribbean, pp. 1–1, 2007. [Google Scholar]
32. N. Iqbal, “Energy efficient architecture for wireless geophone networks,” SEG Technical Program Expanded Abstracts, vol. 2019, pp. 107–111, 2019. [Google Scholar]
33. M. Alazab, K. Lakshmanna, T. Reddy, Q. V. Pham and P. K. R. Maddikunta, “Multi-objective cluster head selection using fitness averaged rider optimization algorithm for IoT networks in smart cities,” Sustainable Energy Technologies and Assessments, vol. 43, pp. 100973, 2021. [Google Scholar]
34. L. Krishnasamy, R. K. Dhanaraj, D. G. Gopal, G. R. Thippa, M. K. Aboudaif et al., “A heuristic angular clustering framework for secured statistical data aggregation in sensor networks,” Sensors, vol. 17, pp. 4937, 2020. [Google Scholar]
35. P. K. R. Maddikunta, T. R. Gadekallu, R. Kaluri, G. Srivastava, R. M. Parizi et al., “Green communication in IoT networks using a hybrid optimization algorithm,” Computer Communications, vol. 159, pp. 97–107, 2020. [Google Scholar]
36. M. Tang, M. Alazab and Y. Luo, “Big data for cybersecurity: Vulnerability disclosure trends and dependencies,” IEEE Transactions on Big Data, vol. 5, no. 3, pp. 317–329, 2019. [Google Scholar]
37. A. Khan, F. Ullah, Z. Kaleem, S. Ur Rahman, H. Anwar et al., “EVP-Stc: Emergency vehicle priority and self-organising traffic control at intersections using internet-of-things platform,” IEEE Access, vol. 6, pp. 68242–68254, 2018. [Google Scholar]
38. A. Khan, A. Munir, Z. Kaleem, F. Ullah, M. Bilal et al., “RDSP: Rapidly deployable wireless ad hoc system for post-disaster management,” Sensors, vol. 20, no. 2, pp. 548, 2020. [Google Scholar]
39. Y. K. R. Kwok and V. K. N. Lau, “IEEE 802.11X WLAN standards,” Wireless Internet and Mobile Computing: Interoperability and Performance, vol. 7, pp. 257–284, 2007. [Google Scholar]
40. N. Iqbal, S. I. Al-Dharrab, A. H. Muqaibel, W. Mesbah and G. L. Stuber, “Cross-layer design and analysis of wireless geophone networks utilizing TV white wpace,” IEEE Access, vol. 8, pp. 118542–118558, 2020. [Google Scholar]
41. N. Iqbal, S. I. Al-Dharrab, A. H. Muqaibel, W. Mesbah and G. L. Stuber, “Analysis of wireless seismic data acquisition networks using markov chain models” in Proc. IEEE PIMRC Bologna, Italy, pp. 1–5, 2018. [Google Scholar]
42. N. Iqbal, A. Zerguine and S. Khan, “OFDMA-TDMA based seismic data transmission over TV white space,” IEEE Communications Letters, vol. 10, no. 11, 2021. [Google Scholar]
 | This work is licensed under a Creative Commons Attribution 4.0 International License, which permits unrestricted use, distribution, and reproduction in any medium, provided the original work is properly cited. |