DOI:10.32604/cmc.2021.018000
| Computers, Materials & Continua DOI:10.32604/cmc.2021.018000 | |
| Article |
Machine Learning Applied to Problem-Solving in Medical Applications
1Department of Information Technology, Faculty of Computing and Information Technology, King Abdulaziz University, Jeddah, 21589, Saudi Arabia
2Centre for Artificial Intelligence in Precision Medicine, King Abdulaziz University, Jeddah, 21589, Saudi Arabia
3Department of Statistics, Faculty of Science, King Abdulaziz University, Jeddah, 21589, Saudi Arabia
4Department of Information Systems, Faculty of Computing and Information Technology, King Abdulaziz University, Jeddah, 21589, Saudi Arabia
5Department of Mathematics, Faculty of Science, New Valley University, El-Kharga, 72511, Egypt
*Corresponding Author: Romany F. Mansour. Email: romanyf@scinv.au.edu.eg
Received: 21 February 2021; Accepted: 24 April 2021
Abstract: Physical health plays an important role in overall well-being of the human beings. It is the most observed dimension of health among others such as social, intellectual, emotional, spiritual and environmental dimensions. Due to exponential increase in the development of wireless communication techniques, Internet of Things (IoT) has effectively penetrated different aspects of human lives. Healthcare is one of the dynamic domains with ever-growing demands which can be met by IoT applications. IoT can be leveraged through several health service offerings such as remote health and monitoring services, aided living, personalized treatment, and so on. In this scenario, Deep Learning (DL) models are employed in proficient disease diagnosis. The current research work presents a new IoT-based physical health monitoring and management method using optimal Stacked Sparse Denoising Autoencoder (SSDA) technique i.e., OSSDA. The proposed model utilizes a set of IoT devices to collect the data from patients. Imbalanced class problem poses serious challenges during disease diagnosis process. So, the OSSDA model includes Synthetic Minority Over-Sampling Technique (SMOTE) to generate artificial minority class instances to balance the class distribution. Further, the hyperparameter settings of the OSSDA model exhibit heavy influence upon the classification performance of SSDA technique. The number of hidden layers, sparsity, and noise count are determined by Sailfish Optimizer (SFO). In order to validate the effectiveness and performance of the proposed OSSDA technique, a set of experiments was conducted on diabetes and heart disease datasets. The simulation results portrayed a proficient diagnostic outcome from OSSDA technique over other methods. The proposed method achieved the highest accuracy values i.e., 0.9604 and 0.9548 on the applied heart disease and diabetes datasets respectively.
Keywords: IoT; patient monitoring; physical health; deep learning; parameter tuning
Human body generates a lot of vital health signals seamlessly and this information can be validated using physiological models to decode the bio-signals such as blood pressure, heart rate, and blood glucose. In recent years, numerous advanced technologies have emerged in the field of healthcare such as mobile applications, advanced computing, biosensors, portable tools, home virtual assistants and block chain-relied electronic clinical recording machines. The nexus between the sensors and mobile equipment helps in instant reporting of diverse health attributes. These attributes can be read, accurately interpreted and sent to clinical organizations. A survey conducted by Grand View Research Inc found that Internet of Things (IoT) is applied in a number of modern medical applications to accomplish advanced medical assistance. Technavio’s market research report mentioned that IoT, in global medical sector, aspires to yield impressive CAGR in the coming years. Numerous studies have been conducted recently focusing the application of ‘smart’ clinical tools in Diabetes Mellitus (DM) such as ‘smart inhaler’, ‘smart syringe pen’, ‘smart pills’ etc., Besides, handy biosensor is one of the significant applications and a product of advanced digital transformation used in healthcare sector. An extensive range of biosensors is used these days since it forwards the clinical data to mobile and web applications through wireless networks. Likewise, physicians are provided with an option to balance the treatment rendered to patient and track their health condition from anywhere, anytime. Moreover, biosensors are applied in routine life which gathers data from physical actions, sleeping patterns, food consumption, and common health in unobtrusive fashion. Clinically, biosensors enable the users to calculate their blood glucose levels, arterial pressure, heartbeat, oxygen level, pulse rate and alcohol levels. This sensitive healthcare information is transmitted via practical applications, which in turn alarms the patients in case of emergency [1]. Reporting a patient’s health status is one of the significant parameters in remote health care systems.
Numerous modules have been proposed in Patient Health Portals (PHP) which are still in progress. These modules are likely to play an important role in medical chain to provide single window online services for patients through which one can attain patient satisfaction. These portals enables the users to execute different activities such as physician consultation, Consultation with specialists through web applications, sampling for laboratory analysis, payments, communication between the patient and others, simple procedures for healthy lifestyle, appointment scheduling. Being patient-friendly and effective, these modules further mitigate the overhead of hospital employees who work on regular functions. In the past few decades, a static increase has been observed in different health monitoring domains. Numerous works have proposed distinct recommendations for personal remote health observations and portable & uniform implantable solutions on the basis of cost-effective sensors and diverse wireless systems.
UbiMon (Ubiquitous Monitoring Environment for Wearable and Implantable Sensors) project [2] was developed to examine Arrhythmic Heart Disease (HD). It was aspired to include common features present in mobile and wearable sensor systems like handy sensors for remote and protective observation of heart functions. In this project, a model was newly developed with five major elements namely, Body Sensor Network (BSN) nodes, processing unit, central webserver, patient database and PC. In this model, wireless Electrocardiogram (ECG) and pulse oximeter (SpO2) sensors are combined with typical sensors and embedded on specific wireless cards to generate a BSN loop. Also, compact flash card is also applied in PDAs to collect signals and observe and examine the router between BSN and central servers via cellular network (Wi-Fi/GPRS). Then, the PC host user-interface is developed to predict and balance the input patient sensor information. The resultant product i.e., newly developed software enables one to forward the required data to concerned individuals.
1.1 Role of IoT in Healthcare Sector
In the recent years, effective models like Long Term Evolution (Long-Term Evolution), M2M (Machine-to-Machine communication), and NFC (Near Field Communications) have been developed for communication processes under the application of IP (Internet Protocol) address. Cellular and wireless communications occur on the basis of IP-based schema. IoT is a novel paradigm in which the devices are connected together and are made to work remotely through diverse communication systems. Further, it also refers to a collection of smart devices which is applied in the transformation of intelligent networks to gather and process data with or without explicit human contribution. Therefore, home appliances like refrigerators, TV, washing machines and heaters are embedded with IP addresses and connected through internet to make it suitable for frequent communications [3]. IoT was first presented by Kevin Ashton in 1999 who defined that the devices communicate with each other through RFID (Radio Frequency Identification) technique. However, today’s IoT is inclusive of devices that enable massive and comprehensive data collection and monitoring. Fig. 1 shows the research area in IoT healthcare system.

Figure 1: Research areas in IoT healthcare systems
It is possible to allot IP to a number of devices using IPv6 (Internet Protocol Version 6) protocol with 128-bit address. This pattern of numbering the devices is feasible, only in addressing undecillion number of entities. In IoT, intelligent devices which are implanted in a house or factory setting communicate with each other and generate useful information for human beings in the form of simple definitions. IoT heavily relies on inherent quality of the devices that function in a sophisticated fashion under diverse communication methods. Using IoT, the health condition of a patient can be observed frequently on a real-time basis. This sophistication is preferred by most of the patients, especially their caretakers and those who are ill with chronic disorders [4]. When a system becomes impotent in emergency cases, it gets immediately replaced by first aid team. Thus, the patient's instantaneous data regarding blood and other critical signs are collected and transmitted to clinical database. Hence, medical intervention becomes highly robust and better outcomes are achieved, where eminent changes are presented. When a patient suffers from heart attack, blood values are reported to the doctor instantly before admitting the patient at hospital. Moreover, IoT and nano communication models are combined together and processed effectively.
The current research article developed an effective IoT-based physical health monitoring and management method using optimal Stacked Sparse Denoising Autoencoder (SSDA) technique i.e., OSSDA. The proposed model utilizes a set of IoT devices to collect data from the patients. Imbalanced class problem poses serious challenges during disease diagnosis process. So, the OSSDA model includes Synthetic Minority Over-Sampling Technique (SMOTE) to overcome this challenge. Moreover, the hyperparameters are set for the proposed OSSDA model via sailfish optimizer (SFO). To assess the effectiveness of the proposed OSSDA technique, in terms of performance, a set of experiments was conducted on diabetes and heart disease datasets.
The remaining sections of the paper are organized as follows. Section 2 briefs about the related works. Sections 3 and 4 discuss the working of OSSDA. Followed by, Section 5 presents the information on performance validation and Section 6 concludes the paper.
‘Patients Like Me’ concentrated on guiding patients and responding their queries. A patient can be responded through different forms for instance, examining them with same health issues and sharing their experiences repeatedly. However, data integrity and system applicability are the challenging issues in this regard. Alternatively, ‘Daily Strength’ a relevant social networking system was developed which functions based on supportive groups. The users provide emotional support and respond by defining the merits and demerits of this therapy. It is composed of web applications which provide information on diverse clinical attributes. This application is similar to ‘Patients Like Me’ by means of free environments where patients-doctors communicate with each other. There are two major discrepancies in these two models one of which is that the ‘Daily Strength’ is not applicable in research centers and mobile applications. In this scenario, these models are non IoT-based approaches. Hence, an effective approach was deployed in the literature with different pulse attributes, EEG, and skin examination sensors [5].
A model was deployed in the literature to link facial expressions and voice analysis with EEG patterns [6]. As a result, the developers have ensured that EEG implies the features that correspond to different emotions. Facial analysis software was compared with heart rate variations to understand the patterns regarding different emotions [7]. Moreover, the software has ensured that specific pulse patterns can be correlated with stress because the information on latter cannot be acquired from emotional state. In spite of being dynamic systems, IoT was not applied as a tool in these applications.
Alternatively, comprehensive medical network, named ‘Omnio’ was defined as an all-in-one application for clinical resources [8]. It offers a wide range of medical resources, diagnostic resources, disease guides, and drug details. Everyday Health [9] is an organization that has websites and generates content related to normal and abnormal features. Moreover, ‘Connected eHealth Mobile Applications’ have provided smart search ability along with simple access. Though the above-mentioned medical service approaches are effective, it lacked to provide modern devices that can monitor the regular actions of the user, whenever required. A Smart Elderly Home Monitoring System (SEHMS) was introduced in the literature and applied in Android mobiles using accelerometer. The system aims at predicting the fall of an individual [10]. Smartphone user interface was developed to collect and analyze the healthy data collected from system. One of the benefits of SEHMS is that it can monitor remote sites for aged and weak patients. It is also responsible for providing warning signals for patients in case of emergency.
Remote Mobile Health Monitoring (RMHM) is a well-known method that observes the health attributes of a patient, for instance heart rate, using portable sensors [11]. It helps the physicians to monitor the health condition of a patient remotely. But, it could not be applied in monitoring practical scenarios. Yet, the prediction of heart attack remains a serious issue which has been focused in this study. Hence, the integration of body temperature and ECG are applied in the prediction of heart anomalies using real-time applications. Different methods have been executed using distinct hardware in the previous studies. The developed system applies a low power Bluetooth to wirelessly collect the longitudinal information under the application of smartphone.
In literature [12,13], the researchers compared Data Mining (DM) models for heart attack detection. A predictive mechanism was applied in complete system with data collection device under computing environment. Some of the reputed methods applied in the prediction of heart problems are Decision Tree (DT), Na¨ıve Bayes (NB), Neural Network (NN), K-mean, etc. A complete system with IoT and processing platform that makes use of DM is used for the prediction of heart diseases. Finally, this phenomenon has become one of the remarkable features in sensing low power smart IoT systems in which a DM method is applied. Hence, testing the prediction model has gained better results with optimal accuracy in both abnormal and normal samples.
In new electricity generation and transmission systems, theft detection technique has been presented using DL model. In order to improve the feature extraction capability and its robustness, both sparsity and noise were incorporated into autoencoder. Particle Swarm Optimization (PSO) algorithm was employed in the literature upon optimization of hyperparameters. The method proposed in the current study is inspired from the literature [14].
The efficiency of this model depends upon previous wireless communications that consume minimum power and offer extreme freedom for the users to move and perform other physical actions. In addition to the above, few small, light-weight and user-friendly smart IoT tools have been applied such as smartphones, wrist-band, smartwatch, and so on. The implanted sensors are simulated to integrate it and to perform different computations so as to estimate and differentiate the heart rate of healthy ones from that of the unhealthy ones. Sensor-enabled smartphones or handy sensors are carried by the subjects which collects the data and transmit it to servers. Embedded ECG and temperature sensors are mainly applied in the collection of heart variables of the subject who leads a typical lifestyle. Once the data is received by low power Bluetooth communication unit, the smartphone computes the data and classifies it as either normal or abnormal based on the patients’ condition. Effective heart rate and diabetes examination can be computed in Android platform that offers an option for the patient to view their own ECG reports as well as body temperature.
In order to detect unhealthy heart patterns, a basic criterion has been developed for normal heart rate. A significant analysis of heart rate stability and pulse symmetry is done through eminent parameters such as heart rate, RR intervals (RR interval is a time period between subsequent R peaks in an ECG signal), and ST segregates (ST-segment is defined as a flat section in ECG signal from one end of a S wave and the beginning of the upcoming T wave). It depicts the interval between ventricular depolarization and repolarization. Then, early alert system is deployed to observe these parameters for any heart attack symptoms during day-to-day activities. Even though the system frequently observes ECG patterns, the systematic patterns simulate an alert when ECG and body temperature of the patient reach a specific threshold i.e., when a user suffers from cardiac arrest. IoT device is focused on gathering information regarding users and forwards it to smartphone through Bluetooth communication unit. Next, the information is forwarded to cloud servers. The computations are carried out using OSSDA model which also determines the physical health state of the patient.
4 The Proposed OSSDA Algorithm
The proposed method makes use of IoT devices for data collection. Here, SMOTE technique is applied to resolve class imbalance problem in medical data. Followed by, the SSDA algorithm is employed to detect the disease in which the hyperparameters are tuned by SFO. Fig. 2 illustrates the overall working process involved in the proposed model.

Figure 2: The overall working process of the proposed method
The fundamental process of SMOTE is to manage samples by producing novel minority class samples [15]. Instead of copping a minority class sample, SMOTE provides samples with the help of linear interpolation among class samples which suits one another. The major procedures are given below: At first, according to oversampling rate
where
Fig. 3 is a schematic representation of SMOTE method in which the white circles denote majority class, whereas black color indicates minority class.

Figure 3: Structure of SMOTE
Prior to the introduction of SSDA detector, AE and Sparse Denoising Autoencoder (SDAE) are presented herewith. In general, AE is composed of two portions such as Encoder and Decoder, whereas the tasks of encoding and decoding are projected by Eqs. (2) and (3), respectively
where
RE could be depicted as given herewith.
An extended version of AE, with certain function, can be produced by developing different limitations in a loss function. SAE calculates the number of neurons to be reduced for achieving two things i.e., to enhance speed and processing efficiency of the network variables and to simplify the function of high-dimensional data. Assume
where
where
where
where
where
SSDA detector is developed using SDAE and trained with the help of greedy layer-wise fashion [14], in which a hidden layer from previous AE is applied as input for next one. Fig. 4 shows the architecture of SSDA.

Figure 4: Structure of SSDE
Basically, Multilayer Neural Network (MNN) training experiences gradient issues. When network weights are improved by applying backpropagation (BP) method, the hidden layer gradients become inputs. Hence, greedy layer-wise training applies two steps in defining the diminishing gradient problem: bottom-up, unsupervised pre-training and top-down supervised fine-tuning. SSDA applies layer-by-layer pre-training strategy from
The hyperparameter setting of OSSDA has created a remarkable impact upon the classification performance of SSDA technique. So, hidden layer count, sparsity, and noise count are determined by SFO. SFO [16] is defined as a population-based meta-heuristic approach which has evolved from attack-alternation principle of hunting sailfishes that steal a shoal of sardines. This hunting procedure provides upper hand to hunters, since it offers a chance to preserve the energy. It assumes two populations namely, sailfish population and sardine population. Initially, the sailfishes are assumed to be the candidate solutions, where the problem variables denote the place of sailfishes in search space. This model attempts to randomize the movement of search agents to a great extent. Sailfishes are distributed in a search space, while the location of sardines helps in finding
A sailfish with optimal fitness is named as ‘elite’ sailfish and its corresponding position at
where
where
where
where
where
where
A random decision of sailfishes and sardines ensures that the search space is explored. Since the attack power of sailfishes are reduced in all the iterations, it offers a chance for sardines to leave the optimal sailfish, which helps in exploitation.

Figure 5: Steps of SFO model
The performance of the presented OSSDA technique was evaluated using two benchmark datasets namely heart disease dataset and diabetes dataset from UCI repository [17,18]. For experimental validation, 10-fold cross-validation was performed. Tab. 1 shows a detailed comparison on OSSDA technique and existing methods under varying number of instances in heart disease dataset. Fig. 6 shows the results of sensitivity analysis attained by OSSDA technique and existing techniques. The figure shows that the SVM model produced ineffective outcomes and attained a minimum sensitivity value. The NB model reached a slightly higher sensitivity value. Besides, KNN and DT models exhibited closer and competitive sensitivity values. But the presented OSSDA model achieved the highest sensitivity value over other methods. For instance, under 2000 instances, the OSSDA model accomplished a maximum sensitivity of 0.952, whereas the KNN, NB, SVM, and DT models achieved only minimum sensitivity values such as 0.926, 0.879, 0.832, and 0.933 respectively.
In line with this, under 4000 instances, the OSSDA method produced a high sensitivity of 0.955, while the KNN, NB, SVM, and DT approaches illustrated the least sensitivity values such as 0.884, 0.846, 0.824, and 0.923 respectively. Similarly, with 6000 instances, the OSSDA approach attained an optimal sensitivity of 0.97, whereas the KNN, NB, SVM, and DT schemes produced the least sensitivity values such as 0.932, 0.864, 0.839, and 0.936 correspondingly. The OSSDA method accomplished a supreme sensitivity of 0.981 under 8000 instances, whereas other approaches such as KNN, NB, SVM, and DT produced the least sensitivity values such as 0.924, 0.886, 0.824, and 0.969 respectively. Followed by, under 10000 instances, the OSSDA technique ended up with supreme sensitivity of 0.985. But KNN, NB, SVM, and DT approaches depicted the least sensitivity values such as 0.936, 0.891, 0.842, and 0.96 respectively.
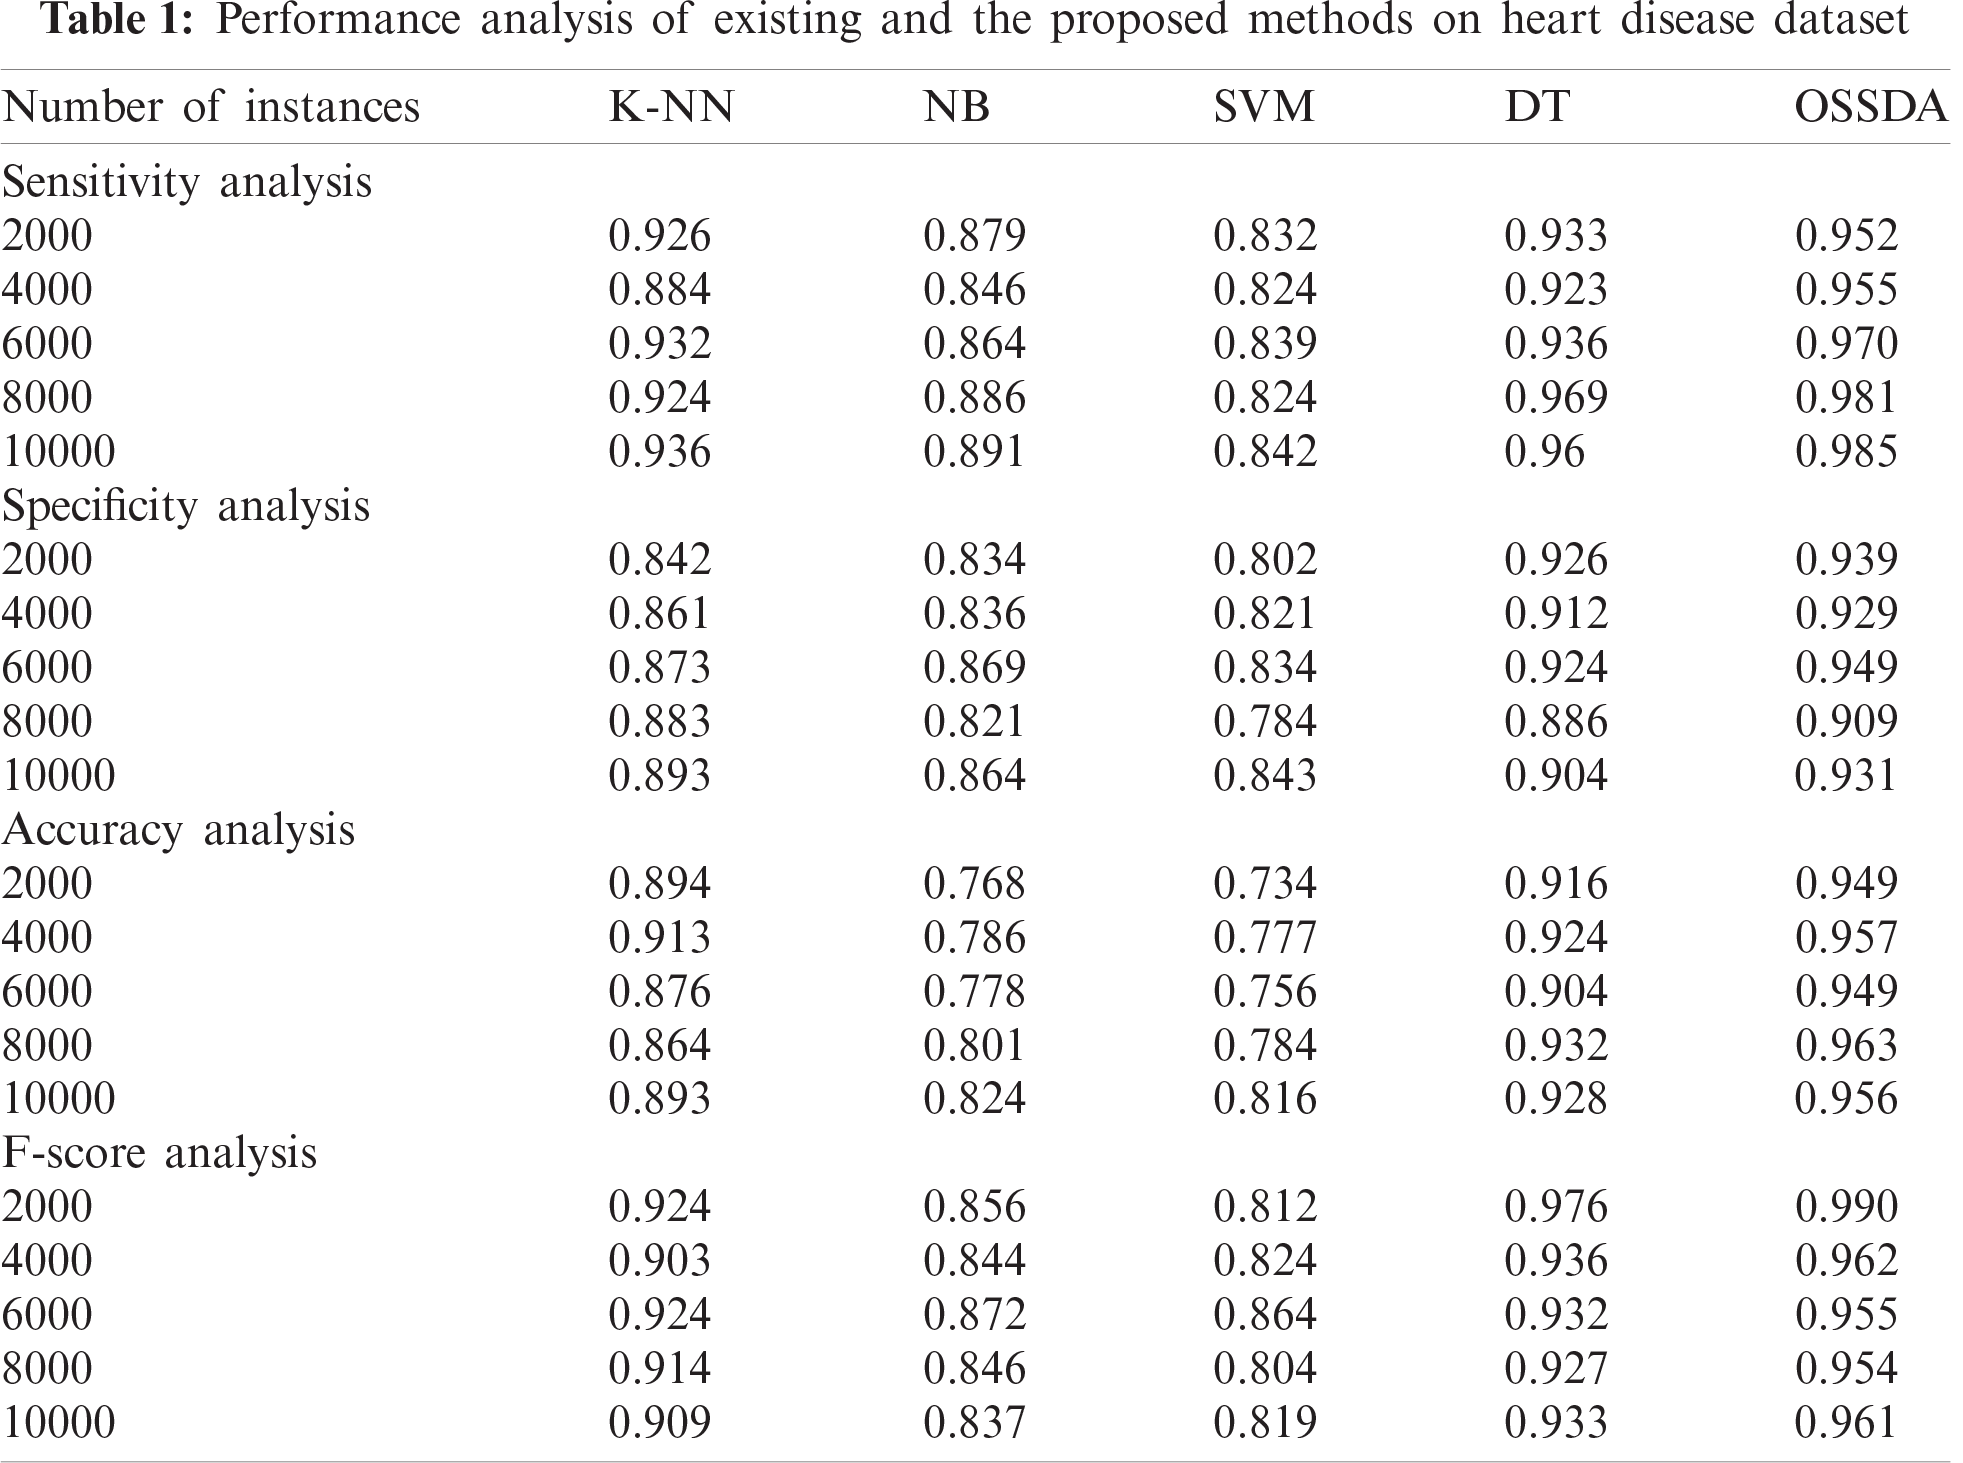
Fig. 6 examines the specificity of the proposed OSSDA technique against previous models. From the figure, it is evident that the SVM approach implied poor results by gaining the least specificity measure. Further, the NB scheme too attained a moderate specificity value. In line with this, KNN and DT methodologies represented identical and competing specificity values. However, the proposed OSSDA model accomplished the maximum specificity value in comparison with existing models. For example, under 2000 instances, the OSSDA scheme resulted in high specificity of 0.939, whereas the KNN, NB, SVM, and DT methodologies exhibited the least specificity values such as 0.842, 0.834, 0.802, and 0.926 respectively. Likewise, under 4000 instances, the OSSDA approach generated an optimal specificity of 0.929, and the KNN, NB, SVM, and DT frameworks garnered minimal specificity values such as 0.861, 0.836, 0.821, and 0.912 correspondingly. In line with this, with 6000 instances, the OSSDA model resulted in high specificity of 0.949, whereas the KNN, NB, SVM, and DT models achieved the least specificity values such as 0.873, 0.869, 0.834, and 0.924 respectively. At the same time, under 8000 instances, the OSSDA approach resulted in the highest specificity of 0.909, while the KNN, NB, SVM, and DT technologies illustrated the least specificity values such as 0.883, 0.821, 0.784, and 0.886 respectively. Afterwards, the OSSDA approach accomplished better specificity of 0.931 under 10000 instances whereas KNN, NB, SVM, and DT frameworks demonstrated the least specificity values such as 0.893, 0.864, 0.843, and 0.931 respectively. Further, in the same figure, the OSSDA approach was assessed for accuracy against previous models. The figure portrays that the SVM method implied poor results by accomplishing the least accuracy. Additionally, NB approach attained a moderate accuracy value. Followed by, KNN and DT methodologies attained similar and competing accuracy values. However, the proposed OSSDA scheme achieved the maximum accuracy compared to previous models. For example, with 2000 instances, the OSSDA framework produced a high accuracy of 0.949 whereas KNN, NB, SVM, and DT approaches depicted the least accuracy values such as 0.894, 0.768, 0.734, and 0.916 respectively. In line with this, the OSSDA technology has attained a supreme accuracy of 0.957 under 4000 samples while the KNN, NB, SVM, and DT schemes produced minimal accuracy values such as 0.913, 0.786, 0.777, and 0.924 respectively. In line with this, under 6000 instances, the OSSDA model resulted in a considerable accuracy of 0.949 whereas KNN, NB, SVM, and DT methods displayed the least accuracy values such as 0.876, 0.778, 0.756, and 0.904 respectively. Concurrently, under 8000 instances, the OSSDA framework achieved an acceptable accuracy of 0.963 while KNN, NB, SVM, and DT methods attained the least accuracy values such as 0.864, 0.801, 0.784, and 0.932 respectively. Subsequently, under 10000 instances, the OSSDA mechanism accomplished a high accuracy of 0.956. On the other hand, KNN, NB, SVM, and DT techniques demonstrated low accuracy values such as 0.893, 0.824, 0.816, and 0.928 respectively. The figure further conveys the F-score analysis results of OSSDA scheme against traditional models. The figure depicts that the SVM approach produced an insignificant outcome and gained the least F-score value. Moreover, the NB scheme attained a moderate F-score value. Followed by, KNN and DT technologies resulted in identical and competing F-score values. However, the proposed OSSDA scheme obtained the maximum F-score when compared with other models. For instance, under 2000 instances, the OSSDA framework resulted in high F-score of 0.952 whereas KNN, NB, SVM, and DT approaches produced the least F-score values such as 0.926, 0.879, 0.832, and 0.933 correspondingly. Likewise, with 4000 instances, the OSSDA technique generated a supreme F-score of 0.955 while other approaches such as KNN, NB, SVM, and DT implied low F-scores such as 0.884, 0.846, 0.824, and 0.923 correspondingly. Under 6000 samples, the OSSDA scheme excelled with optimal F-score of 0.97 while KNN, NB, SVM, and DT methodologies attained minimal F-scores such as 0.932, 0.864, 0.839, and 0.936 respectively. In line with this, with 8000 samples, the OSSDA model achieved an acceptable F-score of 0.981, and KNN, NB, SVM, and DT frameworks produced the least F-score values such as 0.924, 0.886, 0.824, and 0.969 respectively. Finally, under 10000 instances, the OSSDA approach ended up with a superior F-score of 0.985 and conventional methods such as KNN, NB, SVM, and DT demonstrated the least F-score values such as 0.936, 0.891, 0.842, and 0.96 correspondingly.
Tab. 2 provides a brief comparison of OSSDA model against classical approaches under various number of instances in diabetes disease dataset. Fig. 7 shows the sensitivity value attained by OSSDA approach against previous methods. The figure reveals that the SVM technology implied poor results and accomplished the least sensitivity value. In addition, the NB scheme attained a moderate sensitivity value. Both KNN and DT methodologies gained nearby and competing sensitivity values. Furthermore, the FNC model represented a considerable sensitivity value too. However, the newly-presented OSSDA approach gained the maximum sensitivity value compared to conventional technologies. For example, with 2000 instances, the OSSDA scheme resulted in high sensitivity of 0.973, while KNN, NB, SVM, DT, and FNC methodologies produced the least sensitivity values such as 0.92, 0.875, 0.83, 0.93, and 0.945 correspondingly. In line with this, under 4000 instances, the OSSDA mechanism accomplished a supreme sensitivity of 0.956, and the KNN, NB, SVM, DT, and FNC frameworks depicted the least sensitivity values such as 0.88, 0.86, 0.825, 0.92, and 0.935 correspondingly. In line with this, under 6000 instances, the OSSDA technique gained an optimal sensitivity of 0.985, whereas the conventional techniques such as KNN, NB, SVM, DT, and FNC displayed the least sensitivity values such as 0.928, 0.88, 0.838, 0.93 and 0.945 correspondingly. Meantime, under 8000 instances, the OSSDA scheme gained the highest sensitivity of 0.991 whereas KNN, NB, SVM, DT, and FNC technologies showcased minimal sensitivity values as given herewith; 0.935, 0.88, 0.83, 0.97, and 0.98 correspondingly. Finally, under 10000 instances, the OSSDA scheme resulted in the best sensitivity value of 0.983, whereas the KNN, NB, SVM, DT, and FNC models produced the least sensitivity values such as 0.942, 0.9, 0.834, 0.96, and 0.7 correspondingly.

Figure 6: Comparative analysis of OSSDA model
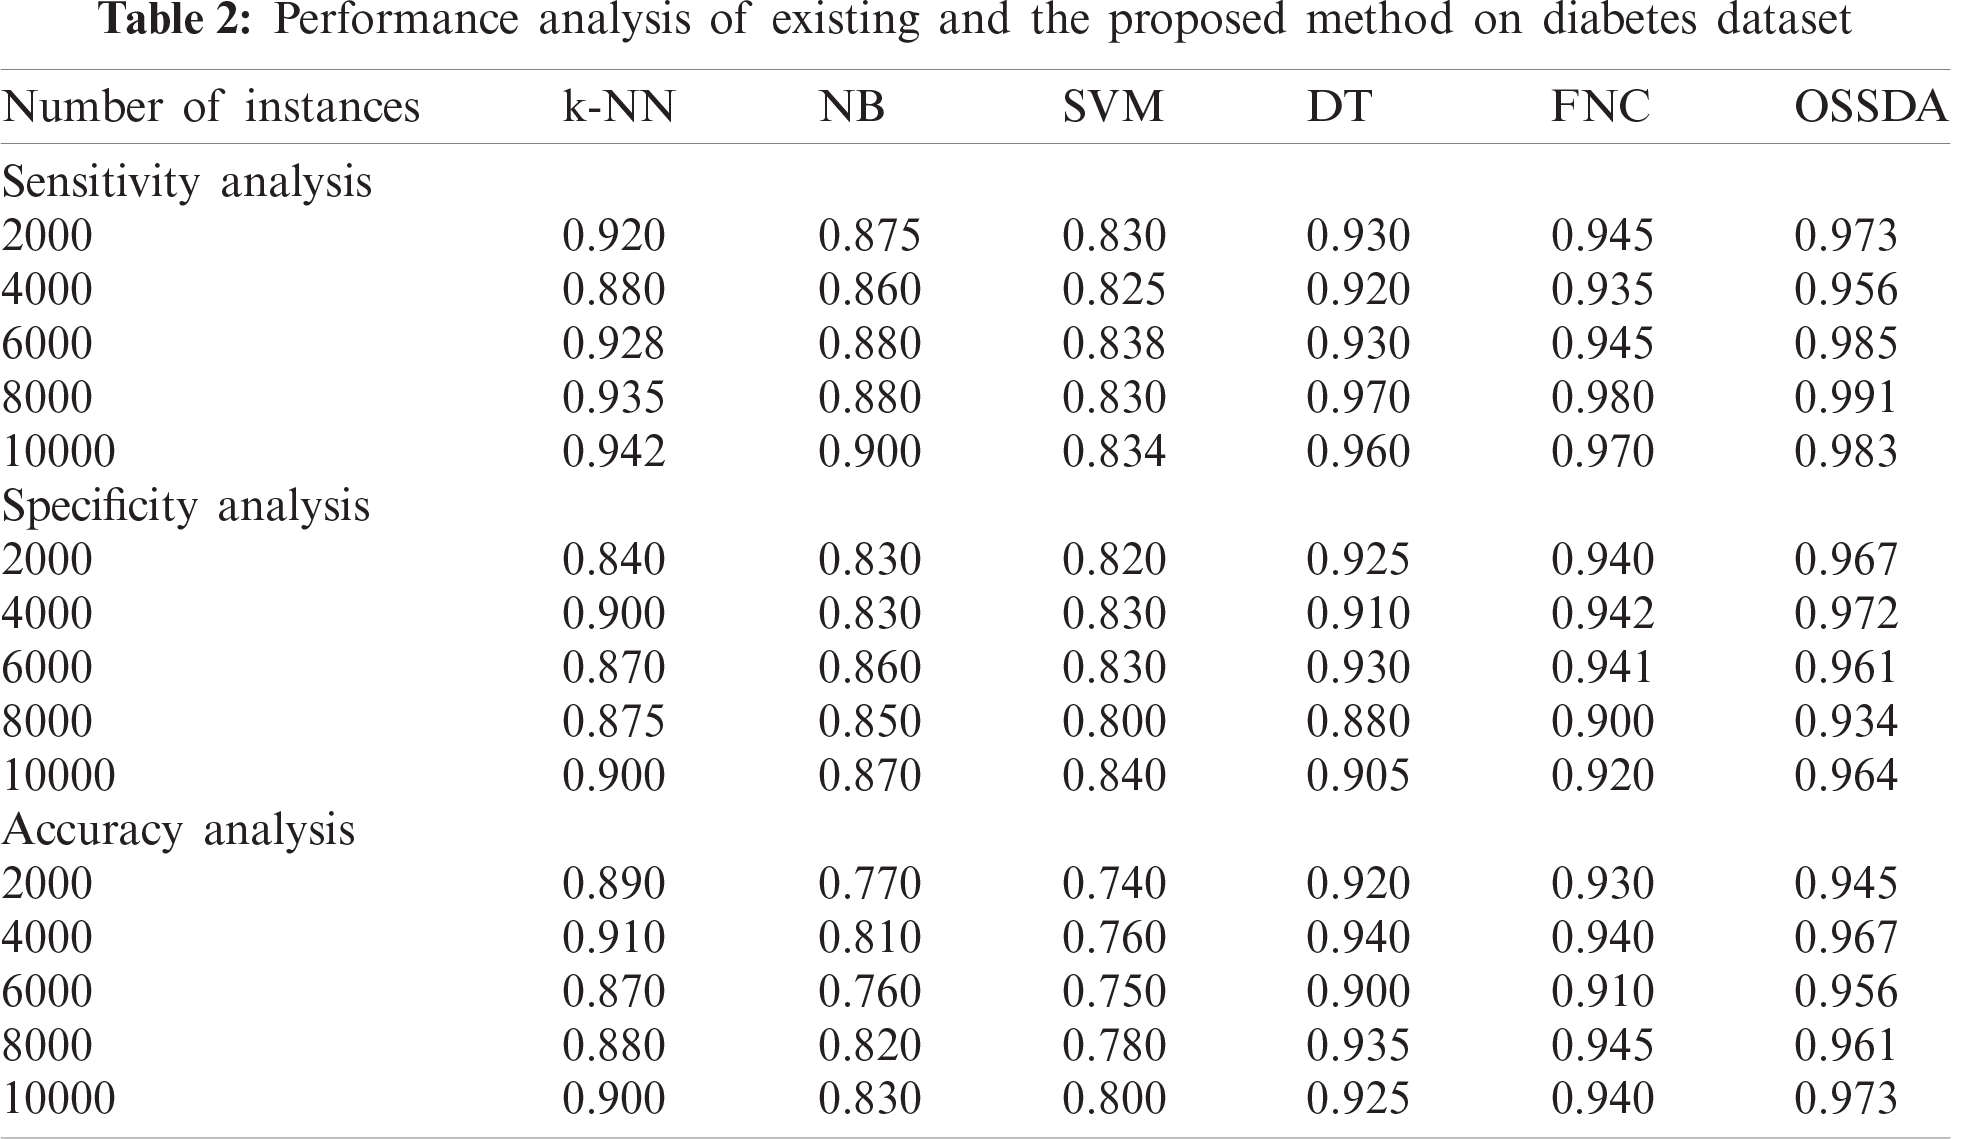
Fig. 7 shows the results for specificity analysis of OSSDA approach against previous models. The figure illustrates that the SVM method achieved insignificant results by gaining a low specificity value. Additionally, NB scheme has accomplished a moderate specificity value. In line with this, KNN and DT methodologies exhibited closer and competing specificity values. Moreover, the FNC model implied an acceptable specificity value. However, the newly proposed OSSDA approach attained the maximum specificity value compared to alternate approaches. For example, under 2000 instances, the OSSDA technique resulted in high specificity of 0.967, whereas KNN, NB, SVM, DT, and FNC schemes showcased the least specificity values such as 0.84, 0.83, 0.82, 0.925, and 0.94 respectively. Likewise, under 4000 instances, the OSSDA model obtained a supreme specificity of 0.972 whereas KNN, NB, SVM, DT, and FNC methodologies displayed minimum specificity values such as 0.9, 0.83, 0.83, 0.91, and 0.942 respectively. Along with that, with 6000 instances, the OSSDA mechanism achieved an optimal specificity of 0.961, whereas the KNN, NB, SVM, and DT models achieved the least specificity values of 0.87, 0.86, 0.83, 0.93, and 0.941 respectively. Meantime, with 8000 instances, the OSSDA approach obtained a remarkable specificity of 0.934, whereas KNN, NB, SVM, DT, and FNC techniques showcased the least specificity values such as 0.875, 0.85, 0.8 0.88, and 0.9 respectively. Finally, under 10000 instances, the OSSDA model achieved a standard specificity of 0.964 whereas KNN, NB, SVM, DT, and FNC models accomplished minimum specificity values such as 0.9, 0.87, 0.84, 0.905, and 0.92 respectively. The figure shows the accuracy achieved by OSSDA model and previous methods. The figure implies that the SVM approach achieved poor outcome since the accuracy was the least one. Further, NB method too attained a moderate accuracy. Both KNN and DT methodologies depicted closer and competing accuracy values. Here, FNC method accomplished a reasonable accuracy. However, the projected OSSDA approach obtained a remarkable accuracy compared to conventional frameworks. For example, with 2000 samples, the OSSDA technique attained a superior accuracy of 0.945, while KNN, NB, SVM, DT, and FNC technologies showcased the least accuracy values such as 0.89, 0.77, 0.74, 0.92, and 0.93 respectively. In line with this, under 4000 instances, the OSSDA method achieved an optimal accuracy of 0.967, while KNN, NB, SVM, DT, and FNC schemes attained the least accuracy values such as 0.91, 0.81, 0.76, 0.94, and 0.94 respectively. In line with this, under 6000 instances, the OSSDA algorithm achieved a high accuracy of 0.956, and other methods such as KNN, NB, SVM, DT, and FNC produced the least accuracies such as 0.87, 0.76, 0.75, 0.9, and 0.91 respectively. Meantime, with 8000 instances, the OSSDA model obtained a better accuracy of 0.961 whereas the KNN, NB, SVM, DT, and FNC techniques accomplished the least accuracy values i.e., 0.88, 0.82, 0.78, 0.935, and 0.945 respectively. Finally, with 10000 instances, the OSSDA method obtained a supreme accuracy of 0.973 whereas other methods such as KNN, NB, SVM, DT, and FNC implied the least accuracy values such as 0.9, 0.83, 0.8, 0.925, and 0.94 respectively.

Figure 7: Comparative analysis of OSSDA model
From the above-discussed results, it is apparent that the OSSDA technique produced excellent results on the applied datasets. Therefore, it can be employed as an effective tool in IoT-based healthcare monitoring and management. The superior performance of the OSSDA model is attributed to two aspects i.e., SMOTE-based class imbalance data handling and SFO-based hyperparameter tuning process.
The current research article developed a new physical health OSSDA model for IoT-based healthcare monitoring and management. The proposed method involved a pair of IoT devices for data collection. IoT device constantly collects the data from users and sends it to smartphone via Bluetooth communication module. Then the data is transmitted to a cloud-based application which process and analyze the data. The current study implemented OSSDA algorithm to determine the health condition of patients. SMOTE technique is applied to resolve the class imbalance problem in medical data after which the SSDA algorithm is also employed to classify the disease. The hyperparameters, for this algorithm, are tuned by SFO algorithm. The proposed OSSDA technique was validated experimentally and an effective performance was observed on the applied datasets i.e., diabetes and heart disease. In future, the energy efficiency of the IoT devices in smart healthcare applications can be improved.
Acknowledgement: This research work was funded by Institution Fund projects under Grant No. (IFPHI-051-130-2020.) Therefore, authors gratefully acknowledge technical and financial support from the Ministry of Education and King Abdulaziz University, DSR, Jeddah, Saudi Arabia.
Funding Statement: This project was supported financially by Institution Fund projects under Grant No. (IFPHI-051-130-2020).
Conflicts of Interest: The authors declare that they have no conflicts of interest to report regarding the present study.
1. P. Gope and T. Hwang, “BSN-Care: A secure IoT-based modern healthcare system using body sensor network,” IEEE Sensors Journal, vol. 16, no. 5, pp. 1368–1376, 2015. [Google Scholar]
2. J. W. P. Ng, B. P. L. Lo, O. Wells, M. Sloman, N. Peters et al., “Ubiquitous monitoring environment for wearable and implantable sensors (UbiMon),” in 6th Int. Conf. on Ubiquitous Computing, Nottingham, UK, pp. 7–14, 2004. [Google Scholar]
3. L. Atzori, A. Iera and G. Morabito, “The internet of things: A survey,” Computer Networks, vol. 54, no. 15, pp. 2787–2805, 2010. [Google Scholar]
4. F. Aktaş, C. Çeken and Y. E. Erdemli, “Transmission of physiological signals with quality of service support by using wireless body area networks,” in 2015 Medical Technologies National Conf., Bodrum, Turkey, IEEE, pp. 1–4, 2015. [Google Scholar]
5. M. Chen, Y. Ma, J. Song, C. F. Lai and B. Hu, “Smart clothing: Connecting human with clouds and big data for sustainable health monitoring,” Mobile Networks and Applications, vol. 21, no. 5, pp. 825–845, 2016. [Google Scholar]
6. G. Chanel, J. J. M. Kierkels, M. Soleymani and T. Pun, “Short-term emotion assessment in a recall paradigm,” International Journal of Human-Computer Studies, vol. 67, no. 8, pp. 607–627, 2009. [Google Scholar]
7. F. Bousefsaf, C. Maaoui and A. Pruski, “Remote assessment of the heart rate variability to detect mental stress,” in 7th Int. Conf. on Pervasive Computing Technologies for Healthcare and Workshops, Venice, Italy, IEEE, pp. 348–351, 2013. [Google Scholar]
8. Omnio, [Online]. Available: https://omninos.com/omnio-clone-scirpt/. Accessed on November 23, 2020. [Google Scholar]
9. Natalie (Sparacio) Hayden, “Everyday health,” [Online]. Available: http://www.everydayhealth.com/. Accessed on November 23, 2020. [Google Scholar]
10. J. V. Lee, Y. D. Chuah and K. T. H. Chieng, “Smart elderly home monitoring system with an android phone,” International Journal of Smart Home, vol. 7, no. 3, pp. 17–32, 2013. [Google Scholar]
11. Y. Zhang, H. Liu, X. Su, P. Jiang and D. Wei, “Remote mobile health monitoring system based on smart phone and browser/ server structure,” Journal of Healthcare Engineering, vol. 6, no. 2, pp. 717–738, 2015. [Google Scholar]
12. P. Pawar, V. Jones, B. J. F. V. Beijnum and H. Hermens, “A framework for the comparison of mobile patient monitoring systems,” Journal of Biomedical Informatics, vol. 45, no. 3, pp. 544–556, 2012. [Google Scholar]
13. ECG monitor qardiocore logo, [Online]. Available: https://www.getqardio.com/qardiocore-wearableecg-ekg-monitor-iphone/. Accessed on November 23, 2020. [Google Scholar]
14. Y. Huang and Q. Xu, “Electricity theft detection based on stacked sparse denoising autoencoder,” International Journal of Electrical Power & Energy Systems, vol. 125, no. 2, pp. 1–8, 2021. [Google Scholar]
15. Y. Xie, Y. Liu and Q. Fu, “Imbalanced data sets classification based on SVM for sand-dust storm warning,” Discrete Dynamics in Nature and Society, vol. 2015, pp. 1–8, 2015. [Google Scholar]
16. S. Shadravan, H. R. Naji and V. K. Bardsiri, “The sailfish optimizer: A novel nature-inspired metaheuristic algorithm for solving constrained engineering optimization problems,” Engineering Applications of Artificial Intelligence, vol. 80, no. 14, pp. 20–34, 2019. [Google Scholar]
17. P. Verma and S. K. Sood, “Cloud-centric IoT based disease diagnosis healthcare framework,” Journal of Parallel and Distributed Computing, vol. 116, no. 15, pp. 27–38, 2018. [Google Scholar]
18. P. M. Kumar, S. Lokesh, R. Varatharajan, G. C. Babu and P. Parthasarathy, “Cloud and IoT based disease prediction and diagnosis system for healthcare using Fuzzy neural classifier,” Future Generation Computer Systems, vol. 86, no. 3, pp. 527–534, 2018. [Google Scholar]
 | This work is licensed under a Creative Commons Attribution 4.0 International License, which permits unrestricted use, distribution, and reproduction in any medium, provided the original work is properly cited. |