DOI:10.32604/cmc.2021.018205
| Computers, Materials & Continua DOI:10.32604/cmc.2021.018205 | |
| Article |
Enhanced Fingerprinting Based Indoor Positioning Using Machine Learning
1Department of Electrical Engineering, National University of Sciences and Technology, Islamabad, 44000, Pakistan
2Department of Computer Engineering, National University of Modern Languages (NUML), Islamabad, 44000, Pakistan
3Faculty of Computing, Capital University of Science and Technology, Islamabad, 44000, Pakistan
*Corresponding Author: Alina Mirza. Email: alinamirza@mcs.edu.pk
Received: 01 March 2021; Accepted: 05 April 2021
Abstract: Due to the inability of the Global Positioning System (GPS) signals to penetrate through surfaces like roofs, walls, and other objects in indoor environments, numerous alternative methods for user positioning have been presented. Amongst those, the Wi-Fi fingerprinting method has gained considerable interest in Indoor Positioning Systems (IPS) as the need for line-of-sight measurements is minimal, and it achieves better efficiency in even complex indoor environments. Offline and online are the two phases of the fingerprinting method. Many researchers have highlighted the problems in the offline phase as it deals with huge datasets and validation of Fingerprints without pre-processing of data becomes a concern. Machine learning is used for the model training in the offline phase while the locations are estimated in the online phase. Many researchers have considered the concerns in the offline phase as it deals with huge datasets and validation of Fingerprints becomes an issue. Machine learning algorithms are a natural solution for winnowing through large datasets and determining the significant fragments of information for localization, creating precise models to predict an indoor location. Large training sets are a key for obtaining better results in machine learning problems. Therefore, an existing WLAN fingerprinting-based multi-story building location database has been used with 21049 samples including 19938 training and 1111 testing samples. The proposed model consists of mean and median filtering as pre-processing techniques applied to the database for enhancing the accuracy by mitigating the impact of environmental dispersion and investigated machine learning algorithms (kNN, WkNN, FSkNN, and SVM) for estimating the location. The proposed SVM with median filtering algorithm gives a reduced mean positioning error of 0.7959 m and an improved efficiency of 92.84% as compared to all variants of the proposed method for 108703 m2 area.
Keywords: Indoor positioning system; fingerprinting; received signal strength indicator; mean position error; support vector machine
Finding the location of a person can be defined as localization [1]. In ancient times, different systems were developed for localization and navigation of ships in the sea but some were capable of land navigation. In modern days, tracking an object can be considered equivalent to that. Currently, the availability of GPS on our smartphones helps us to localize our present location. Localization can be divided into self-localization and aided localization [2]. The innate ability of a person to locate his current position using natural abilities like sight, sense, hearing, etc., is defined as self-localization while making use of electronic devices to perform localization for a person is known as aided localization. Aided Localization is further classified into outdoor and indoor localization [2].
During the last decade, there has been a massive development related to the domain of localization. The expansion of modern communication technologies has resulted in widespread positioning services. In outdoor environments, adequate services have been provided by GPS for positioning and localization. GPS works efficiently with LoS and is not suitable for indoor locations because the signals do not penetrate through hard surfaces. Their attenuation and dispersion are mostly caused by the rooftops, walls, and numerous other objects. Therefore, different localization systems for indoor environments have been proposed and developed by the researchers with their pros and cons. The fingerprinting method emerges as most prominent amongst them as it provides better precision, even the practical implementation is relatively arduous, however, the working is very simple or least complex as opposed to other localization techniques. Moreover, with fingerprinting no additional equipment is needed and it can be introduced using existing infrastructure [2].
The measurement of signal power from an Access Point (AP) to a receiver that can be sampled in the WLAN environment without any additional requirement can be defined as a Received Signal Strength Indicator (RSSI). RSSI-based fingerprint positioning method uses location-dependent features and the position is estimated by using these features. Offline and online are the two phases involved in the fingerprint-based indoor positioning. During the offline step, a database is developed that has fingerprints in it where RSSI values are collected from APs at predetermined Reference Points (RPs) over a fixed time. The fingerprints stored in the database consist of the reference point position and every single RSSI value collected from each access point in Decibel Milliwatts (dBm). To successfully locate the fingerprint, it is important to apply some pre-processing techniques on the RSSI readings because of the noise present in the environment. In the online phase, RSSI readings from APs at random RPs are taken by the mobile users in the form of queries. Their suitable location would ultimately be determined by the machine learning algorithms through fingerprint matching. Mean position error is attained as a result of the difference between the actual and predicted location of a user in motion [3]. The baseline working of the Wi-Fi fingerprinting method is depicted in Fig. 1.
The main contributions of this paper are as follows.
• We have proposed a solution for indoor localization where mean and median filtering techniques are used as pre-processing techniques with the machine learning algorithms (kNN, WkNN, FSkNN, and SVM) to enhance the localization accuracy and efficiency of an IPS.
• Large training sets are key for obtaining better results in machine learning problems. Therefore, we have used the largest database available online created by authors in [4] and further processed it by applying the mean and median filtering.
• Outliers were removed from the database after the proposed pre-processing techniques and then machine learning algorithms were used to estimate the position of a mobile user.
• Moreover, to validate the superior performance of the proposed solution, a comparative analysis was done where machine learning algorithms were compared with one another with mean, median, and without filtering.
• The results have shown that the proposed SVM with median filtering algorithm outperformed other investigated machine learning algorithms with mean and median filtering.
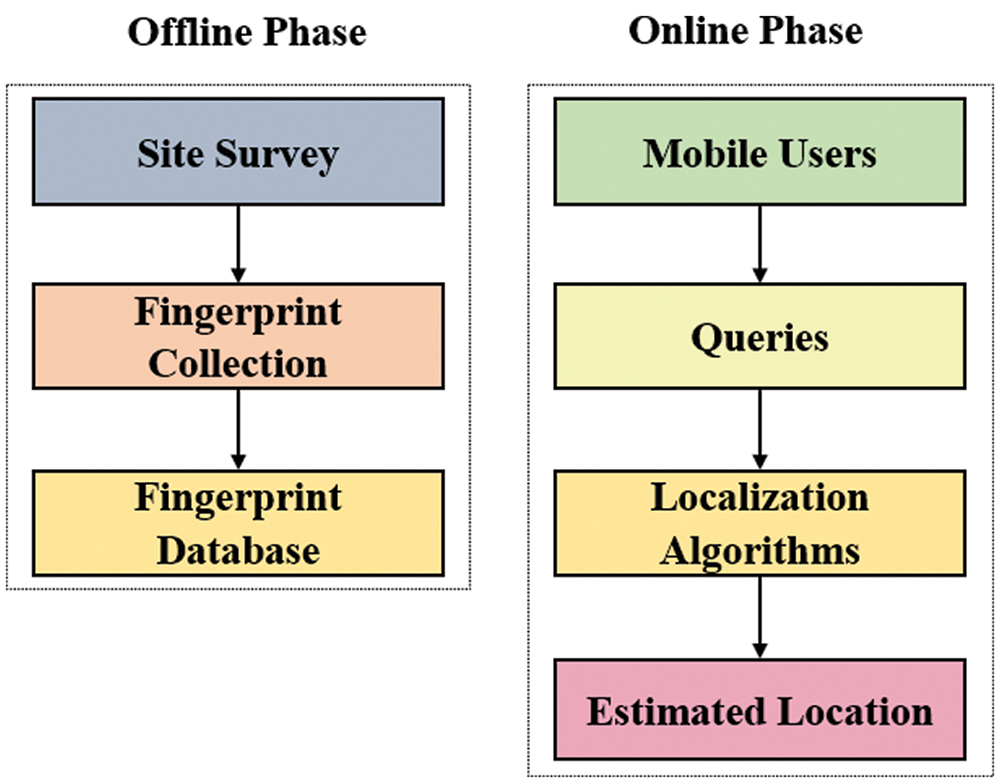
Figure 1: Wi-Fi fingerprinting method
The remaining paper is organized as: Section 2 briefly discusses the related work. Section 3 explains the pre-processing techniques and machine learning algorithms. The proposed model is elaborated in Section 4 followed by the simulation results and it`s discussion in Sections 5 and 6. Section 7 summarizes the paper as conclusions.
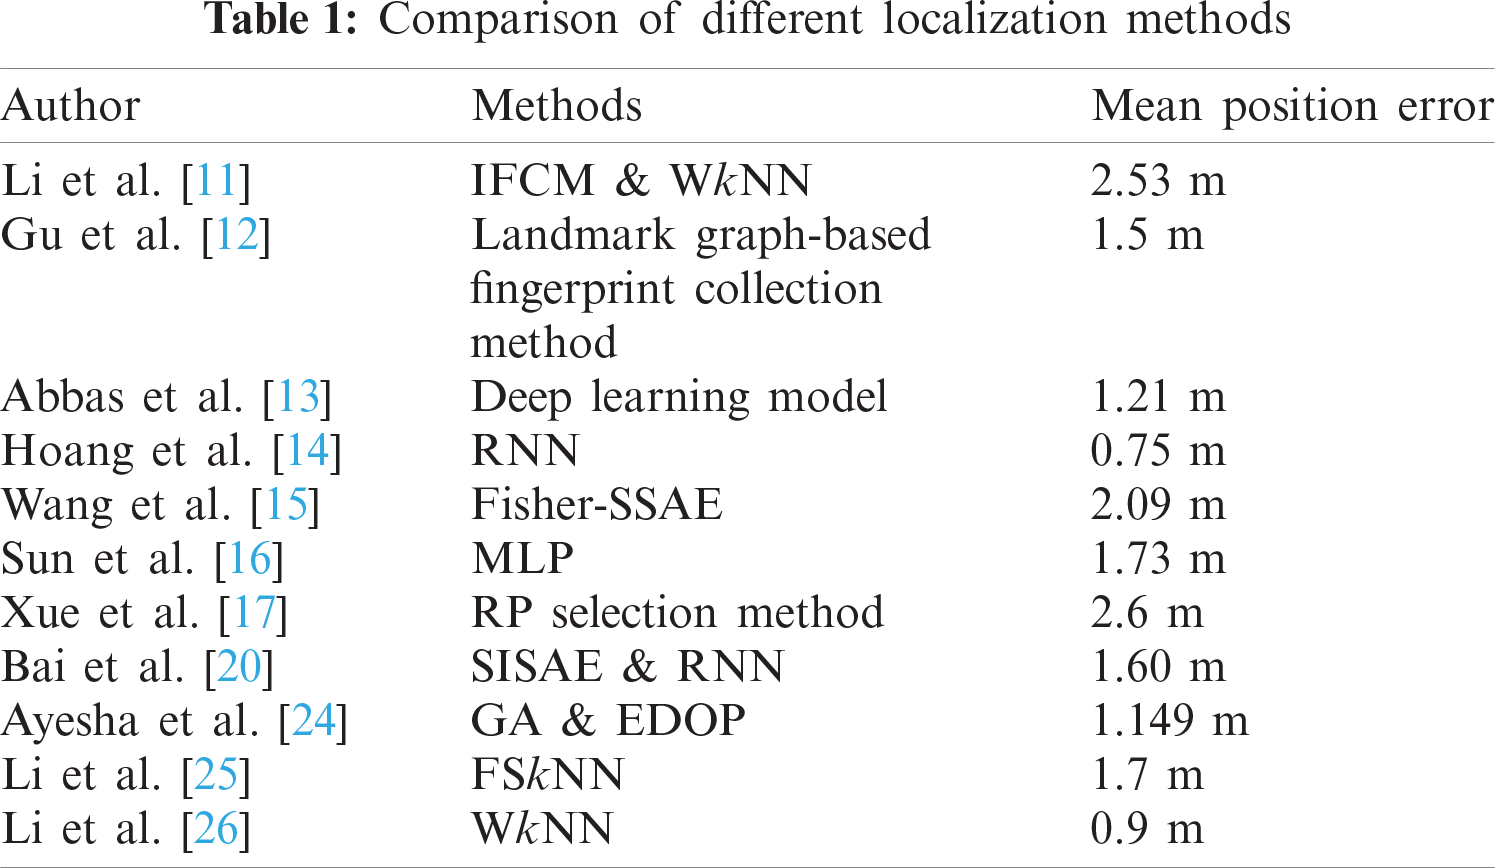
The collection of wireless signal samples as fingerprints from nearby Wi-Fi APs is the most popular method for an IPS [5–8]. The k-Nearest Neighbors (kNN) algorithm was initially used in RADAR for indoor positioning that takes k RPs with the least signal distance between the unspecified RSS vector of the online user and the identified location databases [9,10]. Li et al. [11] proposed the Improved Fuzzy C-Means (IFCM) algorithm for the regional division in the offline training phase as well as the Pearson Correlation Coefficient (PCC) based weighted k-Nearest Neighbor (WkNN) algorithm in the online positioning phase, achieving a mean positioning error of 2.53 m. However, the proposed model didn't discuss the optimization of the deployment strategy of APs according to the actual environment to maximize the discrimination of fingerprints in each region. In [12], a landmark graph-based fingerprint collection technique was suggested to automatically connect the collected fingerprints that do not require active user participation and achieved an average positioning error of 1.5 m. Moreover, this model may fail in open large indoor areas where spatial constraints are insufficient. Abbas et al. [13] integrated a stacked de-noising deep learning model of auto-encoders and a probabilistic technique for minimizing noise, obtaining the mean position error of 1.21 m. However, its performance may not be robust to different devices and different densities of APs in different environments. Hoang et al. [14] suggested Recurrent Neuron Networks (RNNs) using Wi-Fi fingerprinting for indoor localization, where the solution aims to position the trajectory instead of finding the position of the user one at a time. For both input RSSI data and sequential output positions, a weighted average filter was suggested, achieving an average position error of 0.75 m. These results were however obtained in a relatively smaller indoor environment. In [15], an extraction of fingerprint features known as the Fisher Score-Stacked Sparse Auto-Encoder (Fisher-SSAE) technique was proposed building a hybrid localization model to prevent major coordinate localization errors accredited to sub-regional localization errors obtaining a mean position error of 2.09 m. However, the positioning moving target was not taken into account in this study. Sun et al. [16] suggested a new accurate machine learning algorithm that first uses RSSI to encode the monitoring area and then grid regions are trained using Multi-Layer Perceptron (MLP), reducing the size of the fingerprint database by more than 80% with enhanced localization accuracy. An enhanced neighboring RPs selection method for Wi-Fi-based indoor localization was suggested in [17]. To enhance their selection phase, the physical distances between the test point and the neighboring RPs are used to cluster k's nearest neighbors. A mean position error of 2.6 m was obtained using the proposed algorithm that outperformed the standard kNN, WkNN, and TPIC algorithms. Moreover, no pre-processing techniques were applied in the proposed model. Zhang et al. [18] suggested a new deep learning architecture based on fingerprint-based localization under commercial Long-Term Evolution (LTE) systems. The Channel State Information (CSI) is collected from LTE base stations and the multiple positioning estimates are assembled by a time-domain fusion approach obtaining a mean position error of 0.47 m with only 15 RPs in an indoor environment. Authors in [19] proposed Data Rate (DR) fingerprinting to achieve passive localization where DRs were used to replace the RSSI to form the fingerprints. However, optimizing the distribution of RPs was not discussed in the study as localization accuracy is highly related to the distribution of RPs. Bai et al. [20] proposed a Wi-Fi fingerprint-based indoor mobile user localization method that integrates a Stacked Improved Sparse Auto-encoder (SISAE) and a recurrent neural network obtaining a mean position error of 1.60 m. However, these algorithms were applied for dimension reduction of RSSI features and may not be suitable for the scenarios with a few deployed APs. In [21], a method is devised which learns to localize with high accuracy while minimizing the total number of processes based on reinforcement learning. The MIT campus dataset is trained on the proposed model and its superior performance is validated by comparing it with state-of-the-art techniques. In [22], a semi-supervised deep reinforcement learning model is proposed which fits smart city applications as it consumes both labeled and unlabeled data to improve the performance and accuracy of the learning agent. The proposed model learns the best action policies resulting in a close estimation of the target locations with an improvement of 23% in terms of distance to the target and at least 67% more received rewards compared to the supervised deep reinforcement learning model. In [23], a fingerprinting-based kNN and lateration based Minmax position estimation hybrid technique is proposed. This hybrid approach utilizes Euclidian distance formulation for distance estimates rather than indoor radio channel modeling which is used to convert the received signal to distance estimates. Simulation results validate the superior performance of the proposed hybrid approach in terms of mean error compared to investigated approaches. However, adaptive filters can also be applied to further minimize the errors in the offline phase that will eventually increase positioning accuracy. Another technique by combining the capabilities of different algorithms for AP deployment and AP selection processes was proposed in [24]. Moreover, the Genetic Algorithm (GA) coupled with Enhanced Dilution of Precision (EDOP) is used for the deployment of an additional AP in the already existing infrastructure, while the AP selection is implemented using Position Vectors (PV) based algorithm significantly improving the performance of an IPS. Li et al. suggested a Feature Scale k-Nearest Neighbor (FSkNN) algorithm in [25] to improve localization accuracy when a new model is created, including a scaling RSS level for measuring efficient signal distances between a signal vector and fingerprints in the radio map that achieve an average position error of 1.7 m. RSS level is used for the measurement of efficient scalable signal distances. However, multipath fading was a major concern in their findings which can vary the RSS values. In [26], a new approach is suggested to improve the accuracy of the WkNN algorithm by 33.82% by changing the weight of the neighboring reference nodes obtaining a mean position error of 0.9 m in a relatively small indoor environment with few RPs. A comparison of different localization methods is shown in Tab. 1.
Mean filtering is one of the pre-processing techniques that is used to minimize the noise in the RSSI database. It plays a vital role in the indoor positioning system as it takes an average of the recorded RSSI samples thus, minimizing the effect of environmental factors. Mean filtering is applied to the database before the online phase where machine learning algorithms are used [1–3]. Mean
where ∑ X the sum of all the x values and N is the number of x values.
Consider a case when an extreme value ‘y’ is added to the data set due to noise. Then Eq. (1) becomes:
Eq. (2) shows that if y > 0 then,
Median filtering is used to remove outliers from the recorded RSSI values. By applying median filtering, the RSSI values on a current reference point, from a particular access point are arranged in ascending order, and the median is calculated. If the number is odd then simply the central value is taken as median but if the number is even then the median is the average of the two central values.
If ‘n’ is odd, then median is given by:
However, if ‘n’ is even, we have:
Consider two cases when an extreme value ‘y’ is added to the data set due to noise. Then Eqs. (3) and (4) becomes:
From Eqs. (5) and (6), we can observe that the median remains unchanged when an extreme value is added to the data set. The samples are arranged in either ascending or descending order and extreme values are never used while calculating the median. Therefore, median filtering is immune to outliers.
3.2 Machine Learning Algorithms
3.2.1 k-Nearest Neighbor (kNN) Algorithm
For supervised machine learning, the kNN algorithm can be deployed to unravel the problems related to both classification and regression. It determines the location through the distance between patterns and reference patterns present in the database. Various formulas can be used for distance calculation, e.g., Manhattan distance or Euclidean distance. Depending on their reciprocal distance, it decides the best matching fingerprints and averages the position of the same k patterns. Before that, the reference points relating to these k fingerprints are used to find the position predicted [25]. To find the difference between the RSSI vector being assessed and one of the fingerprints, the vectors thus serve as the main component in pattern matching algorithms. We can also say the similarity between the two matching objects is essential. Euclidean distance can be calculated according to Eq. (7).
Let (RSS1, RSS2, …, RSSN) represent an RSS vector reported by a mobile station (MS) for localization, where RSSx represents the RSS value received from the xth AP by the MS. The distance can be calculated as:
where the mean RSS value received at the mth RP (1 ≤ m ≤ M) and nth AP (1 ≤ n ≤ N) with M and N representing the total number of RPs and APs, respectively is represented by RSSIm,n. The fingerprint associated with the mth RP is represented by the mth row, which has a known location in terms of coordinates.
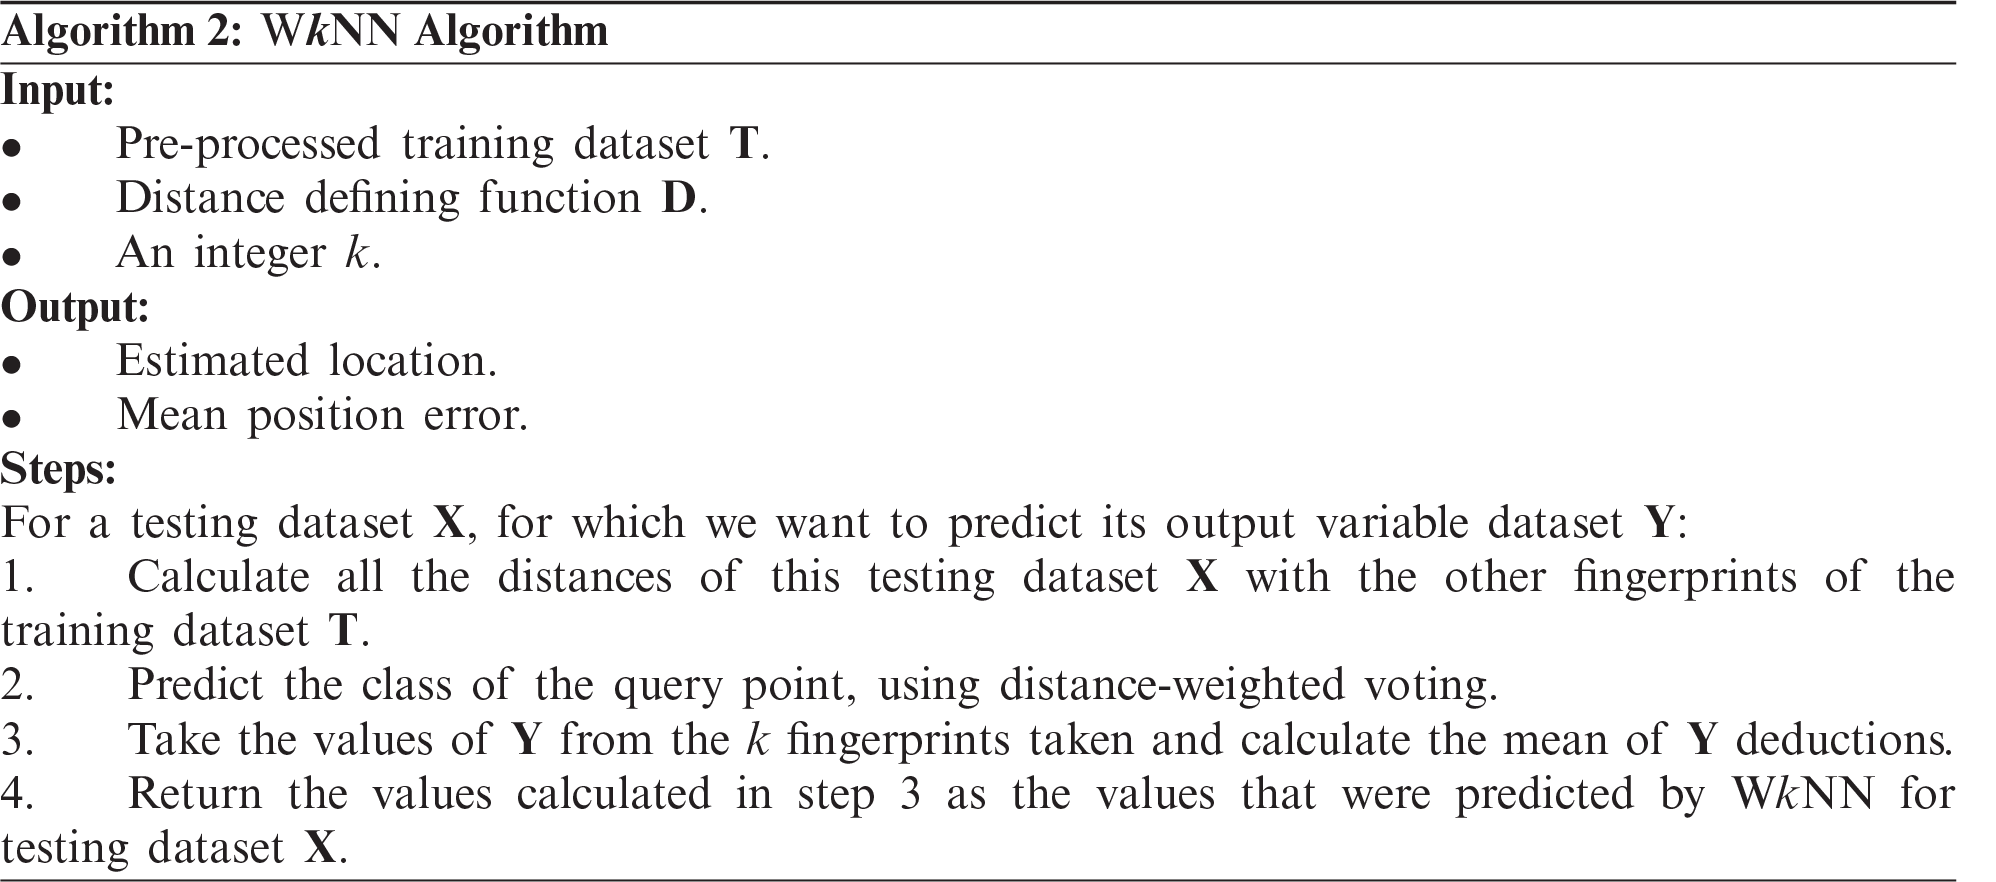
3.2.2 Weighted k-Nearest Neighbor (WkNN) Algorithm
Weighted kNN is a modified version of k nearest neighbors. Weight is calculated based on the weighting function which is the reciprocal of the distance between the neighbors. The choice of the hyper parameter k is one of the many limitations that influence the kNN algorithm's efficiency. The algorithm may become more vulnerable to outliers when the value of k is very small. Too many points may be included in the field from other groups when k is very high. Another problem is the way to incorporate class names. The simplest technique is for majority voting, however, if the closest neighbors are far different from each other and the closest neighbors display the object's class more precisely, it could be a problem [26].
Assuming that there are M RPs and N APs, the signal strength vector of ith RP is RSSi = RSSi1, RSSi2,…, RSSij,…, RSSiN, where i = 1, 2,…, M and j = 1, 2,…, N and the fingerprinting database is formed by all the vectors. Suppose RSSun = RSS1, RSS2,…, RSSj,…, RSSNis the RSSI vector measured from all the APs on the unknown points. The distances between RSSunand all the RSSiare calculated with Eq. (8) to obtain the location of this unknown point (UP), where Manhattan distance (or sum of absolute differences, SAD) is represented by q = 1 and Euclidean distance (or sum of the squared differences, SSD) is represented by q = 2 respectively.
The minimum distance of k is then chosen for the next step in all Di. An UP's coordinate can be represented by:
The coordinates of UP and the corresponding RP are respectively denoted by Cun and Ct. The WkNN algorithm assigns a weight according to the distance value to each coordinate. The weight Wi of the ith selected RP can be calculated as:
For WkNN, Eq. (9) is updated as:
3.2.3 Feature Scaling Based k-Nearest Neighbor (FSkNN) Algorithm
FSkNN algorithm introduces RSS level-based scanning to calculate the effective signal difference between various signal vectors during the corresponding synchronization [25,27]. d′mshows the fingerprint attached to the mth RP and an appropriate signal distance between the online applications to measure it by:
The quantity of the effective RSS distance is being shown by scaling the weight function w(.). At the RSS level of RSSl, one unit of RSS shift is comparable and it must also be noted that its esteem can differ from the actual RSS. The effective distance of the signal is computed by Eq. (12) in such a way that the relation between actual signal distance and geometrical distance is explained in a better way. In a complex indoor environment, it is hard to provide a closed-form expression for w(.) In such a simulation model, the scenario is treated by dividing the entire RSS plane equally into n (n ≥ 1) intervals, after which a single fixed value as a scaling weight for each interval is calculated after precise measurements and repeated tuning. If the value of n is equal to 1, then the FSkNN model will be degraded to the kNN model. RSS-value-to-scaling-weight plotting is therefore known as a type of a step function, such as:
where x represents the RSS value and the scaling weight at RSS vector (x) for an actual difference of the signal is represented by w(x). Let Ai is the ith RSS break 1 ≤ i ≤ n, for that Ai interval with αi as the coefficient. The sign function xi (x) of the same interval Ai, is expressed as:
If a value of RSS (x) lying in the interval Aiis collected by the mobile station then, from Eq. (14), Xi (x) will be equal to one while all other values i.e., Xi (x) having position j ≠ i, equal to zero. After that, the accomplished outcome w(x) from Eq. (14) (equivalent αi) is used to measure the distance of the effective signal in Eq. (13) as a scaling weight for RSS value x.
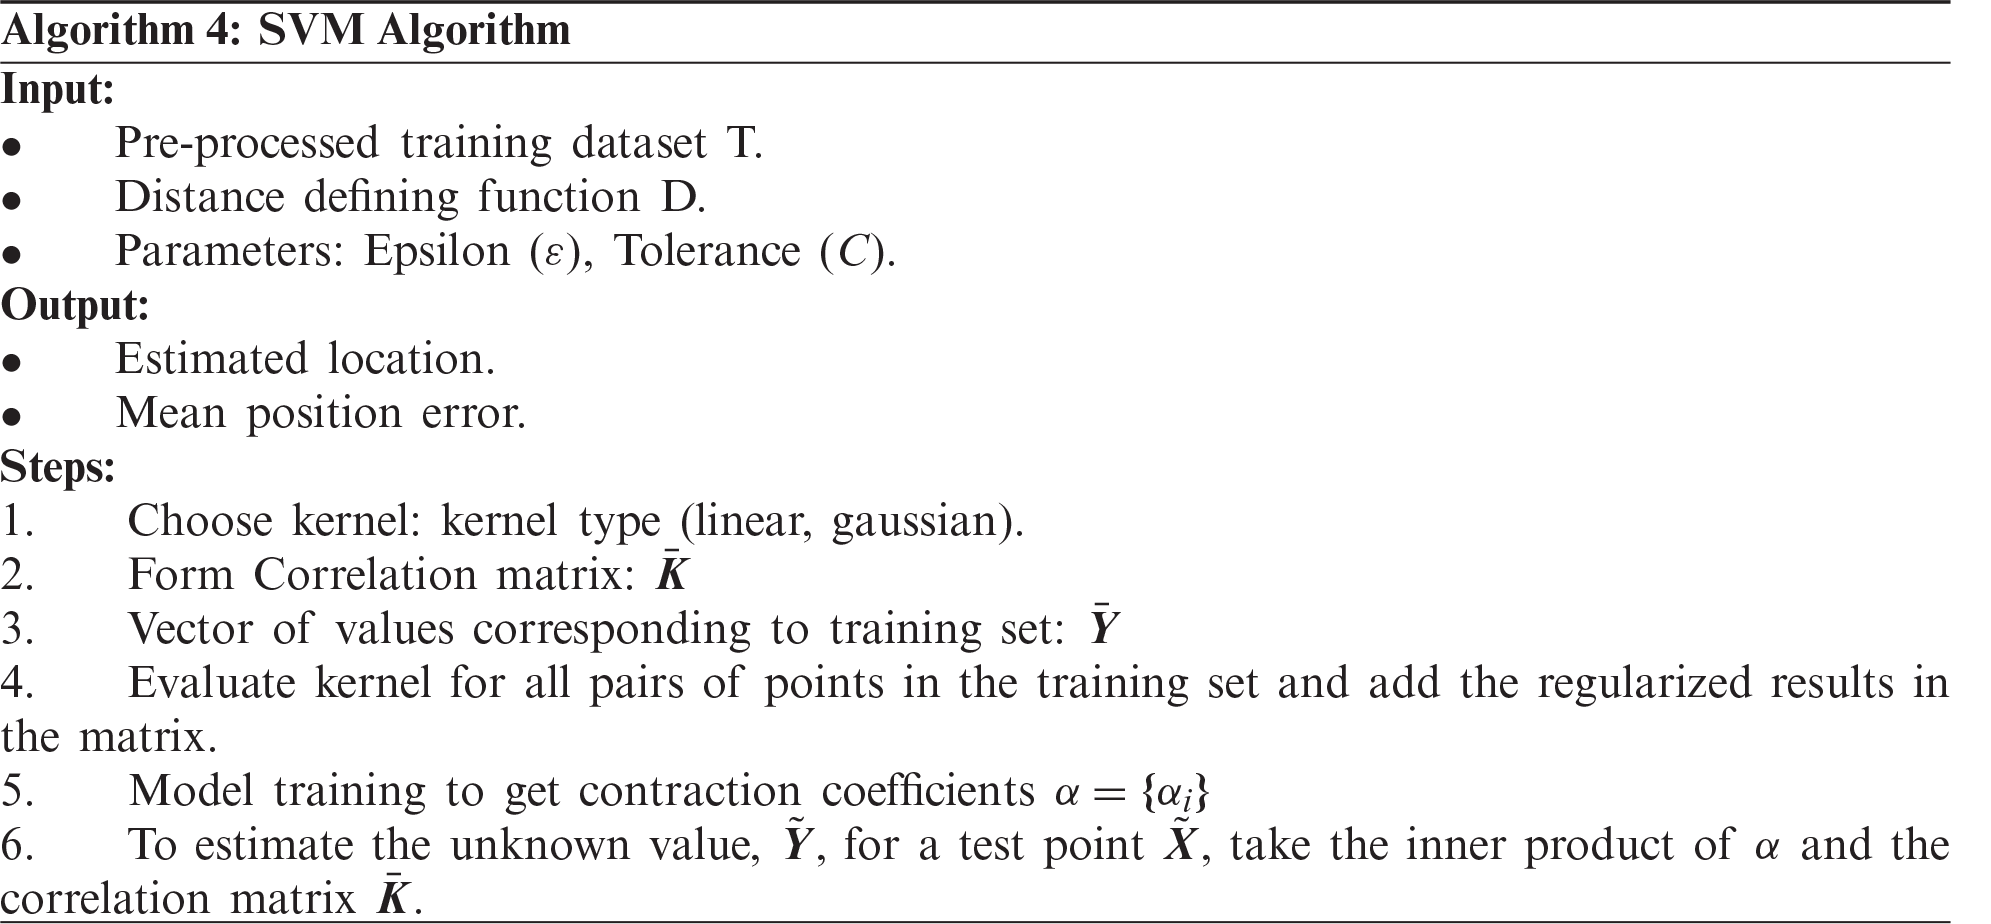
3.2.4 Support Vector Machine (SVM) Algorithm
SVM has become popular due to its classification/regression effect, a relatively new multivariate statistical approach. A support-vector network that can be used for supervised learning models is a classic support SVM. This model is a binary, non-probabilistic classifier that can be used to classify the hyperplane that distinguishes the training set's classes. It is possible to evaluate the predicted mark of a previously unobserved data point by the side of the hyperplane it falls on [28].
SVM is an exceptional supervised learning model that can handle high-dimensional data sets effectively [28]. Support vectors that can categorize every new data point in the network are the training points. Not only can SVMs perform binary classification, but they can also do multiclass classification. Non-linear classification can also be carried out by SVMs, which can help find the hyperplane of a non-linear operating input vector. An input variable can be mapped into a high-dimensional space for features.
A linear support vector regression challenge may be designated as a restricted optimization problem defined as [27].
where w is the standard hyperplane vector, b is the hyperplane offset control parameter, ɛ controls the width of the ɛ-insensitive zone, used to fit the training data. The value of ɛ can affect the number of support vectors used to construct the regression function. The value of epsilon determines the level of accuracy of the approximated function. It relies entirely on the target values in the training set. If epsilon is larger than the range of the target values, we cannot expect a good result. If epsilon is zero, we can expect overfitting. Choosing epsilon to be a certain accuracy does of course only guarantee that accuracy on the training set; often to achieve a certain accuracy overall, we need to choose a slightly smaller epsilon. Therefore, ɛ = 0.1 was chosen as it gives the best results as reported in [28]. The degree of the penalty for the violation is defined by the parameter C > 0. Besides, the parameter C is a hyperparameter that is chosen either by cross-validation or by Bayesian optimization.
The proposed model suggests using mean and median filtering as pre-processing techniques with the investigated machine learning algorithms (kNN, WkNN, FSkNN, and SVM) to improve the efficiency of an indoor positioning system. The block diagram of our proposed model is shown in Fig. 2.
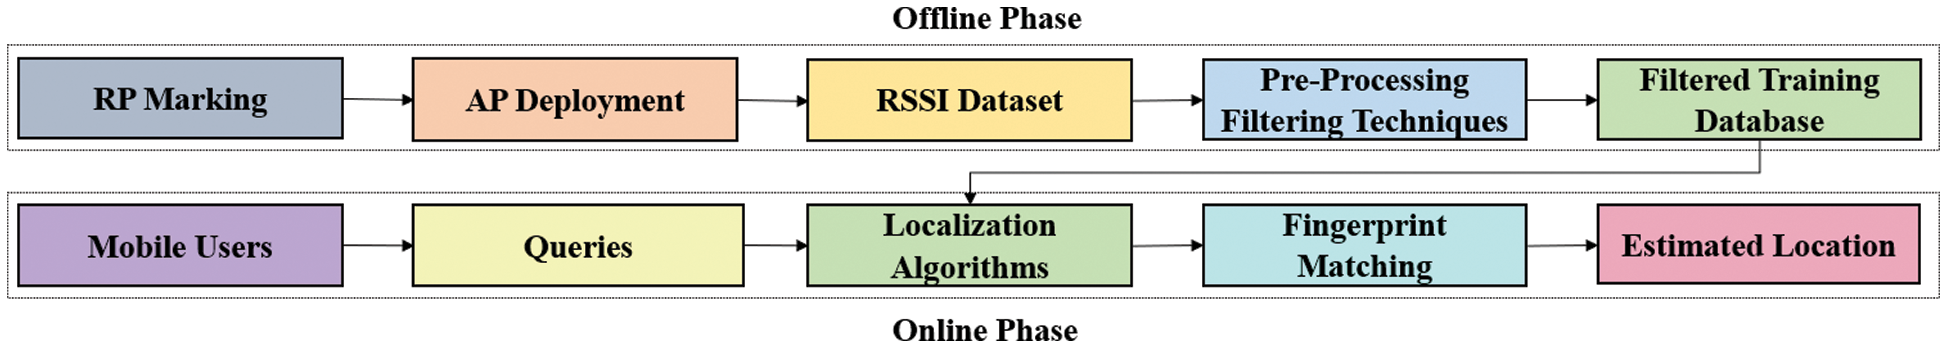
Figure 2: Proposed model block diagram
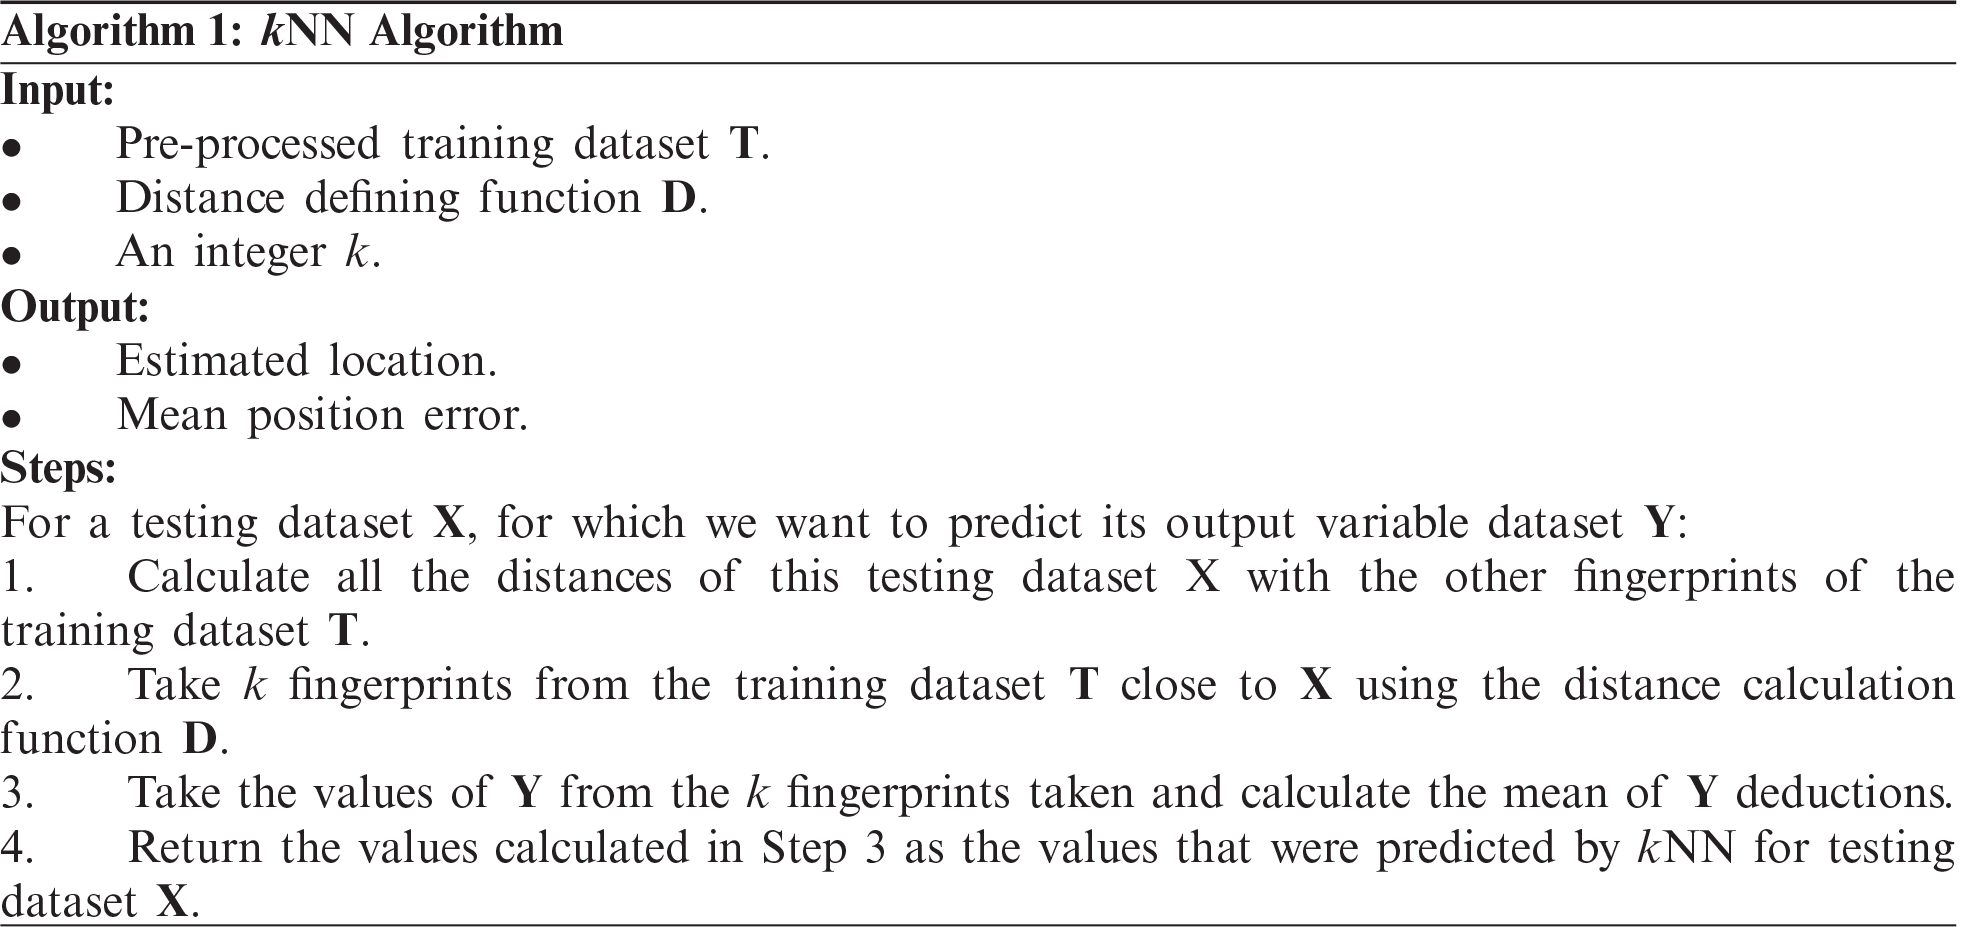
The pseudo-code of the kNN algorithm for the proposed model is shown below:
For the weighted kNN, any function may be used as a kernel function whose value decreases as the distance increases. The inverse distance function is the simplest function used for this purpose. The pseudo-code of the WkNN algorithm for the proposed model is shown below:
The pseudo-code of the FSkNN algorithm for the proposed model is shown below:
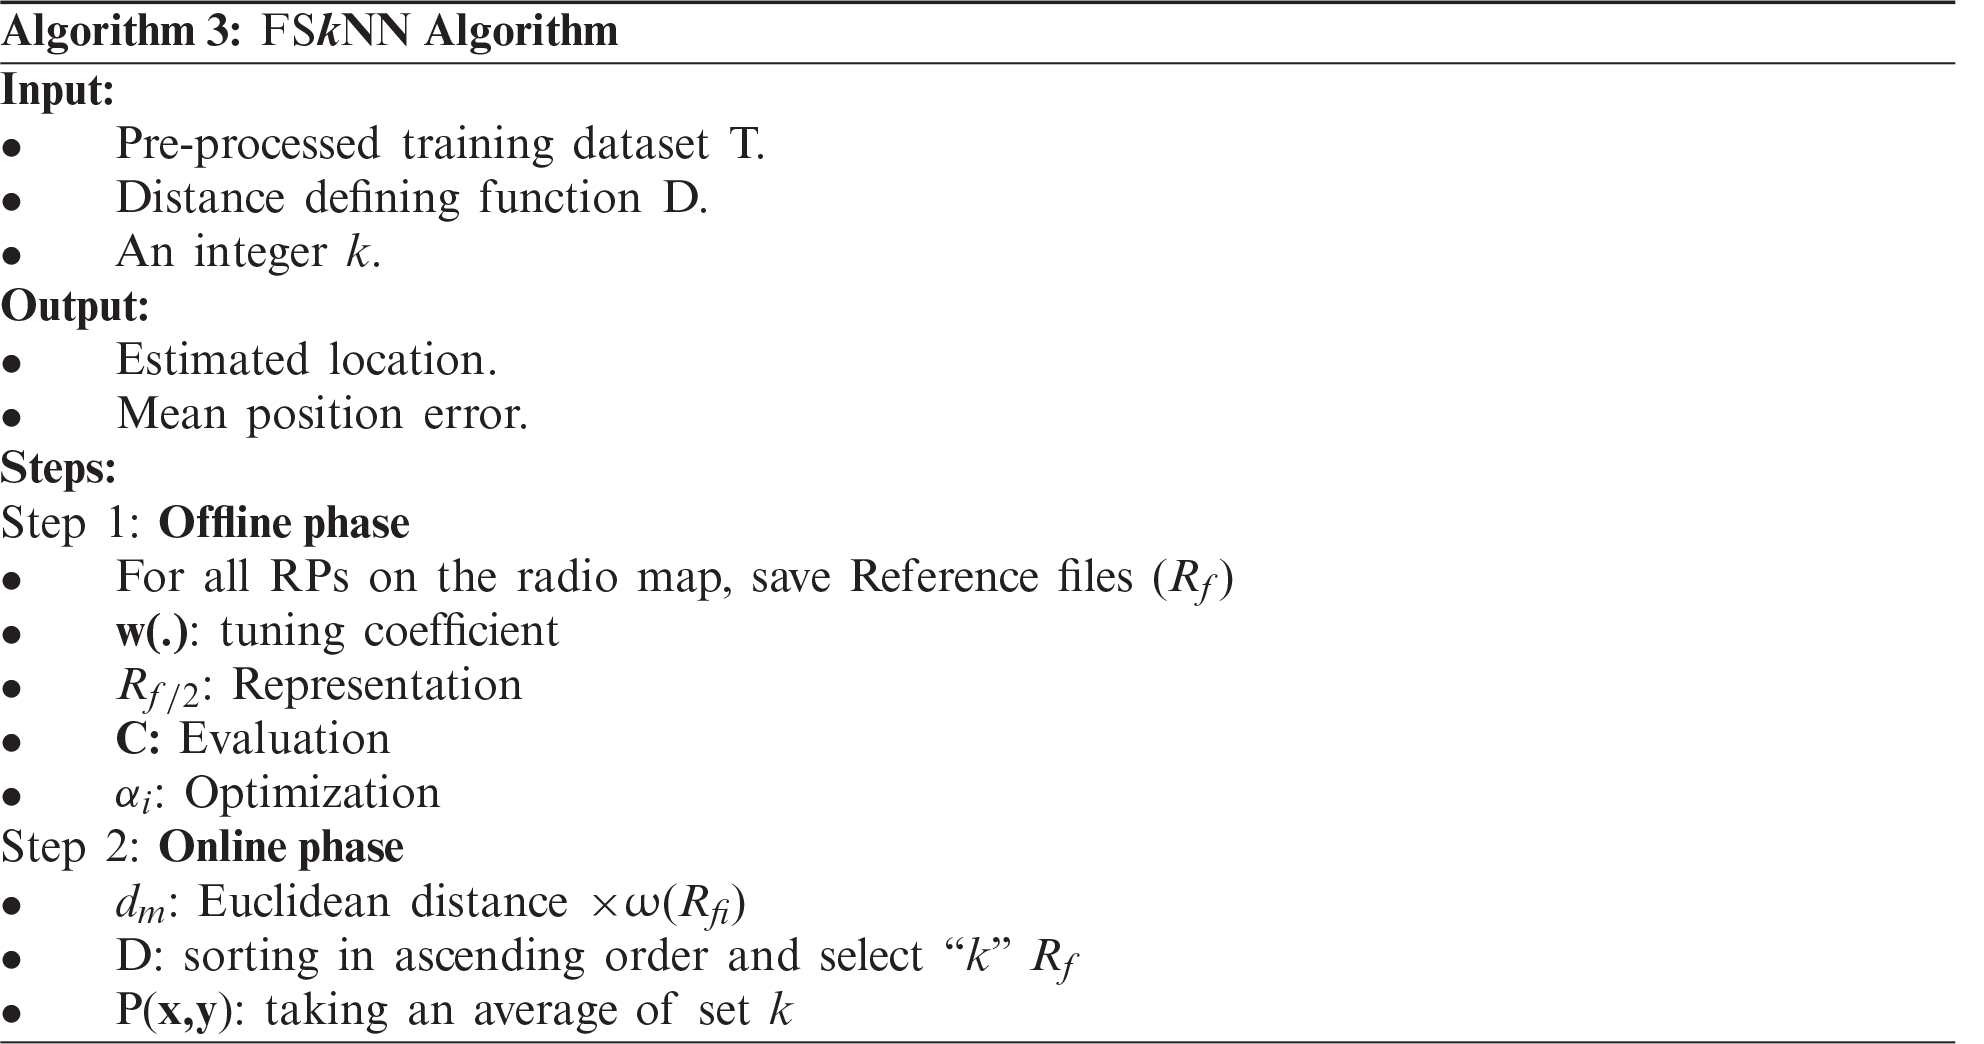
Representation, evaluation, and optimization are the three stages of the FSkNN model. In representation, a filtered training set prepared the fingerprints with known coordinates for localizing a mobile user with an unknown position. The testing set was used for iteratively evaluating the localization performance of adjusted coefficients obtained during different iterations. The sum of distance errors denoted by cost based on the testing set was calculated by Eq. (16) for each set of coefficients obtained in the evaluation phase.
where m is the total no of features and xi and yi are the actual coordinates of the ith element in the testing set. The RPs present in the testing set was taken as anonymous locations in the evaluation process. Larger sum results in greater accuracy of the positioning. Thus, the optimal solution is obtained by using coefficients to make cost = 0. In optimization, new coefficients were searched by simulated annealing (SA) for obtaining better accuracy. Coefficients were changed randomly during each iteration. This whole process continued until the iteration number reached a pre-set maximum number.
Support Vector Regression (SVR) is quite distinct from other models of regression. To predict a continuous variable, it uses the SVM algorithm. SVR tries to fit the best line within a predefined or threshold error value while other linear regression models attempt to minimize the error between the predicted value and the actual value. The pseudo-code of the SVM algorithm for the proposed model is shown below:
The system parameters for an indoor simulation environment have been listed in Tab. 2. The total area of the real-world environment is 108703 m2 along with 933 RPs and 520 APs. The RSSI values are the negative integer values that are measured in dBm (−100 dBm is considered as a very weak signal while 0 dBm is an extremely good signal). It is very important to deploy access points at suitable positions so that the RSSI signal from every AP is received at the current RP. When no signal is received at the given RP then that signal is simply replaced by −100 dBm in the database. Each reading represents the real-world coordinates using three values, the longitude and latitude coordinates, and the building floor.
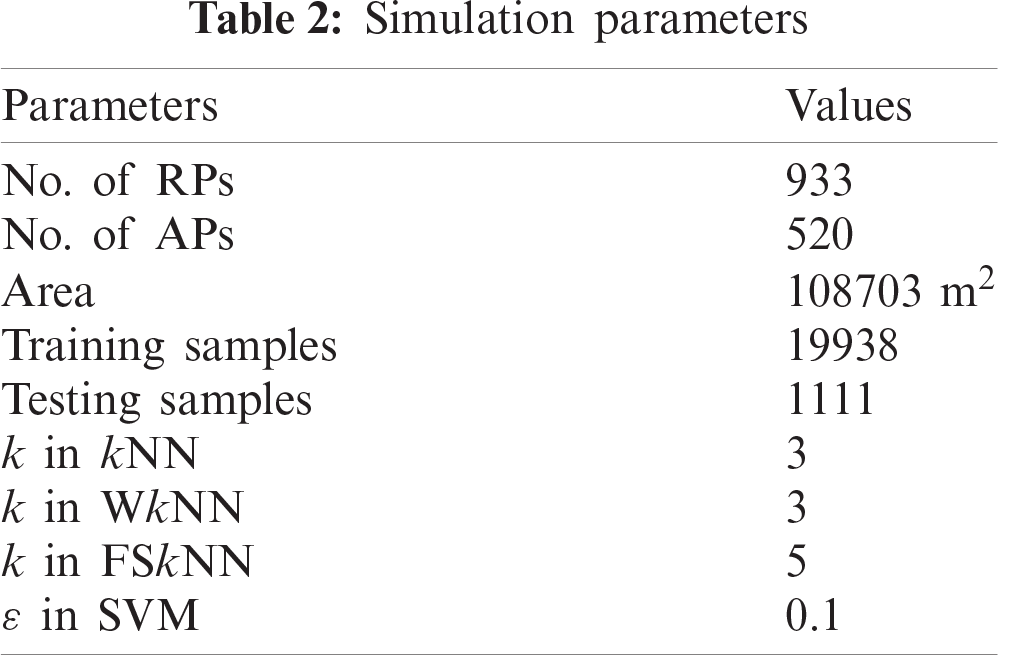
Fig. 3 shows the map of the Jaume I University (UJI) Campus where red, green, and blue refer to the multi-floor TI, TD, and TC buildings respectively. A reference point is represented by the blue dot on the interior of a TI building.
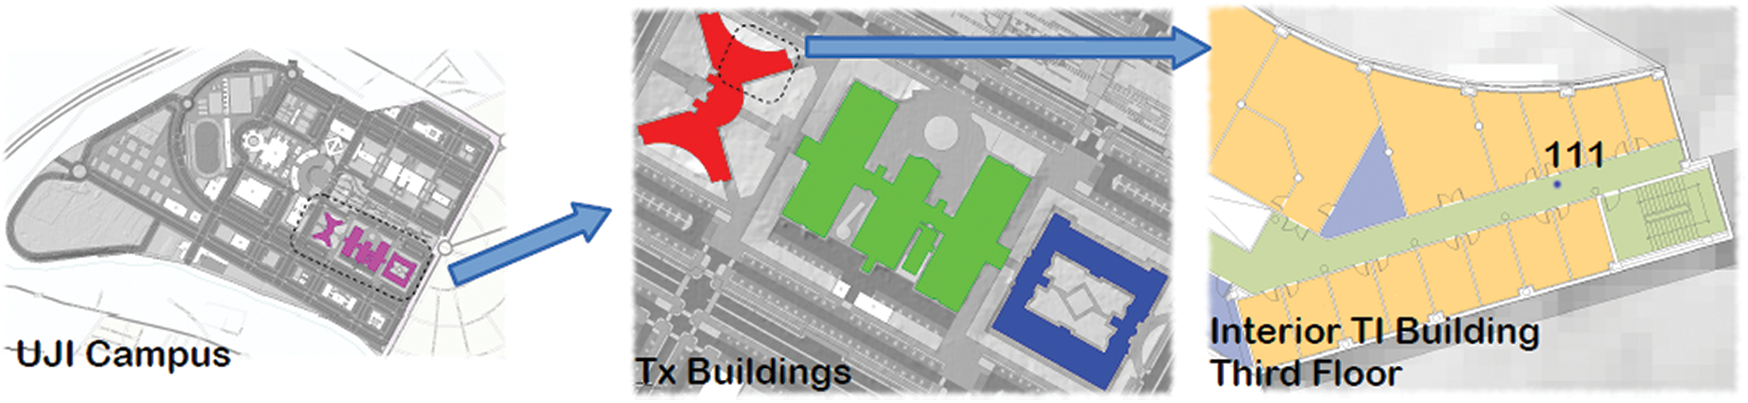
Figure 3: Map of UJI campus
Data were collected by more than 20 users using 25 different mobile devices [4]. An android application CaptureLoc was developed in [4] to take readings for the offline phase. All the required information is gathered by this application and then sent to a centralized server where it is stored permanently. Due to the challenge of the WLAN signal propagation [29], this phase is automatically repeated 10 times for every captured spot. To choose the user identifier and the position where the capture is taken, the user interface framework is essential. Fig. 4 shows the user-device interaction. Capturing is done (red circle) on the left when the button, Send Fingerprint, starts the collection and send procedure. Four errors are reported on the right side as a result of the capturing phase when the location is not captured correctly.
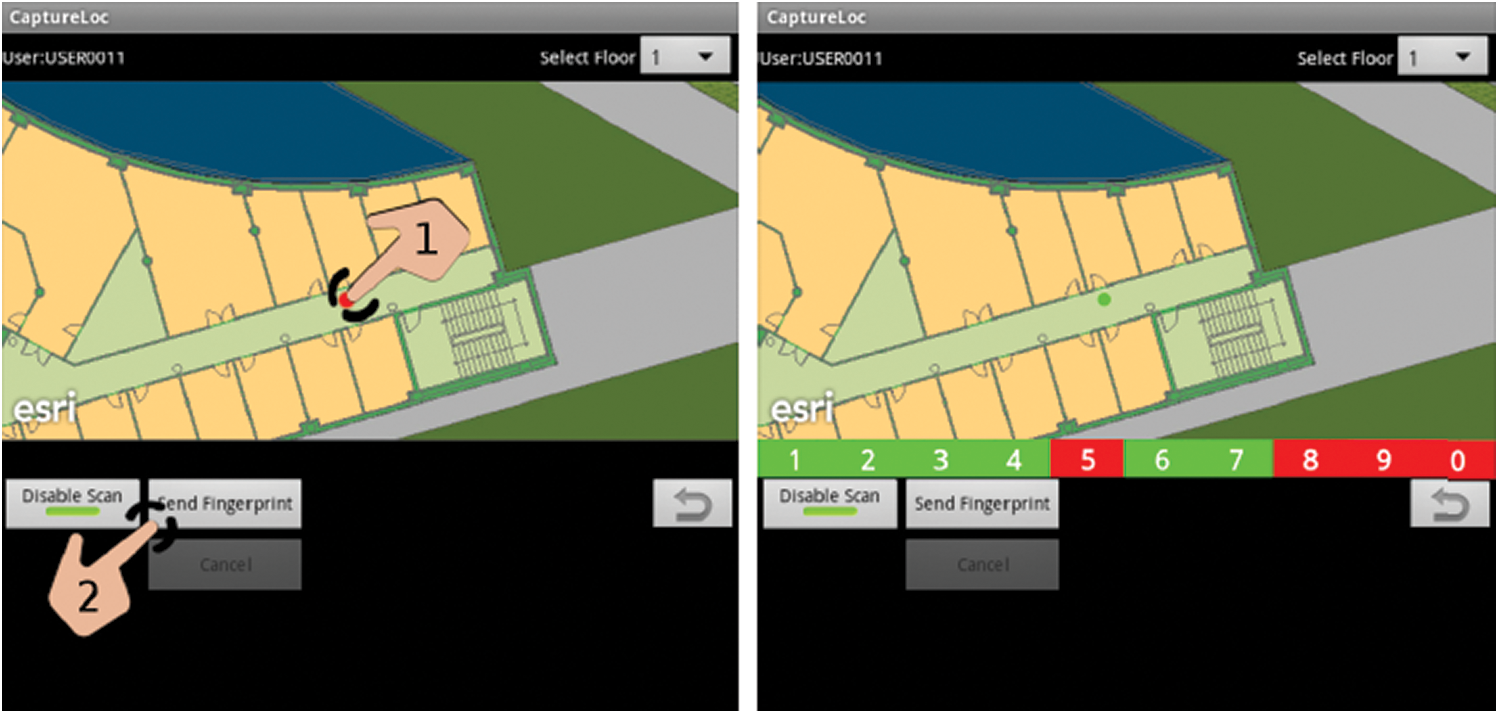
Figure 4: User-device interaction using CaptureLoc
To create the training set, all the closed spaces of the three buildings (offices, laboratories, classrooms) were deemed valuable locations for capturing. Then, for all the considered closed spaces, an RP is chosen inside each space and at least one RP outside each space (i.e., in corridors). At the center of the closed space, the point inside the space is located, while the outside point is located in front of the door. One RP was chosen for each entry if there are several accesses (door). A graphical example of the positioning and location of the RPs has been shown in Fig. 5. Red points are the points within closed spaces where RPs took before the door are blue points (outside the spaces).
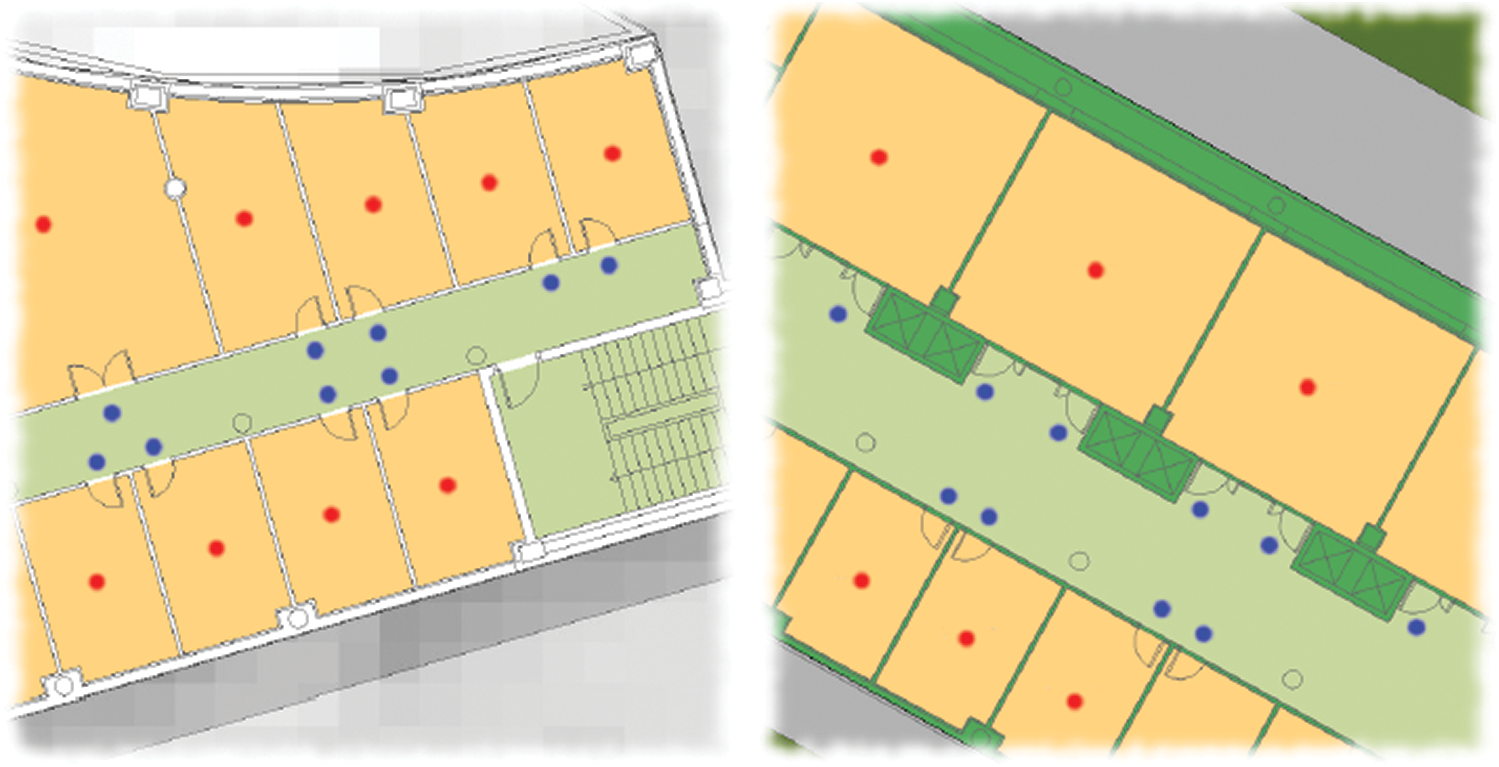
Figure 5: RP positioning
ValidateLoc, an android application created in [4], to further collect the validation points. The operation phase is performed by the application by sending the necessary information from a centralized server (only APs detected and RSSI levels) and it gets a point inside a building (due to its longitude, latitude, floor) from the server. The application validates the location from the user. If the location is correct, the Wi-Fi fingerprint will be sent to the server and is stored in a predicted location. The application would otherwise ask the user for the exact location and the information is submitted to be processed on the server-side. An execution example of ValidateLoc is shown in Fig. 6. The first picture displays the location and queries the user if the location is right. The second image tells the user of the successful entry of the fingerprint validation into the server. The blue point represents the expected location whereas, the position assigned to the fingerprint is represented by the green dot.
In this section, simulation results of the pre-processing techniques used with the investigated machine learning algorithms (kNN, WkNN, FSkNN, and SVM) are compared with one another. MATLAB software (R2016a) is used for simulation purposes.
The standard metric for performance evaluation of IPS algorithms is localization accuracy and precision. Localization accuracy is defined as the mean position error diverged from actual location whereas the distribution of positioning errors is considered as positioning precision [30].
The cumulative distribution function (CDF) of kNN, WkNN, FSkNN, and SVM algorithm with mean, median, and without filtering is shown in Figs. 7–10 respectively.
Fig. 7 illustrates that kNN using median filtering outperforms kNN with mean filtering and without filtering. The mean position error obtained with median filtering is 4.2581 m as compared to the mean position error of 5.0896 m and 5.9638 m with mean and without filtering. So, it is clear that median filtering when used with un-filtered kNN, the mean position error is improved by 28.6%.
In Fig. 8, WkNN using median filtering outperforms WkNN with mean filtering and without filtering. The mean position error with median filtering is 2.7604 m as compared to the mean position error of 3.1511 m and 3.7602 m with mean and without filtering. So, it is clear that median filtering when used with un-filtered WkNN, the mean position error is improved by 26.59%.
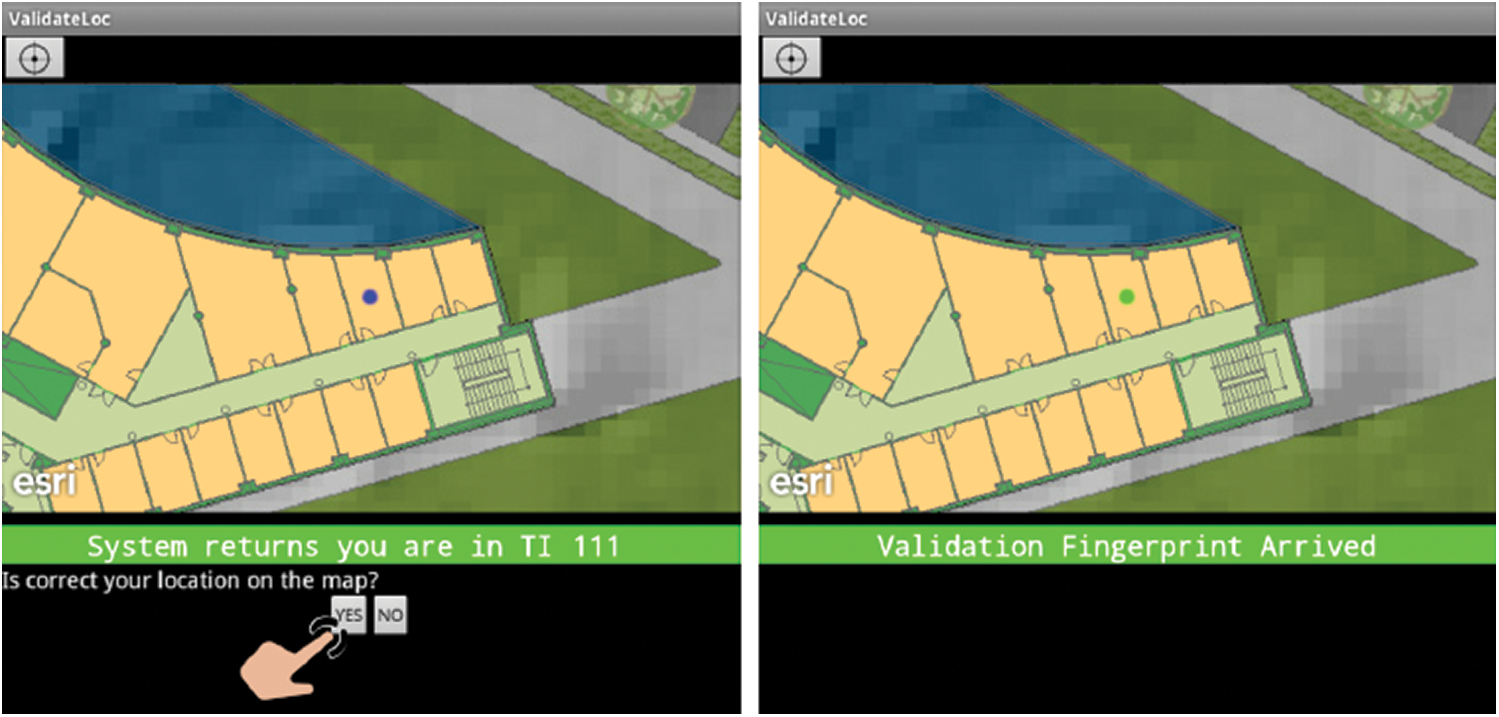
Figure 6: ValidateLoc phase
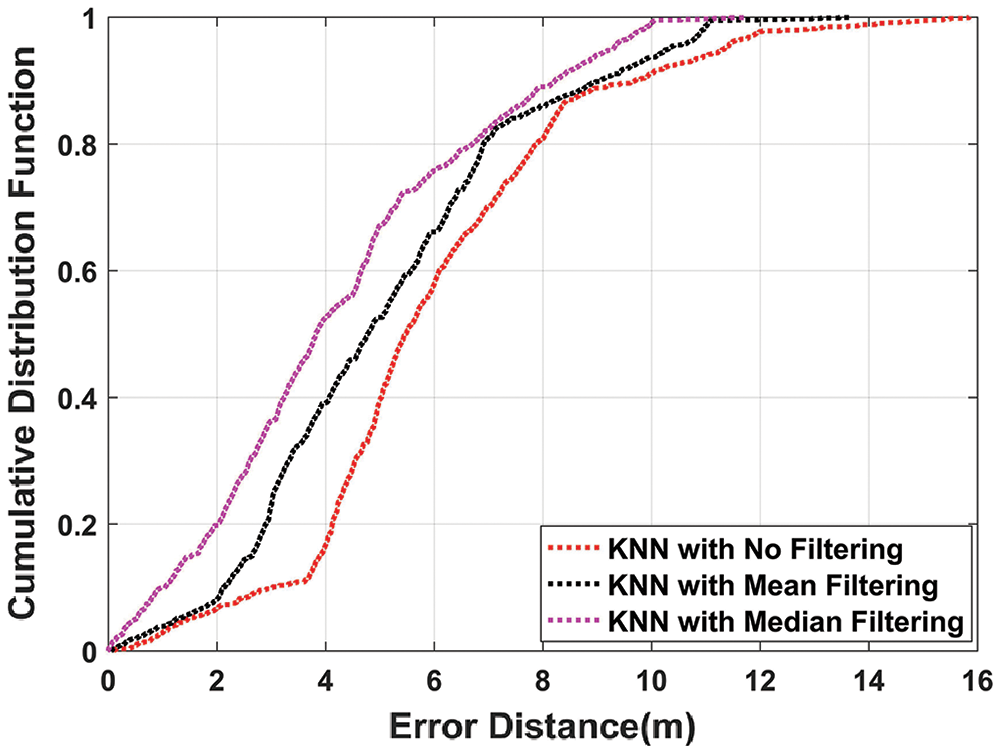
Figure 7: CDF plot of kNN algorithm with mean, median, and without filtering
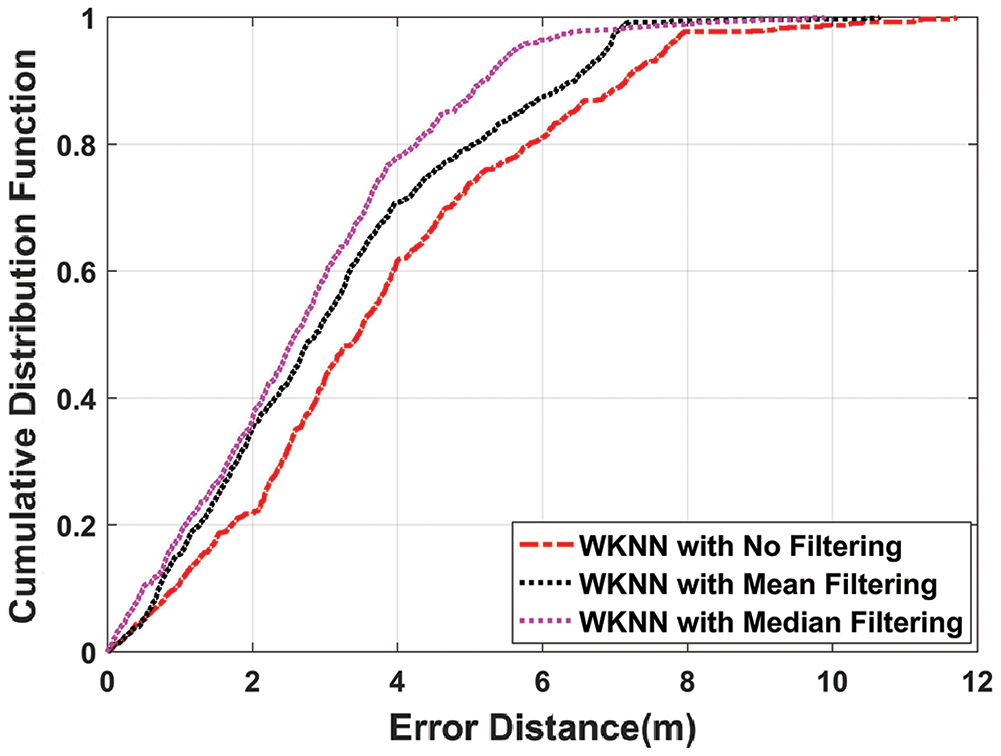
Figure 8: CDF plot of WkNN algorithm with mean, median, and without filtering
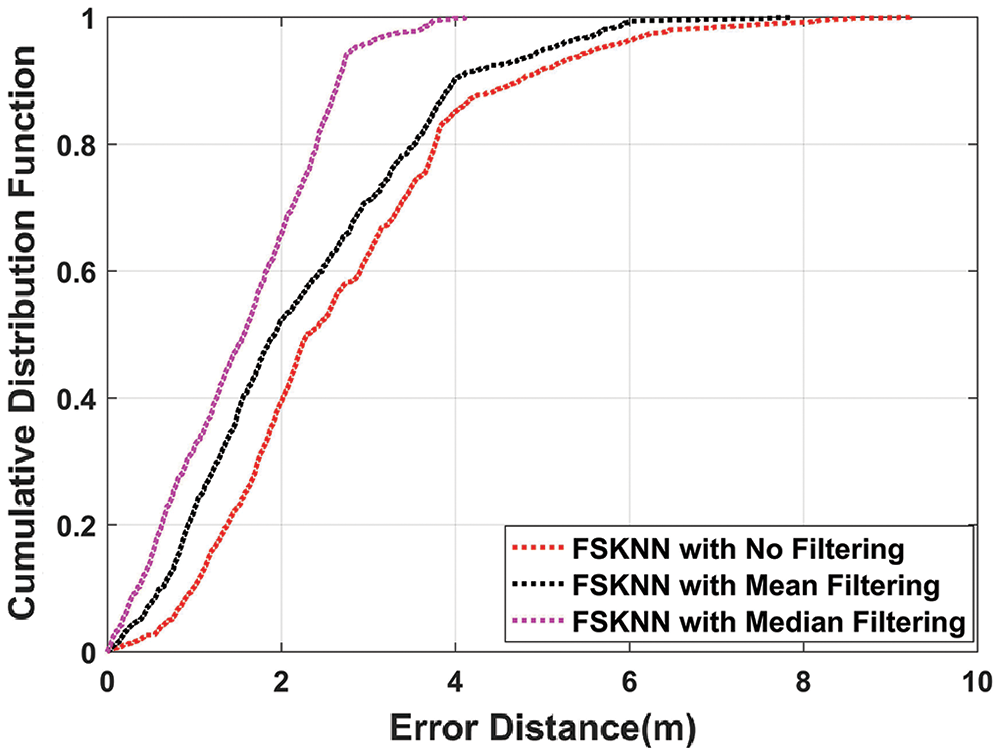
Figure 9: CDF plot of FSkNN algorithm with mean, median, and without filtering
It can be seen in Fig. 9, FSkNN using median filtering outperforms FSkNN with mean filtering and without filtering. The mean position error obtained with median filtering is 1.5461 m as compared to the mean position error of 2.2361 m and 2.6743 m with mean and without filtering. So, it is clear that median filtering when used with un-filtered FSkNN, the mean position error is improved by 42.19%.
Fig. 10 depicts that SVM using median filtering outperforms SVM with mean filtering and without filtering. The mean position error obtained with median filtering is 0.7959 m as compared to the mean position error of 1.1139 m and 1.4791 m with mean and without filtering. So, it is clear that median filtering when used with un-filtered SVM, the mean position error is improved by 46.2%.
The mean positioning error of various machine learning algorithms with and without filtering is shown in Tab. 3. The CDF of different algorithms using mean and median filtering as pre-processing techniques is shown in Figs. 11 and 12. Results show that when median filtering is used with the machine learning algorithms, it outperforms the mean and no filtering.
Applying median filtering on kNN, WkNN, FSkNN, and SVM improve the efficiency in comparison with mean filtering by 16.34%, 12.4%, 30.86%, and 28.55% respectively. From Fig. 11, it is clear that SVM with mean filtering outperforms other machine learning algorithms as it improves the mean position error by 78.12% in comparison with kNN. Fig. 12 shows that SVM with median filtering outperforms other machine learning algorithms as it improves the mean position error by 81.31% in comparison with kNN.
So, overall proposed SVM with median filtering algorithm gives us the best results in terms of mean position error as it outperforms other machine learning algorithms which are using both mean and median filtering as depicted in Fig. 13. It can also be seen from the above results that machine learning algorithms perform better when they are used with the pre-processing techniques of mean and median filtering which is our proposed model.
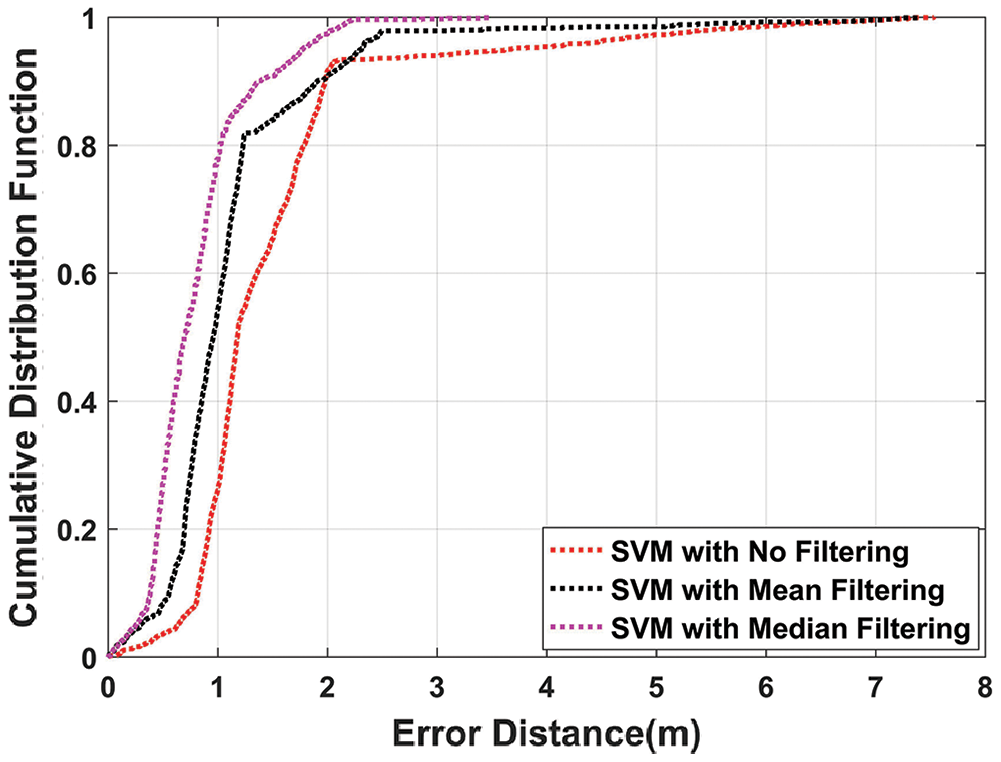
Figure 10: CDF plot of SVM algorithm with mean, median, and without filtering
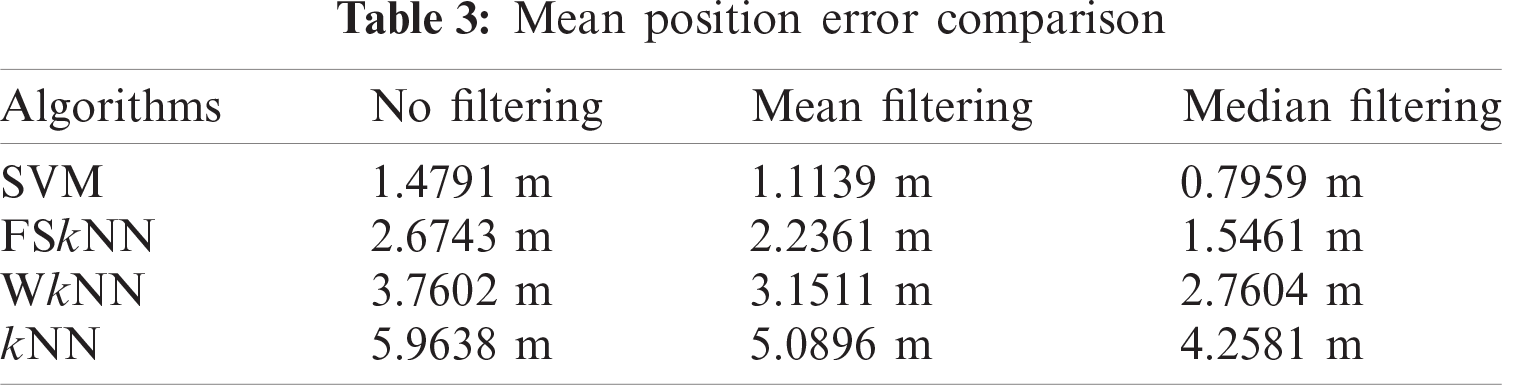
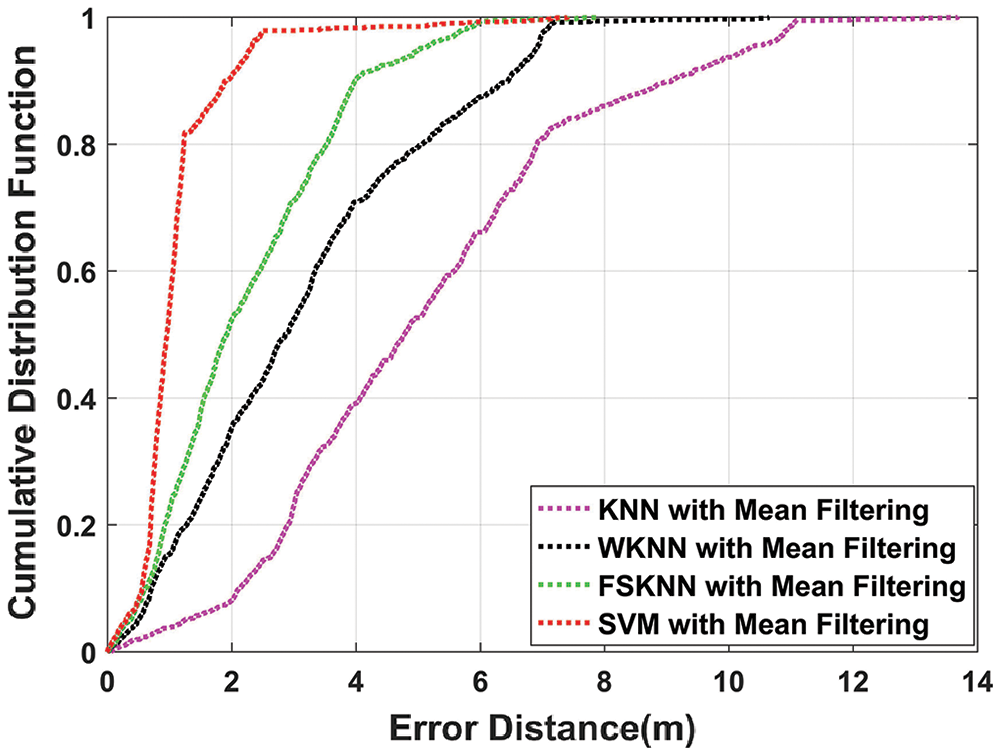
Figure 11: CDF comparison of machine learning algorithms with mean filtering
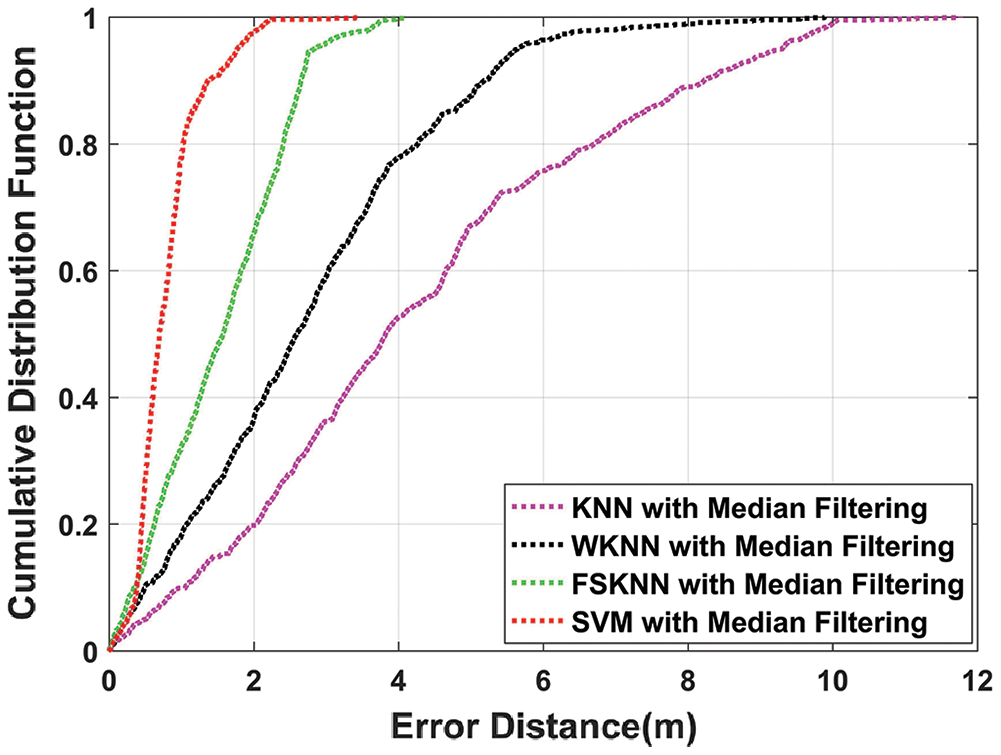
Figure 12: CDF comparison of machine learning algorithms with median filtering
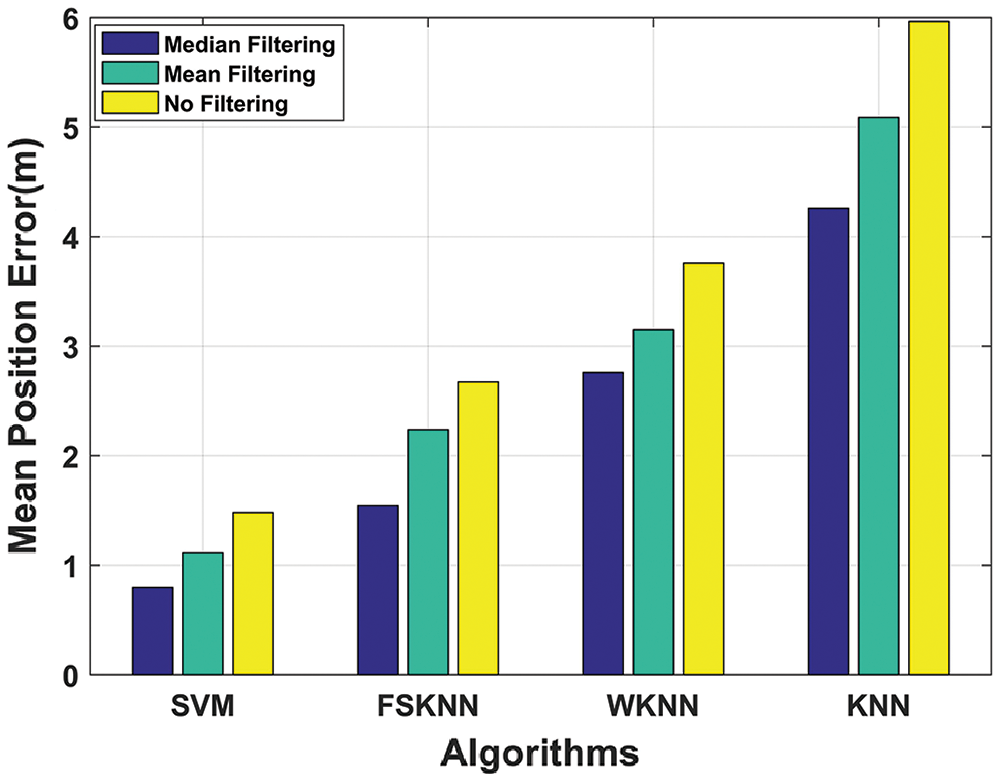
Figure 13: Mean position error comparison of machine learning algorithms with mean, median, and without filtering
Determining the value of the ‘k’ parameter is very important when it comes to kNN, WkNN, and FSkNN as it affects the accuracy of the proposed model. If lower values of k are chosen then the model will learn to predict more locally. However, if larger values of k are chosen then the model will learn to predict more globally. Increasing the value of k will improve the mean position error until it becomes constant. The larger values of k provide more smoothing which might or might not be desirable [31].
Fig. 14 depicts the performance of machine learning algorithms varying the value of k using mean and median filtering.
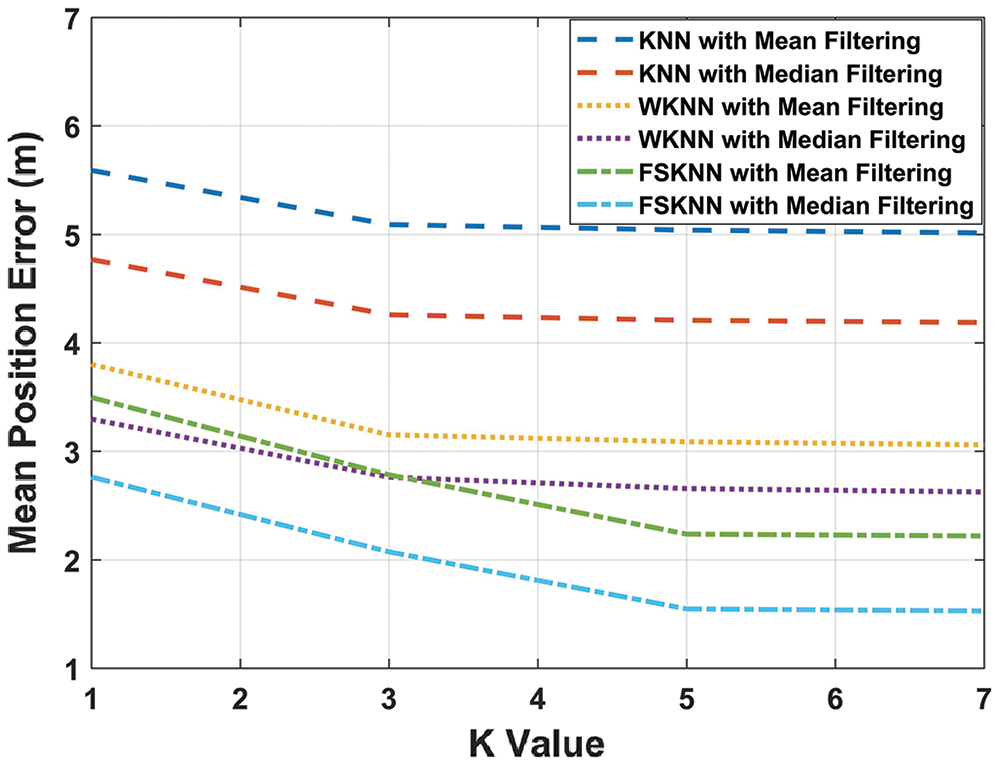
Figure 14: Performance of machine learning algorithms using mean and median filtering with varying k
It is obvious from Fig. 14 that k = 3 is a suitable choice for both kNN and WkNN algorithms. Moreover, for both mean and median filtering, the mean position error becomes constant when k > 3. In the case of FSkNN, the mean position error becomes constant when the value of k > 5 for both mean and median filtering. Therefore, k = 5 can be used for FSkNN.
Tab. 4 depicts the efficiencies of the investigated machine learning algorithms with mean, median, and without filtering.
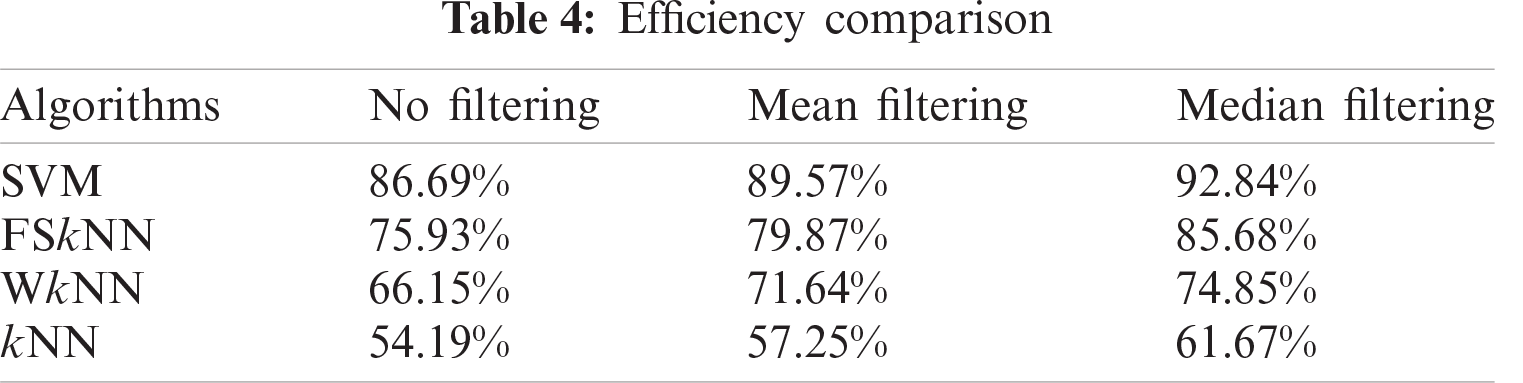
Fig. 15 shows the efficiency comparison of investigated machine learning algorithms with mean, median, and without filtering in terms of histograms. Machine learning algorithms perform efficiently when they are used with the pre-processing techniques. SVM with mean and median filtering outperforms every other machine learning algorithm with the efficiencies of 89.57% and 92.84% respectively.
From the above results and discussion, the SVM algorithm outperformed all the other variants of the proposed model as it provided better regularization and generalization capabilities by handling non-linear data efficiently [28]. Similarly, median filtering gave better results as compared to mean filtering because it was immune to the outliers in the dataset. Therefore, the proposed SVM with a median filtering algorithm enhances the performance of an indoor positioning system.
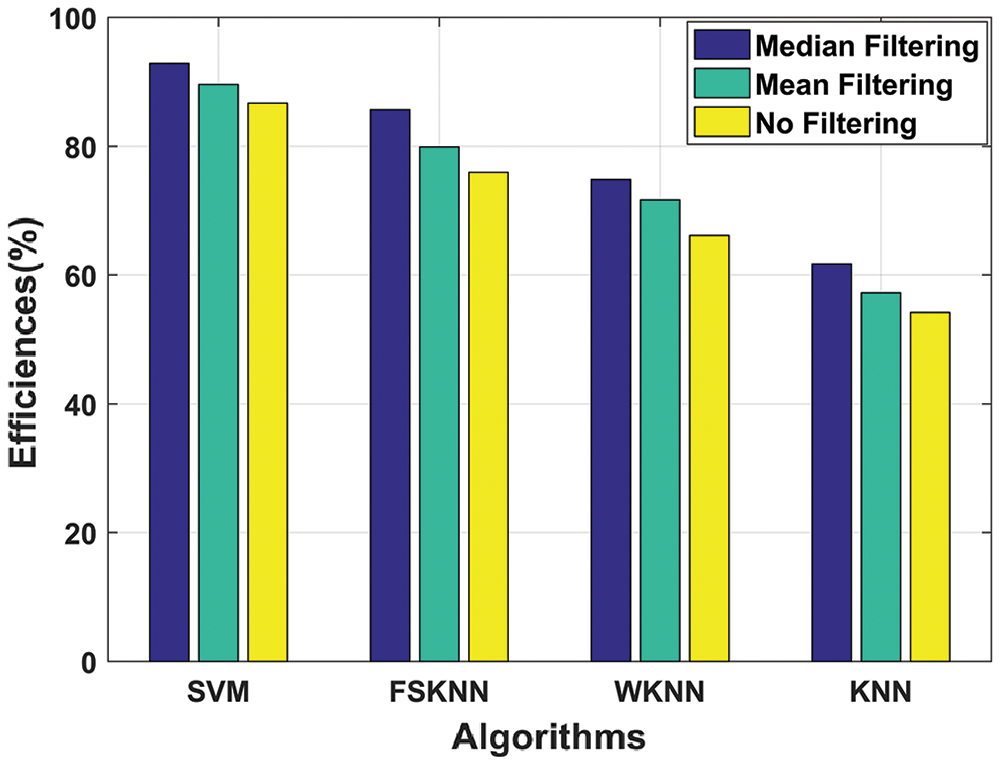
Figure 15: Efficiency comparison of machine learning algorithms with mean, median, and without filtering
In this paper, we have proposed an efficient solution for enhancing the positioning accuracy and efficiency of an IPS. Large training sets are key for obtaining better results in machine learning problems. Therefore, we have used the largest database available online created by authors in [4] and further processed by applying mean and median filtering as pre-processing techniques. The processed data was then fed to machine learning algorithms for training to improve the efficiency of the proposed model. The research objective was to propose an efficient indoor positioning solution which not only uses the largest available database but also improves the performance of an IPS by mitigating the effects of environmental factors. When median filtering was applied on kNN, WkNN, FSkNN, and SVM, the efficiency was improved in comparison with mean filtering by 16.34%, 12.4%, 30.86%, and 28.55% respectively. The proposed SVM with median filtering algorithm outperformed other investigated machine learning algorithms with mean and median filtering obtaining a mean position error of 0.7959 m and exceptional efficiency of 92.84% achieving the research objective.
In the future, authors are interested in investigating the location of a mobile user through reinforcement learning algorithms. Moreover, the proposed method can also be applied to neural network algorithms like Dynamic Nearest Neighbor and decision tree algorithms like Random Forest for mitigating the impact of environmental factors. Spearman, Minkowski, Chebyshev, and Manhattan distances can also be used instead of Euclidean distance with the current matching algorithms to minimize the positioning errors. Even larger datasets can be used for improving the overall performance of the proposed model.
Acknowledgement: We are thankful to J. Torres-Sospedra for making the database publicly available to us.
Funding Statement: The authors extend their appreciation to the National University of Sciences and Technology for funding this work through the Researchers Supporting Grant, National University of Sciences and Technology, Islamabad, Pakistan.
Conflicts of Interest: The authors declare that they have no conflicts of interest to report regarding the present study.
1. S. Xia, Y. Liu, G. Yuan, M. Zhu and Z. Wang, “Indoor fingerprint positioning based on Wi-fi: An overview,” International Journal of Geo-Information, vol. 5, no. 6, pp. 135, 2017. [Google Scholar]
2. W. Sakpere, M. Adeyeye-Oshin and N. B. W. Mlitwa, “A state-of-the-art survey of indoor positioning and navigation systems and technologies,” South African Computer Journal, vol. 29, no. 3, pp. 145–197, 2017. [Google Scholar]
3. R. F. Brena, J. P. García-Vázquez, C. E. Galván-Tejada, D. Muñoz-Rodriguez, C. Vargas-Rosales et al., “Evolution of indoor positioning technologies: A survey,” Journal of Sensors, vol. 2017, pp. 1–21, 2017. [Google Scholar]
4. J. Torres-Sospedra, R. Montoliu, A. Martinez-Uso, J. P. Avariento, T. J. Arnau et al., “UJIIndoorloc: A new multi-building and multi-floor database for WLAN fingerprint-based indoor localization problems,” in Proc. of the 5th Int. Conf. on Indoor Positioning and Indoor Navigation, Busan, Korea, pp. 261–270, 2014. [Google Scholar]
5. S. Hosseinzadeh, M. Almoathen, H. Larijani and K. Curtis, “A neural network propagation model for LoRaWAN and critical analysis with real-world measurements,” Big Data and Cognitive Computing, vol. 1, no. 1, pp. 7–17, 2017. [Google Scholar]
6. F. Subhan, S. Saleem, H. Bari, W. Z. Khan, S. Hakak et al., “Linear discriminant analysis-based dynamic indoor localization using bluetooth low energy (BLE),” Sustainability, vol. 12, no. 24, pp. 10627–10638, 2020. [Google Scholar]
7. F. Subhan, S. Ahmed, K. Ashraf and M. Imran, “Extended gradient RSSI predictor and filter for signal prediction and filtering in communication holes,” Wireless Personal Communications, vol. 83, no. 1, pp. 297–314, 2015. [Google Scholar]
8. F. Potortì, F. Palumbo and A. Crivello, “Sensors and sensing technologies for indoor positioning and indoor navigation,” Sensors, vol. 20, no. 20, pp. 5924, 2020. [Google Scholar]
9. S. Subedi and J. Pyun, “A survey of smartphone-based indoor positioning system using RF-based wireless technologies,” Sensors, vol. 20, no. 24, pp. 7230, 2020. [Google Scholar]
10. L. Wang, “Research and implementation of machine learning classifier based on KNN,” IOP Conf. Series Materials Science and Engineering, vol. 677, no. 5, pp. 052038–052043, 2019. [Google Scholar]
11. J. Li, X. Gao, Z. Hu, H. Wang, T. Cao et al., “Indoor localization method based on regional division with IFCM,” Electronics, vol. 8, no. 5, pp. 559–578, 2019. [Google Scholar]
12. F. Gu, S. Valaee, K. Khoshelham, J. Shang and R. Zhang, “Landmark graph-based indoor localization,” IEEE Internet of Things Journal, vol. 7, no. 9, pp. 8343–8355, 2020. [Google Scholar]
13. M. Abbas, M. Elhamshary, H. Rizk, M. Torki and M. Youssef, “Wi-deep: Wi-fi-based accurate and robust indoor localization system using deep learning,” in IEEE International Conf. on Pervasive Computing and Communications,” Kyoto, Japan, pp. 1–10, 2019. https://doi.org/10.1109/PERCOM.2019.8767421. [Google Scholar]
14. M. T. Hoang, B. Yuen, X. Dong, T. Lu, R. Westendorp et al., “Recurrent neural networks for accurate RSSI indoor localization,” IEEE Internet of Things Journal, vol. 6, no. 6, pp. 10639–10651, 2019. [Google Scholar]
15. Z. Wang, Z. Wang, L. Fan and Z. Yu, “A hybrid Wi-fi fingerprint-based localization scheme achieved by combining fisher score and stacked sparse autoencoder algorithms,” Mobile Information Systems, vol. 2020, pp. 1–14, 2020. [Google Scholar]
16. Z. Sun, Y. Zhang and Q. Ren, “A reliable localization algorithm based on grid coding and multi-layer perceptron,” IEEE Access, vol. 8, pp. 60979–60989, 2020. [Google Scholar]
17. W. Xue, X. Hua, Q. Li, K. Yu and W. Qiu, “Improved neighboring reference points selection method for Wi-fi based indoor localization,” IEEE Sensors Letters, vol. 2, no. 2, pp. 1–4, 2018. [Google Scholar]
18. H. Zhang, Z. Zhang, S. Zhang, S. Xu and S. Cao, “Fingerprint-based localization using commercial LTE signals: A field-trial study,” in IEEE 90th Vehicular Technology (VTC2019-Fall), Honolulu, Hawaii, USA, pp. 1–5, 2019. [Google Scholar]
19. Y. Duan, K.-Y. Lam, V. C. S. Lee, W. Nie, K. Liu et al., “Data rate fingerprinting: A WLAN-based indoor positioning technique for passive localization,” IEEE Sensors Journal, vol. 19, no. 15, pp. 6517–6529, 2019. [Google Scholar]
20. J. Bai, Y. Sun, W. Meng and C. Li, “Wi-fi fingerprint-based indoor mobile user localization using deep learning,” Wireless Communications and Mobile Computing, vol. 2021, pp. 1–12, 2021. [Google Scholar]
21. D. Milioris, “Efficient indoor localization via reinforcement learning,” in IEEE Int. Conf. on Acoustics, Speech and Signal Processing, Brighton, UK, pp. 8350–8354, 2019. [Google Scholar]
22. M. Mohammadi, A. Al-Fuqaha, M. Guizani and S. J. Oh, “Semi supervised deep reinforcement learning in support of IoT and smart city services,” IEEE Internet of Things Journal, vol. 5, no. 2, pp. 624–635, 2018. [Google Scholar]
23. F. Subhan, S. Ahmed, S. Haider, S. Saleem, A. Khan et al., “Hybrid indoor position estimation using K-nN and minMax,” KSII Transactions on Internet and Information Systems, vol. 13, no. 9, pp. 4408–4428, 2019. [Google Scholar]
24. A. Javed, M. Y. Umair, A. Mirza, A. Wakeel, F. Subhan et al., “Position vectors based efficient indoor positioning system,” Computers, Materials & Continua, vol. 67, no. 2, pp. 1781–1799, 2021. [Google Scholar]
25. D. Li, B. Zhang and C. Li, “A feature-scaling-based k-nearest neighbor algorithm for indoor positioning systems,” IEEE Internet of Things Journal, vol. 3, no. 4, pp. 590–597, 2016. [Google Scholar]
26. C. Li, Z. Qiu and C. Liu, “An improved weighted k-nearest neighbor algorithm for indoor positioning,” Wireless Personal Communications, vol. 96, no. 2, pp. 2239–2251, 2017. [Google Scholar]
27. X. Peng, R. Chen, K. Yu, F. Ye and W. Xue, “An improved weighted K-nearest neighbor algorithm for indoor localization,” Electronics, vol. 9, no. 12, pp. 2117, 2020. [Google Scholar]
28. H. Dai, “Research on SVM improved algorithm for large data classification,” in IEEE 3rd Int. Conf. on Big Data Analysis, Shanghai, China, pp. 181–185, 2018. [Google Scholar]
29. Y. Wang, C. Xiu, X. Zhang and D. Yang “Wi-fi indoor localization with CSI fingerprinting-based random forest,” Sensors, vol. 18, no. 9, pp. 2869, 2018. [Google Scholar]
30. Z. Yuan, X. Zha and X. Zhang, “Adaptive multi-type fingerprint indoor positioning and localization method based on multi-task learning and weight coefficients K-nearest neighbor,” Sensors, vol. 20, no. 18, pp. 5416, 2020. [Google Scholar]
31. Y. Zhao, “An improved indoor positioning method based on nearest neighbor interpolation,” Network and Communication Technologies, vol. 6, no. 1, pp. 1, 2021. [Google Scholar]
 | This work is licensed under a Creative Commons Attribution 4.0 International License, which permits unrestricted use, distribution, and reproduction in any medium, provided the original work is properly cited. |