DOI:10.32604/cmc.2021.018719
| Computers, Materials & Continua DOI:10.32604/cmc.2021.018719 | |
| Article |
Energy Efficient Cluster Based Clinical Decision Support System in IoT Environment
1Department of Electronics and Communications Engineering, Erode Sengunthar Engineering College (Autonomous), Erode, 638057, India
2Department of Information Technology, SRM Institute of Science and Technology, Kattankulathur, 603203, India
3Department of Medical Equipment Technology, College of Applied Medical Sciences, Majmaah University, Al Majmaah, 11952, Saudi Arabia
4Department of Electrical Communication Engineering, University College of Engineering, BIT Campus, Anna University, Tiruchirappalli, 620024, India
5Faculty of Applied Computing and Technology (FACT), Noroff University College, Kristiansand, 4608, Norway
6Department of Computer Science and Engineering, Soonchunhyang University, Asan, 31538, Korea
*Corresponding Author: Yunyoung Nam. Email: ynam@sch.ac.kr
Received: 19 March 2021; Accepted: 20 April 2021
Abstract: Internet of Things (IoT) has become a major technological development which offers smart infrastructure for the cloud-edge services by the interconnection of physical devices and virtual things among mobile applications and embedded devices. The e-healthcare application solely depends on the IoT and cloud computing environment, has provided several characteristics and applications. Prior research works reported that the energy consumption for transmission process is significantly higher compared to sensing and processing, which led to quick exhaustion of energy. In this view, this paper introduces a new energy efficient cluster enabled clinical decision support system (EEC-CDSS) for embedded IoT environment. The presented EEC-CDSS model aims to effectively transmit the medical data from IoT devices and perform accurate diagnostic process. The EEC-CDSS model incorporates particle swarm optimization with levy distribution (PSO-L) based clustering technique, which clusters the set of IoT devices and reduces the amount of data transmission. In addition, the IoT devices forward the data to the cloud where the actual classification procedure is performed. For classification process, variational autoencoder (VAE) is used to determine the existence of disease or not. In order to investigate the proficient results analysis of the EEC-CDSS model, a wide range of simulations was carried out on heart disease and diabetes dataset. The obtained simulation values pointed out the supremacy of the EEC-CDSS model interms of energy efficiency and classification accuracy.
Keywords: Energy efficiency; intelligent models; decision support system; IoT; e-healthcare; machine learning
Recently, population increase in old age has resulted in serious chronic and health problems globally which result in enhanced medical expenses for common people [1]. Regular health monitoring is highly important for every individual especially for aged people suffering from severe diseases so that the hospitalization cost and time can be reduced with considerable lifetime. Several traditional approaches to healthcare analysis are highly complex and insufficient. But these methods are not adequate for clinical demands of aging population. In order to overcome these complications “Internet of Things (IoT)” is developed as new technical innovation that allows universal data transmission among things with the physical environment through Internet. Since the sensing tools and “Radio Frequency Identification (RFID)” have been referred as progressive surge recently, enormous data has been produced and it is highly complicated for handling minimum computation and memory accessible in the sensors. This problem can be resolved by the combination of Cloud and IoT models are meant to be Cloud IoT which offers better solution to make communication from heterogeneous tools and managing ever-increasing data requirements.
Cloud and IoT methods enable prominent development and service interpretation by applying cloud service based schemes [2]. The unification of Cloud and IoT named “Cloud IoT” that results in new model for making coherent as well as structured healthcare monitoring approaches. Using Cloud IoT, various IoT domains interconnect and interchanges the data with one another and make cost effective medical services. Despite these benefits, it suffers from numerous challenging factors in healthcare observation results in developing new and effective models. The performance of Cloud IoT scheme in medical applications generates massive opportunities for clinical sector should be upgraded with medical healthcare system and include persistent as well as retained innovation. The utilization of Cloud IoT in medical care provides better way for patients to enhance the lifetime and proceed with routine works, while the medical professionals monitor the patients regularly with prescribed medications. It is obvious that severe diseases predicted in earlier stages are highly applicable to treat the disease using Cloud and IoT in reducing the cost and hospital visiting hours.
The combination of Cloud and IoT is involved in making effective medical domains for monitoring the clinic centers and patients. Cloud IoT update the healthcare application by creating a collaboration between different units. In order to make simple works for patients suffering from acute disease, the paradigms of Ambient Assisted Living (AAL) is deployed [3]. Under the utilization of Cloud IoT in healthcare sector, it is possible to distribute numerous applications like using WSN for collecting delicate medical information, sending the data to Cloud, and consequently examining the data to extract useful details with data analytics. The major attribute of Cloud IoT model in medical is to providing seamless clinical facilities with reduced operational cost. From the pervasive nature of clinical system, numerous volume of data has been produced by sensor networks which require effective management and proceed with further data analytics. Initially, cloud presents tremendous platform for computing clinical data and idea of technical data from the patient. In addition, it helps in automatic data collection and transmission with limited cost, which makes the mobile gadgets independent for healthcare data availability, examination, and data computation. Furthermore, it is executed globally to connect clinical structures and allot pervasive, effective, and smart healthcare services for patients suffering from acute ailments. A significant development in healthcare monitoring has represented a useful and remarkable function in clinical domains.
Under the application of Cloud IoT in medical sector in the combination of Information and Communication Technology (ICT) model which has been interrelated applications, sensors material, and backend users coordinates and operate jointly as smart method in monitoring and recording the patient details. There are 3 main elements namely: smart wearables and implantable sensor nodes for data accumulation, data communication that can be applied for actual and trusted communication of sensed details to the medical datacenter, and cloud data archival for computation, analysis, and visualization. The on-demand service mechanism of cloud offers error free accessibility to physicians under different pool of data from dissimilar resources with Electronic Medical Record (EMR), prescription, and laboratory report. Fig. 1 shows the structure of embedded IoT based health system [4]. The medications of severe diseases like asthma alert medical professionals in case of lost prescriptions. Moreover, Cloud IoT provides data analytics which is helpful for doctors and monitor the patients whenever required. Even though considerable number of energy-effective structures are developed, but several methods handle the IoT and Cloud autonomously. The energy efficiency of Cloud based IoT methods could enhance the network duration and performance of accessible services. The delay sensitivity and power utilization, fog computing is applied to reduce the traffic on Cloud and considered as local storage for IoT tools.
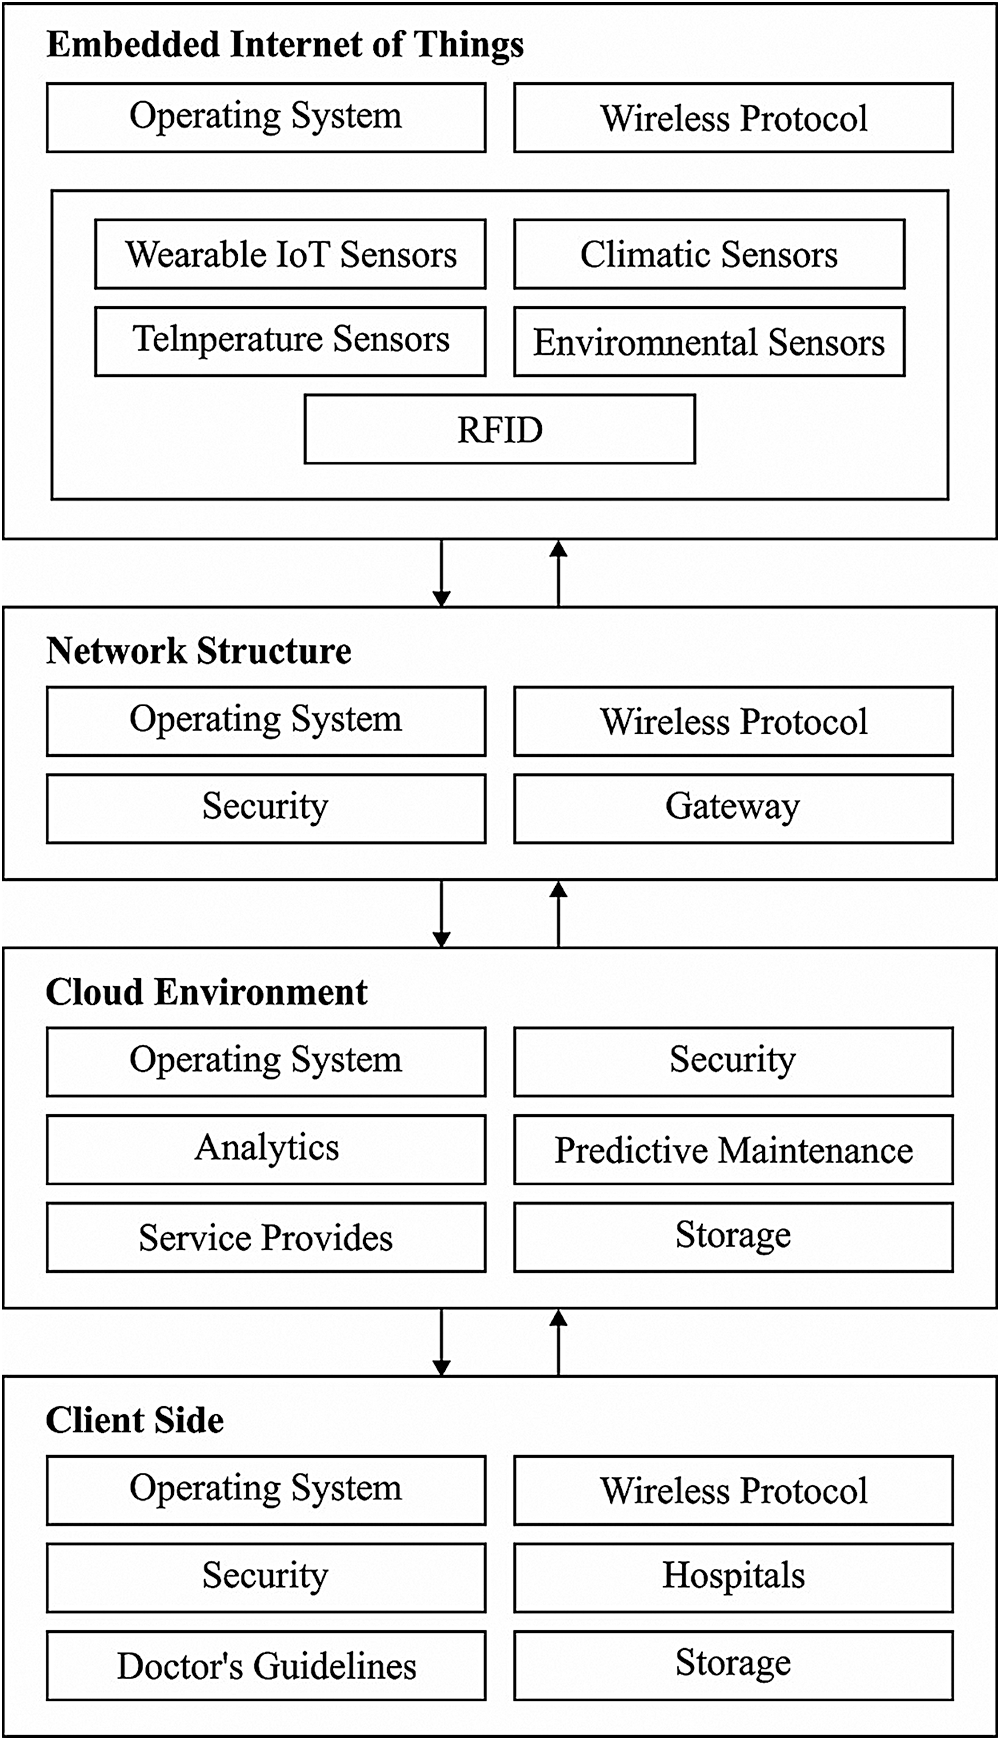
Figure 1: The embedded IoT based healthcare systems
This paper devises a novel energy efficient cluster based clinical decision support system (EEC-CDSS) for embedded IoT environment. The objective of the EEC-CDSS model is to effectively communicate the medical data from IoT devices and accomplish accurate diagnostic process. The EEC-CDSS model includes particle swarm optimization with levy distribution (PSO-L) based clustering technique, which groups the set of IoT devices and decreases the quantity of data transmission. Moreover, the IoT devices propagate the information to the cloud-server where the actual diagnostic procedure is performed using variational autoencoder (VAE). For examining the proficient performance of the EEC-CDSS model, an extensive set of experimentations were performed on the benchmark heart disease and diabetes dataset.
The authors in [5] addressed the data heterogeneity issue in the IoT environment by the use of platforms using semantic data mechanisms. In addition, resource based data accessible technique called UDA-IoT was deployed for computing IoT data effectively. Banaee et al. [6] defined the newest approaches to examine the data collected from portable devices in medical applications. Data Mining (DM) process such as anomalous detection, decision making is applied in frequent time series collected from portable sensor nodes. The authors in [7] used the schemes in developing r-health application areas like website designer as well as domains like observing the patients in isolated area by the use of IoT based health care model. The web-relied mechanism is suitable to offer health details to physicians and caretakers. Moreover, IoT based health observation technology is utilized for estimating the immediate medical results in cases like alcohol consumption and clinical impacts. Hussain et al. [8] implied user-based observation approach for disabling and elder people. The main aim of this model is to provide service based emergency for acute state of a patient. The modern cooperative security technique is used for reducing the risks in IoT-based medical platform.
The authors in [9] projected Smart-Hospital-Systems (SHS) by means of technical schemes like RFID, WSN, and smartphone. They interoperate among themselves under the application of IPv6. The authors in [10] developed a model for symptoms analysis in patients. It determines the pulse values and body temperatures even from the hostile region. Hence, IoT based system structure and computing devices are utilized for generating the alert signals when the patient is in serious state [11]. A Web based model is used for the interrelation of the client with doctors utilizing portable body sensors called Eco Health. The major intention of this model is to improvise the remote healthcare observation infrastructure as well as client analysis. Kim et al. [12] implied the adverse case care framework with the help of context motion observation for chronic clients. It is applicable to examine the current state of a client; that is achieved by data collected from regular client details.
Patil et al. [13] applied various real time data stream mining frameworks for predicting drift problems in real time data streaming. The method and architecture of Body Sensor Network (BSN) in conjunction with signal collection and context aware examination. But the main aim of this approach is data unification and network communication. A smartphone app based SMS notification is presented in [14] for medical emergency handling based on the sensed data provided for middle server. The actual data streaming mechanism called Kaal is effective than other models. Bhandari et al. [15] established the extended model of Apriori mechanism for real-time application that lessens the time and space to examine entire database exploration on frequent itemsets. Yin et al. [16] employed novel 2-phase approach for predicting abnormal events according to the wireless sensors placed in human body.
Moreover, Assuno et al. [17] implied a model for analysis on Cloud Computing for big data applications. It is operated on four important regions of big data such as data handling, model development, visualization, and business approaches. The extensive study offers a neat description of CC relied upon big data processing and considerable solutions. An adaptive method is introduced in [18] for consistent and scalable CC examination. It is applicable for managing huge volume of time-series data. On the other hand, the CC methods are not suitable for gaining effective CH election process with classifier. In addition, an alert system has been introduced in traditional models.
Fig. 2 demonstrates the workflow involved in the presented EEC-CDSS model. The figure denoted that the IoT devices placed on the human body observe the medical data. At the same time, the PSO-L algorithm gets executed to determine the optimal cluster heads (CHs) and perform cluster construction. Next to that, the CHs transmit the collected medical information to the cloud server where the actual diagnosis process begins. Subsequently, the VAE model is applied to determine the appropriate class label of the applied medical data. Finally, in case of abnormality, an alarm will be raised to alert the patient, hospital environment, and caretaker.
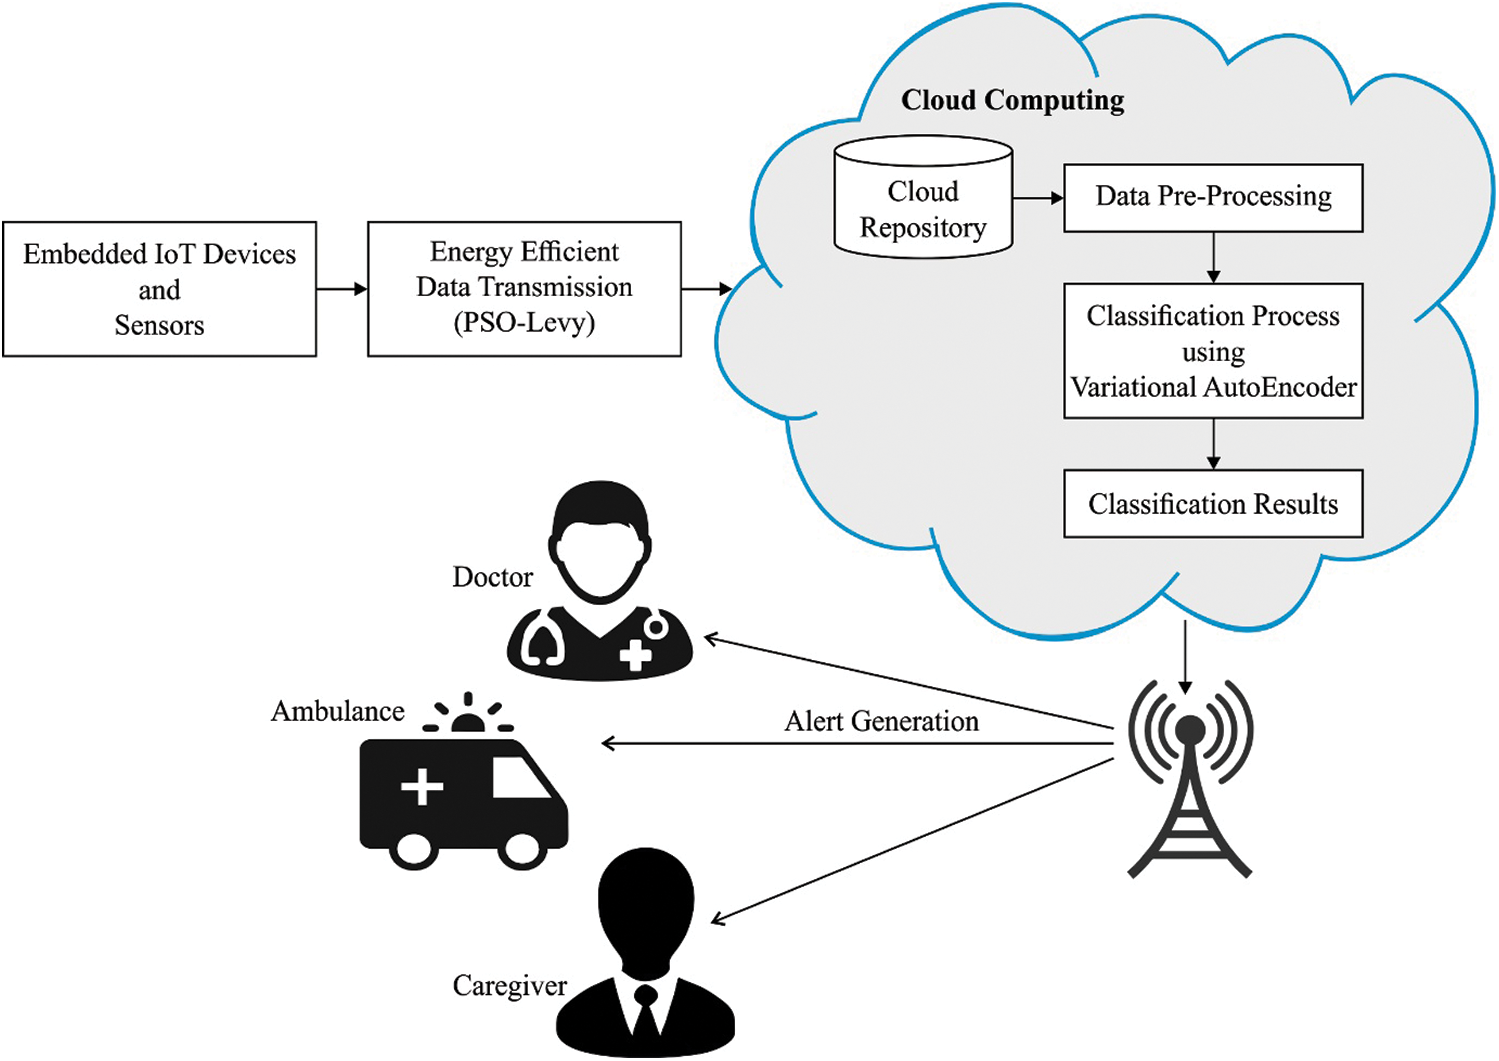
Figure 2: The working process of EEC-CDSS method
3.1 PSO-L Algorithm Based CH Selection and Cluster Construction Process
Basically, PSO is referred as a population-based optimization method. The random solution is stimulated with population and searching for better solutions. The applicable solutions gained from each round are called a particle, which contains the details derived from the coordinate points which are related to gain best solution using optimal particles. The fitness function (FF) of the particles is executed and considered as best solution. Therefore, the FF value of current optimal particle is called p_best. Moreover, it is suitable to optimize better population metrics gained by different particles from neighbors and location is meant to be l_best.
If the population is applied as the topological neighbor by special particles, afterward the best value is decided from created population and exact optimum values are considered as best solution called g_best. The velocity is estimated by random models which are comprised of randomly generated values for velocity by means of p_best and l_best coordinates. For huge volume of produced solutions, tremendous value is selected to resolve the issue [11]. In addition, it is used for saving and managing the outcome for three globalized parameters namely target values, g_best, and stop values. In order to avoid the local optima problem of PSO algorithm, Levy distribution concept is integrated into it [19–21].
Levy flight is defined as a Markov procedure. Also, the Levy flight is considered to be a common random walk approach, that implies a type of non-Gaussian stochastic computation and relevant to the Levy stable distribution. The consistent improvement follows the Levy steady distribution. It is classified by minimum steps but it is represented in large steps, thus the moving entities are not repeated in searching the similar place, modifying the system behavior. Even though the motion direction is random, the motion step size is considered as exponential rate distribution. The integration of PSO and Levy flight models extends the search range of the technique and enhance the diversity of population, and prevents from trapping of local optimum.
Recently, Levy flight is employed extensively in optimization field, and results indicate that Levy flight has accomplished better outcomes [22]. In global update of particle approach, Levy flight model is included to enlarge the search scope and makes it complicated for the model to be stuck in local optimization which is expressed in Eq. (1) is:
Here,
where
where
Here, IoT device telecasts the data to adjacent IoT devices. When it gains the data, it is enclosed with node identifier, location which is the distance from X and Y position, energy loss and power loss ratio (velocity), as well as energy level.
Step-1: Conversion of PSO-L space in which PSO-L particle is limited with 2D such as particle position as well as velocity.
Step-2: The newly developed FF for EEC-CDSS model is employed to optimize extreme distance as well as energy of cluster members (CM) and CH. The FF value is determined by the use of Eq. (4):
where
Step-3: Generation of new particles from the fundamental solutions. Deployment of new particles from previous solution is a method of emulating novel particles.
Step-3.1: Estimation of novel velocity: the current particle’s velocities can be determined by modifying the position. It can be expressed as:
where
Step-3.2: Estimation of novel position for particle is expressed as:
Consequently, the new particle is developed.
Step-4: Evaluation of FF measures for new particles.
FF values of novel particles are processed using FF in Step 2 accompanied by velocity as well as novel position.
Step-5: The FF score of existing particle and new particle is compared with best one in upcoming round:
If fresh FV > traditional FV
Pick up the novel particle;
else
previous particles are transmitted to upcoming round.
Step-6: For every round, the optimum solutions have been chosen as l_best solution. The particle having maximum FF value in current round is selected as l_best solution.
Step-7: The l_best solution of particle that is maximum than alternate solution considered as g_best solution. Thus, the final one is decoded under the application of clusters.
The cluster is generated with the application of PSO-L and telecasts the cluster data for IoT devices which are enclosed with applied data. The IoT device is applicable to save the message and proceed for CH selection.
Followed by, IoT device preserves the cluster list. It is composed of currently clustered, velocity, location, and energy. Then, it is employed for CH election process.
Step 1. The members exist closer to the current node are suitable for communicating with each other for CH election.
Step 2. Estimate FF:
where
Step 3. Generation of new particles from basic set of solutions.
Step 3.1. Estimation of new velocity as represented as follows:
where
Step 3.2. Estimation of novel position by fresh velocity:
New position
Finally, new particle has been developed.
Step 4. Evaluate FF score of new particle.
The FF values of new particles are processed using FF scores as depicted in Step 2 with new velocity’s position.
Step 5. FF of former and novel particle are relevant and normalized solution is selected for computing the future round:
When new FF
Elect new particle;
else
former particle is promoted to subsequent round.
Step 6. Under all round, the considerable solutions are elected as l_best solutions.
Step 7. For each round, solitary l_best solution has been examined and the particle with maximum l_best solutions are referred as g_best solution.
3.2 VAE Based Classification Process
Once the IoT CHs transmit the data to the cloud server, data preprocessing takes place to transform the data into a compatible format. Besides, VAE based classification process is performed to assign the class labels of the applied medical data. In general, Autoencoder (AE) is defined as a Neural Network (NN) model which is comprised of operating logic for training the input vector to redevelop the output vector under unsupervised method. Basically, the structure is developed by encoding and decoding units. The individual layer of AE is composed of encoding and decoding units as depicted in Eqs. (9), (10), correspondingly. Here,
Under the application of affine mapping that results in nonlinearity and conversion of input vector
VAE is a directed probability based graphical method that is accomplished by the application of Artificial Neural Network (ANN) to the subsequent end. Here, latent parameter
Here,
The attributes of approximate posterior
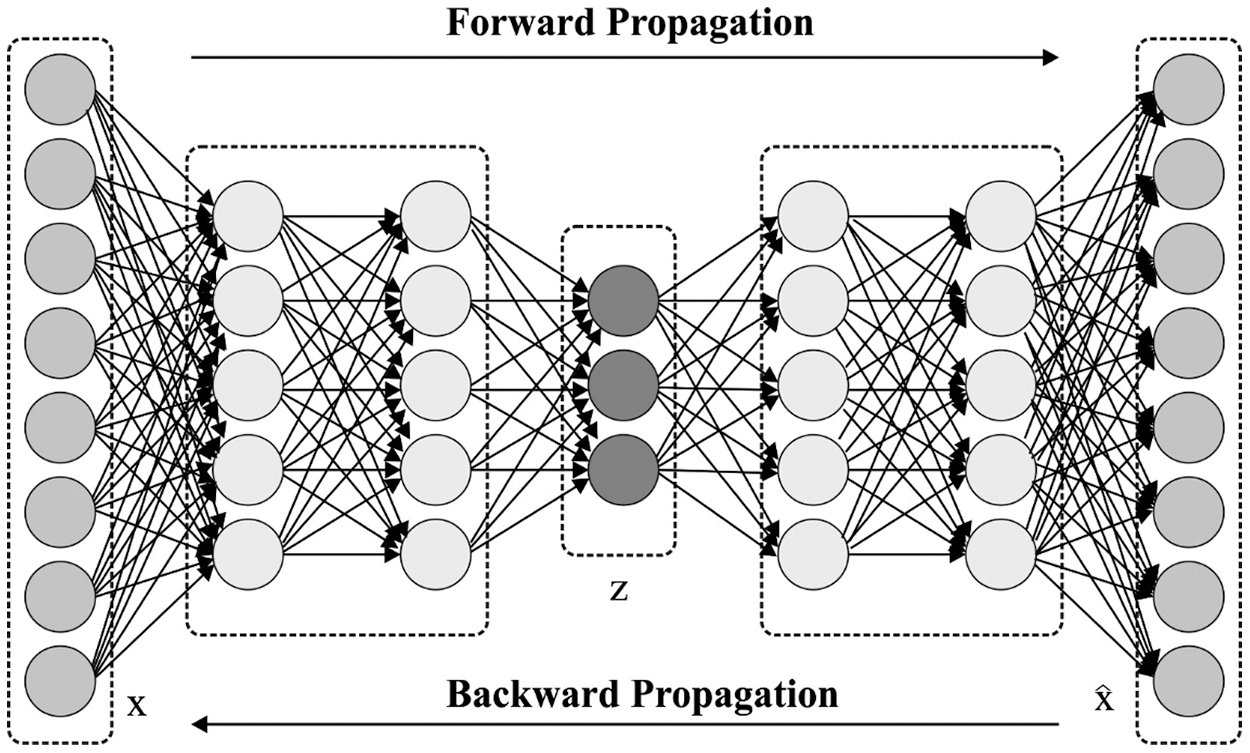
Figure 3: The VAE architecture
VAE training is accomplished under the application of Backpropagation (BP) scheme. Then, the latter portion of (15) is processed with the help of Monte Carlo gradient models along with re-parameterization framework, which applies an arbitrary parameter from normal distribution instead of arbitrary variable from actual distribution. Also, random variable
The re-parameterization task makes sure that
The stochastic latent parameters generate the variables of actual input variable distribution is applied for RP computation. Then, the probability of data is generated from specific latent parameters considered from approximate posterior distribution.
Afterward, RP processed in VAE is modified from RE measured in AE. Firstly, if the latent variable is referred as deterministic mapping in AE, it is assumed to be stochastic variables in VAE. Also, difference in the latent space is considered from the sampling process since the VAE applies probabilistic encoder for modeling the distribution of latent variables rather than using latent variables. Next, reconstructions are stochastic parameters in VAE. RP considers the variations among actual input and reconstruction, where the variability of reconstruction is assumed in variance attributes. Hence, defined sensitivity for reconstruction with variable difference is empowered under the application of this feature, which has not been accessible in AE because of the deterministic behavior. Next, probability metrics correspond the reconstructions in VAE. Mostly, in AE dependent disease classification, detection scores are emanated by RE. Additionally, the estimation of appropriate objective threshold for RE is considered to be complicated process. Besides, since the probability distribution of each parameter activates the independent computation of single variability and calculation of RP does not require weighing of RE in heterogeneous data. As a result, it is finalized that the estimation of threshold values of RP is activated effectively with maximum objective when compared with coherent RE.
The performance of the EEC-CDSS technique has been validated against the UCI data repository and medical data collected by the IoT devices. In this study, the experimental results are tested against heart disease and diabetes dataset [24]. The presented model is simulated using Python 3.6.5 tool and the results are examined interms of energy efficiency with detection accuracy. A detailed comparative result analysis was performed to highlight the supremacy of the EEC-CDSS model.
4.1 Results Analysis of EEC-CDSS Model on Heart Disease Dataset
Tab. 1 and Fig. 4 perform the results examination of the EEC-CDSS model on the applied heart disease dataset. The values that exist in the table denoted that the EEC-CDSS model has showcased effective detection performance under distinct instances.
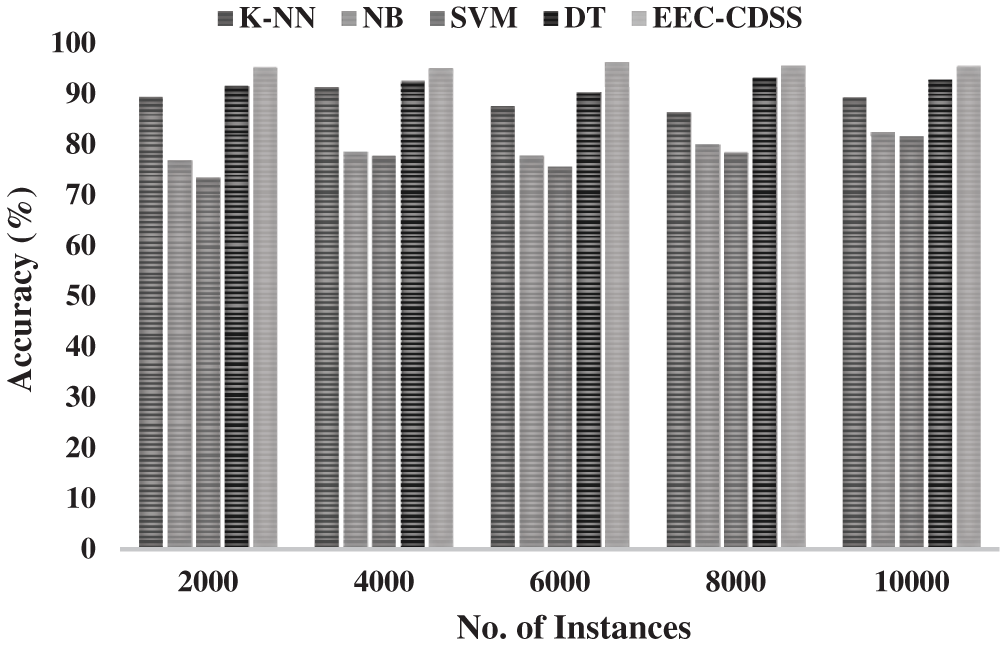
Figure 4: The accuracy analysis of EEC-CDSS model on heart disease dataset
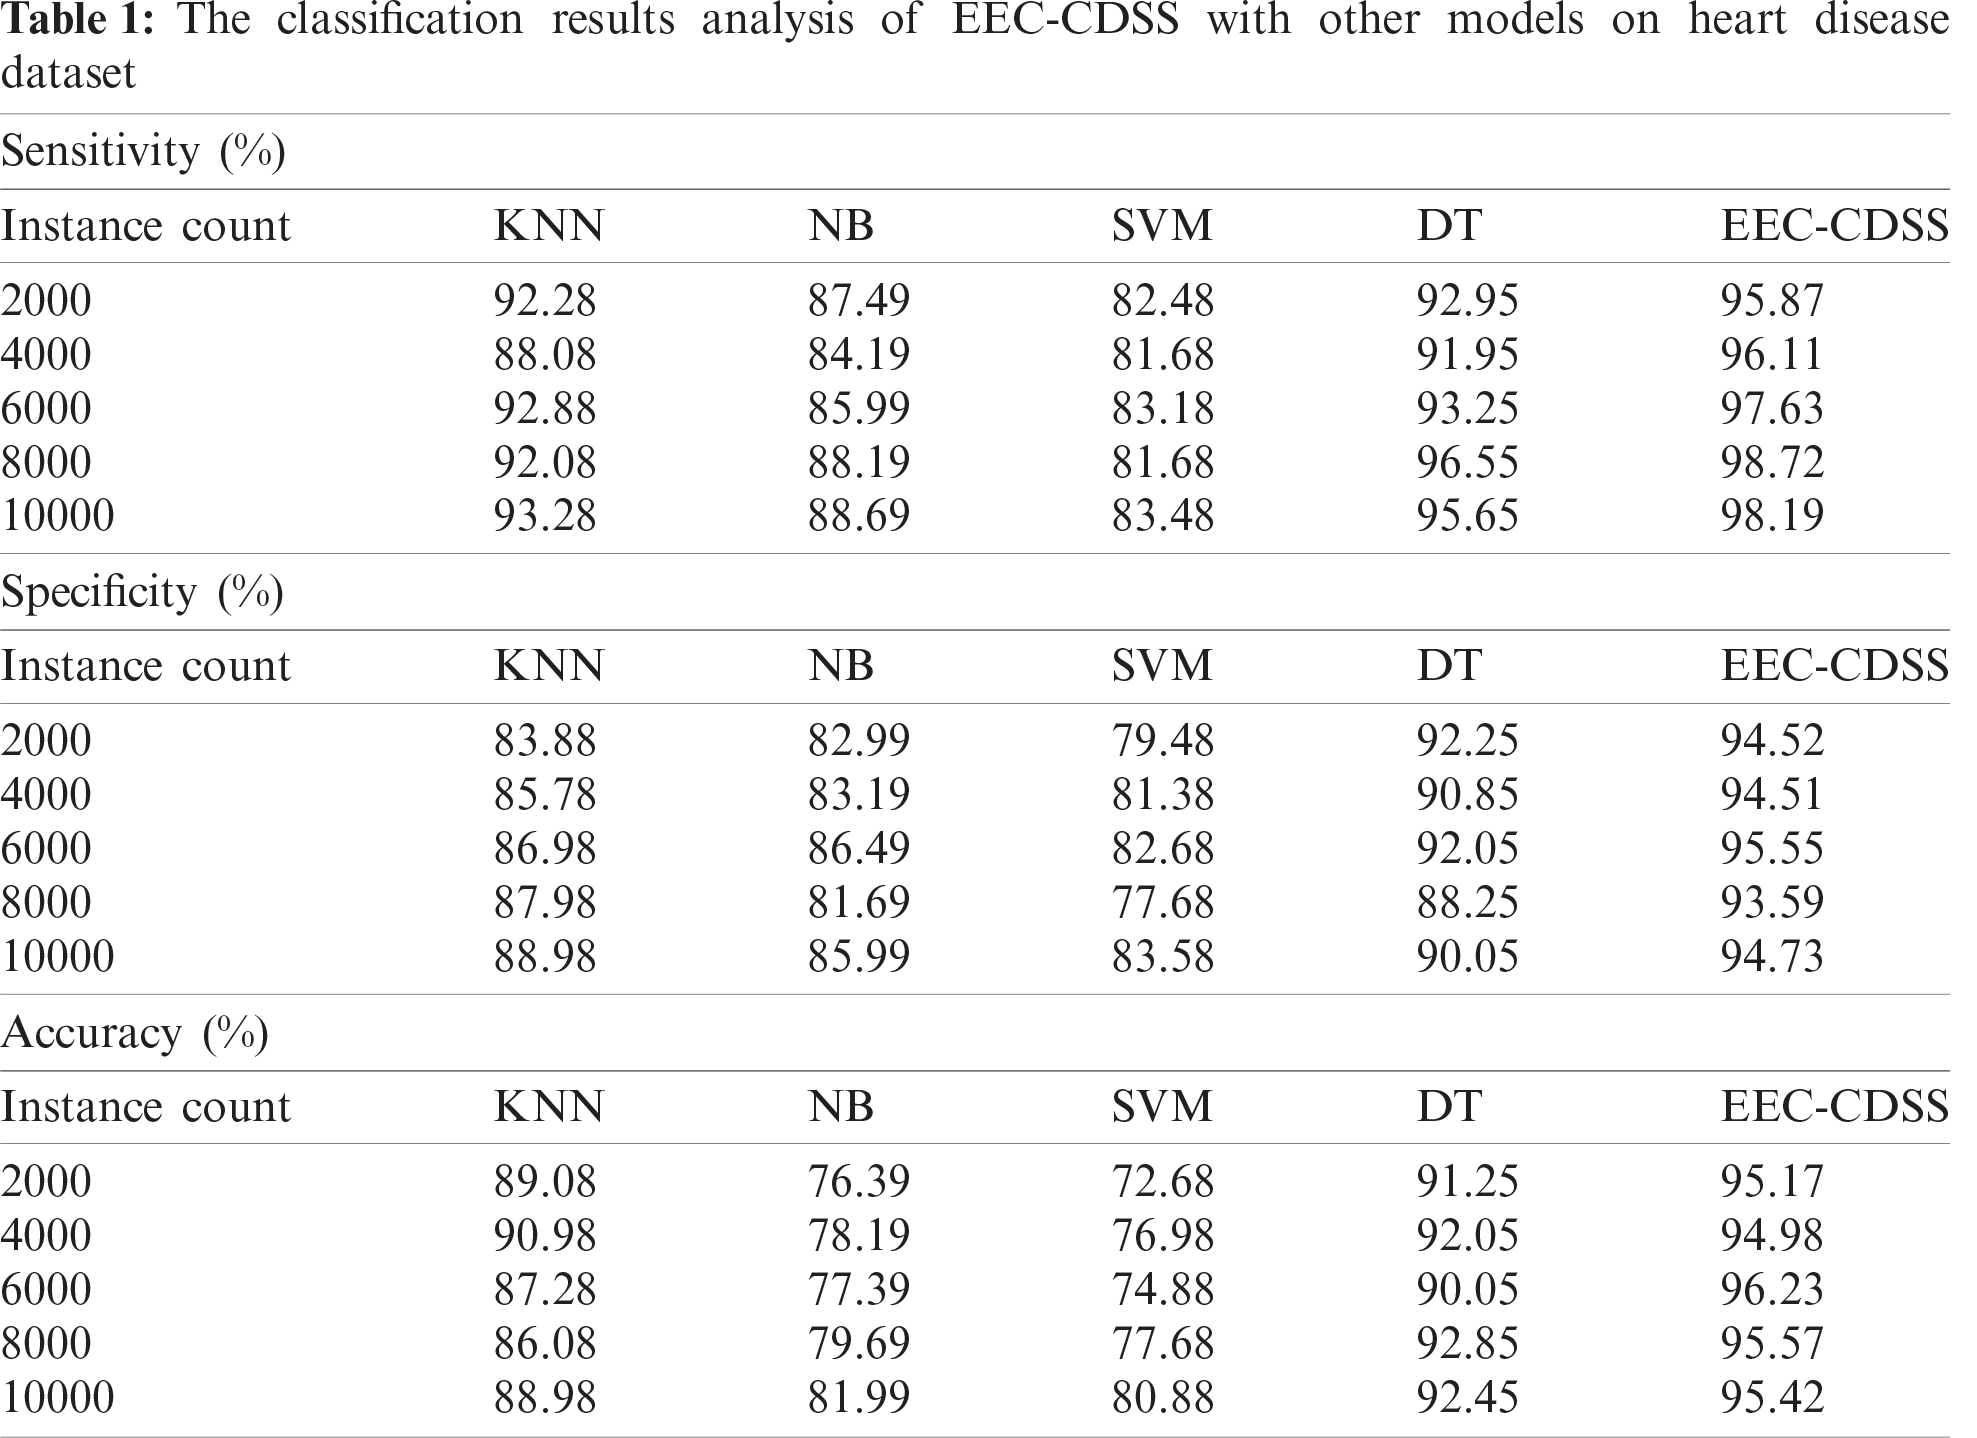
A sensitivity analysis of the EEC-CDSS model with existing techniques denoted that the NB and SVM models have showcased poor performance whereas the KNN and DT models have exhibited moderately closer sensitivity value. But the presented EEC-CDSS model has accomplished a maximum sensitivity under all the instances. For instance, in the presence of 2000 instances, the EEC-CDSS model has demonstrated effective sensitivity of 95.87% whereas the KNN, NB, SVM, and DT models have led to a reduced sensitivity of 92.28%, 87.49%, 82.48%, and 92.95% respectively. On the other hand, on the existence of 10000 instances, the EEC-CDSS model has depicted effective sensitivity of 98.19% whereas the KNN, NB, SVM, and DT models have led to a minimum sensitivity of 93.28%, 88.69%, 83.48%, and 95.65% respectively.
Specificity analysis of the EEC-CDSS method with existing techniques denoted that the NB and SVM models have showcased inferior performance whereas the KNN and DT models have exhibited moderately closer specificity value. However, the projected EEC-CDSS model has accomplished a high specificity under all the instances. For instance, in the presence of 2000 instances, the EEC-CDSS model has illustrated effective specificity of 94.52% whereas the KNN, NB, SVM, and DT models have led to a minimal specificity of 83.88%, 82.99%, 79.48%, and 92.25% respectively. Followed by, on the presence of 10000 instances, the EEC-CDSS model has projected effective specificity of 94.73% whereas the KNN, NB, SVM, and DT models have led to a reduced specificity of 88.98%, 85.99%, 83.58%, and 90.05% correspondingly.
Accuracy analysis of the EEC-CDSS model with previous techniques denoted that the NB and SVM models have showcased poor performance while the KNN and DT models have exhibited moderately closer accuracy value. But the developed EEC-CDSS model has accomplished a maximum accuracy under all the instances. For example, on the existence of 2000 instances, the EEC-CDSS model has depicted effective accuracy of 95.17% whereas the KNN, NB, SVM, and DT models have led to limited accuracy of 89.08%, 76.39%, 72.68%, and 91.25% respectively. On the other hand, in the presence of 10000 instances, the EEC-CDSS model has demonstrated effective accuracy of 95.42% and the KNN, NB, SVM, and DT models have led to minimal accuracy of 88.98%, 81.99%, 80.88%, and 92.45% respectively.
4.2 Results Analysis of EEC-CDSS Model on Diabetes Disease Dataset
Tab. 2 and Fig. 5 computes the results analysis of the EEC-CDSS model on the applied diabetes disease dataset. The values present in the table denoted that the EEC-CDSS model has showcased effective prediction performance under distinct instances [25,26].
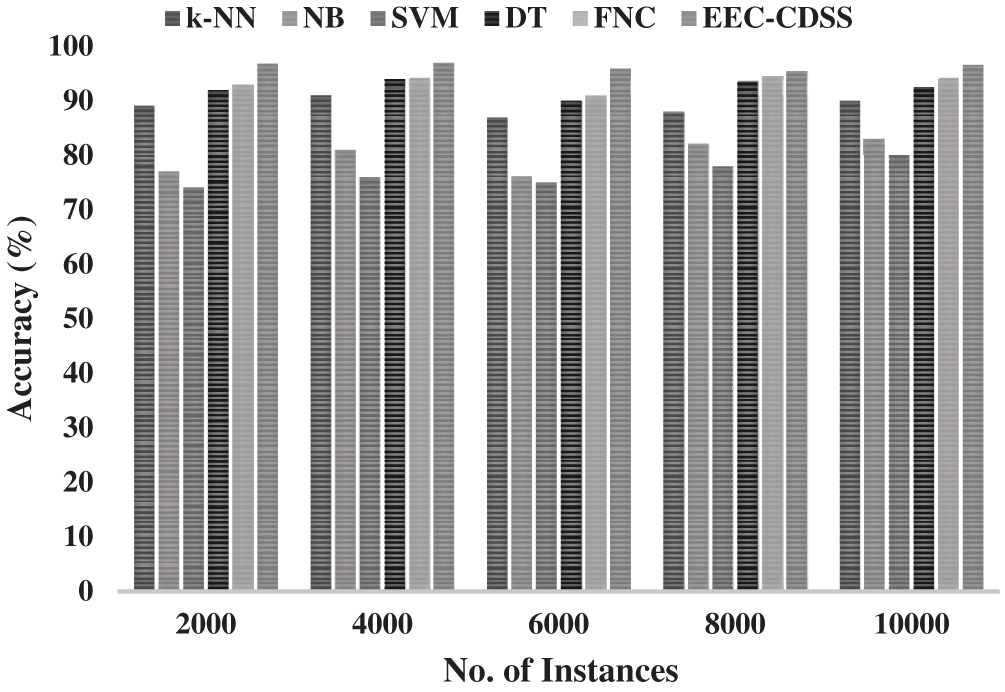
Figure 5: The accuracy analysis of EEC-CDSS model on diabetes disease dataset
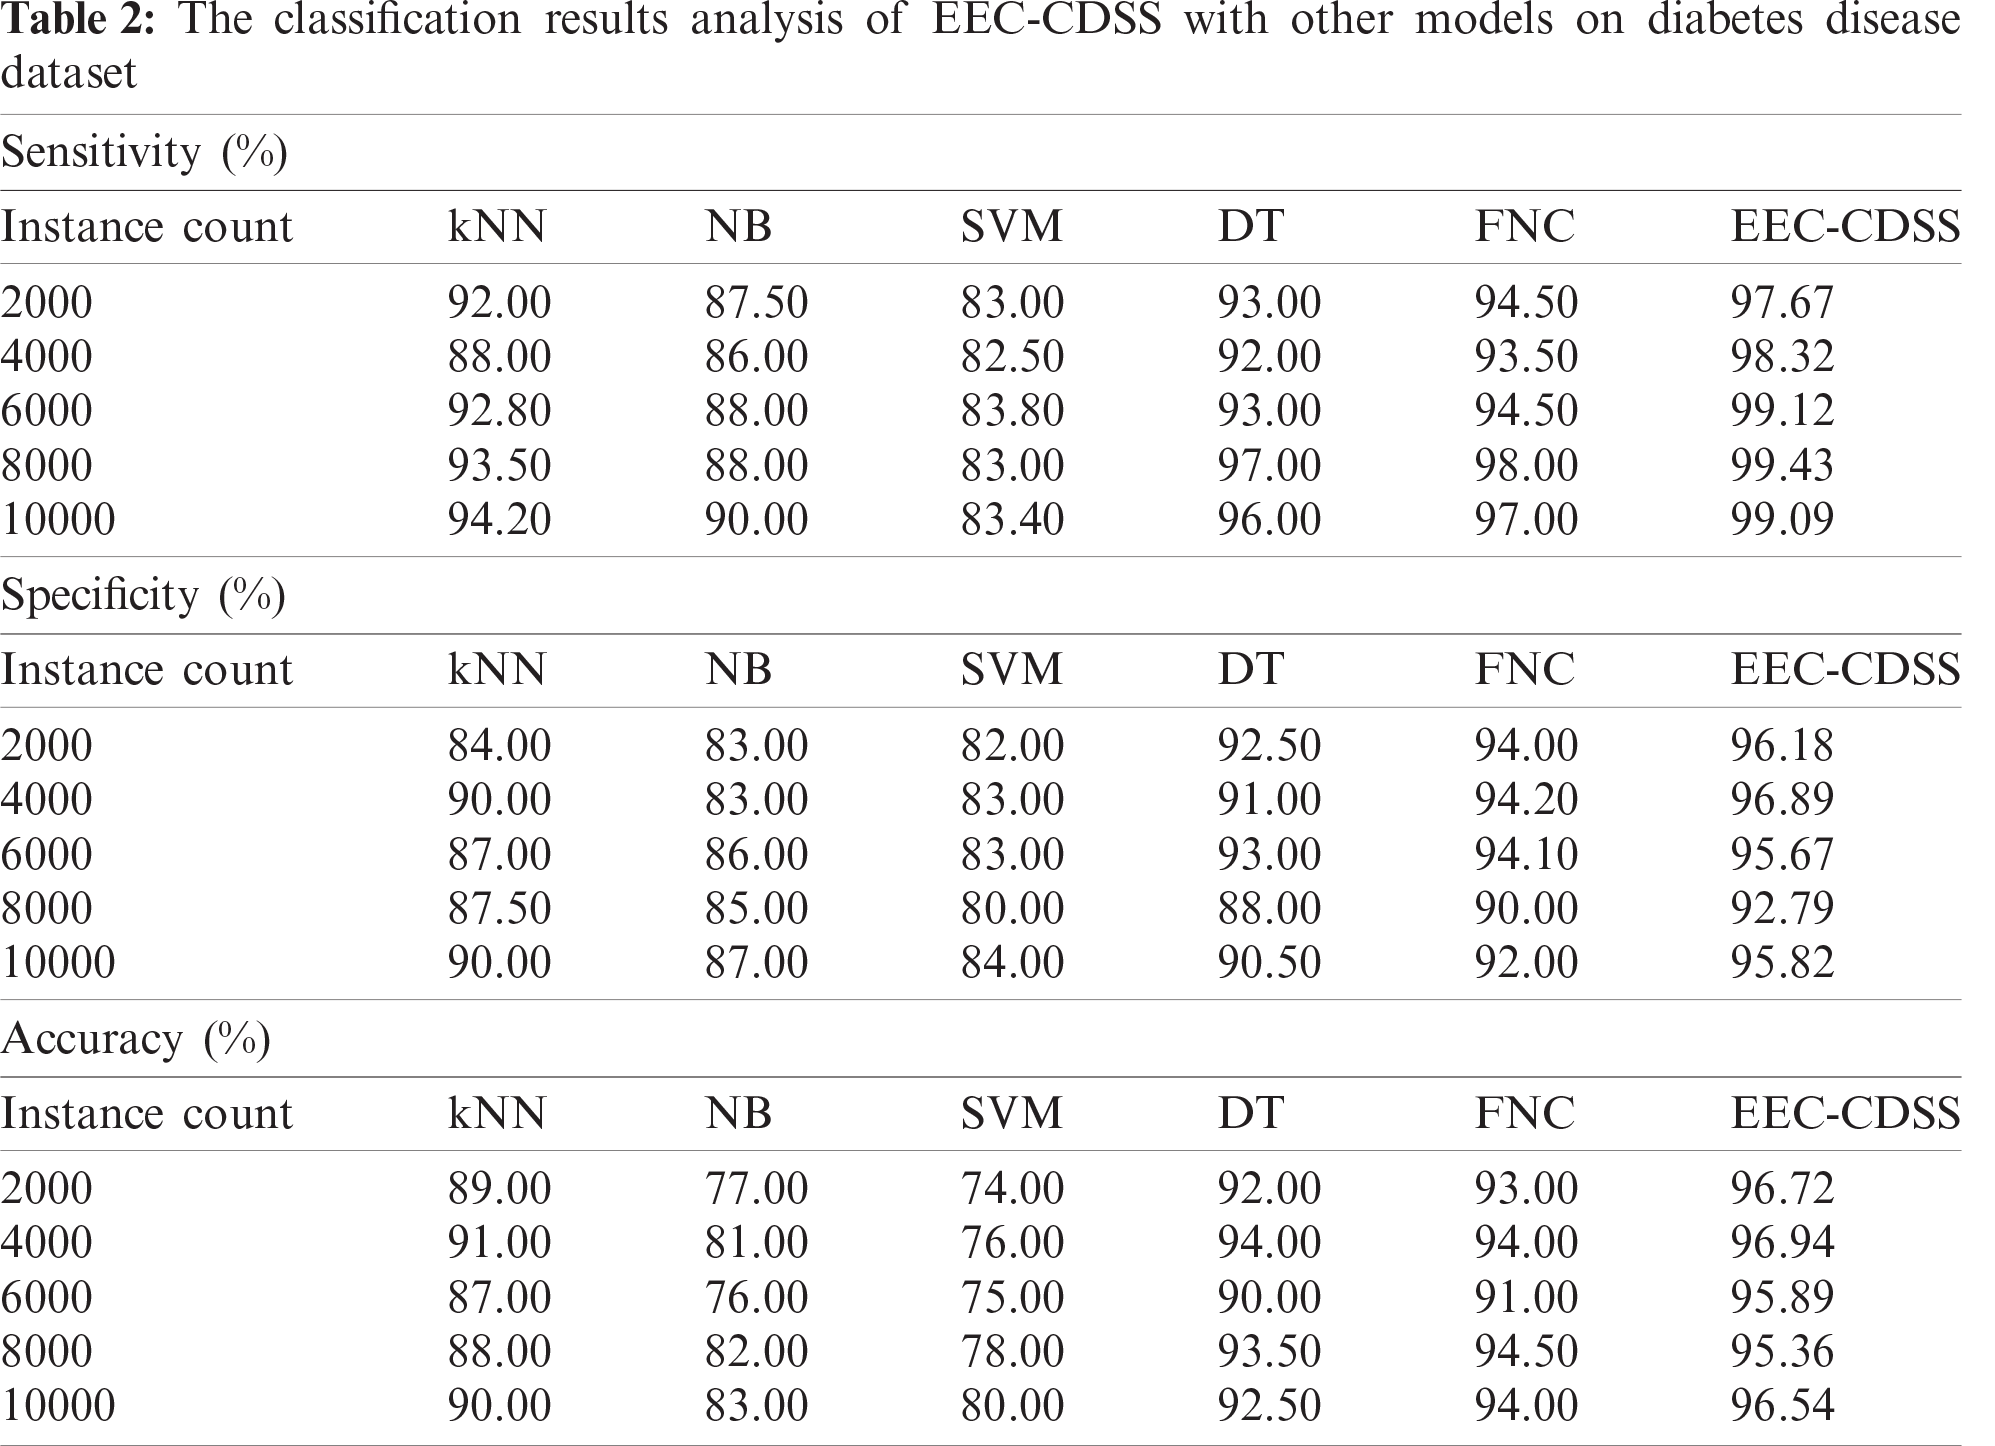
A sensitivity analysis of the EEC-CDSS model with traditional techniques denoted that the NB and SVM models have showcased poor performance and the KNN and DT models have exhibited moderately closer sensitivity value. Additionally, the FNC model has outperformed higher to compare previous methods. Thus, the presented EEC-CDSS model has accomplished a maximum sensitivity under all the instances. For sample, on the presence of 2000 instances, the EEC-CDSS model has depicted effective sensitivity of 97.67% whereas the KNN, NB, SVM, DT, and FNC models have resulted in reduced sensitivity of 92%, 87.50%, 83%, 93%, and 94.50% respectively. Next, on the presence of 10000 instances, the EEC-CDSS model has illustrated productive sensitivity of 99.09% whereas the KNN, NB, SVM, DT, and FNC models have led to a minimum sensitivity of 94.20%, 90%, 83.40%, 96%, and 97% respectively. Specificity analysis of the EEC-CDSS model with existing techniques denoted that the NB and SVM models have shown poor performance whereas the KNN and DT models have exhibited moderately closer specificity value. Besides, the FNC model has outperformed higher to compare general methods. But the presented EEC-CDSS model has accomplished a maximum specificity under all the instances. For instance, in the presence of 2000 instances, the EEC-CDSS model has depicted efficient specificity of 96.18% whereas the KNN, NB, SVM, DT, and FNC models have led to lower specificity of 84%, 83%, 82%, 92.50%, and 94% respectively. On the other hand, on the application of 10000 instances, the EEC-CDSS model has demonstrated effective specificity of 95.82% while the KNN, NB, SVM, DT, and FNC models have led to a compact specificity of 90%, 87%, 84%, 90.50%, and 92% respectively. Accuracy analysis of the EEC-CDSS model with former techniques implied that the NB and SVM methods have showcased poor performance whereas the KNN and DT models have exhibited considerable accuracy value. Additionally, the FNC model has outperformed higher to compare previous methods. But the projected EEC-CDSS model has accomplished a maximum accuracy under all the instances. For example, in the presence of 2000 instances, the EEC-CDSS model has demonstrated effectual accuracy of 96.72% while the KNN, NB, SVM, DT, and FNC methods have resulted in minimum accuracy of 89%, 77%, 74%, 92%, and 93% respectively. Followed by, on the existence of 10000 instances, the EEC-CDSS model has demonstrated effective accuracy of 96.54% and the KNN, NB, SVM, DT, and FNC models have led to a lower accuracy of 90%, 83%, 80%, 92.50%, and 94% respectively.
4.3 Energy Efficiency Analysis of EEC-CDSS Model
Tab. 3 and Fig. 6 illustrates the TEC investigation of the EEC-CDSS model with existing techniques on distinct IoT devices. The figure depicted that the PSO algorithm and GWO algorithm have consumed maximum TEC whereas a slightly reduced TEC is provided by the CSO algorithm. But the EEC-CDSS model has demonstrated effective TEC over the other methods. For instance, under the presence of 50 IoT sensors, the EEC-CDSS model has resulted in the least TEC of 44% whereas the CSO, GWO, and PSO algorithms have required an increased TEC of 62%, 65%, and 69% respectively. At the same time, under the presence of 100 IoT sensors, the EEC-CDSS model has generated a minimum TEC of 51% whereas the CSO, GWO, and PSO algorithms have acquired an increased TEC of 64%, 72%, and 76% correspondingly.
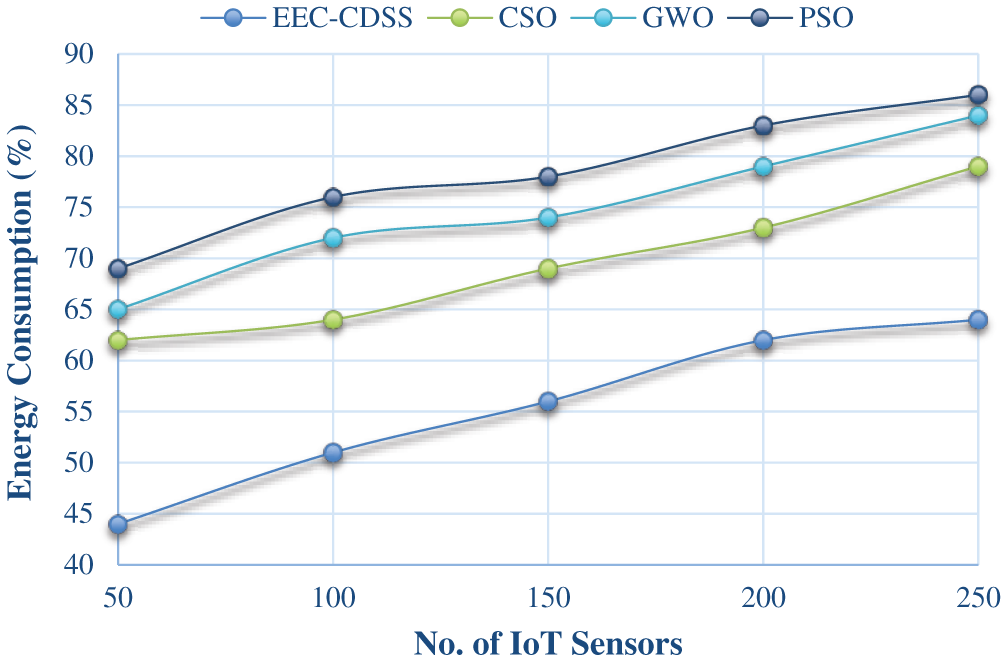
Figure 6: Total energy consumption analysis of EEC-CDSS model
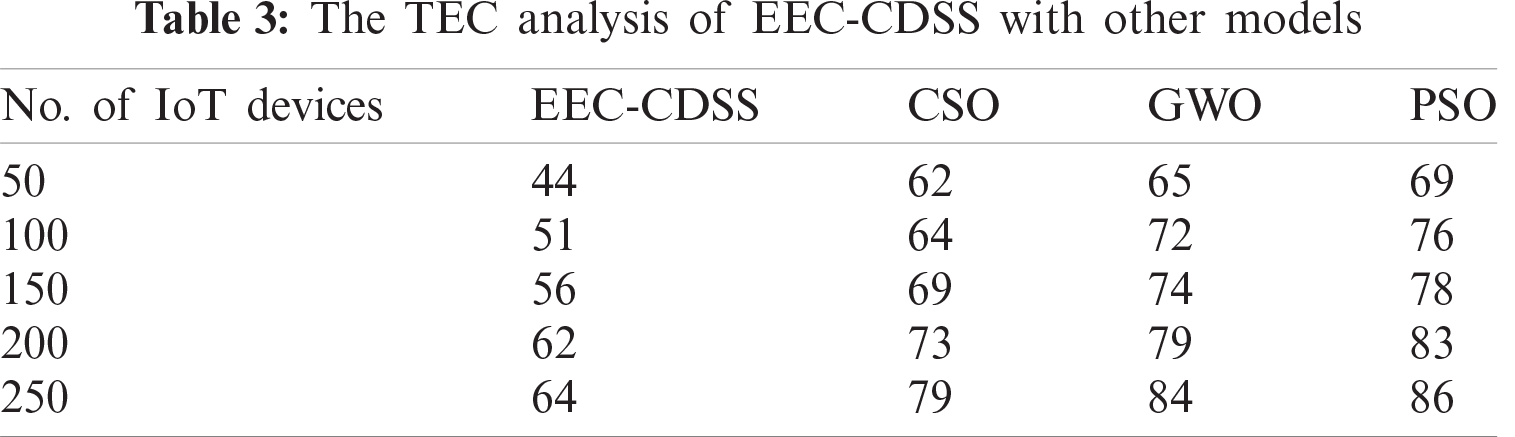
Along with that, under the presence of 150 IoT sensors, the EEC-CDSS method has resulted in a reduced TEC of 56% while the CSO, GWO, and PSO algorithms have required an increased TEC of 69%, 74%, and 78% respectively. On continuing with, under the presence of 200 IoT sensors, the EEC-CDSS scheme has resulted in the least TEC of 62% whereas the CSO, GWO, and PSO approaches have required an increased TEC of 73%, 79%, and 83% respectively. Simultaneously, under the existence of 250 IoT sensors, the EEC-CDSS method has resulted in the least TEC of 64% whereas the CSO, GWO, and PSO algorithms have required an improved TEC of 79%, 84%, and 86% respectively. By looking into the above-mentioned tables and figures, it is observed that the EEC-CDSS model has resulted in an improved energy efficient performance with maximum classification performance. Therefore, the EEC-CDSS model can be employed as an effective tool for disease diagnosis in the embedded IoT environment without sacrificing energy.
This paper has presented a novel EEC-CDSS model for embedded IoT environments. The objective of the EEC-CDSS model is to effectively communicate the medical data from IoT devices and accomplish accurate diagnostic process. Primarily, the IoT devices placed on the human body observes the medical data. At the same time, the PSO-L-L algorithm gets executed to determine the optimal cluster heads (CHs) and perform cluster construction. Next to that, the CHs transmit the collected medical information to the cloud server where the actual diagnosis process begins. Subsequently, the VAE model is applied to determine the appropriate class label of the applied medical data. Finally, in case of abnormality, an alarm will be raised to alert the patient, hospital environment, and caretaker. For examining the proficient performance of the EEC-CDSS model, an extensive set of experimentations were performed on the benchmark heart disease and diabetes dataset. The obtained values stressed out the betterment of the EEC-CDSS model interms of energy efficiency and classification accuracy. In future, the performance of the EEC-CDSS model can be improvised using outlier detection and feature selection methodologies.
Funding Statement: This research was supported by the Ministry of Trade, Industry & Energy (MOTIE), Korea Institute for Advancement of Technology (KIAT) through the Encouragement Program for The Industries of Economic Cooperation Region (P0006082) and the Soonchunhyang University Research Fund.
Conflicts of Interest: The authors declare that they have no conflicts of interest to report regarding the present study.
1. A. A. Mutlag, M. K. A. Ghani, N. Arunkumar, M. A. Mohammed and O. Mohd, “Enabling technologies for fog computing in healthcare IoT systems,” Future Generation Computer Systems, vol. 90, no. 3, pp. 62–78, 2019. [Google Scholar]
2. J. L. Shah, H. F. Bhat and A. I. Khan, “Integration of cloud and IoT for smart e-healthcare,” in Healthcare Paradigms in the Internet of Things Ecosystem. Cambridge, Massachusetts, United States: Academic Press, pp. 101–136, 2021. [Google Scholar]
3. M. U. Ahmed, H. Banaee, X. P. Rafael and A. Loutfi, “Intelligent healthcare services to support health monitoring of elderly,” in Int. Internet of Things Summit. Proc: Lecture Notes of the Institute for Computer Sciences, Social Informatics and Telecommunications Engineering Book Series, Cham: Springer, vol. 150, pp. 178–186, 2015. [Google Scholar]
4. V. Jagadeeswari, V. Subramaniyaswamy, R. Logesh and V. Vijayakumar, “A study on medical internet of things and big data in personalized healthcare system,” Health Information Science and Systems, vol. 6, no. 1, pp. 1–20, 2018. [Google Scholar]
5. B. Xu, L. D. Xu, H. Cai, C. Xie, J. Hu et al., “Ubiquitous data accessing method in IoT-based information system for emergency medical services,” IEEE Transactions on Industrial Informatics, vol. 10, no. 2, pp. 1578–1586, 2014. [Google Scholar]
6. H. Banaee, M. U. Ahmed and A. Loutfi, “Data mining for wearable sensors in health monitoring systems: A review of recent trends and challenges,” Sensors, vol. 13, no. 12, pp. 17472–17500, 2013. [Google Scholar]
7. M. W. Zhang, T. Tsang, E. Cheow, C. S. Ho, N. B. Yeong et al., “Enabling psychiatrists to be mobile phone app developers: Insights into app development methodologies,” JMIR MHealth and UHealth, vol. 2, no. 4, pp. 1–8, 2014. [Google Scholar]
8. A. Hussain, R. Wenbi, A. Lopes, M. Nadher and M. Mudhish, “Health and emergency care platform for the elderly and disabled people in the smart city,” Journal of Systems and Software, vol. 110, pp. 253–263, 2015. [Google Scholar]
9. L. Catarinucci, D. D. Donno, L. Mainetti, L. Palano, L. Patrono et al., “An IoT-aware architecture for smart healthcare systems,” IEEE Internet of Things Journal, vol. 2, no. 6, pp. 515–526, 2015. [Google Scholar]
10. P. Kakria, N. K. Tripathi and P. Kitipawang, “A real-time health monitoring system for remote cardiac patients using smartphone and wearable sensors,” International Journal of Telemedicine and Applications, vol. 2015, pp. 1–11, 2015. [Google Scholar]
11. R. Bharathi, T. Abirami, S. Dhanasekaran, D. Gupta, A. Khanna et al., “Energy efficient clustering with disease diagnosis model for IoT based sustainable healthcare systems,” Sustainable Computing: Informatics and Systems, vol. 28, pp. 100453, 2020. [Google Scholar]
12. S. H. Kim and K. Chung, “Emergency situation monitoring service using context motion tracking of chronic disease patients,” Cluster Computing, vol. 18, no. 2, pp. 747–759, 2015. [Google Scholar]
13. D. D. Patil and V. M. Wadhai, “Adaptive real time data mining methodology for wireless body area network based healthcare applications,” Advanced Computing: An International Journal, vol. 3, no. 4, pp. 59–70, 2012. [Google Scholar]
14. A. Dhobley, N. A. Ghodichor and S. S. Golait, “An overview of wireless sensor networks for health monitoring in hospitals via mobile,” International Journal of Advanced Research in Computer and Communication Engineering, vol. 4, no. 1, pp. 169–171, 2015. [Google Scholar]
15. A. Bhandari, A. Gupta and D. Das, “Improvised apriori algorithm using frequent pattern tree for real time applications in data mining,” Procedia Computer Science, vol. 46, pp. 644–651, 2015. [Google Scholar]
16. J. Yin, Q. Yang and J. J. Pan, “Sensor-based abnormal human-activity detection,” IEEE Transactions on Knowledge and Data Engineering, vol. 20, no. 8, pp. 1082–1090, 2008. [Google Scholar]
17. M. D. Assuno, R. N. Calheiros, S. Bianchi, M. A. Netto and R. Buyya, “Big data computing and clouds: Trends and future directions,” Journal of Parallel and Distributed Computing, vol. 79–80, pp. 3–15, 2015. [Google Scholar]
18. M. Andreolini, M. Colajanni, M. Pietri and S. Tosi, “Adaptive, scalable and reliable monitoring of big data on clouds,” Journal of Parallel and Distributed Computing, vol. 79, pp. 67–79, 2015. [Google Scholar]
19. S. K. Lakshmanaprabu, S. N. Mohanty, S. S. Rani, S. Krishnamoorthy, J. Uthayakumar et al., “Online clinical decision support system using optimal deep neural networks,” Applied Soft Computing, vol. 81, pp. 1–10, 2019. [Google Scholar]
20. A. F. S. Devaraj, M. Elhoseny, S. Dhanasekaran, E. L. Lydia and K. Shankar, “Hybridization of firefly and improved multi-objective particle swarm optimization algorithm for energy efficient load balancing in cloud computing environments,” Journal of Parallel and Distributed Computing, vol. 142, no. 4, pp. 36–45, 2020. [Google Scholar]
21. M. Elhoseny, K. Shankar, S. K. Lakshmanaprabu, A. Maseleno and N. Arunkumar, “Hybrid optimization with cryptography encryption for medical image security in internet of things,” Neural Computing and Applications, vol. 32, no. 15, pp. 10979–10993, 2020. [Google Scholar]
22. Y. Li, X. Zhu and J. Liu, “An improved moth-flame optimization algorithm for engineering problems,” Symmetry, vol. 12, no. 8, pp. 1234, 2020. [Google Scholar]
23. S. Zavrak and M. İskefiyeli, “Anomaly-based intrusion detection from network flow features using variational autoencoder,” IEEE Access, vol. 8, pp. 108346–108358, 2020. [Google Scholar]
24. Heart disease and diabetes dataset, UCI Machine Learning Repository, [Online]. Available: http://archive.ics.uci.edu/ml/index.php (accessed on 17.01.2021). [Google Scholar]
25. P. Verma and S. K. Sood, “Cloud-centric IoT based disease diagnosis healthcare framework,” Journal of Parallel and Distributed Computing, vol. 116, no. 15, pp. 27–38, 2018. [Google Scholar]
26. P. M. Kumar, S. Lokesh, R. Varatharajan, G. C. Babu and P. Parthasarathy, “Cloud and IoT based disease prediction and diagnosis system for healthcare using fuzzy neural classifier,” Future Generation Computer Systems, vol. 86, no. 3, pp. 527–534, 2018. [Google Scholar]
 | This work is licensed under a Creative Commons Attribution 4.0 International License, which permits unrestricted use, distribution, and reproduction in any medium, provided the original work is properly cited. |