DOI:10.32604/cmc.2021.012302
| Computers, Materials & Continua DOI:10.32604/cmc.2021.012302 | |
| Article |
Improving Stock Price Forecasting Using a Large Volume of News Headline Text
1Department of Mathematics, Clemson University, Hangzhou, 310018, China
2Institute of Graphics and Image, Hangzhou Dianzi University, Hangzhou, 310018, China
*Corresponding Author: Daxing Zhang. Email: dxzhang@hdu.edu.cn
Received: 30 August 2020; Accepted: 20 May 2021
Abstract: Previous research in the area of using deep learning algorithms to forecast stock prices was focused on news headlines, company reports, and a mix of daily stock fundamentals, but few studies achieved excellent results. This study uses a convolutional neural network (CNN) to predict stock prices by considering a great amount of data, consisting of financial news headlines. We call our model N-CNN to distinguish it from a CNN. The main concept is to narrow the diversity of specific stock prices as they are impacted by news headlines, then horizontally expand the news headline data to a higher level for increased reliability. This model solves the problem that the number of news stories produced by a single stock does not meet the standard of previous research. In addition, we then use the number of news headlines for every stock on the China stock exchange as input to predict the probability of the highest next day stock price fluctuations. In the second half of this paper, we compare a traditional Long Short-Term Memory (LSTM) model for daily technical indicators with an LSTM model compensated by the N-CNN model. Experiments show that the final result obtained by the compensation formula can further reduce the root-mean-square error of LSTM.
Keywords: Deep learning; recurrent neural network; convolutional neural network; long short-term memory; stocks forecasting
The price changes in financial markets are nonlinear and the influencing factors are variable. Stock markets attract many wealthy shareholders and researchers. Henrique et al. [1] study mentions a theory called efficient-market hypothesis (EMH), arguing that because financial markets will immediately adapt to any information available, people cannot predict the market’s movements. In many studies, securities analysts research the price changes in the stock market, then analyze this vast amount of data and come to useful conclusions. Professionals in this field invest a good deal of time in learning how to analyze data. Artificial intelligence technology is increasingly being incorporated in data analysis, particularly in the area of predicting stock movements.
Stock price forecasting methods can be divided into two categories: a time series method that was modeled by Aue et al. [2] using a process called autoregressive conditional heteroscedasticity (ARCH); and machine learning algorithms. As of 2018, models based on artificial neural networks (ANNs) and support vector machines (SVMs) were still at the core of a stock market’s analysis. ANNs contain many neurons, can handle the relationship between large amounts of data, and have excellent performance with financial time series data [3,4]. Multilayer feedforward networks (also called the BP network model) were used for time series data prediction [5]. Neural networks continue to improve. Convolutional neural networks (CNNs) and recurrent neural networks (RNN) offer good performance in a specific mode. Long short-term memory (LSTM) represents an improvement over RNNs and is considered to be the most suitable network for predicting stock data [6]. However, Kim et al. [7–9] expressed data and indicators of stock as a chart, leveraged CNN, and proposed a CNN-LSTM model, proving that CNN still plays an important role in the research of predicting stock prices.
LSTM inputs time series data for the purpose of prediction. Most stocks have more than 6,000 fundamentals, which means that technical analysis (TA) indicators have the same data sample. On the basis of a time series, news related to daily fluctuations in stock prices can also be part of another CNN algorithm input. Ding et al. [10] shows that shareholders can view stock-related news positively or negatively, which will determine whether they buy or sell stocks, thereby affecting the fluctuation of stock prices.
Improved algorithms related to LSTM all use fundamental indicators and TA indicators as input, but differ in the length of the predicted period. Rather et al. [11] concentrated on every five minutes when a stock price changes, Chung et al. [12] predicted daily stock price, and Weng et al. [13,14] predicted the price of stocks one month out for major U.S. stock and sector indices. However, daily price research is the most common time period. For the input dimension of daily price data, more data represents more information, which can reduce the likelihood of errors in a prediction.
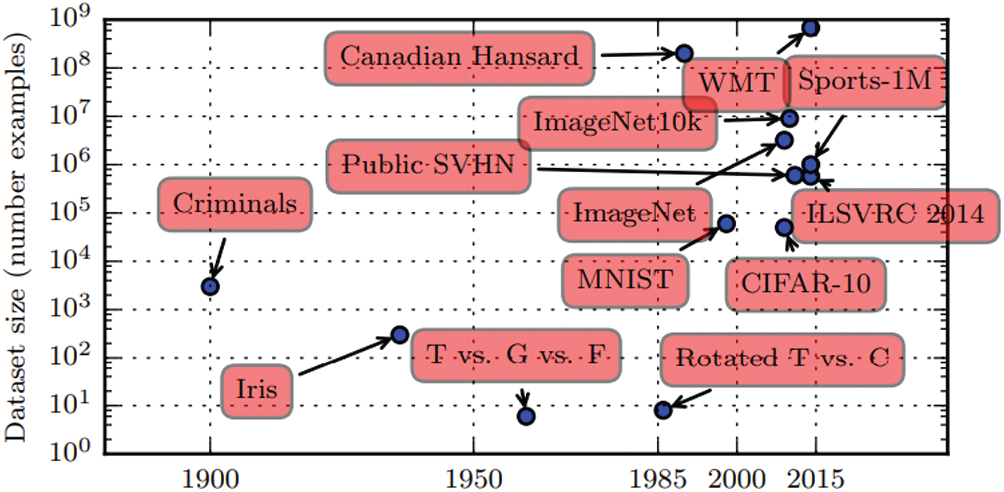
Figure 1: Increasing dataset size over time
Ding et al. [15] showed that no matter whether the news is weekly or monthly, it affects the stock market trend of the next day. Therefore, this study uses two weeks’ worth of news headlines as data. However, when they did related research, they only tracked the news data of current stocks, which resulted in an insufficient sample size for deep learning algorithms, and the final experimental results were not very promising. When using a supervised deep learning algorithm, at least 5000 of each type of labeled sample is required to reach an acceptable range. When the number of samples is 10 million, it is generally sufficient to surpass human performance. Goodfellow et al. [16], mentioned in Fig. 1 below, shows the amount of sample data that emerged from deep learning in 2015. The results of deep learning algorithms are positively correlated with the amount of data. While tracking a single stock, even when it starts to record news from the time a company goes public, most companies in China can only possess a sample of around 5,000. Emerging companies do not generate enough news samples, and so an emerging company cannot guarantee enough weight for an algorithm to predict the future price of stock. To expand the amount of stock news sample data, this paper unifies all stock news that can be collected, removes redundant information, improves the accuracy of experimental results, and expands the use of the algorithm to stock prediction.
This section describes the sources of the datasets used in this paper and distributions to each network model. There were two input types: TA indicators, which display daily financial technical directional-movements series called Stock datasets, and half-month financial news titles of each stock, called News datasets.
The basic stock data were obtained from Tonghuashun (China’s professional economic website), marked as
Web crawler technology was used to crawl daily data and TA indicators from the website. Data on 1014 individual stocks were obtained from listing up to 3/8/2019, including Open, Close, High, Low, Volume, Vibration, as LSTM first layer input, with 80% of stocks representing the training set, and 20% the test set. The calculation of TA indicators is similar to that in Guresen’s [4].
The majority of papers predict or calculate the composite index as their main research target, such as the Shanghai Stock Exchange (SSE) Composite Index, which makes result more stable and more representative. The LSTM input indicators dataset is the largest one. The SSE Composite Index contains all the stocks listed on the SSE. In terms of time, the prices of stocks on the SSE tend to be more affected by political factors than ordinary events. The bigger the news, the greater the impact on the index [10]. However, the prices of individual stocks are easily influenced by significant company events. Therefore, the daily basic data of the SSE Composite Index
Data
News headlines text were also obtained from Tonghuashun. We call this data
Ding’s algorithm uses about 100 news headlines and content in order to predict each single stock price. Deep learning algorithms are often dependent on big data. If the data volume is low, the final result will be unsatisfactory for the LSTM algorithm. In Ding’s paper, the highest accuracy achieved by the algorithm is only 56%. The easiest way to increase accuracy of stock news on stock price forecasting algorithms is to increase the amount of text data. This paper proposes ideas for achieving this target volume.
Existing research tracked only single stock news series as input for calculating a specific stock price. That’s why the CNN net input dataset number is small. We think that, under normal circumstances, different stocks have different sensitivities to similar news, especially financial news. The price trends of A-shares will be stable even if the news said “Huge Funds Coming Soon,” but B-shares are more likely to be affected. A single stock may only produce 200 news stories in an entire year. To improve the final accuracy of using stock headlines for stock forecasts, this paper makes the assumption that each stock has exactly the same impact on similar news, and gathers all stocks’ news headlines within 15 days to calculate the next day’s price fluctuations. This method can improve the accuracy of the algorithm because of the large amount of data, while ignoring the negative effects caused by different stock sensitivity. In the Chinese stock market, there are now 3000 stocks. This means the number of news headlines for a single stock can be expanded by 3000 times. If a stock’s news is tracked within half month, the amount of sample data that can theoretically be news headlines could reach 1 million. The experiment described in Section 3 of this paper also studies the impact of news headline text data on the accuracy of the CNN.
In summary, this paper shifts from research on vertical data to research on horizontal data. All stocks’ price impact factors are considered the same, and stock headline data is horizontally enlarged at the same time. Unfortunately, this paper only uses the news headlines of 1014 stocks vs. all 3000 stocks in the Chinese stock market, and the amount of data is therefore expanded by 1014 times. Detailed data when tracking each stock’s news spans within 15 days, until 5/23/2019, and the news’s time limit on May 23rd, for example, is for the closing time of 3 pm, which is used to predict the highest price of May 24. This assumption is feasible if it can increase the amount of data expansion in the CNN in order to improve final accuracy. To further lessen the impact of different companies on the news sensitivity, after the text data is unified, the redundant text should be reduced. It has been observed that many news headlines contain names of companies and/or stocks. These names are not valid information for the actual algorithm, because this type of information is deleted in text preprocessing. For the 1014 stocks, there were 29,700 news headlines. Therefore, every stock had 29.3 news headlines on average. The training and test set settings are shown in Tab. 1. The training forecast set allocation ratio is the same as the stock's fundamental indicator dataset, and the news headlines are obtained. Of the text in the dataset, 80% is used for training, and the remaining 20% is used as a test set.

To verify the final network effect, we should re-establish verification set outside the time points of data
Fig. 2 shows the design of the CNN for news. First, data language type obtained from news headlines is Chinese. An embedding layer is needed to convert text into a word vector. In this step, we use the Word2vec tool and the continuous Bag of Words (CBOW) model for the conversion of Chinese word embedding.
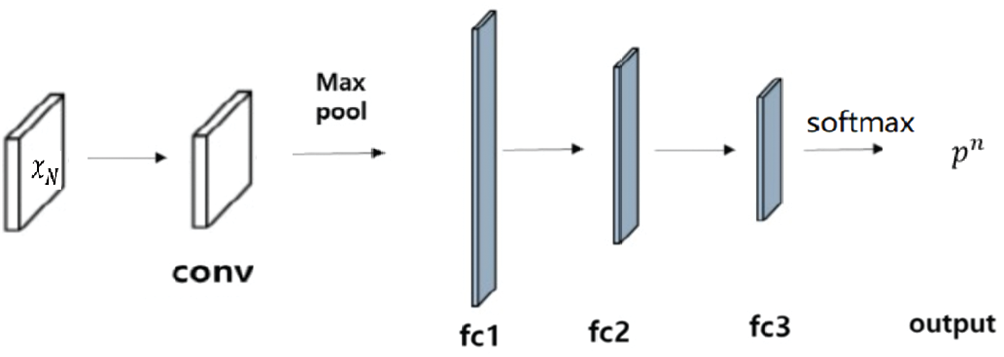
Figure 2: News CNN model architecture
The output of a word vector is a two-dimensional matrix, which is used as input of the convolutional layer. The convolutional layer is often followed by the pooling layer to reduce dimension, the number of parameters, and training time. Immediately after the pooling layer is a three fully connected (FC) layers. The third FC layer activation function is softmax, whose formula is shown as Eq. (1). Since we only need to convert stock-derived information into a rising or falling output, Softmax outputs only two types, a label that is 0 or 1. Score set S calculated by the pre-neuron is mapped by formula to interval (0, 1). The result is [
A recurrent neural network (RNN) differs from a traditional neural network in that it can consider the influence of information that has already appeared on the next prediction. LSTM performs better than the other RNNs [17] in long-term sequence data. Unlike an RNN that simply uses the hyperbolic tangent function (tanh) layer as the structure of repeating module, LSTM has more interactive layers, as shown in Fig. 3.
Eqs. (2) to (5) show calculations for each gate and cell state, where
W represents weight matrices and
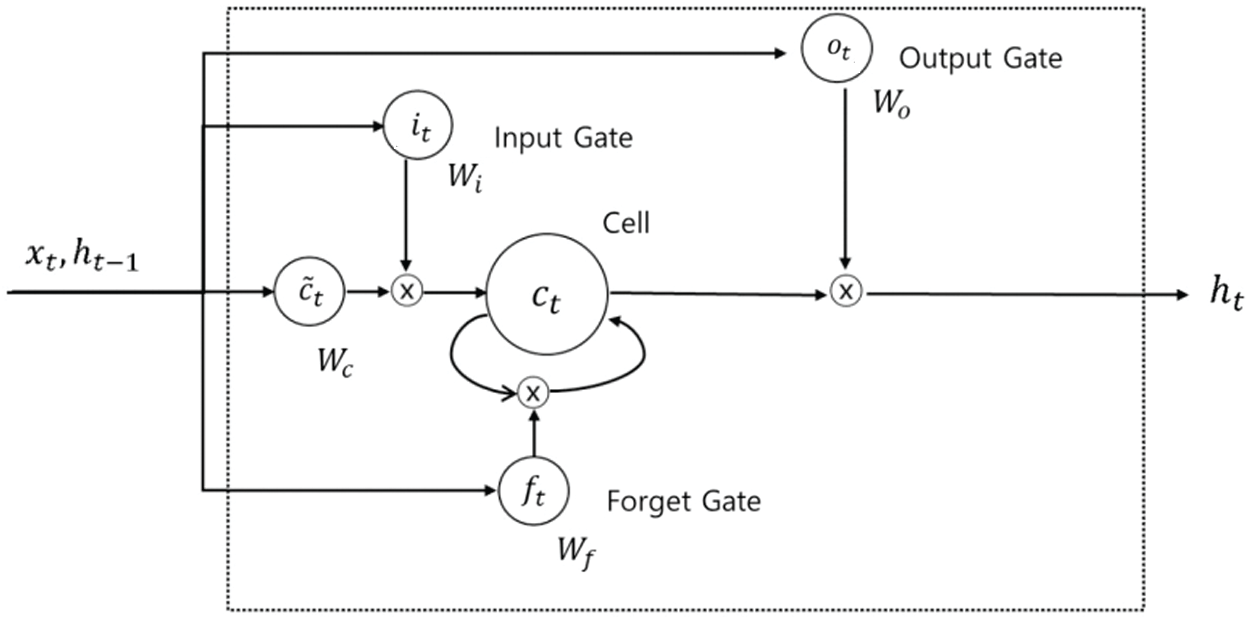
Figure 3: LSTM model architecture
So that data TA indicators would have a better effect on the actual network, we designed the D-LSTM model shown in Fig. 4. As described in Section 2.1, indicators include data Open, Close, High, Low, Volume, and Turnover. The data of the first four groups and transaction volume are of different orders of magnitude. Previous data should be normalized as input to the network before training. As shown in Eq. (6), where x represents the original value, after normalization, all data is compressed into a [−1,1] interval. This normalization method can not only reduce the difference in magnitude of the data, which may disable gradient decline, but also increase convergence speed and prediction accuracy [18]. As shown in Fig. 4, the increasing number of FC layers helps improve the network’s ability to predict nonlinearity. The output of this network will be used as a member of the final network, which is combined with news N-CNN network for the final calculation. Normalized data

Figure 4: D-LSTM network
The CNN is designed to verify the effectiveness of the N-CNN network. When using the network, D-LSTM is trained using data
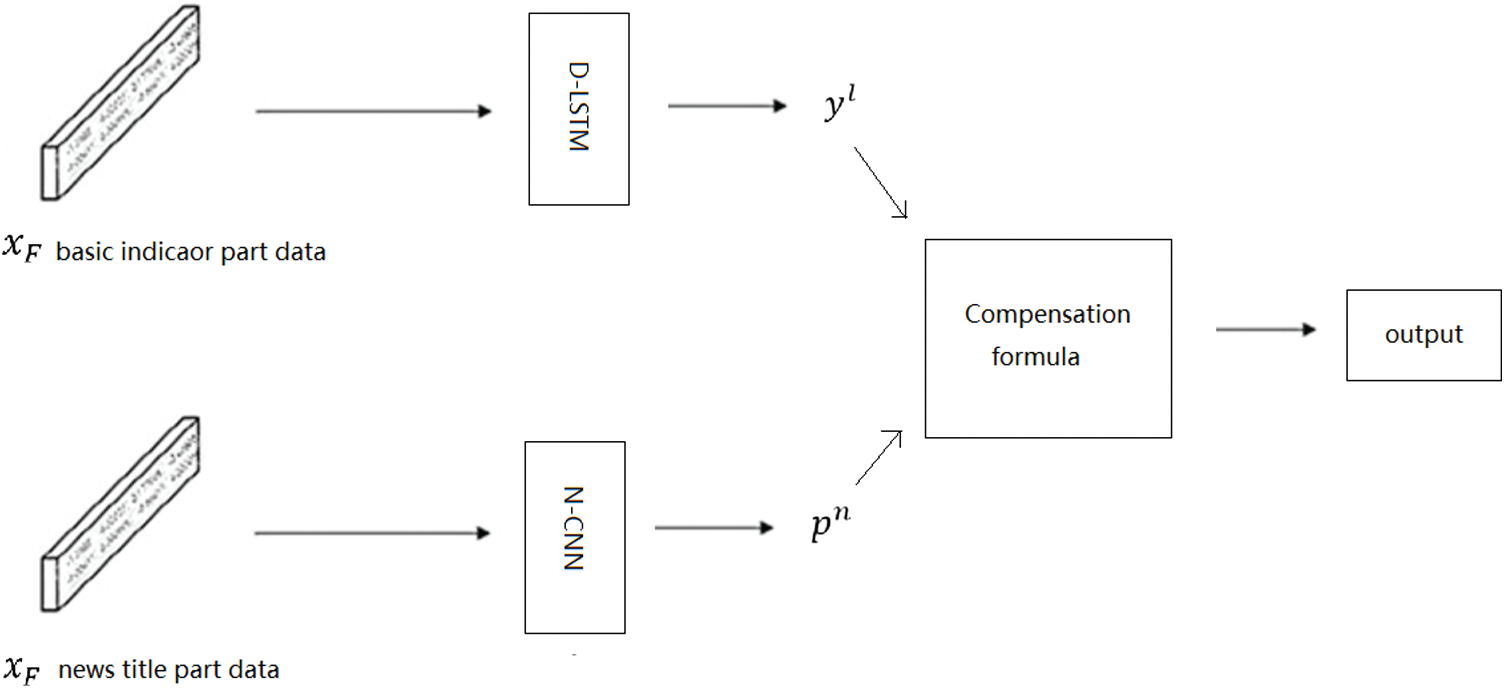
Figure 5: CNN-LSTM model architecture
(1) The CNN network results predict the value of the stock’s rise and fall on next day from news headline marked as [
(2) The result of LSTM
(3) Compensation parameter
Based on the D-LSTM model, calculating the highest price of stock on the second day is done by the test set. When set to
N is a number of test sets per stock, and
This section discusses the actual situation of N-CNN network accuracy using horizontally extended news headline data, D-LSTM, and the test results of CNN-LSTM from final data
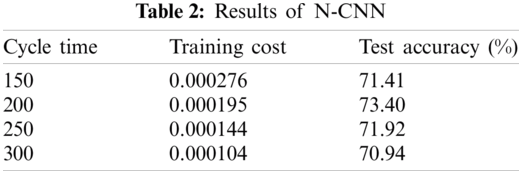
The training set uses cross-entropy loss function. The formula for calculating this is shown in (9). Parameter p indicates the distribution of true tokens, that is, the real price of the label layer on the next day. Parameter q is the predicted distribution of the training model, and it reflects the similarity between the predicted value of text and the actual value. The lower the loss value, the closer the training set to real data. This training dataset model used in this paper results in highly consistent accuracy under different cycle times. However, in this experiment, training set accuracy is a less important criterion than test set accuracy, which is used as the final evaluation standard for proving the generalization ability of CNN in natural language processing (NLP).
If all data
The following experiment was used to verify the impact of data sample size on N-CNN. We divided the 1014 stocks into 20%, 40%, 60%, 80%, and 100% samples, and kept the training set and test set ratio at 8:2. The input news text was also reduced accordingly. The most effective of all other parameters from the previous experiment, including training cycle of the training set, were the same. These experimental results are shown in Tab. 3 and Fig. 6.

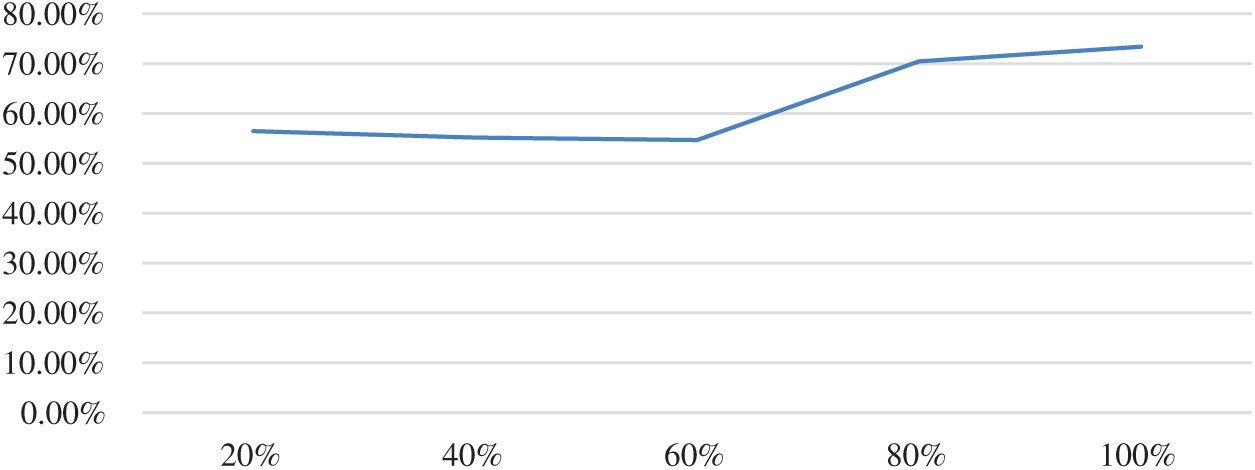
Figure 6: Relationship between sample size and accuracy
It can be seen that when data volume was below the 30,000 level, sample size is proportional to accuracy. This means that as long as the number of samples obtained is increased, accuracy will inevitably continue to increase until it reaches a level of saturation. This means that theoretically, if the amount of text for all news headlines for stocks listed on the China stock exchange, that is, a level of 10 million, then accuracy will increase significantly.
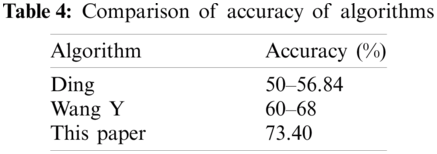
The other algorithm models used for forecasting stock prices are shown in Tab. 4. The Ding and Wang Y algorithms use the time series of several stocks, which results in different accuracy between different stock data samples. The algorithm proposed in this paper uses the average of all 1014 stocks.
The results of D-LSTM are similar to forecasting the trend of the next day’s stock market with that day’s basic indicator. The most commonly used equations for evaluating an algorithm are Eqs. (10) to (12)
This paper uses root-mean-square-error (RMSE) as the loss function for training of the training set in the D-LSTM, because RMSE is a good indicator for verifying the sample prediction error [9]. After training with RMSE loss function, we verified the prediction results of the other two indicators for the test set, and used root-mean-absolute-error (RMAE) to verify the deviation of the model system. In Eqs. (10) to (12), N is the number of samples to be calculated,
In the D-LSTM model, we set the number of trainings to 200, and the number of neurons in the FC and LSTM layers as 256. In the final CNN-LSTM model, the D-LSTM part of the experimental data used basic indicators of 600718–603993. The results are randomly selected and shown in Tab. 5.
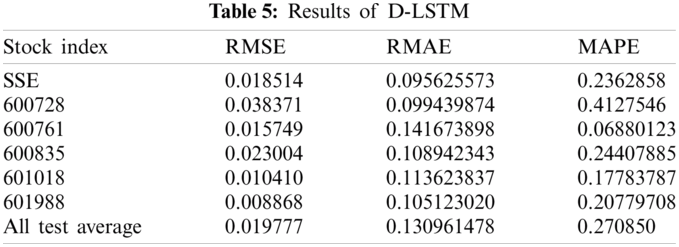
The Shanghai Composite Index has the largest amount of data and seems to be the most stable. The remaining stocks are all individual stocks. Some effects in the D-LSTM algorithm are worse than SSE, and some are better than SSE. The last line shows the average of the results of all the experiments. This average shows that individual stocks and the SSE have similar effects using D-LSTM model, and can reduce the RMSE to a level below 0.02.
Once we determined that news headlines did play a role in forecasting stock prices on the second day of the stock market, and the accuracy rate was greater than 70%, then we discovered that there was a way to further increase the accuracy of forecast value. An experiment was carried out by the steps described in CNN-LSTM design part. The time of final data

The experimental results show that the values of RMSE, RMAE, and mean absolute percentage error (MAPE) are the smallest when ∂ is set to 1.5. The result of ∂ =1.5 is compared with the original D-LSTM experiment, where RMSE, RMAE, and MAPE increased by about 8.3%, about 4%, and about 36.6%, respectively.
This paper proposed a model for looking at an increased volume of data, consisting of numerous stock news headlines, to improve the accuracy of CNN. Our proposed N-CNN model calculates the difference between predicted stock price values and actual values through the use of a compensation formula, which further improves the results from LSTM in stock price forecasting.
There are still some things we need to do in the future. First, news headlines lack a standardized time format. Since stock-related news is not subject to standardized regulation, several articles are produced each day, with some stocks having three articles on the same day and some having only one article. As a result, N-CNN input dimensions are not unified, which result in a flaw in training of the CNN model, which in turn reduces the accuracy of the test set. Second, when news headline text is converted into a word vector, numbers will be filtered out. This aspect can successfully filter out information of stock search index that often appears in a news headline, so that the model can focus on information and filter out the value of financial or stock price data, which can improve the accuracy of forecast results. Third, different stocks have different sensitivities to news. If the sensitivity of each stock to news is considered in the N-CNN model, deep learning gives each stock different sensitivity, which will also improve the results.
Acknowledgement: We thank LetPub (https://www.letpub.com) for its linguistic assistance during the preparation of this manuscript.
Funding Statement: This work was supported by the Natural Science Foundation of China (61572160).
Conflicts of Interest: The authors declare that they have no conflicts of interest to report regarding the present study.
1. B. M. Henrique, V. A. Sobreiro and H. Kimura, “Literature review: Machine learning techniques applied to financial market prediction,” Expert Systems with Applications, vol. 124, no. 3, pp. 226–251, 2019. [Google Scholar]
2. A. Aue, L. Horváth and D. F. Pellatt, “Functional generalized autoregressive conditional heteroskedasticity,” Journal of Time Series Analysis, vol. 38, no. 1, pp. 3–21, 2017. [Google Scholar]
3. M. K. Okasha, “Using support vector machines in financial time series forecasting,” International Journal of Statistics and Applications, vol. 4, no. 1, pp. 28–39, 2014. [Google Scholar]
4. E. Guresen, G. Kayakutlu and T. U. Daim, “Using artificial neural network models in stock market index prediction,” Expert Systems with Applications, vol. 38, no. 8, pp. 10389–10397, 2011. [Google Scholar]
5. M. T. Wang and Y. Yong, “The research on stock price forecast model based on data mining of BP neural networks,” in 2013 Third Int. Conf. on Intelligent System Design and Engineering Applications, Hong Kong, China, IEEE, pp. 1526–1529, 2013. [Google Scholar]
6. Y. Wang, Y. Liu, M. Wang and R. Liu, “LSTM Model Optimization on Stock Price Forecasting,” in 2018 17th Int. Sym. on Distributed Computing and Applications for Business Engineering and Science, Wuxi, China, IEEE, pp. 173–177, 2018. [Google Scholar]
7. J. Cao, Z. Li and J. Li, “Financial time series forecasting model based on CEEMDAN and LSTM,” Statistical Mechanics and its Applications, vol. 519, no. 2, pp. 127–139, 2019. [Google Scholar]
8. P. Brest and K. Born, “When can impact investing create real impact,” Stanford Social Innovation Review, vol. 11, no. 4, pp. 22–31, 2013. [Google Scholar]
9. T. Kim and H. Y. Kim, “Forecasting stock prices with a feature fusion LSTM-CNN model using different representations of the same data,” PLOS One, vol. 14, no. 2, pp. e0212320, 2019. [Google Scholar]
10. X. Ding, Y. Zhang, T. Liu and J. Duan, “Using structured events to predict stock price movement: An empirical investigation,” in Proc. of the 2014 Conf. on Empirical Methods in Natural Language Processing, Doha, Qatar, pp. 1415–1425, 2014. [Google Scholar]
11. A. M. Rather, A. Agarwal and V. N. Sastry, “Recurrent neural network and a hybrid model for prediction of stock returns,” Expert Systems with Applications, vol. 42, no. 6, pp. 3234–3241, 2015. [Google Scholar]
12. H. Chung and K. Shin, “Genetic algorithm-optimized long short-term memory network for stock market prediction,” Sustainability, vol. 10, no. 10, pp. 3765, 2018. [Google Scholar]
13. B. Weng, W. Martinez, Y. T. Tsai, C. Li, L. Lu et al., “Macroeconomic indicators alone can predict the monthly closing price of major US indices: Insights from artificial intelligence, time-series analysis and hybrid models,” Applied Soft Computing, vol. 71, no. 1, pp. 685–697, 2018. [Google Scholar]
14. S. E. Gao, B. S. Lin and C. M. Wang, “Share price trend prediction using CRNN with LSTM structure,” in 2018 Int. Sym. on Computer, Consumer and Control, Taichung, Taiwan, IEEE, pp. 10–13, 2018. [Google Scholar]
15. X. Ding, Y. Zhang, T. Liu and J. Duan, “Deep learning for event-driven stock prediction,” in Twenty-Fourth Int. Joint Conf. on Artificial Intelligence, pp. 2327–2333, 2015. [Google Scholar]
16. I. Goodfellow, Y. Bengio and A. Courville, Deep learning, 1st ed., vol. 1. Cambridge, MA, USA: MIT Press, pp. 18, 2016. [Google Scholar]
17. S. Selvin, R. Vinayakumar, E. A. Gopalakrishnan, V. K. Menon and K. P. Soman, “Stock price prediction using LSTM, RNN and CNN-sliding window model,” Int. Conf. on Advances in Computing, Communications and Informatics, IEEE, pp. 1643–1647, 2017. [Google Scholar]
18. S. Ioffe and C. Szegedy, “Batch normalization: Accelerating deep network training by reducing internal covariate shift,” Int. Conf. on Machine Learning, pp. 448–456, 2015. [Google Scholar]
 | This work is licensed under a Creative Commons Attribution 4.0 International License, which permits unrestricted use, distribution, and reproduction in any medium, provided the original work is properly cited. |