DOI:10.32604/cmc.2021.017206
| Computers, Materials & Continua DOI:10.32604/cmc.2021.017206 | |
| Article |
A Vicenary Analysis of SARS-CoV-2 Genomes
1Department of Mathematics, Pingla Thana Mahavidyalaya, Paschim Medinipur, 721140, India
2Computer Science & Engineering, National Institute of Technology Srinagar, Hazratbal, 190006, J&K, India
3Department of Computer Science and Engineering, SRM University, Amaravati, AP, 522502, India
4School of Computer Science and Engineering, Taylor’s University, Subang Jaya, 47500, Malaysia
5Department of Computer Science and Engineering, Aliah University, Kolkata, India
6Materials Science Research Institute, King Addulaziz City for Science and Technology (KACST), Riyad, 6086, Kingdom of Saudi Arabia
7General Administration of Research and Development Laboratories, King Abdulaziz City for Science and Technology (KACST), Riyad, 6086, Kingdom of Saudi Arabia
*Corresponding Author: Thamer A. Tabbakh. E-mail: ttabbakh@kacst.edu.sa
Received: 24 January 2021; Accepted: 01 May 2021
Abstract: Coronaviruses are responsible for various diseases ranging from the common cold to severe infections like the Middle East syndromes and the severe acute respiratory syndrome. However, a new coronavirus strain known as COVID-19 developed into a pandemic resulting in an ongoing global public health crisis. Therefore, there is a need to understand the genomic transformations that occur within this family of viruses in order to limit disease spread and develop new therapeutic targets. The nucleotide sequences of SARS-CoV-2 are consist of several bases. These bases can be classified into purines and pyrimidines according to their chemical composition. Purines include adenine (A) and guanine (G), while pyrimidines include cytosine (C) and tyrosine (T). There is a need to understand the spatial distribution of these bases on the nucleotide sequence to facilitate the development of antivirals (including neutralizing antibodies) and epitomes necessary for vaccine development. This study aimed to evaluate all the purine and pyrimidine associations within the SARS-CoV-2 genome sequence by measuring mathematical parameters including; Shannon entropy, Hurst exponent, and the nucleotide guanine-cytosine content. The Shannon entropy is used to identify closely associated sequences. Whereas Hurst exponent is used to identifying the auto-correlation of purine-pyrimidine bases even if their organization differs. Different frequency patterns can be used to determine the distribution of all four proteins and the density of each base. The GC-content is used to understand the stability of the DNA. The relevant genome sequences were extracted from the National Center for Biotechnology Information (NCBI) virus database. Furthermore, the phylogenetic properties of the COVID-19 virus were characterized to compare the closeness of the COVID-19 virus with other coronaviruses by evaluating the purine and pyrimidine distribution.
Keywords: Fractal dimension; shannon entropy; hurst exponent; GC-content; SARS-CoV-2
The coronavirus disease pandemic (COVID-19) is an ongoing global public health crisis caused by the severe acute respiratory syndrome coronavirus 2 (SARS-COV-2) [1,2]. The disease originally started in Wuhan, China, and quickly spread to the rest of the world, infecting millions of people worldwide [3–5]. The rapid spread of the virus has overwhelmed the most advanced healthcare systems and has so far resulted in the death of over 2.5 million people worldwide. In January 2020, the World Health Organization (WHO) affirmed COVID-19 as a public health emergency of international concern [6–9]. In order to control the disease and hence give time for the healthcare systems to cope with the sudden demand, lockdowns were ordered in many countries worldwide, leading to major economic and social disruption. In view of this, there is an urgent need to understand the genomic of the virus so as to limit the spread, reduce mortality from the disease, and develop new effective treatments.
The SARS-CoV-2 was found to be connected to two bat-derived stern acute respiratory syndrome-like coronaviruses; bat-SL-CoVZC45 and bat-SLCoVZXC21 [10]. On the 11th February 2020, the WHO formally named the disease COVID-19. From that day onwards, the coronavirus research group of the International Committee on Taxonomy of Viruses called the virus SARS-CoV-2 [11]. The National Center for Biotechnology Information (NCBI) has a complete genomic sequence of the CoV evolutionary basis and molecular uniqueness [12]. Ceraolo et al. [13] identified a good sequence relationship (above 99%) between all sequenced 2019 CoVs genomes and the bat CoV genomes, with the closest bat CoV sequence sharing 96.2% of the sequence identity. This confirmed the zoonotic origin of the virus.
Coronaviruses are enclosed RNA viruses that circulate amongst humans, other mammals, and birds, causing respiratory, enteric, hepatic, and neurologic diseases [14,15]. A total of 89 nucleotide sequences of SARS-CoV-2 are accessible from the NCBI virus database [16,17]. All these sequences consist of nearly about 29000 bases. These bases can be classified into purines and pyrimidines according to their chemical composition. Purines include adenine (A) and guanine (G), while pyrimidines include cytosine (C) and tyrosine (T). There is a need to understand the spatial distribution of these bases on the nucleotide sequence to facilitate the development of antivirals (including neutralizing antibodies) and epitomes necessary for vaccine development. Various quantitative metrics can be used to understand the spatial distribution of purines and pyrimidines, including; Hurst exponent (HE), Shannon entropy (SE), and the nucleotide guanine-cytosine content (GC-content). The HE is used to identify the auto-correlation of purine-pyrimidine bases even if their organization differs. SE is used to identify closely associated sequences. Different frequency patterns can be used to determine the distribution of all four proteins and the density of each base. The GC-content is used to understand the stability of the DNA. Therefore, this study aimed to evaluate all the purine and pyrimidine associations within the SARS-CoV-2 genome sequence by measuring mathematical parameters including; SE, HE, and the nucleotide GC-content.
The rest part of this paper is organized as follows. In Section 2, the specification of the database is explained. Definition of different fundamental parameters and their effectiveness with respect to the database have been explained in Section 3. Experimental results and illustrations are demonstrated in Section 4. Section 5 concludes the article, emphasizing the critical factors of the entire analysis.
2.1 Specifications of the Used Database
All the CoV nucleotide sequences were acquired from the NCBI Virus Database (http://www.ncbi.nlm.nih.gov/labs/virus/vssi/). This dataset contains 89 complete SARS-CoV-2 nucleotide sequences from the 15th March 2020. For the purpose of the study, each DNA sequence has been converted into a binary sequence of “10s” and “00s” as per Eq. (1).
Eq. (1) corresponds to purine and pyrimidine nucleotide bases encoded as 1 and 0 correspondingly into the changed binary sequence. All the 89 complete SARS-CoV-2 nucleotide sequences were labeled according to their accession ID as listed below in Tab. 1.
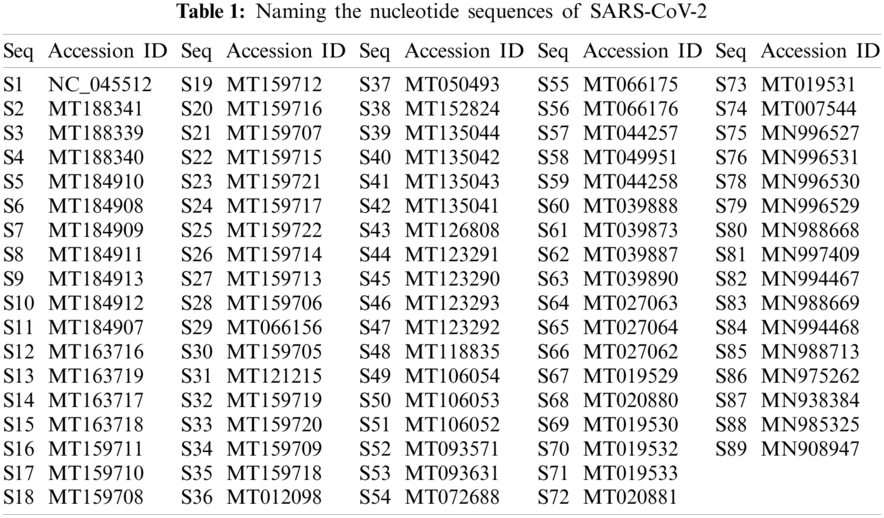
The length of these complete 89 sequences varied between 29783 to 29981 nucleotides, and the range was 198 bp long. The smallest complete SARS-CoV sequence was S2 with a length of 29783, and the largest one was S47, with a length of 29981. Two sequences had a length of 29867, Thirty-nine sequences had a length of 29882, and 11 sequences were 29903 long.
2.2 Generation of Gene Clusters
Different quantitative parameters, including; SE, fractal dimension (FD), HE, and the distribution of purines-pyrimidines contents, were used to describe the spatial distribution of the bases of the SARS-CoV-2 sequences.
2.3 FD of the Indicator Matrices
FD is a key for characterizing fractal patterns or sets whereby
such that the indicator matrix:
whereby
The self-organization of purine and pyrimidine bases for all the SARS-CoV-2 sequences can be obtained through the indicator matrix FD. The box-counting method is the most commonly used to determine the FD.
The autocorrelation of purine-pyrimidine bases for all the SARS-CoV-2 sequences was obtained through the HE. The HE was applied during the time series investigation to infer the autocorrelation [23,24]. The HE values range between 0 to 1. An HE value of 0.5 indicates the absolute randomness of the time series data, while a value below 0.5 indicates a negative correlation, and a value above 0.5 indicates a positive correlation. The H
where
and
and
The SE was used to measure the uncertainty of the binary sequence. Primary protein sequences were generated through different combinations of amino acids ranging from 30 to 3000. Some protein sequences were kept as a substring like AAAAAAAG and AAAAAAAAATTTTTTTT, which resulted from coding of one or an assortment of amino acids. Such proteins are less likely to encode functional proteins. Therefore, the amount of information or the sequence uncertainty concerning a base pair was measured using the SE. The SE was used to measure the Bernoulli process entropy with the probability
where
If the probability p = 0, the event will never occur; otherwise, if p = 1, a certain result will be generated with entropy 0. When
2.6 GC Content and Nucleotides Density
In molecular biology, the GC-content is usually calculated as a percentage and is sometimes called
The
In addition to the GC-content, the density of the nucleotides
The frequencies of several nucleotides in the SARS-CoV-2 sequences were not selected randomly. In this study, we, therefore, tried to evaluate the purine and pyrimidine spatial distribution organizations among the SARS-CoV-2 sequences through the parameters as defined in the previous section. In addition to the investigation of the purine-pyrimidine distribution, we also explored the density of each of the nucleotides and
3.1 Classification based on the FD of the Indicator Matrices
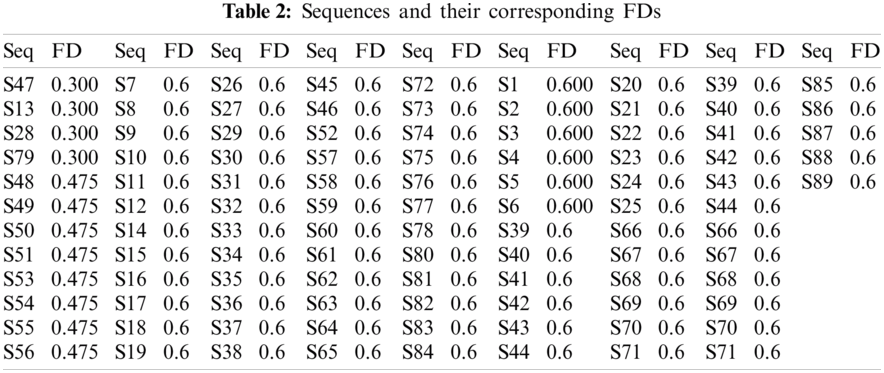
Three distinct FDs (0.3, 0.4755, and 0.6) were identified, indicating that only three clusters within the sequences are turned up. Tab. 2 demonstrates the sequences and their corresponding FD. The histograms of all the SARS-CoV-2 sequences that were plotted according to the FD are illustrated in Fig. 1.
The dimension of each indicator matrix was above
3.2 Classification Based on the HE
For each of the binary SARS-CoV-2 sequences, the HE was calculated using Eq. (4), and then ten clusters were formed using the k-means clustering technique for all the sequences. The histograms of all the SARS-CoV-2 sequences that were plotted according to the HE are illustrated in Fig. 2.

Figure 1: Plot of the fractal dimension (FD) and corresponding histogram of all the purine-pyrimidine binary sequences corresponding to the SARS-CoV-2 sequences

Figure 2: Plot of the Hurst exponent (HE) and corresponding histogram of all the purine-pyrimidine binary sequences corresponding to the SARS-CoV-2 Sequences
The HE was confined to the interval
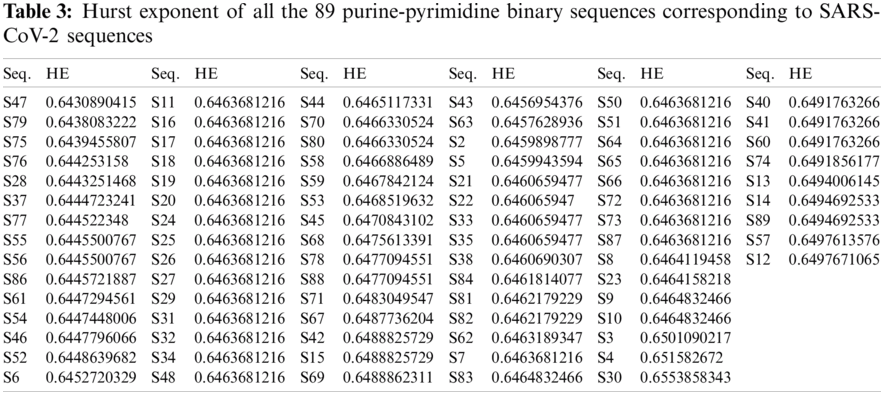
Based on the HE obtained from the binary SARS-CoV-2 sequences, ten clusters were formed by using the k-means clustering. Cluster-1 contained 41 sequences (S81, S82, S62, S7, S11, S16, S17, S18, S19, S20, S24, S25, S26, S27, S29, S31, S32, S34, S48, S49, S50, S51, S64, S65, S66, S72, S73, S87, S8, S23, S9, S10, S83, S85, S44, S70, S80, S58, S59, S53, S45) all having their center at
Cluster-5 contained 11 sequences (S37, S77, S55, S56, S86, S61, S54, S46, S52, S6, S36), all having their centers at 0.6448. The sequence S30 was located in cluster S6, with its center at 0.6554. The sequences (S68, S78, S88, S71, S67, S42, S15, S69) are in cluster-7, whose center is at 0.6483. The cluster-8 contained sequences (S43, S63, S2, S5, S21, S22, S33, S35, S38, S84) whose center was at 0.6460. The sequence S4 belonged to cluster-9, centered at 0.6516. Cluster 10 contained four sequences, S79, S75, S76, S28, all with their center at 0.6441. The sequences S55 and S66 had the same HE of
3.3 Classification Based on SE
For all the 89-binary purine-pyrimidine sequences of the SARS-CoV-2, the SE was first determined, and then ten different clusters were formed based on the SE obtained for all the sequences, as shown in Tab. 4. The SE and the histograms of all the SARS-CoV-2 sequences are illustrated in Fig. 3.
An SE ranging from 0.9999 to 1 indicates that the length of the range is too small, and therefore the SE is precisely the same for all the sequences. The SE for all sequences was 0.9999 except for sequence S30, which was
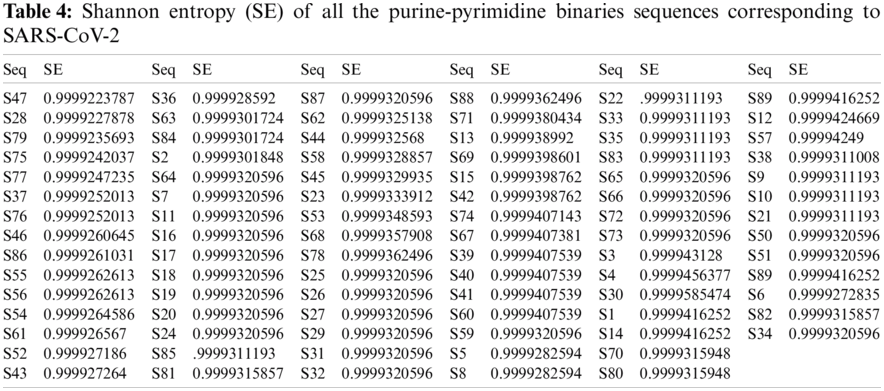

Figure 3: Plot of the Shannon entropy (SE) and matching histogram of all the purine-pyrimidine binary sequences corresponding with the SARS-CoV-2 sequences
After evaluating all the SE of the binary purine and pyrimidine represented for the SARS-CoV sequences, only three clusters were formed using the k-means clustering technique. The cluster-1 contained 21 sequences S68, S78, S88, S71, S13, S69, S15, S42, S74, S67, S39, S40, S41, S60, S1, S14, S89, S12, S57, S3, and S4 having SE centered at 0.999940381147619. The other 67 sequences belonged to cluster-2 and were all centered at 0.999930184068656. Therefore, these two clusters can be considered the same. Cluster-3 contained only one sequence (S30) with an SE of 0.9999585474 (approximately 1), as already mentioned before.
The distribution of SE for all the purine and pyrimidine distributions among the SARS-CoV-2 sequences was mostly linear. This is crucial for the SARS-CoV-2, unlike other sequences obtained in previous studies made [35–37]. The uncertainty level reached the maximum, which means that the probability of purine and pyrimidine bases occurring across the sequences among all the SARS-CoV-2 is equal.
3.4 GC, A, T, C, and G Density in the SARS-CoV-2
The sequences were classified according to the GC, A, T, and G densities, as follows. Tab. 5 shows the percentage density of the
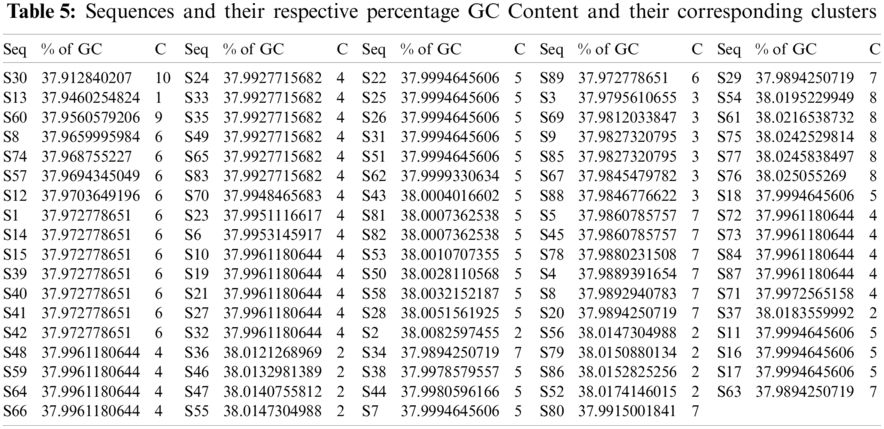

Figure 4: Plot illustrating the GC-content density and its corresponding histogram for the SARS-CoV-2 sequences
Based on the GC-content density in the SARS-CoV-2 sequences, ten different clusters are formed using the k-means clustering technique as shown in Tab. 5. These ten clusters (C) had their centers at 37.9460, 38.0143, 37.9826, 37.9952, 38.0002, 37.9714, 37.9888, 38.0230, 37.9561, and 37.9128. The density of all these sequences was located in the
The A, T, C, and G intervals and their corresponding densities are summarized in Tab. 6. The histograms of all the SARS-CoV-2 sequences that were plotted according to the density of A, T, G and C are illustrated in Figs. 5–8 respectively. The spread of A, T, C, and G over the SARS-CoV-2 sequences were approximately 30%, 32%, 18%, and 19%, respectively. These findings further confirm that SAR-CoV2 is significantly
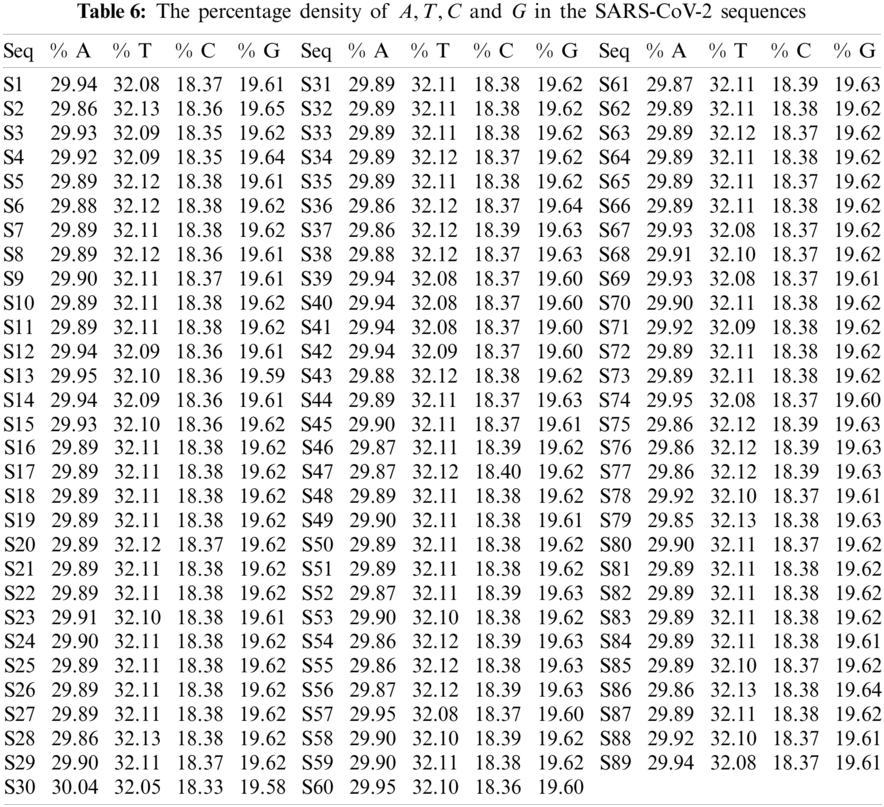

Figure 5: Plot of the

Figure 6: Plot of the

Figure 7: Plot of the
All the sequences of SARS-CoV-2 sequences are clustered into different clusters. The position of each cluster center for all four bases differed by
3.5 Hamming Distance of the SARS-CoV-2
The similarity analysis of the SARS-CoV-2 sequences was measured by calculating the distance between the binary vectors of the binary strings encoded based on purines and pyrimidines nucleotide bases, as mentioned earlier. Several computing methods measure the distance between multidimensional vectors, such as Hamming distance (HD), Euclidean distance, Elastic-matching distance, Jeffrey and Matusita distance, Manhattan distance, and Minkowski norm. Reportedly, these methods have little effect on the vector similarity [38]. The HD between two binary strings is defined by the number of bits in which they vary [39,40]. However, here we had to take into consideration that the length of the different
if the two binary sequences

Figure 8: Plot of the
The SARS-COV-2 virus sequences MT044258(S59), MN994468 (S84), NC_045512(S1), and MN039888(S60) were grouped together as a single cluster as the distance between them was almost negligible, indicating that they are closely related. Furthermore, the sequences MT152824(S38), MN996531(S76), MT012098(S36), and MT975262(S86) were closely related to each other and therefore treated as a single cluster. Similarly, the sequences MT163719(S13), MT007544(S74), MT03988(S62), MT188341(S2), MT188339(S3), MT188340 (S4), MN123290(S45), MT039873(S61), MT159721(S23), and MN072688(S54) also had similar HD and were therefore grouped together. After taking into consideration the HD between these sequences, it was observed that they were very closely related. This closeness (nearness) among the SARS-CoV-2 genomes makes it possible for future such genomes or other blasted results to analyze clusters quantitatively instead of only relying on sequential similarity.
The novel coronavirus has led to a worldwide public health emergency. One of the major reasons for such a global threat is the lack of quantitative and qualitative knowledge about this novel virus, including its genomic and proteomic levels. In this article, we evaluated the quantitative nature of the SARS-COV-2 complete sequences. This present study revealed the closeness amongst the 89 complete sequences in the purine-pyrimidine level descriptions through phylogenetic analysis. Based on this quantitative investigation, very interesting observations were made. The purine and pyrimidine were found to be evenly and equally spaced throughout all 89 SARS-CoV sequences. The
Acknowledgement: We appreciate the linguistic assistance provided by TopEdit (https://www.topeditsci.com) during the preparation of this manuscript.
Funding Statement: We are thankful to King Addulaziz City for Science and Technology (KACST) Saudi Arabia for providing support. We are thankful to the Center of Smart Society 5.0 [CSS5] for the support to complete this research.
Conflicts of Interest: The authors declare that they have no conflicts of interest to report regarding the present study.
1. K. V. Holmes, “SARS-associated coronavirus,” New England Journal of Medicine, vol. 348, no. 20, pp. 1948–1951, 2003. [Google Scholar]
2. L. Van Der Hoek, K. Pyrc, M. F. Jebbink, W. Vermeulen-Oost, R. J. M. Berkhout et al., “Identification of a new human coronavirus,” Nature Medicine, vol. 10, no. 4, pp. 368–373, 2004. [Google Scholar]
3. M. Lipsitch, D. L. Swerdlow and L. Finelli, “Defining the epidemiology of Covid-19—Studies needed,” New England Journal of Medicine, vol. 382, no. 13, pp. 1194–1196, 2020. [Google Scholar]
4. A. S. Fauci, H. C. Lane and R. R. Redfield, Covid-19—Navigating the uncharted. Waltham, Massachusetts, United States: Mass Medical Soc., 2020. [Google Scholar]
5. W. Liu, Q. Zhang, J. Chen, R. Xiang and H. Song, “Detection of Covid-19 in children in early January 2020 in Wuhan, China,” New England Journal of Medicine, vol. 382, no. 14, pp. 1370–1371, 2020. [Google Scholar]
6. F. Jiang, L. Deng, L. Zhang, Y. Cai, C. W. Cheung et al., “Review of the clinical characteristics of coronavirus disease 2019 (covid-19),” Journal of General Internal Medicine, vol. 35, no. 5, pp. 1–5, 2020. [Google Scholar]
7. J. Stebbing, A. Phelan, I. Griffin, C. Tucker, O. Oechsle et al., “Covid-19: Combining antiviral and anti-inflammatory treatments,” The Lancet Infectious Diseases, vol. 20, no. 4, pp. 400–402, 2020. [Google Scholar]
8. J. F. W. Chan, C. C. Y. Yip, K. K. W. To, T. H. C. Tang, S. Y. C. Wong et al., “Improved molecular diagnosis of covid-19 by the novel, highly sensitive and specific covid-19-RDRP/HEL real-time reverse transcription-polymerase chain reaction assay validated in vitro and with clinical specimens,” Journal of Clinical Microbiology, vol. 58, no. 5, pp. e00310-20, 2020. [Google Scholar]
9. C. Sohrabi, Z. Alsafi, N. O’Neill, M. Khan, A. Kerwan et al., “World health organization declares global emergency: A review of the 2019 novel coronavirus (covid-19),” International Journal of Surgery, vol. 76, pp. 71–76, 2020. [Google Scholar]
10. M. A. Marra, S. J. Jones, C. R. Astell, R. A. Holt, A. Brooks-Wilson et al., “The genome sequence of thesars-associated coronavirus,” Science, American Association for the Advancement of Science, vol. 300, pp. 1399–1404, 2003. [Google Scholar]
11. P. Sun, X. Lu, C. Xu, W. Sun and B. Pan, “Understanding of COVID-19 based on current evidence,” Journal of Medical Virology, vol. 92, no. 6, pp. 548–551, 2020. [Google Scholar]
12. S. Zhang, M. Y. Diao, L. Duan, Z. Lin and D. Chen, “The novel coronavirus (Sars-cov-2) infections in china: Prevention, control and challenges,” Intensive Care Medicine, vol. 46, no. 4, pp. 1–3, 2020. [Google Scholar]
13. C. Ceraolo and F. M. Giorgi, “Genomic variance of the 2019-ncov coronavirus,” Journal of Medical Virology, vol. 92, no. 5, pp. 522–528, 2020. [Google Scholar]
14. G. Kampf, D. Todt, S. Pfaender and E. Steinmann, “Persistence of coronaviruses on inanimate surfaces and its inactivation with biocidal agents,” Journal of Hospital Infection, vol. 104, no. 3, pp. 246–251, 2020. [Google Scholar]
15. S. Khan, A. Ali, R. Siddique and G. Nabi, “Novel coronavirus is putting the whole world on alert,” Journal of Hospital Infection, vol. 104, no. 3, pp. 252–253, 2020. [Google Scholar]
16. J. Xu, S. Zhao, T. Teng, A. E. Abdalla, W. Zhu et al., “Systematic comparison of two animal-to-human transmitted human coronaviruses: Sars-cov-2 andsars-cov,” Viruses, vol. 12, no. 2, pp. 244, 2020. [Google Scholar]
17. W. B. Yu, G. D. Tang, L. Zhang and R. T. Corlett, “Decoding the evolution and transmissions of the novel pneumonia coronavirus (Sars-cov-2) using whole genomic data,” Zoological Research, vol. 41, no. 3, pp. 247–257, 2020. [Google Scholar]
18. C. Cattani and G. Pierro, “On the fractal geometry of DNA by the binary image analysis,” Bulletin of Mathematical Biology, vol. 75, no. 9, pp. 1544–1570, 2013. [Google Scholar]
19. C. Cattani, Fractals and hidden symmetries in DNA. In: Mathematical Problems in Engineering. London, United Kingdom: Hindawi, 2010. [Google Scholar]
20. S. S. Hassan, P. P. Choudhury, B. DayaSagar, S. Chakraborty, R. Guha et al., “Quantitative description of genomic evolution of olfactory receptors,” Asian-European Journal of Mathematics, vol. 8, no. 3, pp. 1550043, 2015. [Google Scholar]
21. R. K. Rout, P. Pal Choudhury, S. P. Maity, B. DayaSagar and S. S. Hassan, “Fractal and mathematical morphology in intricate comparison between tertiary protein structures,” Computer Methods in Biomechanics and Biomedical Engineering: Imaging & Visualization, vol. 6, no. 2, pp. 192–203, 2018. [Google Scholar]
22. C. L. Berthelsen, J. A. Glazier and M. H. Skolnick, “Global fractal dimension of human dnasequences treated as pseudorandom walks,” Physical Review A, vol. 45, no. 12, pp. 8902–8913, 1992. [Google Scholar]
23. A. Carbone, G. Castelli and H. E. Stanley, “Time-dependent Hurst exponent in financial time series,” Physica A: Statistical Mechanics and its Applications, vol. 344, no. 1–2, pp. 267–271, 2004. [Google Scholar]
24. J. Mielniczuk and P. Wojdy l lo, “Estimation of Hurst exponent revisited,” Computational Statistics & Data Analysis, vol. 51, no. 9, pp. 4510–4525, 2007. [Google Scholar]
25. C. E. Shannon, “Prediction and entropy of printed English,” Bell System Technical Journal, vol. 30, no. 1, pp. 50–64, 1951. [Google Scholar]
26. S. Noorizadeh and E. Shakerzadeh, “Shannon entropy as a new measure of aromaticity, shannonaromaticity,” Physical Chemistry Chemical Physics, vol. 12, no. 18, pp. 4742–4749, 2010. [Google Scholar]
27. Y. Benjamini and T. Speed, “Estimation and correction for GC-content bias in high throughput sequencing,” Nucleic Acids Research, vol. 40, no. 10, pp. e72, 2011. [Google Scholar]
28. D. Risso, K. Schwartz, G. Sherlock and S. Dudoit, “GC-content normalization for RNA-seqdata,” BMC Bioinformatics, vol. 12, no. 1, pp. 480, 2011. [Google Scholar]
29. N. Galtier, G. Piganeau, D. Mouchiroud and L. Duret, “GC-content evolution in mammalian genomes: The biased gene conversion hypothesis,” Genetics, vol. 159, no. 2, pp. 907–911, 2001. [Google Scholar]
30. F. Hildebrand, A. Meyer and A. Eyre-Walker, “Evidence of selection upon genomic GC-content in bacteria,” PLoS Genetics, vol. 6, no. 9, pp. e1001107, 2010. [Google Scholar]
31. S. Dutta and M. Ojha, “Relatedness between major taxonomic groups of fungi based on the measurement of DNA nucleotide sequence homology,” Molecular and General GeneticsMGG, vol. 114, no. 3, pp. 232–240, 1972. [Google Scholar]
32. T. H. Jukes, “Silent nucleotide substitutions and the molecular evolutionary clock,” Science, vol. 210, no. 4473, pp. 973–978, 1980. [Google Scholar]
33. M. El Naschie, “On dimensions of cantor set related systems,” Chaos, Solitons & Fractals, vol. 3, no. 6, pp. 675–685, 1993. [Google Scholar]
34. I. S. Baek, “Dimensions of the perturbed cantor set,” Real Analysis Exchange, vol. 19, no. 1, pp. 269–273, 1993. [Google Scholar]
35. J. K. Das, P. P. Choudhury, A. Chaudhuri, S. S. Hassan and P. Basu, “Analysis of purines andpyrimidines distribution over mirnas of human, gorilla, chimpanzee, mouse and rat,” Scientific Reports, vol. 8, no. 1, pp. 1–19, 2018. [Google Scholar]
36. R. K. Rout, S. S. Hassan, S. Sindhwani, H. M. Pandey and S. Umer, “Intelligent classification and analysis of essential genes species using quantitative methods,” ACM Transactions on Multimedia Computing, Communications, and Applications, vol. 16, pp. 38:1–38:21, 2019. [Google Scholar]
37. J. P. Banerjee, J. K. Das, P. P. Choudhury, S. Mukherjee, S. S. Hassan et al., “The variations of human miRNAs and ising like base pairing models,” BioRxiv, pp. 319301, 2018. [Google Scholar]
38. S. Xu, Z. Li, S. Zhang and J. Hu, “Primary structure similarity analysis of proteins sequences by a new graphical representation,” SAR and QSAR in Environmental Research, vol. 25, no. 10, pp. 791–803, 2014. [Google Scholar]
39. Y. ZuGuo and C. GuoYi, “Rescaled range and transition matrix analysis of DNA sequences,” Communications in Theoretical Physics, vol. 33, no. 4, pp. 673–678, 2000. [Google Scholar]
40. R. W. Hamming, “Error detecting and error-correcting codes,” The Bell System Technical Journal, vol. 29, no. 2, pp. 147–160, 1950. [Google Scholar]
 | This work is licensed under a Creative Commons Attribution 4.0 International License, which permits unrestricted use, distribution, and reproduction in any medium, provided the original work is properly cited. |