DOI:10.32604/cmc.2021.017302
| Computers, Materials & Continua DOI:10.32604/cmc.2021.017302 | |
| Article |
FogQSYM: An Industry 4.0 Analytical Model for Fog Applications
1School of Information Technology and Engineering, Vellore Institute of Technology, Vellore, 632014, India
2Department of Industrial and System Engineering, Dongguk University, Seoul, Korea
3Division of Computer Science, Jeonbuk National University, Jeonju, Korea
*Corresponding Author: Gi Hwan Cho. Email: ghcho@jbnu.ac.kr
Received: 16 January 2021; Accepted: 04 April 2021
Abstract: Industry 4.0 refers to the fourth evolution of technology development, which strives to connect people to various industries in terms of achieving their expected outcomes efficiently. However, resource management in an Industry 4.0 network is very complex and challenging. To manage and provide suitable resources to each service, we propose a FogQSYM (Fog–-Queuing system) model; it is an analytical model for Fog Applications that helps divide the application into several layers, then enables the sharing of the resources in an effective way according to the availability of memory, bandwidth, and network services. It follows the Markovian queuing model that helps identify the service rates of the devices, the availability of the system, and the number of jobs in the Industry 4.0 systems, which helps applications process data with a reasonable response time. An experiment is conducted using a Cloud Analyst simulator with multiple segments of datacenters in a fog application, which shows that the model helps efficiently provide the arrival resources to the appropriate services with a low response time. After implementing the proposed model with different sizes of fog services in Industry 4.0 applications, FogQSYM provides a lower response time than the existing optimized response time model. It should also be noted that the average response time increases when the arrival rate increases.
Keywords: Fog computing; industry 4.0; fog layer; Markovian queuing model
The term “Internet of Things (IoT)” was coined in 1999 [1]. A few years ago, IoT was adopted in Industry 4.0 with a new term called Industrial Internet of Things (IIoT) [2]. IIoT enables the ubiquitous control of industrial processes that are implemented in the IoT network. IIoT is mainly used in manufacturing tasks that fall under the new Industry 4.0 [3]. Sensor networks, actuators, robotics, computers, equipment, business processes, and staff comprise the main components of Industry 4.0. The overall industrial processes are accomplished locally due to delay and security requirements. In the industrial environment, structured data needs to be communicated over the Internet to web services and the cloud with the assistance of supportive middleware [3,4]. In this sense, fog is a potential middleware that could be very useful for a variety of industrial applications. With appropriate latency, fog may provide local processing support for actuators and robots in the manufacturing industry [5]. The resources provided over the cloud can quickly adapt to customer requirements, while the implementation and usage costs can be reduced. Fog computing has technological limitations that restrict its use in specific application domains. Industry 4.0 is one such domain wherein advanced digitization is implemented within production sites that are directly associated with the Industrial Internet of Things (IIoT) by connecting different types of machinery and enabling more efficient production as well as new applications and business models [6]. Fig. 1 illustrates the concept of Industry 4.0 within fog applications.
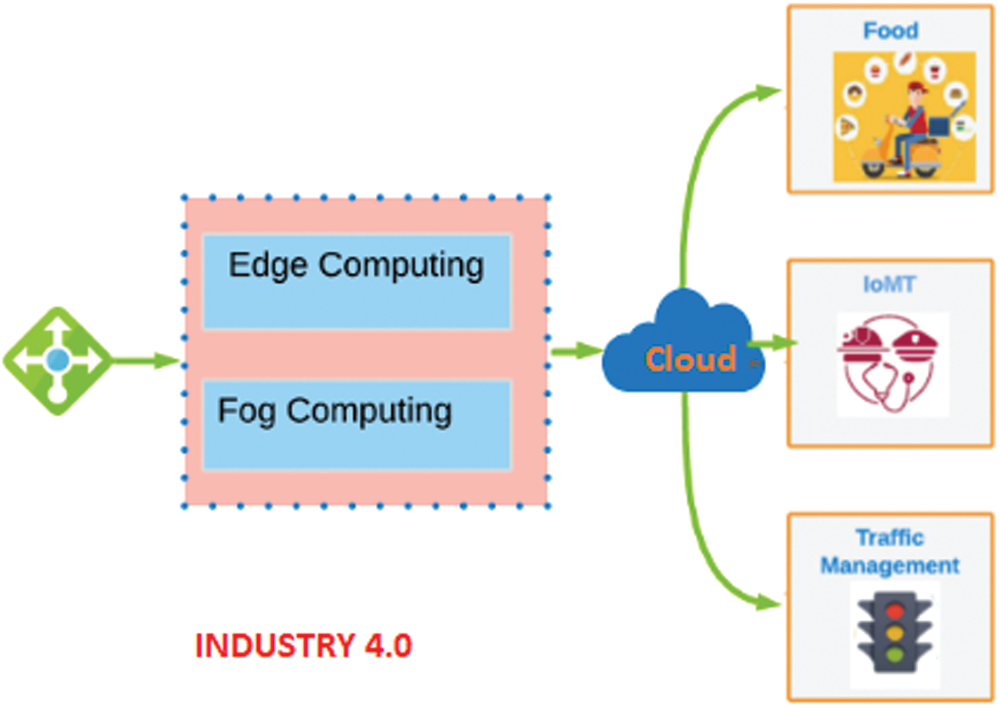
Figure 1: Industry 4.0
Fog computing is a recently evolved technology that acts as a middle layer between the cloud and IoT; it does so by expanding the cloud to edge devices such as sensors, gateways, etc. CISCO developed fog computing, or fogging, in 2014 [7]. It consists of multiple nodes that are placed one hop from the user. Due to this placement, the data should be processed locally instead of being transferred to the cloud, which is placed far away from the user. Fog computing is distributed locally with a pool of resources that consists of heterogeneous devices connected ubiquitously at the edge network [8]. Fog computing involves multiple devices like bridges, switches, routers, servers, base stations, gateways, smart gateways, etc. to handle IoT devices like sensors and actuators. As IoT consists of thousands of sensors and actuators, it produces millions of points of data which are to be processed with low latency and high Quality of Service (QoS) [9]. Fog computing provides important functionalities like mobility and scalability to devices as well as real-time interactions between devices. As a result, deploying fog computing services would lead to low latency, low power, and reduced expenses for IoT-based applications.
The number of IoT devices is projected to increase rapidly, and the data generated by these devices is expected to surpass 50 billion by 2025 [10]. While existing technologies like cloud computing enable huge data processing for large volumes of data, they fail to provide a faster response with low latency. To solve this issue, fog computing is introduced. Although fog computing succeeds in achieving lower response time and latency, it has many challenges such as node discovery, resource allocation, estimation, and scheduling. Fog computing has been deployed in a number of applications like healthcare, military, agriculture, smart cites, home automation, smart transportation, etc. [11].
1.1 Fog Computing Data Management
Fog computing has emerged as a popular solution for managing the huge amounts of data generated by IoT applications. For example, Qin [12] stated that 2,500 petabytes of data were generated per day in 2012. Dastjerdi et al. [13] and Pramanik et al. [14] noted that in the healthcare industry, which deals with 30 million users per second, 25,000 records were generated, and the amount of data will eventually increase to the scale of zettabytes. The US Smart grid and US Library of Congress generate 1 exabyte and 2.4 petabytes of data per year, respectively [12,15]. Fog computing offers proper solutions for such scenarios, as it can process the data locally generated by IoT devices with reductions in end-end delay, processing time, and response time [16]. Given the incredibly large amount of data generated from massive networks of associated devices, data management is of prime significance in the Industry 4.0 and IoT domains [17]. In addition, a high percentage of devices involved have limited resources, which depend entirely on their battery life, processing power, and storage capacity. It is important to build novel and efficient methods to resolve these barriers and leverage data storage effectively. To assist information networks, Fog Computing appears to be a perfect solution.
Fog data management has many advantages like improved efficiency, privacy, data quality, data dependability, and decreased cost and end-end latency with the aim of effective resource provisioning. We incorporate these features in our proposed Fog-QSYM model to increase the average response time of the arrival resources.
We summarize the main contributions of this paper as follows.
• To present the fundamental concepts of Fog computing for Industry 4.0 and the scope of their relationship.
• To describe the role and develop the architecture of FogQSYM as a fog serving as middleware for Industry 4.0.
• To propose an analytical model for Fog applications that divides each application into several layers.
• To compare our model with the existing ORTM model in terms of sharing resources in an effective way according to the availability of memory, bandwidth, and resources.
The rest of this paper is organized as follows: Section 2 presents a survey of the existing works. Section 3 discusses the proposed work and addresses open issues in resource allocation based on the QTCS model. Section 4 contains the experimental results and related discussions. Section 5 describes the significance of our proposed model. The paper finally concludes in Section 6 with future directions.
This section discusses the existing methods used in fog computing for resource management. Industry 4.0 has revolutionized information and communication technology. Cyber Physical System (CPS) is one of the core components in Industry 4.0. O’Donovan et al. [18] analyze a CPS framework deployed on fog which implements a Predictive Model Markup Language machine learning model for day-day factory operations. This framework follows the design principles of Industry 4.0 with respect to security and fault tolerance. With the advent of the industrial internet of things (IIoT), factory operations have become smarter and more efficient. Lin et al. [19] analyze an intelligent system that combines the power of the cloud, fog computing, and a wireless sensor network to assist in the effective working of factory logistics. Further, the authors also implement a metaheuristic algorithm that uses a discrete monkey algorithm to find the best possible solutions and a genetic algorithm to increase the computational efficacy. The widespread deployment of IoT devices has generated huge amounts of data, and there is a dire need to manage this data. Fog computing has the capability to process such data with a much smaller delay than that of a cloud environ. Jamil et al. [20] discuss various methods that can be used to schedule the requests of IoT devices in the fog. The authors also highlight the methods used to address the dynamic demands of these IoT devices as well as the effective resource utilization of every fog device. Using fog devices to process IoT data might reduce the latency, and it is also expected to aid in the smart decision process. Sadri et al. [21] survey different fog data management techniques used for decision-making processes. The authors also consolidate the challenges in fog computing as well as the road ahead for future research in fog data management. The major parameter for the performance of real time IoT applications is response time. The cloud computing environment does not achieve the required response time due to latency issues. Enguehard et al. [22] propose a request aware admission control technique for increasing the requests of the fog nodes by dynamically evaluating the frequently accessed resources. The authors use the Least Recently Used filter to estimate the resources. In recent years, there have been substantial advancements in technologies pertaining to the building of smart cities. These technologies are implemented under the cloud computing paradigm, but the latency issues have yet to be addressed. Fog computing has emerged to overcome the latency issues for real time applications. Javadzadeh et al. [23] survey the various methods used in fog computing with a focus on latency factors in smart city deployment. Different QoS parameters have been considered for the deployment of fog computing in sensitive applications. Kashani et al. [24] analyze different QoS-aware techniques that are used in fog computing nodes, particularly for resource management. At present, one of the most urgent needs is for techniques that can be used to analyze patient health records for accurate diagnoses. This data needs to be accessed frequently and must be stored securely. Nandyala et al. [25] have implemented an architecture for a health care monitoring system using IoT technology employing fog computing services. In a similar analysis in [26], the authors propose a layered framework in fog for processing patient data. Fog computing has been extensively used for processing IoT device data, and fog nodes are deployed in the cloud specifically for this purpose. Marín-Tordera et al. [27] analyze the various methods involved in the use of fog services for computing IoT data. The Summary of existing works is shown in the Tab. 1.
3 FogQSYM: An Analytical Model for Fog Applications
From the literature, we can infer the following: First, a sustainable architecture for fog resource management still needs to be developed and evaluated. Second, research into the interoperable architecture of fog resources management involves challenges such as Quality of Service (QOS), resource management, energy management, resource reusability, and so on.
Resource management in fog computing plays a vital role in providing a fog service with the appropriate resources to increase the requirements of QoS. For example, assume a set of requests R with a set of requirement of QoS, say Q. Then, the solution can be one-to-many or many-to-many. In one such scenario, a request can be placed to one or more resources by dividing the request into multiple segments, and a request can be placed to a single resource. For successful resource management in fog computing, the following taxonomy should be addressed: First, the application deployment has a direct impact on resource utilization. Second, based on the service request, resource scheduling has an impact on resource management. Third, there is a possibility of a service request that can access the resources constrained devices which has constraints such as low computing power, low battery power, or fewer storage devices. As a result, the request is outsourced to the other devices and returns the result; this technique is called offloading. The fourth category is load balancing, as some services which involve time critical requests require balancing of the load with a proper mechanism. Finally, the resource allocation and resource provisioning have direct impacts on resource management. Fig. 2 below illustrates the taxonomy of resource management from the fog computing perspective.
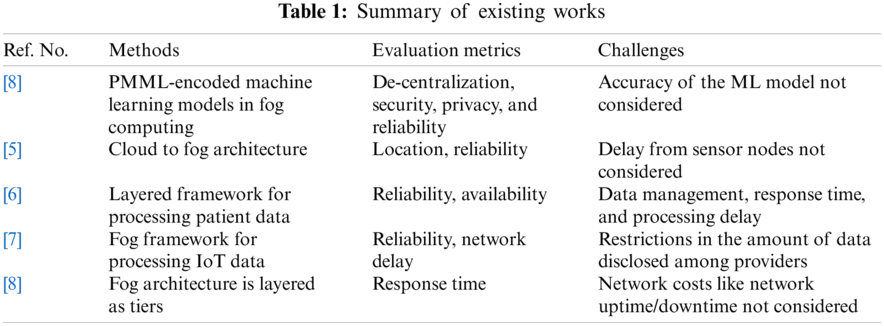
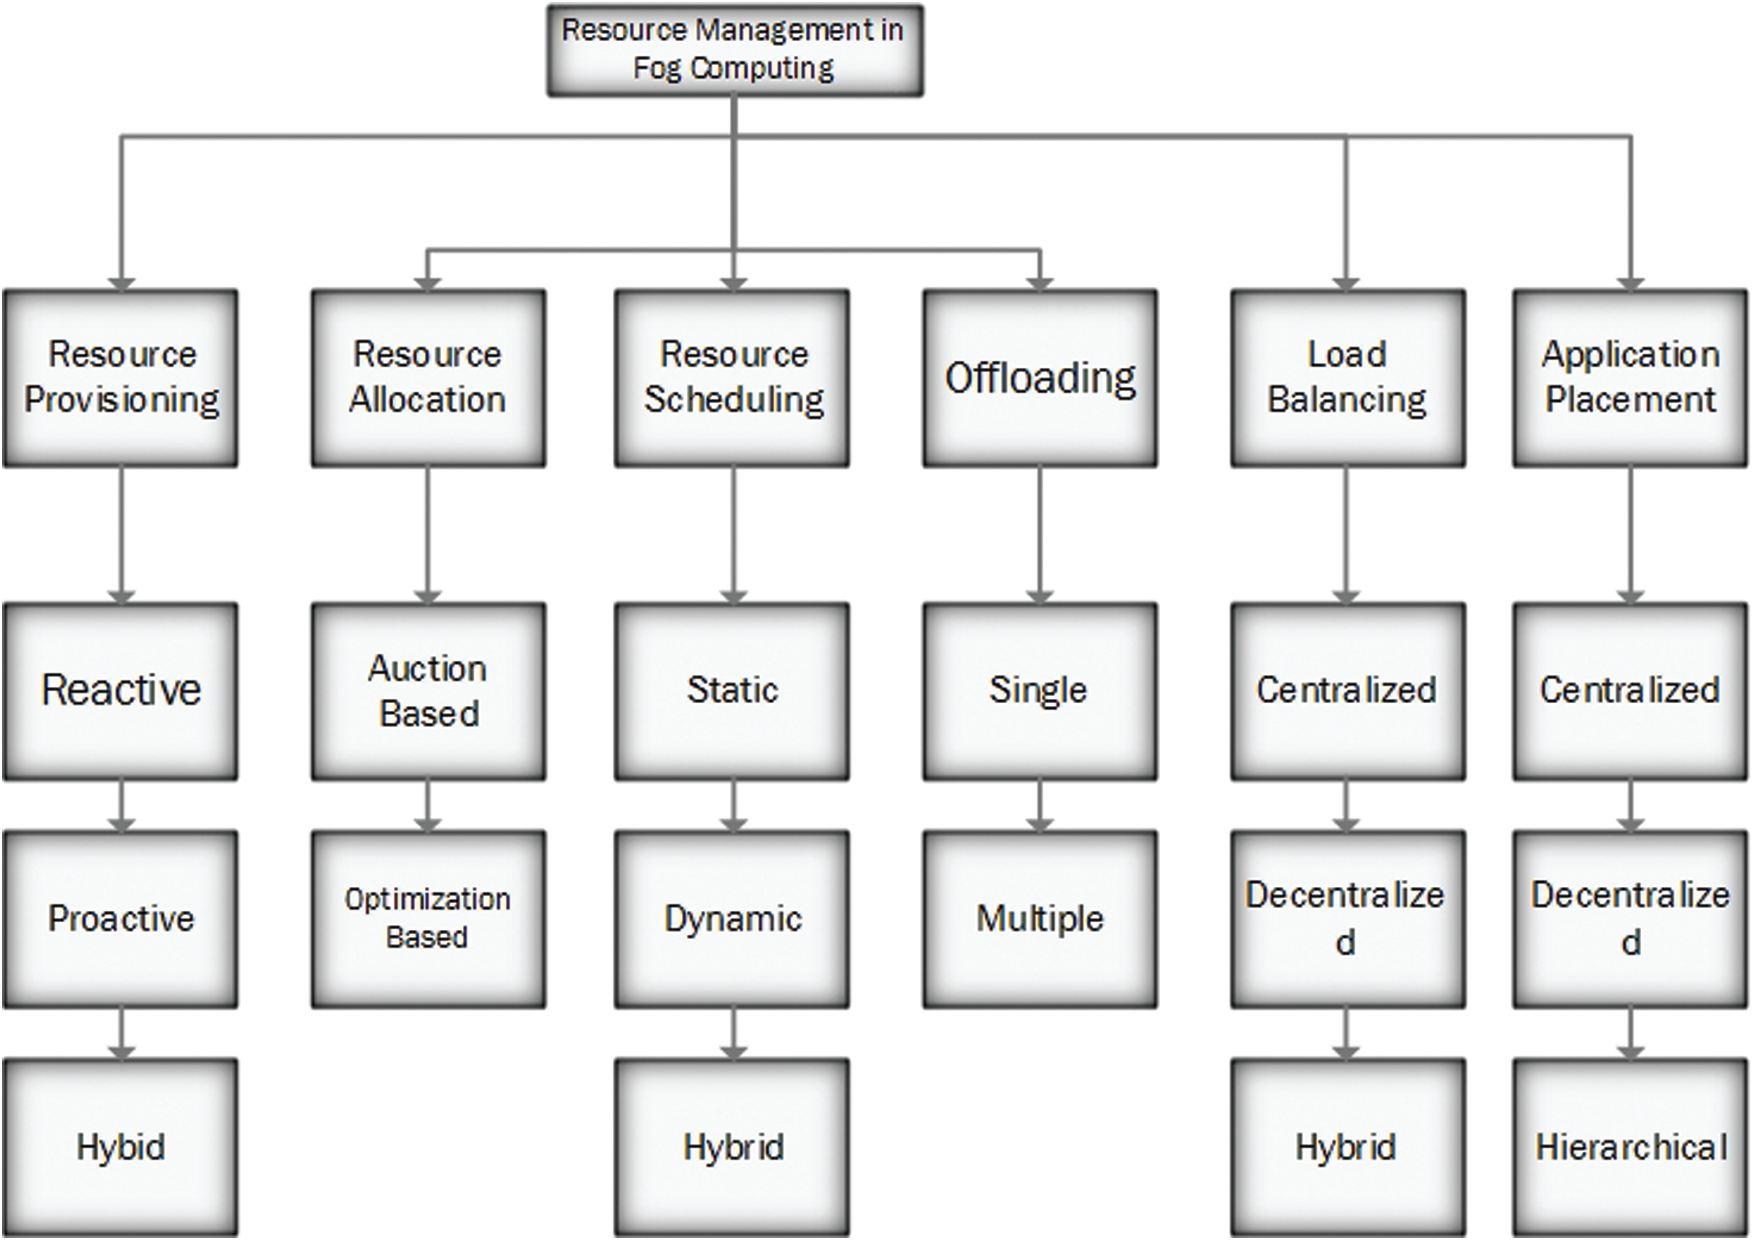
Figure 2: Taxonomy of fog computing resource management
For critical applications like healthcare, smart cities use a large number of powerful devices, sensors, and smart devices that collects huge amounts of data either continuously or periodically [29]; more smart devices are needed to process these huge amounts of data. Internet-of-Things (IoT) plays a vital role in turning devices into smart devices capable of running these critical applications. Both the cloud and IoT offer greater computing resources with higher computing power for processes between smart devices and things. However, these computing paradigms require continuous connectivity with the internet. Fog computing can be used to process the data locally between things and devices without any internet connectivity.
Since substantial numbers of devices are connected to each other, there is a chance that some devices are in the idle state, which results in unused or underused resources [30]. To overcome this issue, FogQSYM was introduced to effectively use the available resources. In this proposed model, the application is broken down into ‘n’ layers, where the first layer ‘s0’ will capture the data and send the captured data to the remaining layers for processing. After identifying the suitable devices which have free memory, high processing power, resource availability, etc., the data are transferred to the remaining layers as appropriate. Fig. 3 depicts the proposed model wherein the application is divided into n layers, like {S0, S1,
Where each layer
The resources are distributed evenly by periodically computing the load of individual devices. Eq. (1) signifies the computation of the load for each device.
Here, Fig. 4 illustrates the flow of resource prediction from the perspective of fog computing.
Effective resource management is required for fog computing devices to improve the Quality of Service. The system is modeled as a queuing network that consists of a network of queues wherein a single queue consists of one or more servers. Here, servers refer to storage servers, networks, input output devices, processors, routers, switches, etc. The queuing network receives a stream of requests from IoT devices and passes them to the fog server through LAN or WAN. After a request reaches the fog server, it passes through a queue, and the request may be completed in the fog server, or additional resources may be needed to complete the request. A queuing system consists of a single server or multiple servers with a finite or infinite buffer size. In the queuing system, a server serves only one customer at a given time, which results in one of two states, i.e., the idle or busy state. When the servers are busy and a new customer arrives, then the new customer is buffered in the queue.
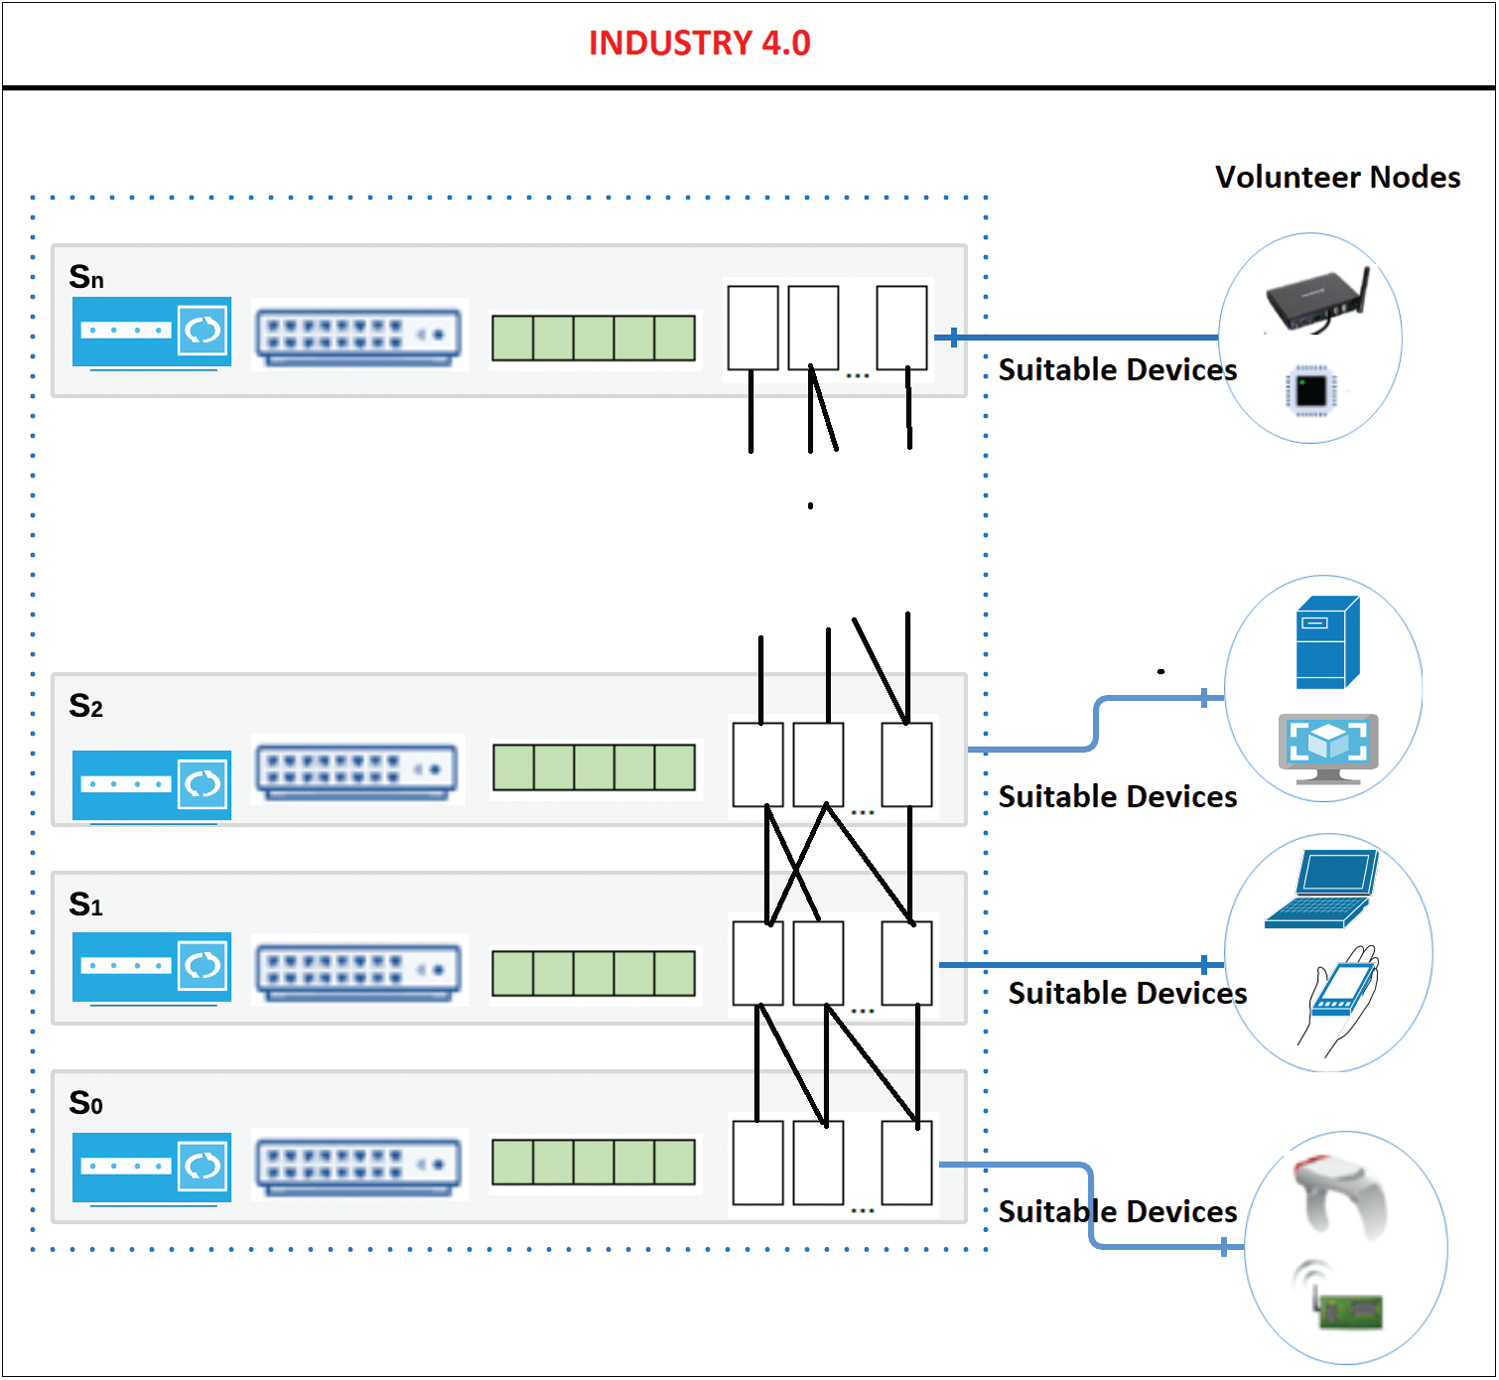
Figure 3: FogQSYM: An analytical model for fog applications
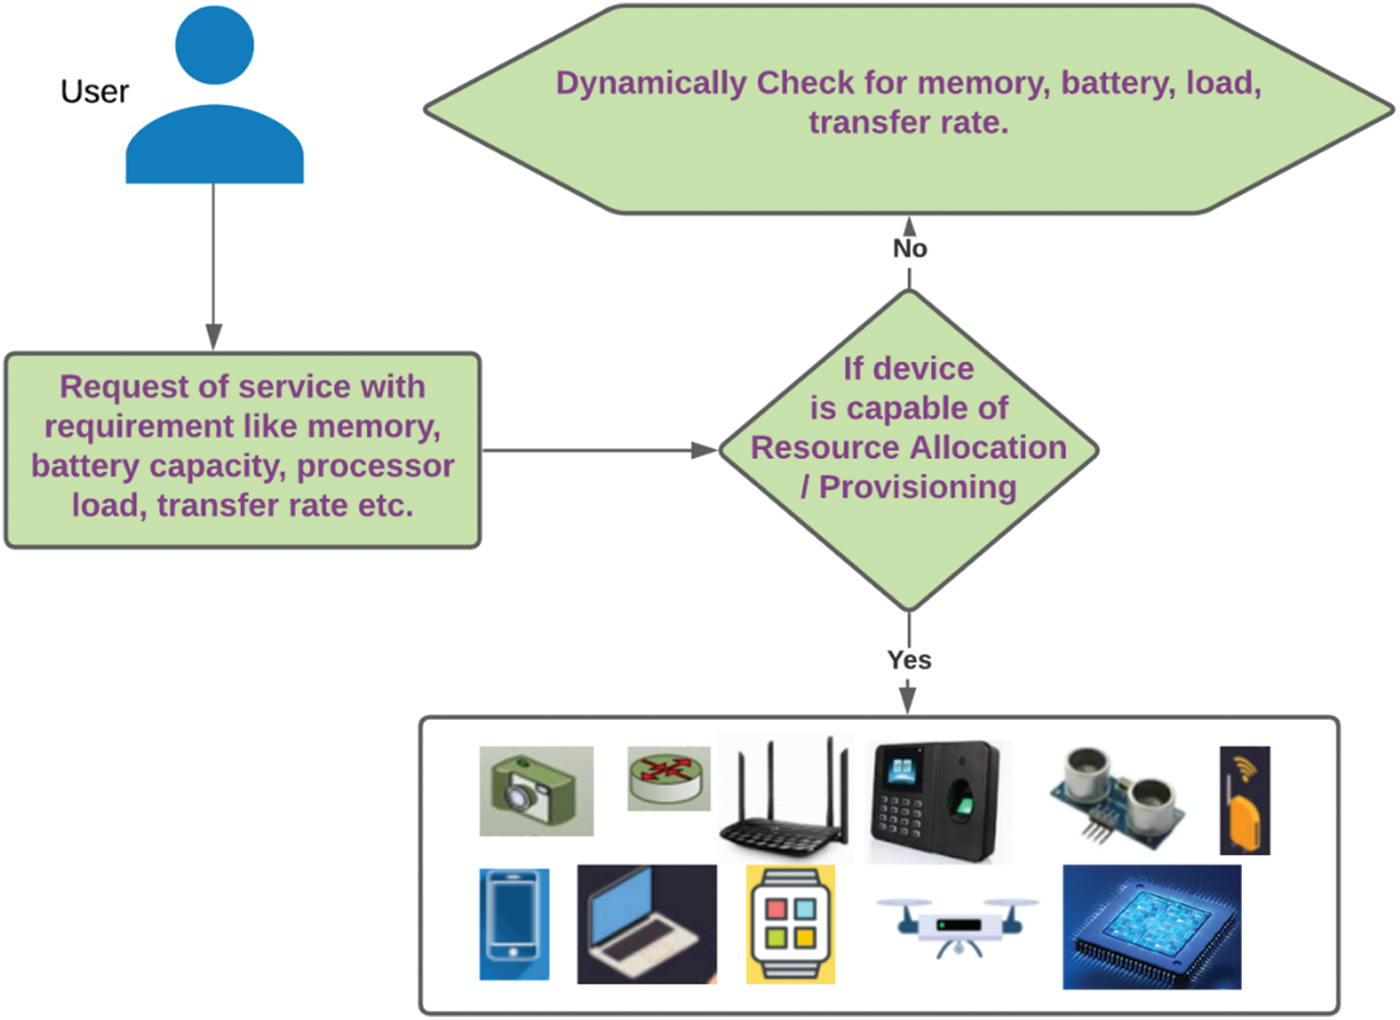
Figure 4: Resource prediction flow
The system is modeled as a Markovian queueing system M/M/m queue with an arrival rate of
The arrival rate of a system is given in Eq. (1) with k number of users as mentioned in Eq. (2),
The service time of a system is given in Eq. (3) with k number of users,
The steady-state probability of the system is given in Eq. (4),
where pk is the steady state probability with the ratio between the arrival and service time of k number of users.
The probability of a job arriving to join the queue is given in Eq. (4); it is the ratio of initial probability and the utilization factor as represented in Eq. (5)
The utilization factor
The assumed probability of having exactly only one user in a system pk is given in Eq. (7)
Then, the probability of having an empty system wherein no user exists in a system is given in Eq. (8); it is the summation of the ratio of the utilization factor with k users and m servers and utilization factor,
The mean queue length of a system is given in Eq. (9); it is the ratio of the probability of k users in a system with utilization factor,
The mean waiting time of a system is given in Eq. (10); it is the ratio of the mean queue length and the arrival rate,
The total number of jobs in a system is given in Eq. (11); it is the summation of probabilities 1, 2, and the mean queue length,
The system response time is given in Eq. (12); it is the ratio of the number of jobs in the system and the arrival rate,
The service demand for a LAN to a request is given in Eq. (13), where AD
The service demand for a WAN to a request is given in Eq. (14), where AD
The service demand of a request to a fog server is given in Eq. (15),
where k1 and k2 are the constants k1 in seconds and k2 in MB/sec.
The total response time of a system is the summation of the total response time of a LAN in seconds, the total response time of a WAN in seconds, and the total response time of a fog server in seconds, which is given in Eq. (16),
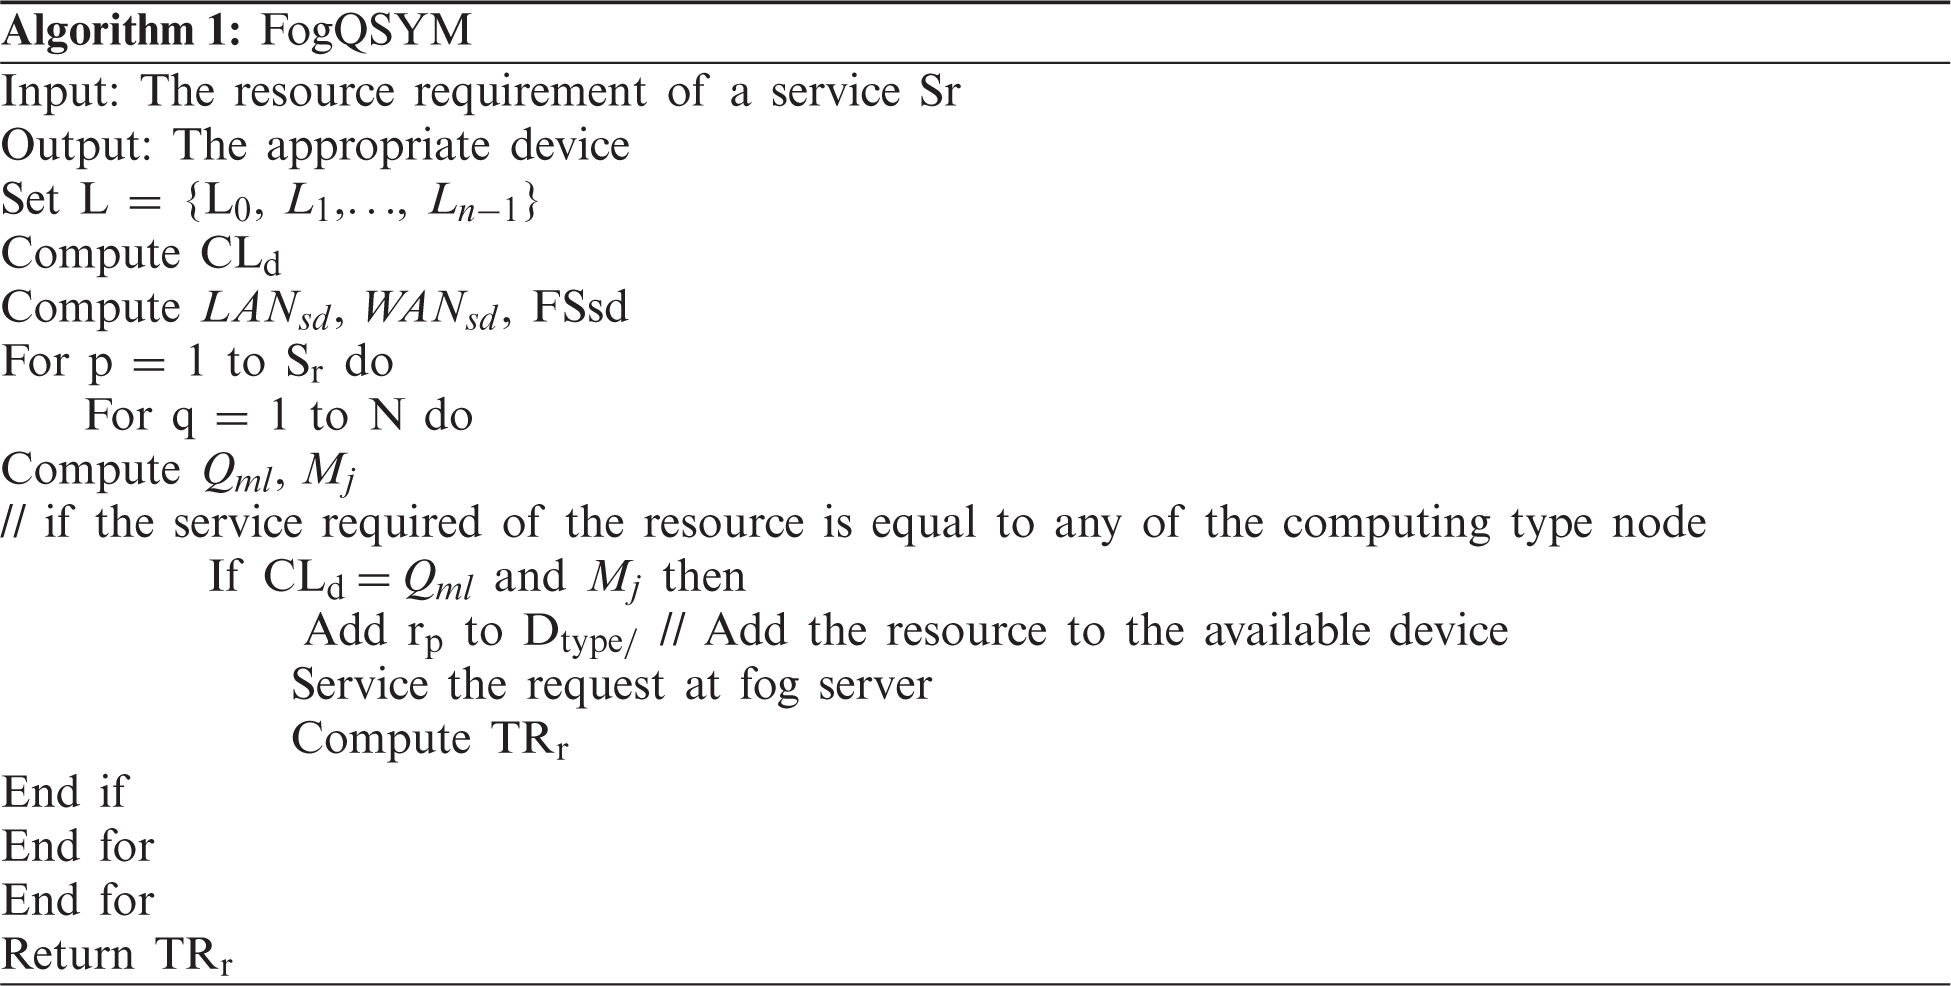
Here, Algorithm 1 describes how FogQSYM assigns the request to the appropriate device and returns the response time. The algorithm starts by assuming each individual layer, then computes the required computing load of a device as well as the service demands of the LAN, WAN, and fog server. Next, the algorithm computes the mean queue length and the number of jobs in the system. Then, the request is compared with the computing load to see if it is matched with the mean queue length and the number of jobs in the system, and if the request is matched successfully, then it is added to the matched resource. Finally, the time taken (response time) to assign the request is returned.
4 Experimental Results and Analysis
The experiment is set up using Cloud Analyst simulator to evaluate the proposed method. Cloud Analyst is used to simulate large-scale applications that are geographically distributed. The fog service contains three types of computing nodes, namely the intermediate computing node, edge computing node, and physical machines in the cloud, as shown in Fig. 5. To evaluate the proposed method, a dataset with different sizes of fog services is used. For example, a dataset with 500 fog services contains 179 edge computing nodes, 167 intermediate computing node, and 154 physical machines in the cloud. In Cloud Analyst, two datacenters are simulated as intermediate and edge computing nodes, and the simulation run time is 60 minutes. The simulation configuration for the model is illustrated in Fig. 7. The datacenter is simulated as computing nodes, and it is configured based on the fog node which contains one region (since Cloud Analyst is geographically distributed, it may be configured using one or more regions), the simulation proceeds on the Linux operating system with the X86 architecture. It contains ten physical hardware units, and it supports xen as the virtual machine manager. In terms of the physical hardware configuration, the memory support is 2048 Mb, the storage is 100000 Mb, the bandwidth is 1000 mb/s, and the machine contains four processors with a speed of 3.20 ghz. Regarding the virtual machine (VM) configuration, for the Vm policy it follows the Time-shared policy, and it has an image size of 10000 Mb, memory of 1024 Mb, and bandwidth of 1000 Mb/s. The other configuration required is the server broker policy, which follows the existing Optimize Response Time algorithm [26], with a user grouping factor (Simultaneous user for single user base) of 1000 and a request grouping factor (Simultaneous request for a single application) of 100. The executable instruction length per request is 250 bytes and the load balance policy is throttled. Fig. 5 illustrates the different numbers of computing nodes for the different numbers of fog services.
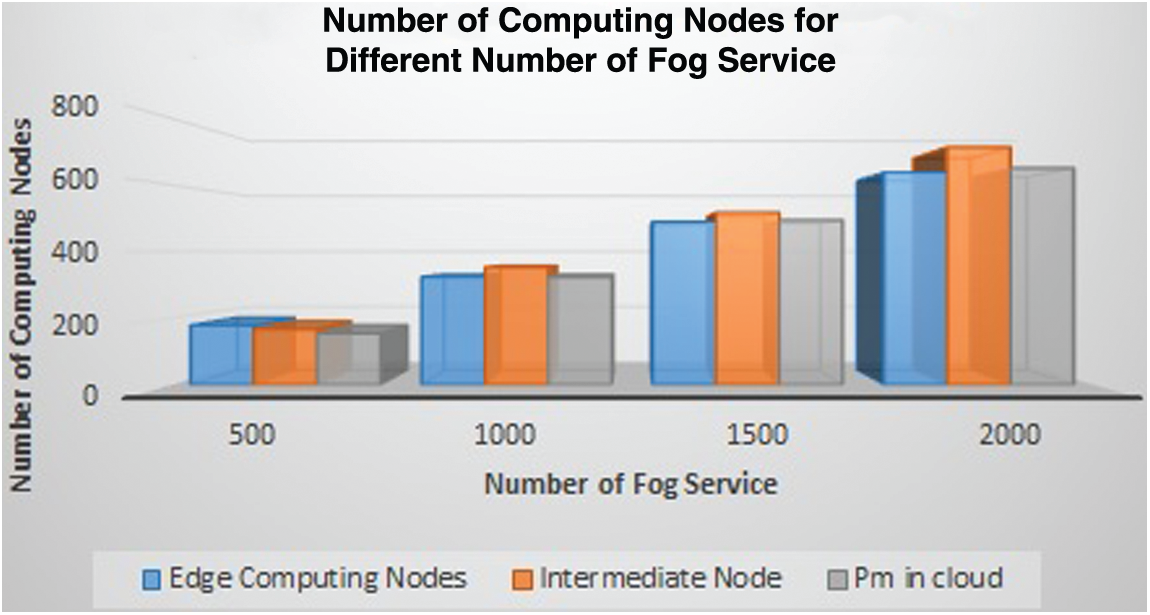
Figure 5: Computing nodes of different fog services
In the figure, Pm in cloud represents the number of physical machines (such as laptops, mobiles, etc.) in the cloud environment and Intermediate node represents the devices located inside the cloud like routers, switches, hubs, and many others.
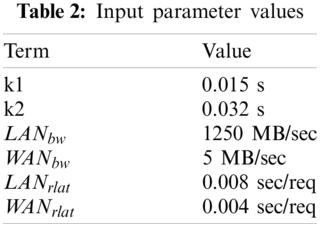
After configuring the simulation parameter, the simulation requires the input parameters listed in Tab. 2. In order, these are the constants k1 and k2, LAN and WAN bandwidth in Mb/sec, and LAN and WAN round trip latency.
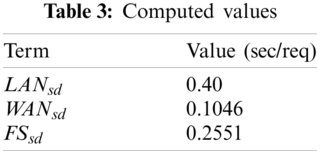
After giving the input values in Eqs. 13–15, the values are computed and provided in Tab. 3.
The system follows the M/M/m queuing model which follows the Poisson arrival process, and based on algorithm1 and the M/M/m queuing system, Tab. 4 lists the response times with the different arrival rates observed for the proposed Fog-QSYM and the existing Optimized Response Time Model (ORTM). As presented in Tab. 4, when the arrival rate increases, the response time also increases.
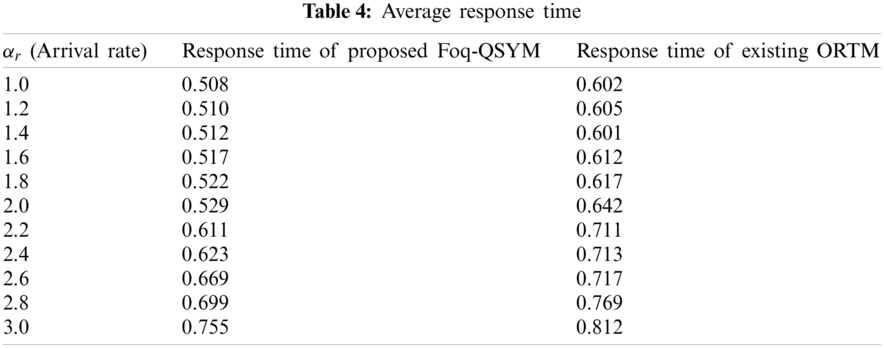
Fig. 6 gives the overall response time, which is the total of (arrival time + waiting time) of the request, and Fig. 7 shows the total datacenter processing time, which is the overall time taken to complete the request by simulation.
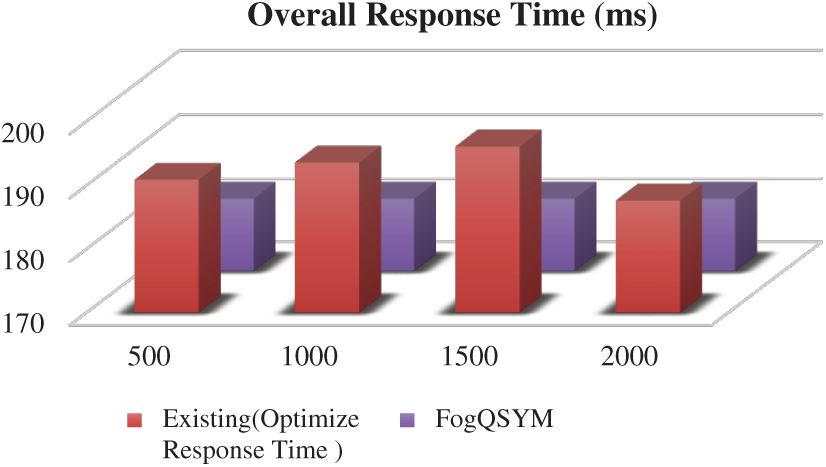
Figure 6: Overall response time
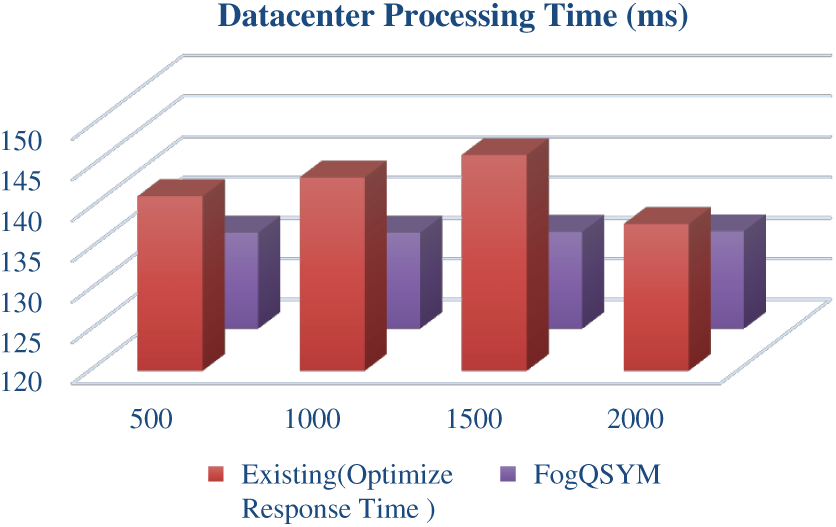
Figure 7: Datacenter processing time
Figs. 8 and 9 show the service time taken to complete the request for datacenter1 and datacenter2, respectively.
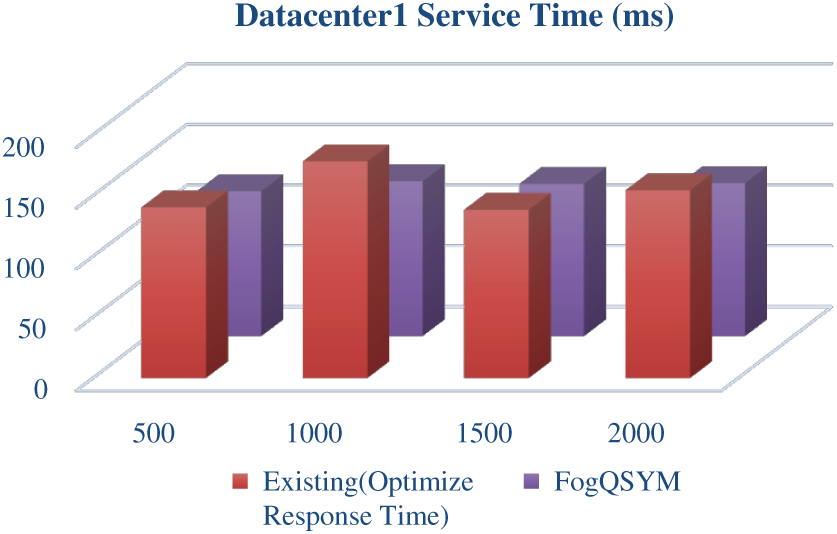
Figure 8: Datacenter1 service time
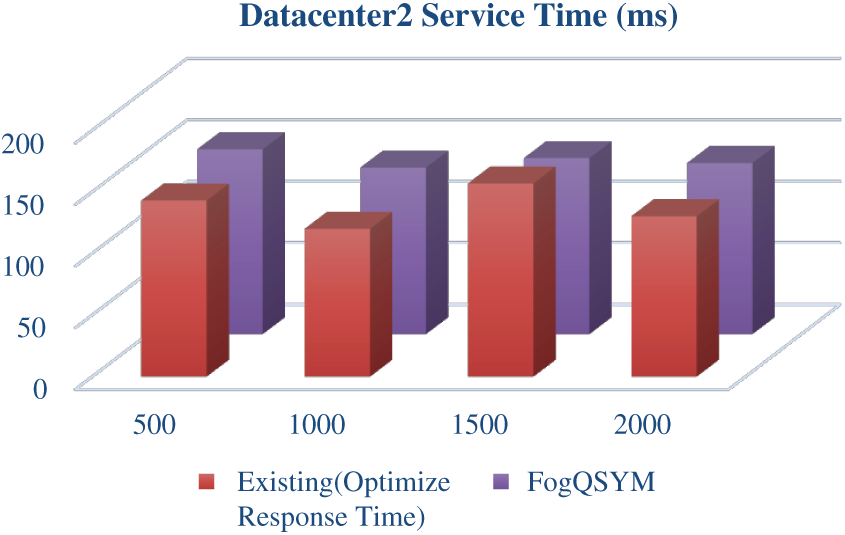
Figure 9: Datacenter2 service time
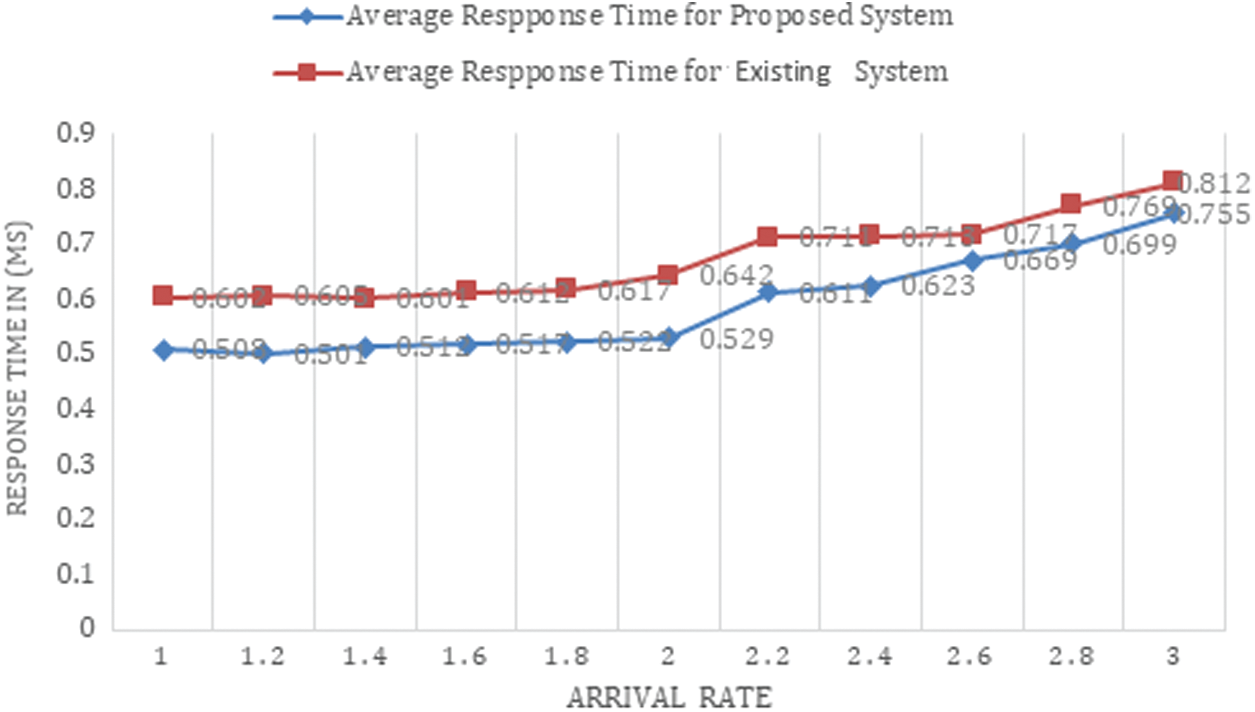
Figure 10: Average response time
Fig. 10 represents the average response times of the different arrival rates calculated for the proposed model as well as the existing optimized response time model. From the figure, it can be seen that the proposed Foq-QSYM model has a quick response time compared to the existing ORTM model.
5 Significance of our Proposed Work
The proposed Fog-QSYM is compared with the ORTM to evaluate the performance of the proposed model.
• The proposed Fog-QSYM model helps assign resources efficiently to free datacenters using the Markovian queuing model.
• By fixing different sizes of datacenters in the fog layer, the service response time for each resource is gradually reduced.
• According to different QoS metrics-based calculations, the average response time increases when there is a high arrival rate of resources in the fog layer.
The increased numbers of IoT and smart devices in Industry 4.0 applications generate enormous amounts of data with minimal delay tolerance. This paper proposed FogQSYM, which is an analytical Industry 4.0 model for fog applications that divides the application into several layers and ensures that resources are shared in an efficient manner according to the availability of memory, bandwidth, and resources. It follows the Markovian queuing model that helps identify the service rate of Industry 4.0 devices, availability of the system, and number of jobs in the system, which helps the application process the data without any delay tolerance. This shows the feasibility of dividing the application into several layers to share resources according to their suitability, which results in a low response time. After being implemented with differently-sized fog services in Industry 4.0 applications, the Fog-QSYM model has a lower response time than the existing ORTM model. It can also be noted that the average response time increases when the arrival rate increases. Upon implementing the model in the simulator, it is found that to decrease the response time, it is better to disconnect the slowest device with the lowest utilization.
Acknowledgement: This work was supported by the National Research Foundation of Korea under Grant 2019R1A2C1085388.
Funding Statement: This work was supported by the National Research Foundation of Korea under Grant 2019R1A2C1085388.
Conflicts of Interest: The authors declare that they have no conflicts of interest to report regarding the present study.
1. Postscapes, “Internet of Things (IoT) History,” [Online]. Available: https://www.postscapes.com/iot-history/ [Accessed on: 18th January 2021]. [Google Scholar]
2. H. Boyes, B. Hallaq, J. Cunningham and T. Watson, “The industrial internet of things (IIoTAn analysis framework,” Computers in Industry, vol. 101, no. 8, pp. 1–12, 2018. [Google Scholar]
3. S. R. K. Somayaji, M. Alazab, M. MK, A. Bucchiarone, C. L. Chowdhary et al., “A Framework for prediction and storage of battery life in IoT devices using dnn and blockchain,” arXiv preprint arXiv: 2011.01473, 2020. [Google Scholar]
4. S. P. RM, P. K. R. Maddikunta, M. Parimala, S. Koppu, T. Reddy et al., “An effective feature engineering for DNN using hybrid PCA-GWO for intrusion detection in IoMT architecture,” Computer Communications, vol. 160, pp. 139–149, 2020. [Google Scholar]
5. M. Aazam, S. Zeadally and K. A. Harras, “Deploying fog computing in industrial internet of things and industry 4.0,” IEEE Transactions on Industrial Informatics, vol. 14, no. 10, pp. 4674–4682, 2018. [Google Scholar]
6. C. Matt, “Fog computing: Complementing cloud computing to facilitate industry 4.0,” Business & Information Systems Engineering, vol. 60, no. 4, pp. 351–355, 2018. [Google Scholar]
7. D. Wu, S. Liu, L. Zhang, J. Terpenny, R. X. Gao et al., “A fog computing-based framework for process monitoring and prognosis in cyber-manufacturing,” Journal of Manufacturing Systems, vol. 43, no. 4, pp. 25–34, 2017. [Google Scholar]
8. S. Yi, Z. Hao, Z. Qin and Q. Li, “Fog computing: Platform and applications,” in 2015 Third IEEE Workshop on Hot Topics in Web Systems and Technologies, Washington, DC, USA, IEEE, pp. 73–78, 2015. https://doi.org/10.1109/HotWeb.2015.22. [Google Scholar]
9. S. K. Mani and I. Meenakshisundaram, “Improving quality-of-service in fog computing through efficient resource allocation,” Computational Intelligence, vol. 36, no. 4, pp. 1527–1547, 2020. [Google Scholar]
10. A. Rayes and S. Salam, Internet of Things from Hype to Reality. The Road to Digitization. River Publisher Series in Communications, Basel, Switzerland: Springer, pp. 49, 2017. [Google Scholar]
11. Y. Meng, M. A. Naeem, A. O. Almagrabi, R. Ali and H. S. Kim, “Advancing the state of the fog computing to enable 5G network technologies,” Sensors, vol. 20, no. 6, pp. 1754, 2020. [Google Scholar]
12. Y. Qin, “When things matter: A survey on data-centric internet of things,” Journal of Network and Computer Applications, vol. 64, no. 2, pp. 137–153, 2016. [Google Scholar]
13. A. Dastjerdi and R. Buyya, “Fog computing: Helping the internet of things realize its potential,” Computer, vol. 49, no. 8, pp. 112–116, 2016. [Google Scholar]
14. M. I. Pramanik, R. Lau, H. Demirkan and M. A. KalamAzad, “Smart health: Big data enabled health paradigm within smart cities,” Expert Systems with Applications, vol. 87, no. 2, pp. 370–383, 2017. [Google Scholar]
15. T. S. Nikoui, A. M. Rahmani and H. Tabarsaied, “Data Management in fog computing,” in Fog and Edge Computing: Principles and Paradigms, pp. 171–190, 2019. https://www.onlinelibrary.wiley.com/doi/book/10.1002/9781119525080. [Google Scholar]
16. S. P. RM, S. Bhattacharya, P. K. P. Maddikunta, S. R. K. Somayaji, K. Lakshmanna et al., “Load balancing of energy cloud using wind driven and firefly algorithms in internet of everything,” Journal of Parallel and Distributed Computing, vol. 142, pp. 16–26, 2020. [Google Scholar]
17. V. Moysiadis, P. Sarigiannidis and I. Moscholios, “Towards distributed data management in fog computing,” Wireless Communications and Mobile Computing, vol. 2018, no. 1, pp. 1–14, 2018. [Google Scholar]
18. P. O’donovan, C. Gallagher, K. Bruton and D. T. O’Sullivan, “A fog computing industrial cyber-physical system for embedded low-latency machine learning Industry 4.0 applications,” Manufacturing Letters, vol. 15, no. 1, pp. 139–142, 2019. [Google Scholar]
19. C. C. Lin and J. W. Yang, “Cost-efficient deployment of fog computing systems at logistics centers in industry 4.0,” IEEE Transactions on Industrial Informatics, vol. 14, no. 10, pp. 4603–4611, 2018. [Google Scholar]
20. B. Jamil, M. Shojafar, I. Ahmed, A. Ullah, K. Munir et al., “A job scheduling algorithm for delay and performance optimization in fog computing,” Concurrency and Computation: Practice and Experience, vol. 32, no. 7, pp. e5581, 2020. [Google Scholar]
21. A. A. Sadri, A. M. Rahmani, M. Saberikamarposhti and M. HosseinZadeh, “Fog data management: A vision, challenges, and future directions,” Journal of Network and Computer Applications, vol. 174, no. 10, pp. 102882, 2020. [Google Scholar]
22. M. Enguehard, Y. Desmouceaux and G. Carofiglio, “Efficient latency control in fog deployments via hardware-accelerated popularity estimation,” ACM Transactions on Internet Technology, vol. 20, no. 3, pp. 1–23, 2020. [Google Scholar]
23. G. Javadzadeh and A. M. Rahmani, “Fog computing applications in smart cities: A systematic survey,” Wireless Networks, vol. 26, no. 2, pp. 1433–1457, 2020. [Google Scholar]
24. M. Haghi Kashani, A. M. Rahmani and N. Jafari Navimipour, “Quality of service-aware approaches in fog computing,” International Journal of Communication Systems, vol. 33, no. 8, pp. e4340, 2020. [Google Scholar]
25. C. S.Nandyala and H. K. Kim, “From cloud to fog and IoT-based real-time U-healthcare monitoring for smart homes and hospitals,” International Journal of Smart Home, vol. 10, no. 2, pp. 187–196, 2016. [Google Scholar]
26. A. Kumari, S. Tanwar, S. Tyagi and N. Kumar, “Fog computing for Healthcare 4.0 environment: Opportunities and challenges,” Computers & Electrical Engineering, vol. 72, no. 5, pp. 1–13, 2018. [Google Scholar]
27. E. Marín-Tordera, X. Masip-Bruin, J. García-Almiñana, A. Jukan, G. J. Ren et al., “Do we all really know what a fog node is? Current trends towards an open definition,” Computer Communications, vol. 109, no. 4, pp. 117–130, 2017. [Google Scholar]
28. M. Taneja and A. Davy, “Resource aware placement of data analytics platform in fog computing,” Procedia Computer Science, vol. 97, pp. 153–156, 2016. [Google Scholar]
29. M. Iyapparaja and P. Sivakumar, “Metrics based evaluation for disease affection in distinct cities,” Research Journal of Pharmacy and Technology, vol. 10, no. 8, pp. 2487–2491, 2017. [Google Scholar]
30. M. Iyapparaja and B. Sharma, “Augmenting SCA project management and automation framework,” Materials Science and Engineering Conference Series, vol. 263, no. 4, pp. 042018, 2017. [Google Scholar]
 | This work is licensed under a Creative Commons Attribution 4.0 International License, which permits unrestricted use, distribution, and reproduction in any medium, provided the original work is properly cited. |