DOI:10.32604/cmc.2021.017612
| Computers, Materials & Continua DOI:10.32604/cmc.2021.017612 | |
| Article |
An Intelligent Gestational Diabetes Diagnosis Model Using Deep Stacked Autoencoder
1SRC, SASTRA Deemed to be University, Kumbakonam, Tamil Nadu, 612001, India
2Consultant Obstetrician and Gynecologist, Anbu Hospital and Nalam Clinic, Kumbakonam, Tamil Nadu, 612001, India
*Corresponding Author: A. Sumathi. Email: sumathi@src.sastra.edu
Received: 04 February 2021; Accepted: 29 March 2021
Abstract: Gestational Diabetes Mellitus (GDM) is one of the commonly occurring diseases among women during pregnancy. Oral Glucose Tolerance Test (OGTT) is followed universally in the diagnosis of GDM diagnosis at early pregnancy which is costly and ineffective. So, there is a need to design an effective and automated GDM diagnosis and classification model. The recent developments in the field of Deep Learning (DL) are useful in diagnosing different diseases. In this view, the current research article presents a new outlier detection with deep-stacked Autoencoder (OD-DSAE) model for GDM diagnosis and classification. The goal of the proposed OD-DSAE model is to find out those mothers with high risks and make them undergo earlier diagnosis, monitoring, and treatment compared to low-risk women. The presented OD-DSAE model involves three major processes namely, preprocessing, outlier detection, and classification. In the first step i.e., data preprocessing, there exists three stages namely, format conversion, class labelling, and missing value replacement using k-nearest neighbors (KNN) model. Outliers are superior values which considerably varies from other data observations. So, it might represent the variability in measurement, experimental errors or novelty too. So, Hierarchical Clustering (HC)-based outlier detection technique is incorporated in OD-DSAE model, and thereby classification performance can be improved. The proposed model was simulated using Python 3.6.5 on a dataset collected by the researcher themselves. A series of experiments was conducted and the results were investigated under different aspects. The experimental outcomes inferred that the OD-DSAE model has outperformed the compared methods and achieved high precision of 96.17%, recall of 98.69%, specificity of 89.50%, accuracy of 96.18%, and F-score of 97.41%.
Keywords: Gestational diabetes mellitus; data classification; outlier detection; deep learning; hierarchical clustering
Gestational Diabetes Mellitus (GDM) is characterized by uncertain glucose level in blood stream at the time of pregnancy [1]. In earlier gestation fasting, the blood glucose level becomes low and insulin secretion also gets reduced gradually. This phenomenon is applied in the progressive improvement of insulin resistance in next trimesters with a marginal enhancement of insulin generation or hyperinsulinemia. Further, insulin resistance exists in case of placental hormones too. Pre-defined pathophysiologic systems, along with pregnancy, tend to change the metabolism in human body and enables maximum amount of postprandial maternal glucose. Pregnancy is one of the hyperinsulinemic conditions which creates an imbalance in glucose secretion, when insulin secretion becomes irregular to equalize pregnancy-based insulin protection. GDM can be described as chronic low-grade subclinical infection classified by irregular generation of cytokines, mediators followed by initiation of inflammatory signaling pathways. Even though GDM is considered to be resistant to insulin, the accurate process behind this model is still unexplored and challenging. Therefore, the increased level of insulin resistance in pregnancy is defined as cortisol and gestational hormones; however, the recent studies confirmed the involvement of cytokines too in this application [2]. The presence of type 2 diabetes, among females with previous GDM (pGDM), is diagnosed during postpartum period with a maximum threshold. Further, the developers have found that the females with pGDM have high chances of developing type 2 DM within a limited period after pregnancy. Diabetes is one of the irreversible diseases which is accompanied by CVD mostly. In addition to the above, women with GDM are also prone to heart attacks, obesity, hypertension, dyslipidemia, and subclinical atherosclerosis. Those patients under metabolic anomalies with GDM are likely to have type 2 diabetes and it is a result of natural course of disease that eventually causes high risk CVD.
Early diagnosis and prediction tend to reduce the existence of GDM and commit minimum adverse pregnancy results [3]. But, the survey conducted earlier mentioned that GDM cases are confirmed in a limited period of time using Oral Glucose Tolerance Test (OGTT). This leaves an optimal window of contribution for both fetal as well as placental deployment. OGTT is mostly recommended during early pregnancy across the globe. However, it is expensive and provide inaccurate results in most of the cases. GDM manifests during the period of mid-to-late pregnancy [4]. So, earlier detection is essential to reduce further health risks. The establishment of simple prediction model, using previous medical data, among women who are at high risks of GDM helps in identifying mothers who require earlier diagnosis and treatment to obviate OGTTs. The currently-developed prediction models for GDM were introduced under the application of traditional regression model. In this scenario, Machine Learning (ML), a data analysis model that develops methods to predict results by ‘learning’ from data, has been emphasized as a competing alternative to regression analysis. Further, ML is capable of performing well than regression, in terms of capturing nonlinearities as well as complicated communications between prediction attributes. Therefore, the current study employed ML methods for GDM prediction and no other models were selected that are relevant to Logistic Regressions (LR).
Outlier or anomaly prediction is one of the significant objectives in ML and data mining methods. In the literature [5], the prediction of an outlier is considered to be the problem of pattern identification in data, which is not the actual behavior. Outlier prediction domains are also involved in intrusion detection, credit fraud investigation, video tracking, climate detection, identification of cybercrimes in electronic commerce, and so on [6]. Additionally, some other types of outliers exist such as point outliers, contextual outliers and collective outliers. The prediction of point outlier has been employed in various other domains too. A data set has multiple points whereas a point is referred to as an outlier when it is differentiated from a massive number of points. In order to predict the outliers, some of the effective models have been applied earlier namely, classification modules, nearest neighbor schemes, clustering, statistical approach, distance-based approaches, and so forth. In classification-based outlier prediction, there are two classes present such as multiclass and single-class anomaly prediction approaches. Initially, multi-class classifiers have adopted the training dataset with labeled normal class label points. Next, the learner who applies the supervised learning trains another method under the application of labeled data. Classifier is generally applied to differentiate normal class from the remaining class. Alternatively, in single-class outlier's prediction, only a single normal class classification contributes in learning and predicting the boundary of a normal class. When a test point is irrelevant to the boundary, then it is considered as an outlier.
The contribution of this research work is as follows. This research article presents a new outlier detection model i.e., deep stacked Autoencoder (OD-DSAE) model for GDM diagnosis and classification. The presented OD-DSAE model aims at identifying high-risk mothers who mandatorily need early diagnosis, monitoring, and treatment compared to low-risk women. The presented OD-DSAE model performs GDM diagnosis following three sub-processes such as preprocessing, outlier detection, and classification. Primarily, data preprocessing occurs in three stages namely, format conversion, class labelling, and missing value replacement using k-nearest neighbors (KNN) model. Next to that, Hierarchical Clustering (HC)-based outlier detection technique is incorporated in OD-DSAE model due to which classification performance gets improved. The detailed simulation analysis was conducted to verify the superior performance of the presented OD-DSAE model.
This section reviews several diagnosis models used in the detection of GDM. Xiong et al. [7] aimed at developing a first-19 weeks’ risk detection method with numerous potential for GDM detectors and used Support Vector Machine (SVM) as well as Light Gradient Boosting Machine (lightGBM). Zheng et al. [8] developed a simple method to predict GDM among Chinese women during their earlier pregnancy with the help of biochemical markers and ML model. In the literature, Shen et al. [9] examined the possibility of the best AI method for GDM examination in a setting that requires limited clinical equipment and clinicians. The study also developed an app based on AI scheme.
In the literature [10], the detection of GDM with diverse ML methods has been implemented on PIMA dataset. The accuracy of diverse ML methods was verified with measures. The importance of ML techniques was depicted under the application of confusion matrix, Receiver Operating Characteristic (ROC) and AUC values in managing diabetes PIMA dataset. Srivastava et al. [11] proposed a statistical method for evaluation of Gestational Diabetes Mellitus under the application of Microsoft Azure AI services. It is an ML Studio that yields excellent performance while its algorithm works on the perception of drag and drop. The classifier used in this process to detect the existence of GDM relied on the aspects occur during earlier phases of pregnancy. Cost-Sensitive Hybrid Model (CSHM) and five traditional ML models were applied in the development of prediction methods [12] to capture the upcoming threats of GDM in temporally-collected EHRs. After the completion of data cleaning, few data was recorded and gathered for a data set.
In the study conducted earlier [13], Radial Basis Function Network (RBFNetwork) was designed, estimated for performance and compared with ANN model to find feasible cases of GDM that produce harmful effects to pregnant women and fetus. In Ye et al. [14], parameters have been trained in various ML and classic LR methods. In Du et al. [15], three different classifiers were used to predict the target in case of future infection. The prediction accuracy guides the physician to make a better decision and regular prevention. Finally, it is identified that the DenseNet method predicts the target as gestational diabetes with minimum flexibility.
The major limitation of predominant classification models is that these frameworks depend upon exact labels, for normal class labels, which are highly complicate to use in real-time scenarios. In case of nearest neighbor-related outlier prediction schemes, some of the considerations are ‘points’ that belong to dense regions whereas the outliers come under sparse regions. Local Outlier Factor (LOF) mechanism is one of the well-established models to date. The basic principle of LOF depends on local density estimation of score points. Every point is allocated to a score in the ratio of mean local density of k-nearest neighbors (k-NN) of the point against the local densities of data point. Thus, the major constraints of this model are O(n2) complexity. Clustering-relied outlier prediction models make use of clustering technologies to collect the data as clusters. But, these points do not come under the clusters named ‘outliers’.
The main aim of clustering is to identify the clusters; thus, the outliers are considered to be the result of clustering operation which is not optimized appropriately. The root cause behind this strategy is the complex nature of clustering approaches in O(n2). In case of statistical outlier prediction, these approaches rely upon normal data point in high probability sites of stochastic method while the anomaly exists in low possibility regions. Generally, the statistical models are suitable for Gaussian distribution which is a combination of parametric statistical distribution that offers data and statistical inference test used to estimate the unknown sample under this method. But, the major disadvantage of this approach is the interruption of data points. Hence, in case of maximum dimension of data, the hypothesis becomes false. For distance-based outlier's prediction, a point has been assumed to be an outlier when it is composed of minimum sufficient points than a defined threshold value [16].
Fig. 1 shows the working principle of OD-DSAE model. The presented OD-DSAE model involves three major processes namely, preprocessing, outlier detection, and classification. Initially, data preprocessing occurs in three stages namely, format conversion, class labeling, and missing value replacement. In addition, Hierarchical Clustering (HC)-based outlier detection technique is employed to remove the unwanted instances present in the dataset. Outliers are superior values and it varies considerably from other data observation. So, it might represent variability in measurement or experimental errors or in terms of novelty. So, outlier detection technique is incorporated in the OD-DSAE model, thereby classification performance can be improved. Finally, DSAE is applied as a classification model to determine an appropriate class label for GDM.
At this stage, the input medical data is preprocessed to improve data quality in three ways. Firstly, the data conversion process occurs during when the input data in .xls format is converted into .csv format. Secondly, class labeling process is carried out during when the data instances are allocated to corresponding class labels. Thirdly, missing value replacement is performed using KNN technique. KNN is a simple and efficient technique that stores all the existing cases while at the same time, it categorizes the new cases based on a similarity measure. In this scenario, KNN model is deployed as a tool for data imputation. The principle behind KNN method is provided herewith [17]:

Figure 1: Overall process of OD-DSAE model
• Evaluate the variable
• The Euclidian distance between the missing values should be determined with the help of Eq. (1).
where
• According to the distance details attained, the lower Euclidian distance relies on a parameter
where
where
3.2 HC-Based Outlier Detection Technique
Once the data is pre-processed, HC-based outlier detection technique is executed to remove the outliers exist in the data. The proposed HC algorithm operates in a bottom-up manner. Here, the clusters are merged till an individual cluster is attained and the entire procedure gets iterated to determine the optimal cluster count that fits the data [18]. It begins with the consideration of every instance as a single cluster, and consequently necessitate
Fig. 2 shows the processes involved in HC. In HC model, the clusters are merged in such a way that the quadratic mutual information gets maximized. At this point, two approaches are available for merging such as agglomerative clustering and split-and-merge clustering.

Figure 2: Processes involved in HC
3.2.1 Agglomerative Clustering
In this method, the modifications are estimated on quadratic mutual data after the integration of pair of clusters and identification of optimal clusters. The pair is selected which enhances the quadratic mutual information. The clusters with minimum distortion have emerged which are applied in the optimization of distortion-rate function. Consider that the clusters
where

3.2.2 Split and Merge Clustering
In contrast to agglomerative clustering, split-and-merging clustering technique is applied to detect the cluster in a hierarchy for elimination process. The cluster exerts a poor impact on quadratic mutual data. This denotes that when the clusters are eliminated, then mutual information could be enhanced. Assume the cluster
The instances of poor cluster are allocated to residual clusters of clustered space depending on minimum Euclidean distance, where the closest samples are allocated initially. These processes are followed until one remaining cluster is reached. Followed by, on the basis of drastic extensions in quadratic mutual data from various hierarchies

3.3 DSAE-Based Classification Technique
DSAE model is executed to allocate the class labels of input data, i.e., presence of GDM or not. Basically, autoencoder (AE) is a type of unsupervised learning and is composed of three layers namely, input, hidden, and output layers as depicted in Fig. 3. The operation of AE training is comprised of two portions namely, Encoder and Decoder.

Figure 3: Structure of AE
Generally, encoder is applied in mapping the input data to hidden implication, while decoder is considered for redevelopment of input data from hidden representation. It is provided as unlabeled input dataset

Figure 4: Structure of SAE
Thus, SAE-relied models can be classified using three procedures as given herewith
• The first AE is trained with the help of input data and gain the learned feature vector
• The feature vector of the previous layer is applied as input for the next layer and is followed till the training process is completed.
• Once the hidden layers are trained, Backpropagation (BP) model is applied to maximize the cost function and upgrade the weights with labelled training set and accomplish the fine-tuning process.
Dropout is an efficient principle that limits the overfitting process involved in NN training. Most of the overfitting issues exist only when the training set is minimum and it intends to generate minimum accuracy on the test set. Dropout affects the neurons randomly with a hidden layer and the energy gets drained during training process; however, the weights of the neurons are maintained. Moreover, dropout is capable of accomplishing the output date of hidden neurons to
In case of classical activation functions like sigmoid and hyperbolic tangent functions, the gradients get reduced immediately with training error and propagate it to forward layers. Rectified LLinear units
The presented model was simulated in Python 3.6.5 with additional packages such as tensorflow-gpu==1.14.0, pyqt5==5.14, pandas, scikit-learn, matplotlib, prettytable, seaborn, tqdm, numpy==1.16.0, and h5py==2.7.0. The snapshots of the results yielded during the simulation process are shown in the appendix. The presented OD-DSAE model was experimentally validated using the GDM dataset constructed by researcher themselves. It has a total of 3525 instances with the existence of 15 features. In addition, a set of two class labels exists in the dataset. Particularly, 2153 instances belong to class 0 and 1372 instances belong to class 1. Tab. 1 shows the information related to the dataset. Fig. 5 shows the frequency distribution of attributes that exist in GMD dataset.

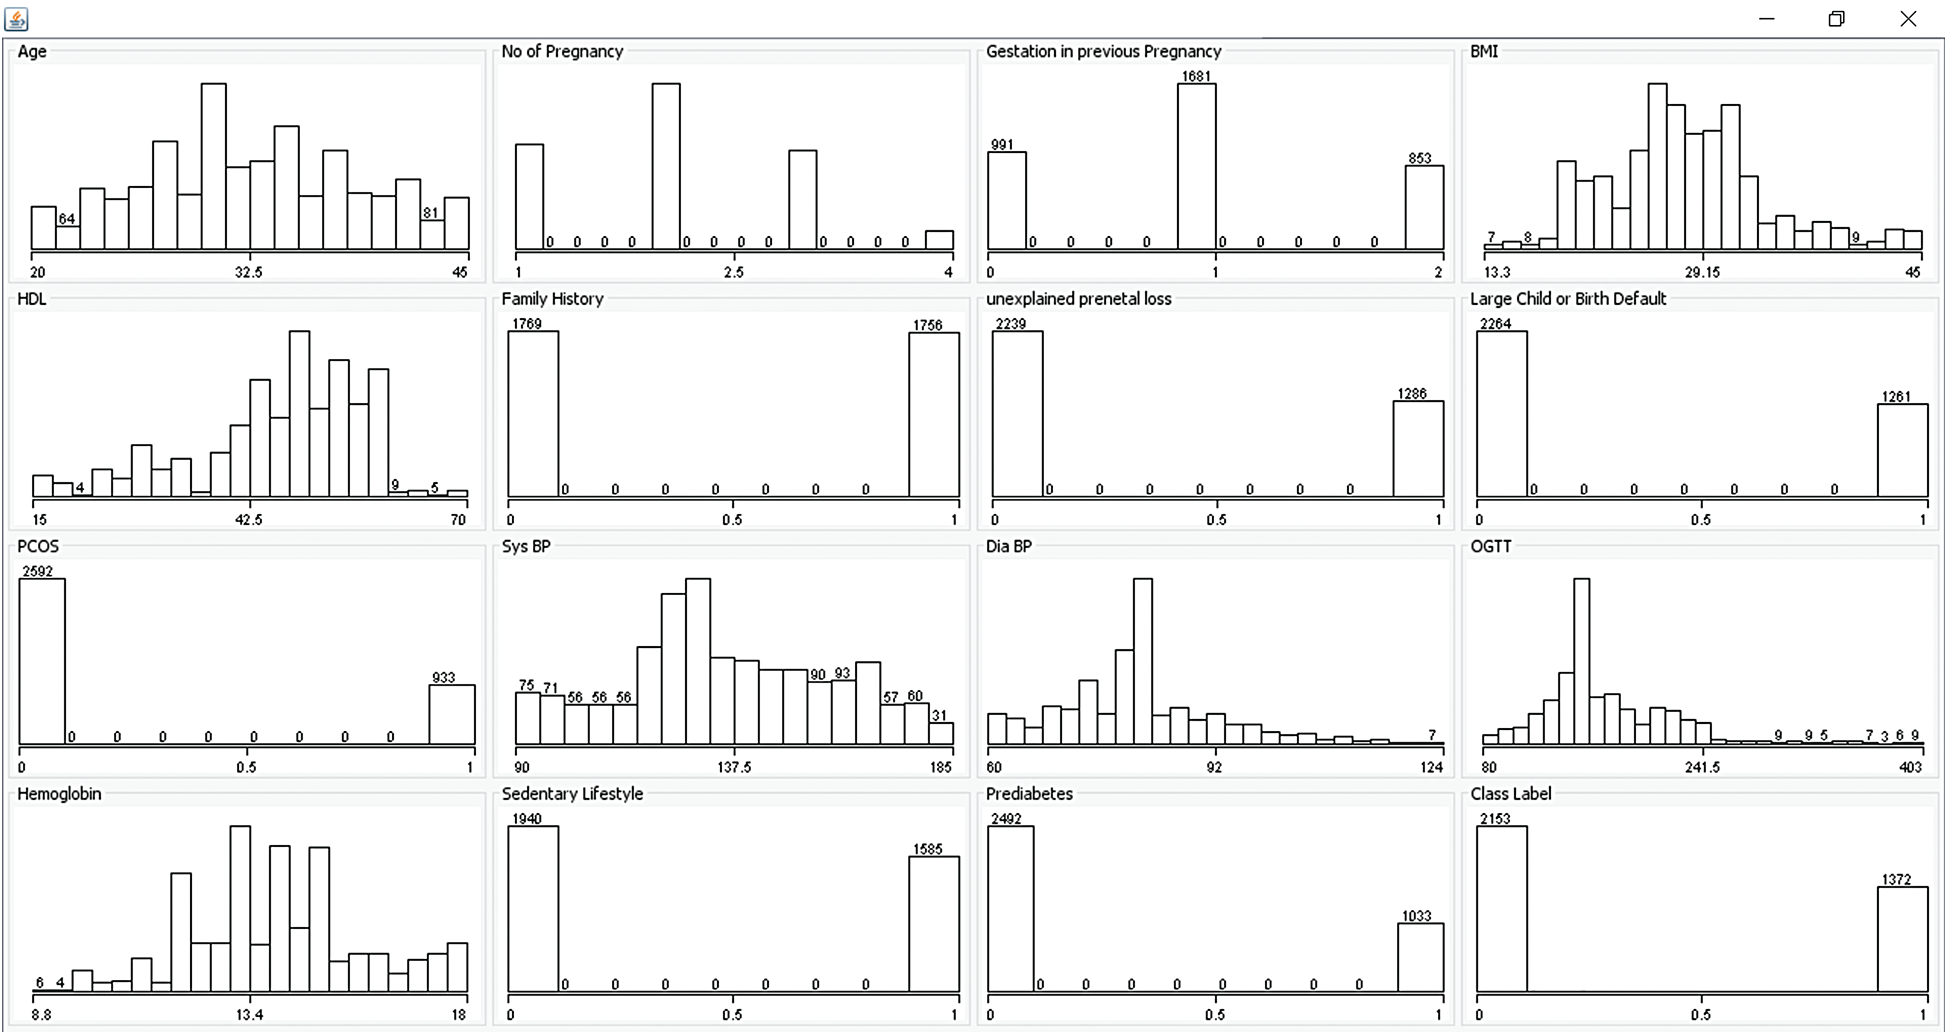
Figure 5: Frequency distribution of GDM dataset
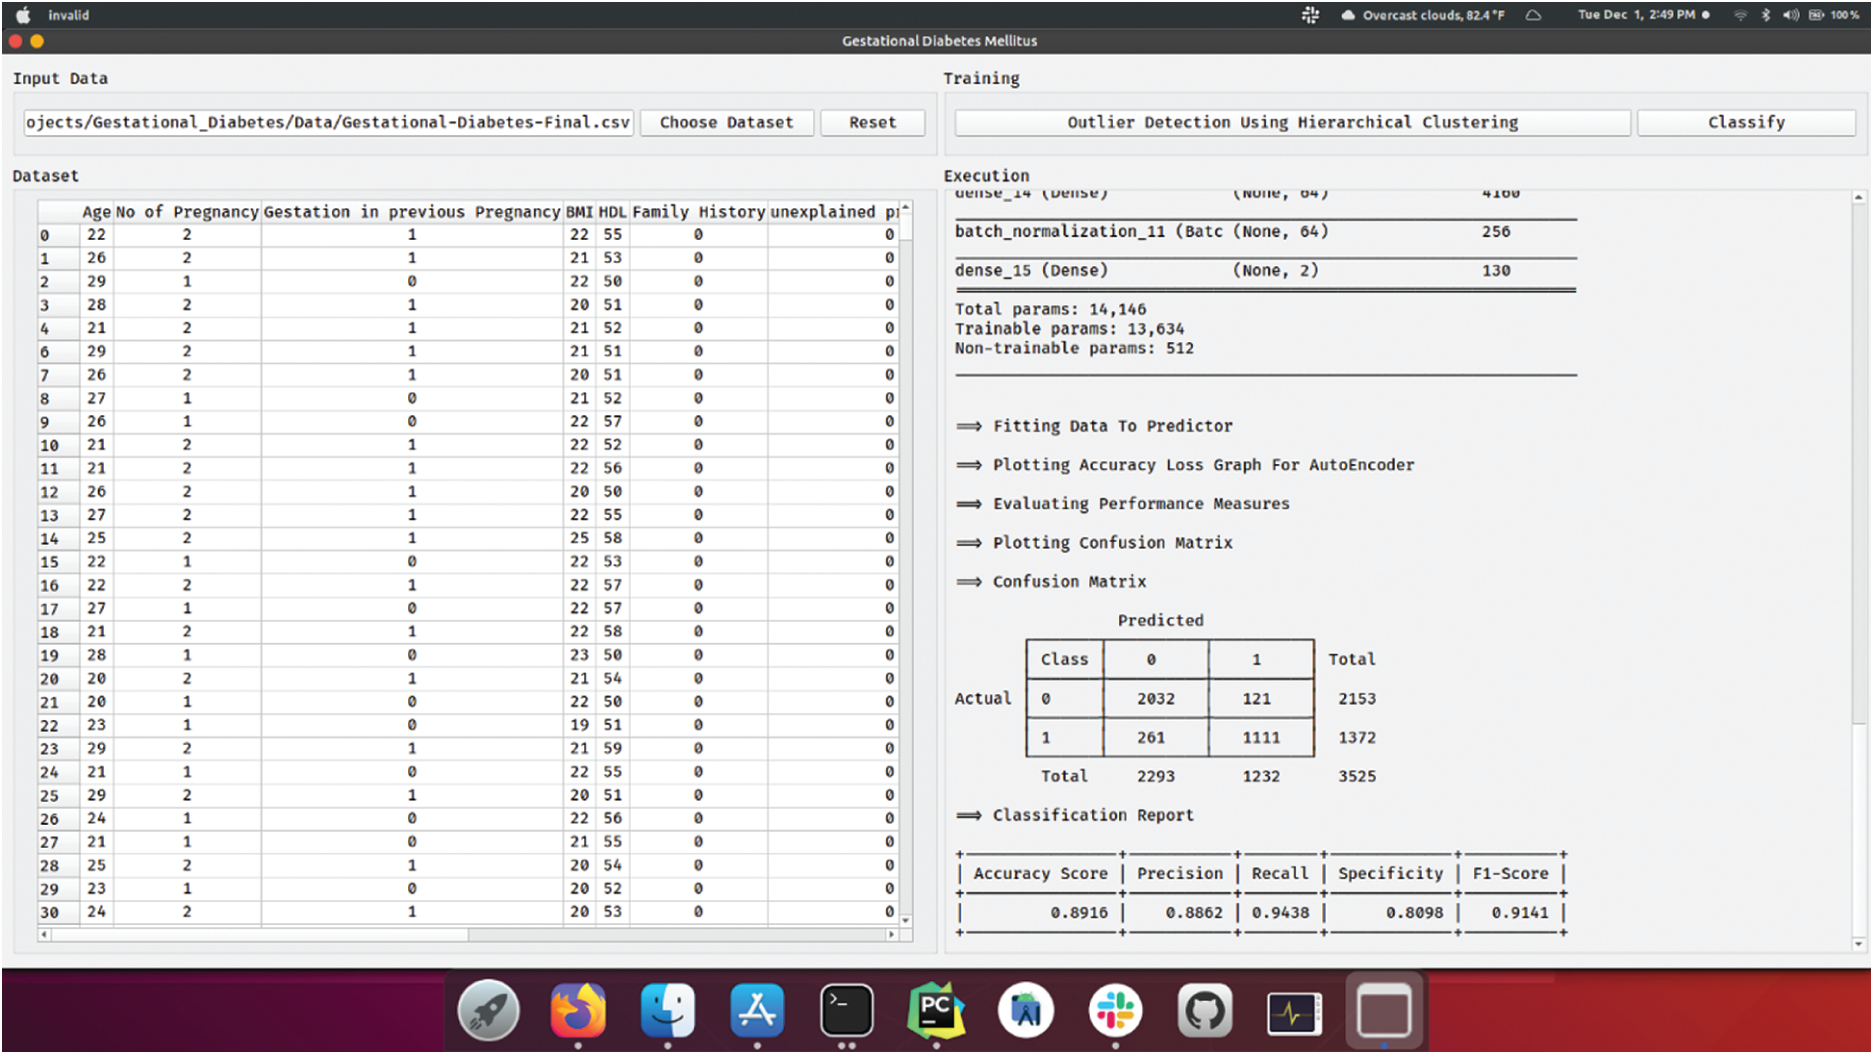
Fig. 6 depicts the confusion matrix generated by DSAE model when classifying GDM dataset. The figure portrays that the DSAE model classified 2032 instances under class 0 and 1111 instances under class 1. These values inferred the proficient classification outcome of the presented DSAE model.
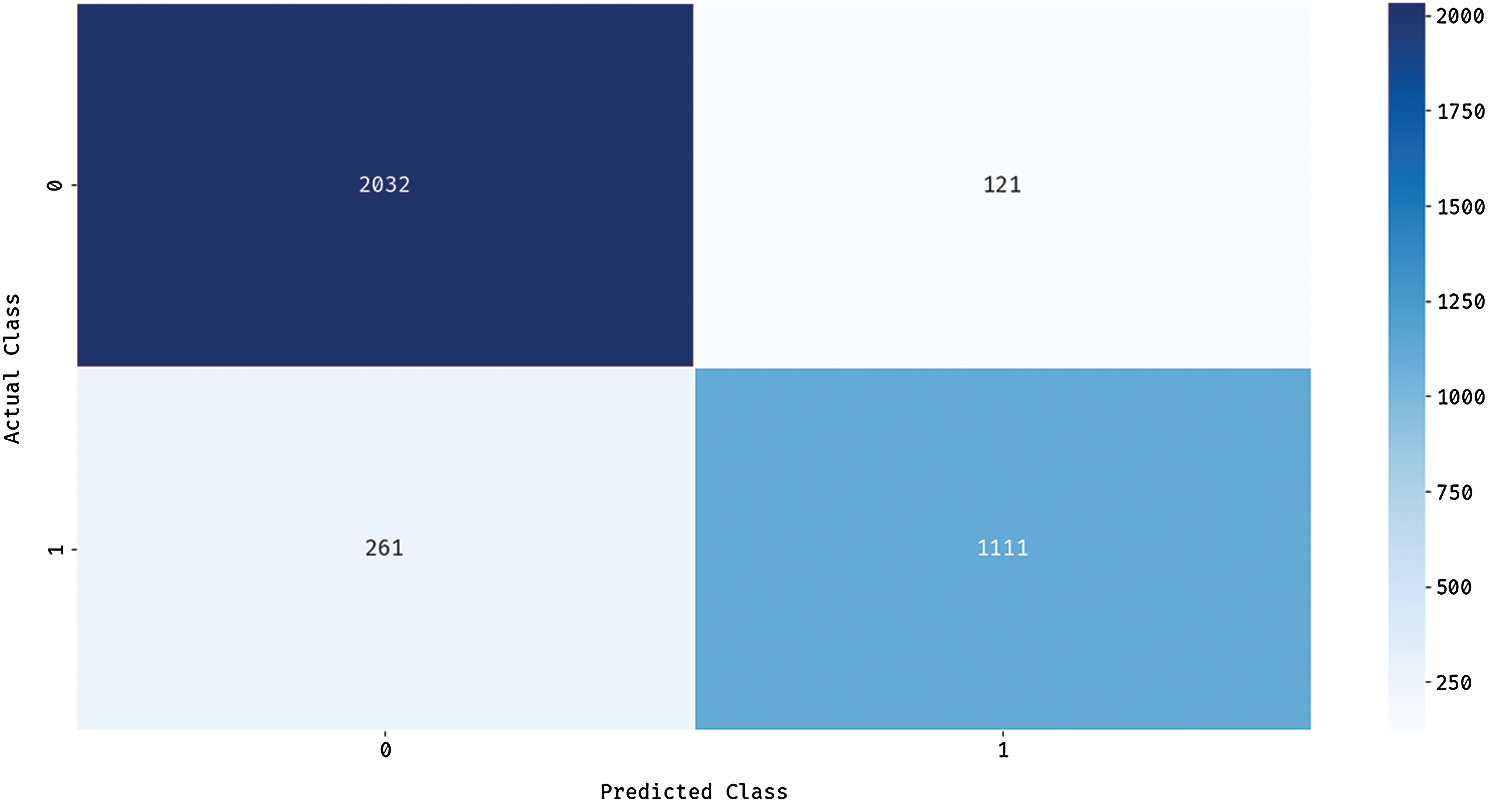
Figure 6: Confusion matrix of DSAE
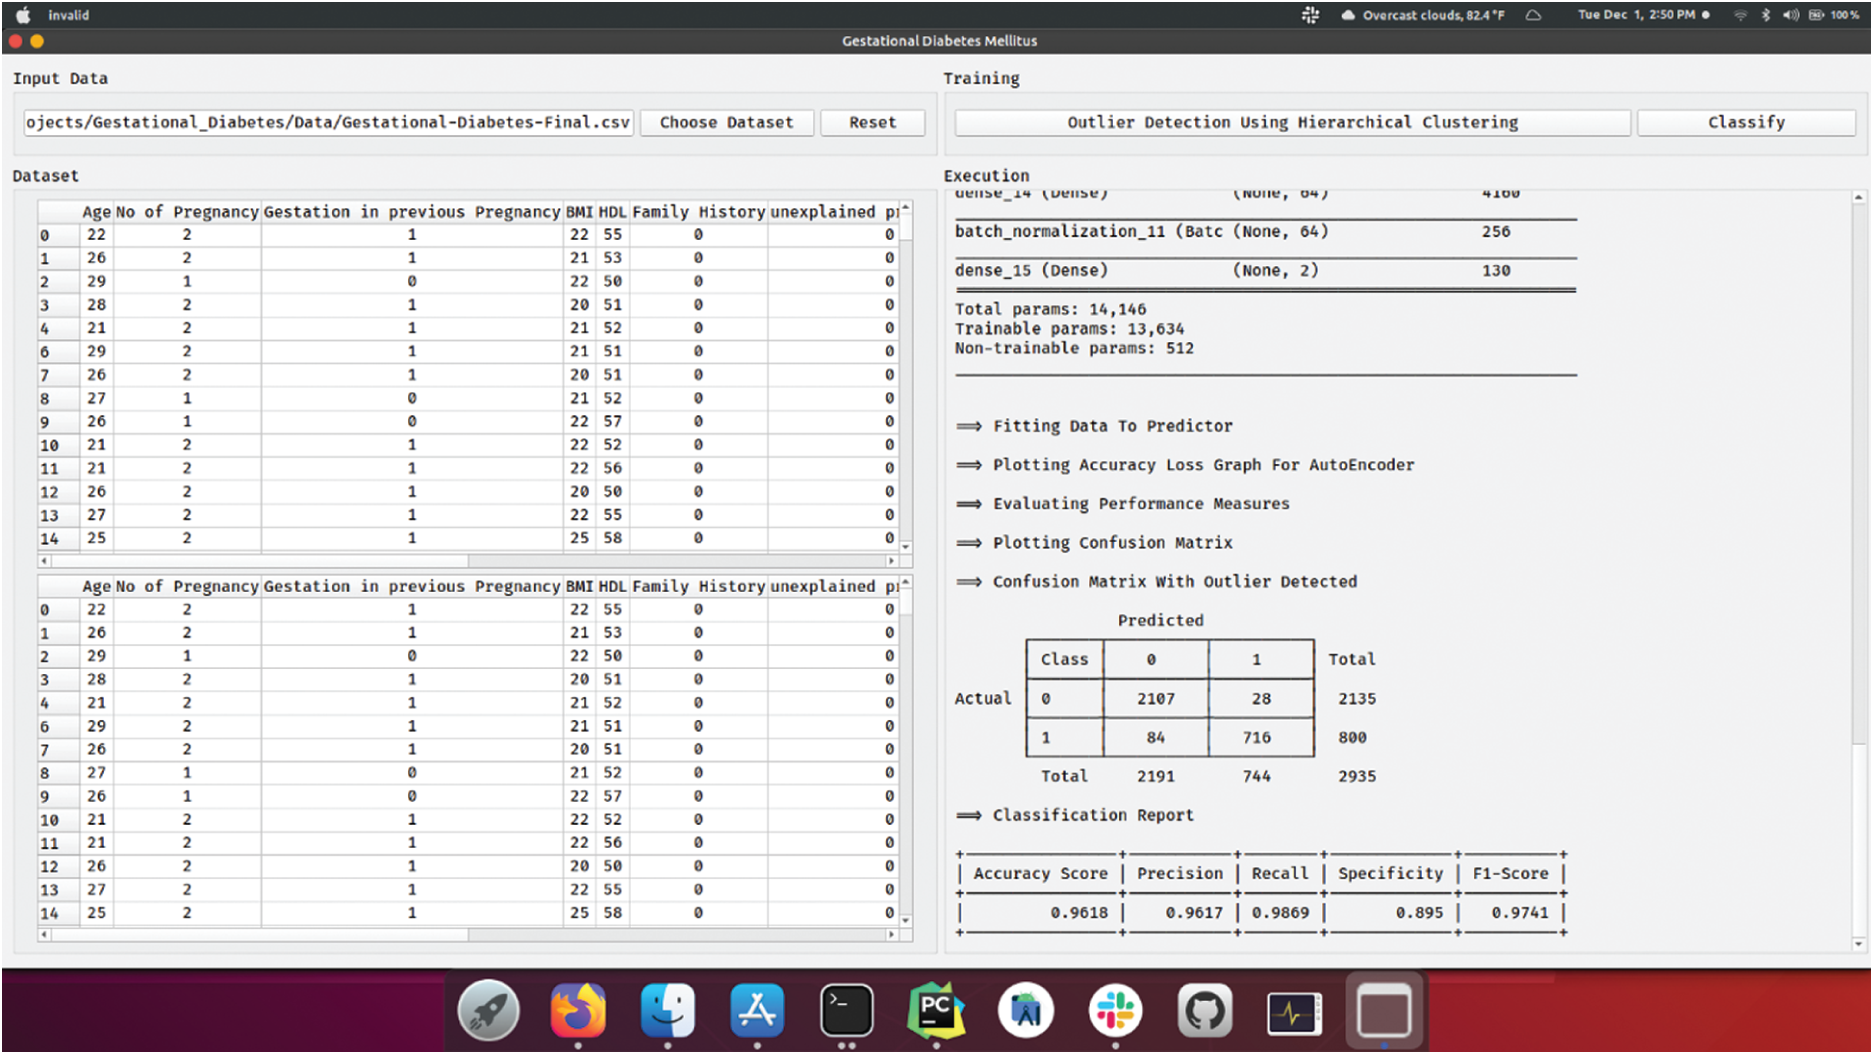
Fig. 7 illustrates the confusion matrix generated by OD-DSAE model when classifying GDM dataset. The figure shows that the DSAE model classified 2107 instances under class 0 and 716 instances under class 1. These values exhibit that the presented OD-DSAE model effectually classified more number of instances in comparison with DSAE model. In order to emphasize the outlier detection performance of C technique, the results were examined in terms of correctly- and incorrectly-clustered samples as shown in Tab. 2. From the table, it is evident that the HC technique has correctly clustered 2135 instances under class 0 and 800 instances under class 1. At the same time, the number of incorrectly clustered instances under classes 0 and 1 were 18 and 572 respectively. Thus, the HC technique is inferred to have correctly clustered a total of 2935 instances and incorrectly clustered 590 instances.
Tab. 3 provides the results of comparative analysis of the presented OD-DSAE model against traditional ML models using GDM dataset. Fig. 8 showcases recall, precision, and specificity analyses of the presented OD-DSAE method on applied GDM dataset. The attained values signify that the Voted Perceptron model produced minimal classification performance with a recall of 65.1%, precision of 86.9%, and specificity of 63.86%. In line with this, the Logit boost model accomplished a somewhat higher recall of 77.61%, precision of 84.6%, and specificity of 75.46%. At the same time, the DT methodology yielded an even better recall of 79.02%, precision of 81.4%, and specificity of 75.13%. Along with that, the LR model achieved a moderate diagnostic outcome with a recall of 79.27%, precision of 88%, and specificity of 75.32%. Also, the NN model gained superior recall of 79.84%, precision of 83.2%, and specificity of 76.78%. However, it failed to outperform the proposed DSAE and OD-DSAE methods. Finally, the presented DSAE model accomplished an effective recall of 94.38%, precision of 88.62%, and specificity of 80.98%. But, the OD-DSAE model attained the maximum recall of 98.69%, precision of 96.17%, and specificity of 89.5%.
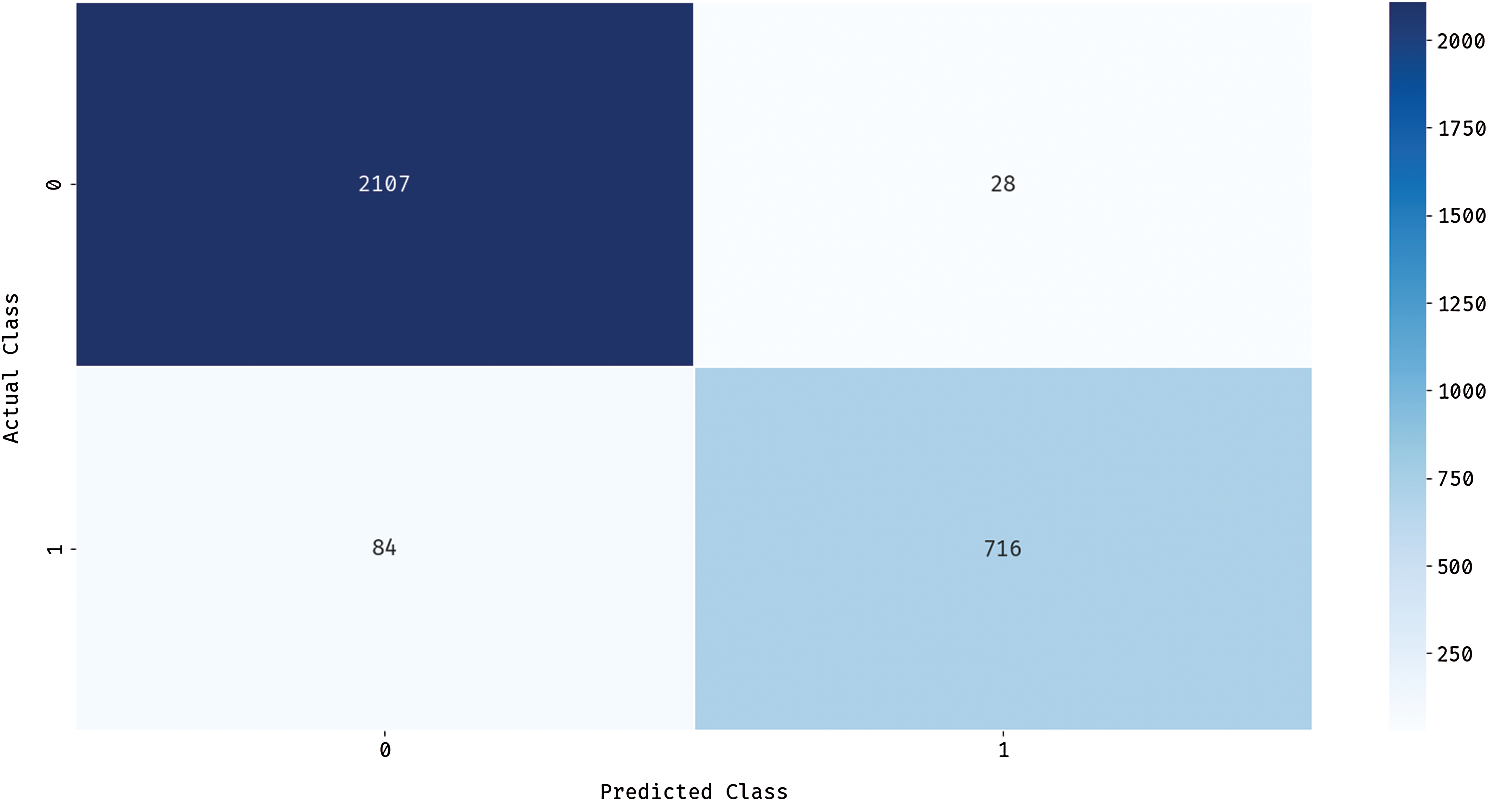
Figure 7: Confusion matrix of OD-DSAE


Figure 8: Result of OD-DSAE model using GDM dataset in terms of precision, recall, and specificity
Fig. 9 depicts the accuracy and F-score analyses of the presented OD-DSAE model on applied GDM dataset. The obtained values signify that the Voted Perceptron model accomplished the least classification performance with an accuracy of 65.1% and F-score of 78.86%. Afterward, the DT model showcased a slightly higher accuracy of 73.82% and F-score of 80.19%. Simultaneously, the Logit Boost model yielded an even better accuracy of 74.08% and F-score of 80.96%. Along with that, the NN model produced a moderate diagnostic outcome with an accuracy of 75.39% and F-score of 81.48%. Moreover, the LR model attained a higher accuracy of 77.21% and F-score of 83.41%. However, these models failed to outperform the presented DSAE and OD-DSAE models. At last, the presented DSAE model obtained an effective accuracy of 89.16% and F-score of 91.41% whereas the OD-DSAE model accomplished an even higher accuracy of 96.18% and F-score of 97.41%.
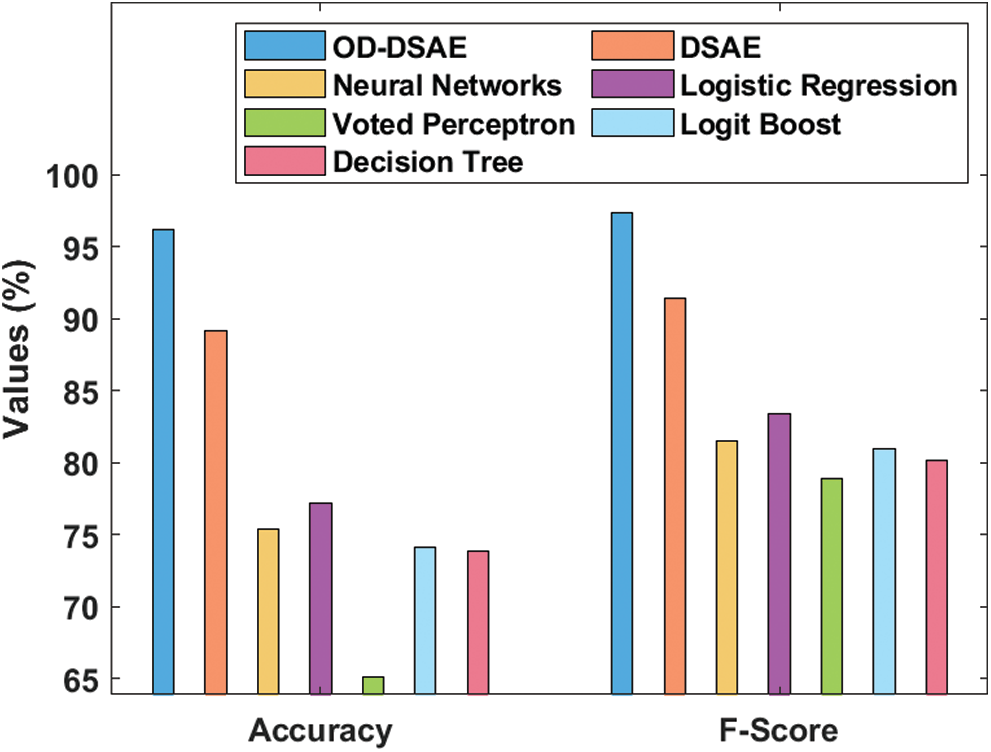
Figure 9: Accuracy and F-score analysis of OD-DSAE model on GDM dataset interms of accuracy and F-score
Tab. 4 and Fig. 10 illustrate the detailed results of comparative analysis of OD-DSAE model upon the applied GDM dataset [21]. The resultant values in the table demonstrate that the OD-DSAE model outperformed all other methods. The existing KNN model produced an inferior classifier outcome over other methods by accomplishing the least accuracy of 67.6%. At the same time, the NB, ELM, and SGD models obtained moderate accuracy values of 74.9%, 75.72%, and 76.6% respectively. Followed by, the MLP model exhibited somewhat better accuracy i.e., 81.9%.

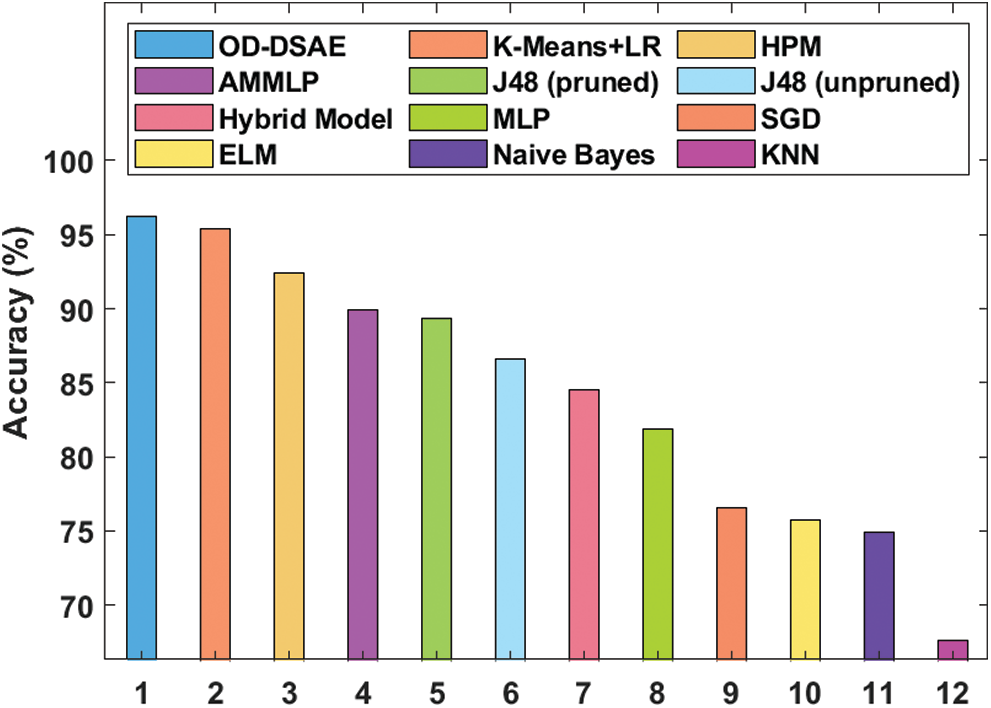
Figure 10: Accuracy analysis of OD-DSAE model on GDM dataset
Eventually, hybrid and J48 (pruned) models produced reasonable and closer accuracy values of 86.6% and 89.93% respectively. Besides, the AMMLP and HPM models attempted to produce reasonable outcomes and achieved accuracies of 89.93% and 92.38%. Concurrently, K-means + LR model presented a near-optimal accuracy value of 95.42%. However, the presented OD-DSAE model showcased its supremacy and achieved the maximum accuracy of 96.18%. After observing the above-discussed tables and figures, it is evident that the presented OD-DSAE model has effective diagnostic outcomes over the compared methods. Therefore, it can be employed as an appropriate tool for diagnosis and classification of GDM.
The current research work presented a new DL-based GDM diagnosis and classification model i.e., OD-DSAE. The goal of the proposed OD-DSAE model is to identify high-risk mothers who need early diagnosis, monitoring, and treatment compared to low-risk mothers. The presented OD-DSAE model has three major processes namely preprocessing, outlier detection, and classification. At first, data preprocessing was performed in three stages namely, format conversion, class labeling, and missing value replacement. The presented model made use of HC-based outlier detection technique to remove the unwanted instances from the dataset. Finally, DSAE was applied as a classification model to determine the appropriate class label of GDM. A detailed simulation analysis was performed on our dataset and the results were investigated under different aspects. The presented OD-DSAE model outperformed other models and achieved a precision of 96.17%, recall of 98.69%, specificity of 89.50%, accuracy of 96.18%, and F-score of 97.41%. These experimental outcomes infer that OD-DSAE model is a promising candidate for diagnostic applications. As a part of future work, the classification performance can be further enhanced using feature selection models.
Funding Statement: The authors received no specific funding for this study.
Conflicts of Interest: The authors declare that they have no conflicts of interest to report regarding the present study.
1. L. Jovanovic, H. R. H. Knopp, H. Kim, T. W. Cefalu, X. D. Zhu et al., “Elevated pregnancy losses at high and low extremes of maternal glucose in early normal and diabetic pregnancy: Evidence for a protective adaptation in diabetes,” Diabetes Care, vol. 28, no. 5, pp. 1113–1117, 2005. [Google Scholar]
2. C. J. Petry, “Gestational diabetes: Risk factors and recent advances in its genetics and treatment,” British Journal of Nutrition, vol. 104, no. 6, pp. 775–787, 2010. [Google Scholar]
3. C. E. Powe, “Early pregnancy biochemical predictors of gestational diabetes mellitus,” Current Diabetes Reports, vol. 17, no. 2, pp. 1–10, 2017. [Google Scholar]
4. P. M. Catalano, E. D. Tyzbir, N. M. Roman, S. B. Amini and E. A. H. Sims, “Longitudinal changes in insulin release and insulin resistance in nonobese pregnant women,” American Journal of Obstetrics and Gynecology, vol. 165, no. 6, pp. 1667–1672, 1991. [Google Scholar]
5. V. Chandola, A. Banerjee and V. Kumar, “Anomaly detection: A survey,” ACM Computing Surveys, vol. 41, no. 3, pp. 1–58, 2009. [Google Scholar]
6. A. A. Aburomman and M. B. I. Reaz, “A novel SVM-kNNPSO ensemble method for intrusion detection system,” Applied Soft Computing, vol. 38, pp. 360–372, 2016. [Google Scholar]
7. Y. Xiong, L. Lin, Y. Chen, S. Salerno, Y. Li et al., “Prediction of gestational diabetes mellitus in the first 19 weeks of pregnancy using machine learning techniques,” The Journal of Maternal-Fetal & Neonatal Medicine, vol. 33, no.1, pp. 1–8, 2020. [Google Scholar]
8. T. Zheng, W. Ye, X. Wang, X. Li, J. Zhang et al., “A simple model to predict risk of gestational diabetes mellitus from 8 to 20 weeks of gestation in Chinese women,” BMC Pregnancy and Childbirth, vol. 19, no. 1, pp. 1–10, 2019. [Google Scholar]
9. J. Shen, J. Chen, Z. Zheng, J. Zheng, Z. Liu et al., “An innovative artificial intelligence–based app for the diagnosis of gestational diabetes mellitus (GDM-AIDevelopment study,” Journal of Medical Internet Research, vol. 22, no. 9, pp. 1–11, 2020. [Google Scholar]
10. I. Gnanadass, “Prediction of gestational diabetes by machine learning algorithms,” IEEE Potentials, vol. 39, no. 6, pp. 32–37, 2020. [Google Scholar]
11. Y. Srivastava, P. Khanna and S. Kumar, “February. estimation of gestational diabetes mellitus using azure ai services,” in 2019 Amity Int. Conf. on Artificial Intelligence, Dubai, IEEE, pp. 323–326, 2019. [Google Scholar]
12. H. Qiu, H. Y. Yu, L. Y. Wang, Q. Yao, S. N. Wu et al., “Electronic health record driven prediction for gestational diabetes mellitus in early pregnancy,” Scientific Reports, vol. 7, no. 1, pp. 1–13, 2017. [Google Scholar]
13. M. W. Moreira, J. J. Rodrigues, N. Kumar, J. A. Muhtadi and V. Korotaev, “Evolutionary radial basis function network for gestational diabetes data analytics,” Journal of Computational Science, vol. 27, pp. 410–417, 2018. [Google Scholar]
14. Y. Ye, Y. Xiong, Q. Zhou, J. Wu, X. Li et al. “Comparison of machine learning methods and conventional logistic regressions for predicting gestational diabetes using routine clinical data: A retrospective cohort study,” Journal of Diabetes Research, vol. 2020, pp. 1–10, 2020. [Google Scholar]
15. F. Du, W. Zhong, W. Wu, D. Peng, T. Xu et al. “Prediction of pregnancy diabetes based on machine learning,” in BIBE 2019; The Third Int. Conf. on Biological Information and Biomedical Engineering, Hangzhou, China, pp. 1–6, 2019. [Google Scholar]
16. E. M. Knorr, R. T. Ng and V. Tucakov, “Distance-based outliers: Algorithms and applications,” International Journal on Very Large Data Bases, vol. 8, no. 3–4, pp. 237–253, 2000. [Google Scholar]
17. R. Pan, T. Yang, J. Cao, K. Lu and Z. Zhang, “Missing data imputation by K nearest neighbours based on grey relational structure and mutual information,” Applied Intelligence, vol. 43, no. 3, pp. 614–632, 2015. [Google Scholar]
18. M. Aghagolzadeh, H. S. Zadeh and B. N. Araabi, “Information theoretic hierarchical clustering,” Entropy, vol. 13, no. 2, pp. 450–465, 2011. [Google Scholar]
19. G. Liu, H. Bao and B. Han, “A stacked autoencoder-based deep neural network for achieving gearbox fault diagnosis,” Mathematical Problems in Engineering, vol. 2018, pp. 1–10, 2018. [Google Scholar]
20. L. Vareka and P. Mautner, “Stacked autoencoders for the P300 component detection,” Frontiers in Neuroscience, vol. 11, p. 302, 2017. [Google Scholar]
21. H. Wu, S. Yang, Z. Huang, J. He and X. Wang, “Type 2 diabetes mellitus prediction model based on data mining,” Informatics in Medicine Unlocked, vol. 10, pp. 100–107, 2018. [Google Scholar]
Result Generation of DSAE
Result Generation of Outlier Detection Model using Hierarchical Clustering

Result Generation of OD-DSAE
 | This work is licensed under a Creative Commons Attribution 4.0 International License, which permits unrestricted use, distribution, and reproduction in any medium, provided the original work is properly cited. |