DOI:10.32604/cmc.2021.018449
| Computers, Materials & Continua DOI:10.32604/cmc.2021.018449 | |
| Article |
Automatic Detection of COVID-19 Using a Stacked Denoising Convolutional Autoencoder
1College of Applied Computer Sciences (CACS), King Saud University, Riyadh, 11543, Saudi Arabia
2Faculty of Sciences and Technology of Sidi Bouzid, University of Kairouan, Kairouan, Tunisia
3National School of Engineers (ENIS), University of Sfax, Tunisia
4Department of Computer Sciences, College of Sciences and Arts in Unaizah, Qassim University, Al-Qassim, Kingdom of Saudi Arabia
*Corresponding Author: Habib Dhahri. Email: hdhahri@ksu.edu.sa
Received: 09 March 2021; Accepted: 15 April 2021
Abstract: The exponential increase in new coronavirus disease 2019 ({COVID-19}) cases and deaths has made COVID-19 the leading cause of death in many countries. Thus, in this study, we propose an efficient technique for the automatic detection of COVID-19 and pneumonia based on X-ray images. A stacked denoising convolutional autoencoder (SDCA) model was proposed to classify X-ray images into three classes: normal, pneumonia, and {COVID-19}. The SDCA model was used to obtain a good representation of the input data and extract the relevant features from noisy images. The proposed model’s architecture mainly composed of eight autoencoders, which were fed to two dense layers and SoftMax classifiers. The proposed model was evaluated with 6356 images from the datasets from different sources. The experiments and evaluation of the proposed model were applied to an 80/20 training/validation split and for five cross-validation data splitting, respectively. The metrics used for the SDCA model were the classification accuracy, precision, sensitivity, and specificity for both schemes. Our results demonstrated the superiority of the proposed model in classifying X-ray images with high accuracy of 96.8%. Therefore, this model can help physicians accelerate COVID-19 diagnosis.
Keywords: Stacked autoencoder; augmentation; multiclassification; {COVID-19}; convolutional neural network
The coronavirus disease 2019 (COVID-19) pandemic has severely disrupted various industries, sectors, and occupations. According to the World Health Organization (WHO), the number of new cases exponentially increases globally. The daily average number of new confirmed cases last February 2021 was recorded to be more than 300000, posing a significant challenge for the healthcare sector. WHO reported that health services had been partially or entirely disrupted in many countries, wherein all the efforts were channeled toward the fight against COVID-19.
Different studies [1,2] have found that chest computed tomography (CCT) outperforms the reverse transcription-polymerase chain reaction (RT-PCR) of nose and throat samples for {COVID-19} diagnosis. CCT demonstrates a higher sensitivity at 98% in diagnosing COVID-19 compared to RT-PCR at 71% [3]. Therefore, CCT may be a primary tool for physicians to diagnose and assess suspected patients with COVID-19. CCT scan can be especially useful when RT-PCR results are delayed by many days or the number of infected persons is increasing rapidly. Also, with its low cost and speed, chest X-rays (CXR) are identified as an effective procedure for diagnosing suspected COVID-19 patients. However, X-ray imaging tests pose critical challenges to radiologists and specialists because the water-containing white spots in the lung images can often lead to the misdiagnosis of COVID-19 for pneumonia or other pulmonary diseases.
Due to the continuous increase in the number of confirmed COVID-19 cases, researchers are working to apply artificial intelligence (AI), machine learning (ML), and deep learning (DL) techniques to fight the pandemic. In addition, numerous studies have been conducted on the diagnosis of COVID-19 using CXR and CCT [4–11].
Therefore, this study proposes the use of a deep learning model based on a stacked denoising convolutional autoencoder (SDCA) to detect COVID-19 from X-ray images automatically. In this model, the stacked autoencoder (AE) reconstructs the original inputs from the noisy images. The SDCA is then divided into three steps. First, the SDCA extracts the relevant features to represent the X-ray image data. Second, the feature matrix is used as an input of the fully connected layers to minimize the loss function. Third, the system is evaluated based on the test data. The dataset used for the evaluation was collected from different sources, and a preprocessed operation was then applied to it.
The rest of this paper is organized as follows. Section 2 presents a review of recent works related to algorithms applied for COVID-19 detection. Section 3 describes the proposed model and the dataset collection. Section 4 presents the experimental results and discussion. Finally, Section 5 provides conclusion for this paper.
The section reviews the contributions for diagnoses of COVID-19 using radiological images and CCT scans. On the other hand, different deep learning networks have been used to diagnose COVID-19 using various public databases. Popular deep learning models such as a current neural network (RNN), convolutional neural network (CNN), deep belief network, autoencoder (AE), generative adversarial network, and combined CNN-RNN have been widely used to diagnose COVID-19 automatically.
Diagnosing COVID-19 via a deep learning model (Fig. 1) is based on the classification and segmentation systems. The classification system aims to identify patients with COVID-19 by using different processes, including feature extraction, feature selection, and preprocessing stages. On the other hand, the segmentation system has been mainly applied to segment the CCT scans and CXR images of the infected patients. In addition, it can be used to divide images into significant zones in medicine. The AI techniques, specifically deep learning techniques, can handle this process more effectively than manual segmentation, which can be time-consuming. Among the most crucial segmentation methods, U-Net [12] and fuzzy clustering methods [13,14] have produced empirical results with high performance. The input of deep learning models is patients’ images and their corresponding segments that have been manually labeled by the doctors. Thus, training is performed to segment the input images accurately.
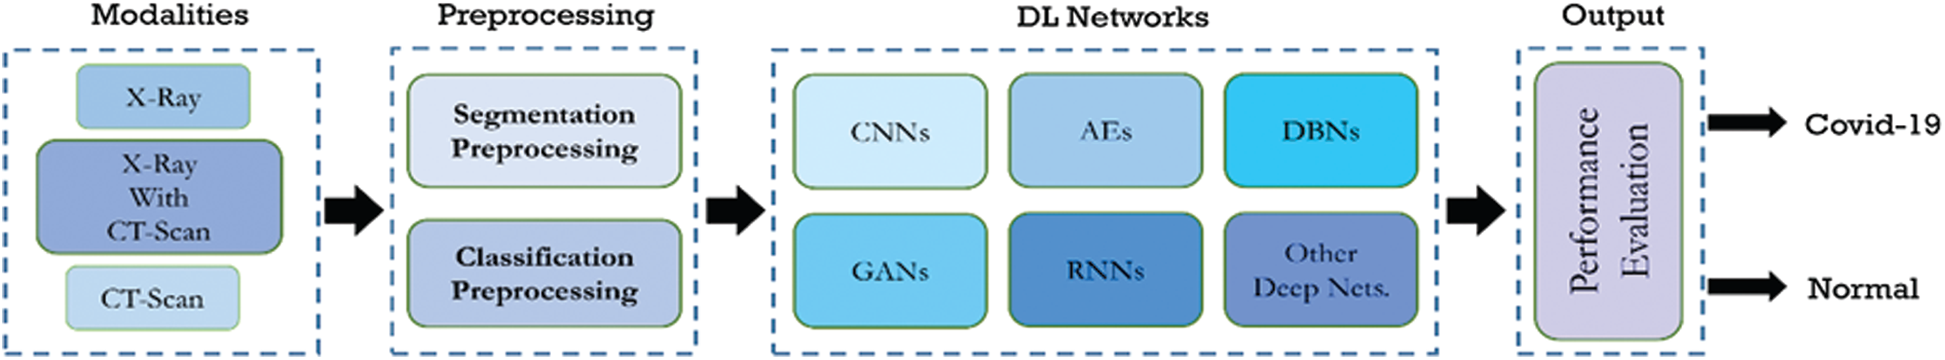
Figure 1: Deep learning models for COVID-19 diagnosis [15].
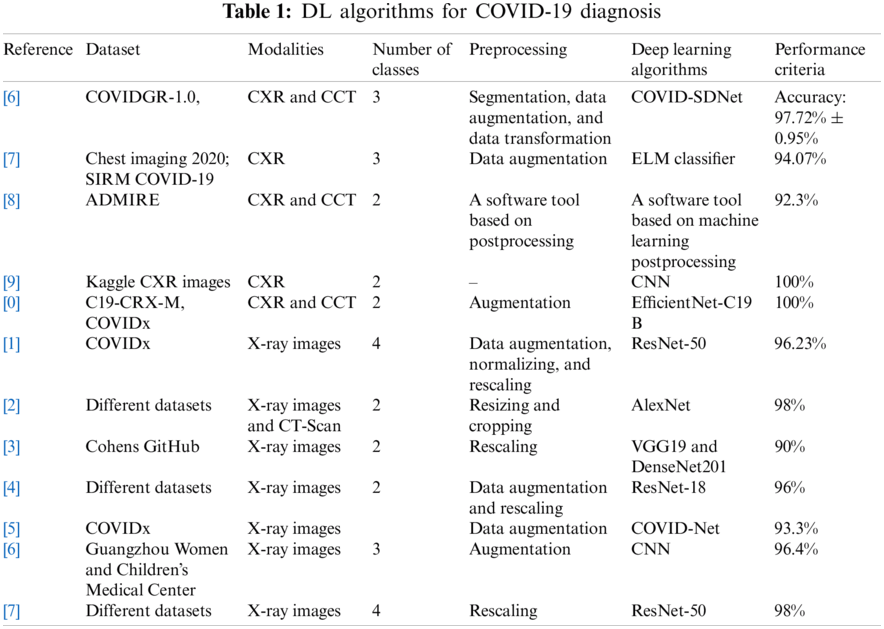
Many DL algorithms with varying modalities, datasets, preprocessing algorithms, machine learning techniques, and performance criteria have been explored for COVID-19 diagnosis (Tab. 1).
In one study, the authors proposed the COVID smart data-based network (COVID-SDNet) algorithm for diagnosing COVID-19 using the CXR image COVIDGR-1.0 dataset. Different preprocessing techniques, including segmentation, data augmentation, and data transformation, were used to eliminate irrelevant information from the original images [16]. In another study, ResNet-50 was used to extract features from a dataset collected from different publicly available repositories. A deep learning-based extreme-learning machine (ELM) classifier was employed to distinguish the patient with COVID-19 from the uninfected patients [17]. Meanwhile, Martini et al. [18] compared the interpretation of the conventional radiography CXR with machine learning-enhanced CXR-mlCXR for COVID-19 diagnosis. They found that the sensitivity for COVID-19/pneumonia diagnosis was improved based on the mlCXR image interpretation. While one study applied the convolutional neural network model for COVID-19 diagnosis based on the CXR images collected from the Kaggle dataset [19], another study demonstrated that deep learning models failed to classify the CXR images taken from smartphones [20]. Therefore, it is essential to check the sources of images before inputting the images into deep learning models.
DL algorithms have been applied to COVID-19 diagnosis with varying degrees of success. For example, one study proposed the COVID-ResNet model on the COVIDx dataset and achieved a 96.23% detection accuracy in all the classes [21]. Another team diagnosed COVID-19 based on the AlexNet model. They collected the images from various sources and were able to achieve a 98% detection accuracy on two main classes [22]. Meanwhile, a team applied VGG-19 and DenseNet201 models to identify health status against the COVID-19. As a result, they achieved a 90% accuracy for the binary classification of X-ray images [23]. Moreover, a team developed a new deep learning model for anomaly detection. First, they collected chest X-ray images from GitHub and other images from the ChestX-ray14 dataset. With binary classification, their model can detect 96% of the COVID-19 cases [24]. Lastly, a group of researchers developed a new deep CNN called COVID-Net to detect COVID-19 disease from CXR images and the COVIDx dataset. In addition, their model could predict COVID cases with critical factors [25].
In this work, the proposed SDCA model with multiple layers was used to label each image as either COVID-19, pneumonia, or normal. We propose a customized loss function to improve the reconstruction of the original images. SDCA, which is a stochastic extension of the classic autoencoder (AE) [28], is used to reduce the dimensions and learn latent features; it can also be used as a generative model to generate fake samples.
SDCA tries to learn the identity function where the output is reproduced from the input. Generally, the AE is built by two parts of encoders, which project input data onto a space with low dimension.
Let x
where
where
Based on this bottleneck, the AE tries to rebuild the original image using the decoder function:
where
The training of the autoencoder is to compute the distance between the compressed and decompressed representation of the data. Different metrics can be used to compute the loss between the input and output cross-entropy or mean square error functions of the SDCA. The loss function applied to approximate the input data is defined as the sum of the loss of each layer, as defined in Eq. (4).
where N is the number of layers in the SDCA.
The sparsity regularized reconstruction loss function, L1, is defined as follows to prevent the overfitting problem:
where β represents the sparsity term and λ is the weight decay term coefficient.
The relative entropy Kullback–Leibler divergence [30] is a measure of how the target activation,
According to Erhan et al. [31], we remove the sparsity regularization from the expression of the loss when the pre-trained weights are used to regulate the network. Consequently, the entire loss function of
In this section, the hyperparameter tuning of the proposed model will be introduced. The proposed model consists of three main parts. Technically, CNN [33] algorithm is considered as one of the best and most robust algorithms that can extract the relevant features from the input data at different levels without any human supervision. Due to its architectural structure and layers, CNN is reliable for image processing tasks. CNN structure consists of a combination of the convolutional layers, non-linear processing units, and subsampling layers. In particular, this stage is focused on obtaining deep features with discriminative representation capability. The convolutional matrix C can be computed based on a filter matrix B and image matrix A as follows:
where matrix A represents the input matrix,
The proposed model is designed based on the stack of layers. The architecture of the encoding stage mainly includes a set of kernels, batch normalization, 2D Max-pooling, and up sampling operation. In addition, the size of the filters varies between the layers. The SDCA is composed of 16 convolutional layers, 14 patch normalization layers, 2 Max-pooling layers, and 1 fully connected layer composed of 2 dense layers and 1 SoftMax layer. The encoder architecture comprises 2 embedded bloc 1, followed by 2 embedded bloc 2 (Figs. 2 and 3, respectively). Bloc 1 is designed as a stack of convolution, batch normalization, and Max-pooling, whereas Bloc 2 is designed as bloc1 without the Max-pooling layer.
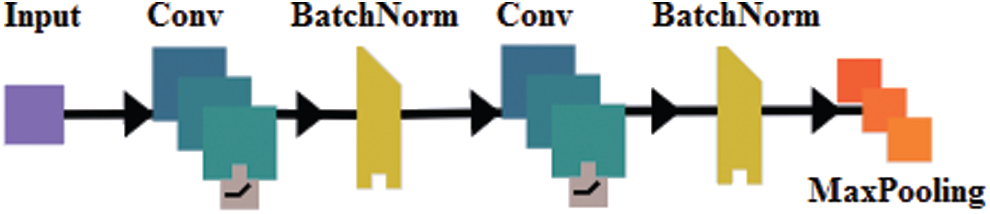
Figure 2: The embedded bloc1
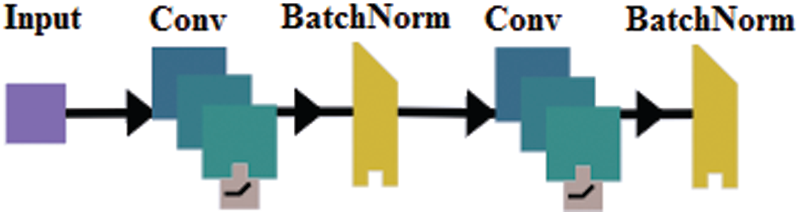
Figure 3: The embedded bloc 2
Indeed, different architectures have been proposed during the expansion of convolutional neural networks. In many cases, adding more layers often yield better data compression [34]. The detailed descriptions of operations used are described in the following subsections (Fig. 4).
Rifai et al. [35] demonstrated that adding some noise to an image input led to a significant improvement in generalizing the input data. In addition, this technique can be considered a kind of augmentation of the dataset. In this experiment, all the images in the database were resized to 32 × 32 × 1 to obtain a consistent dimension for all the input images. Another essential preprocess stage is intensity normalization, which converts the intensity values of all images from [0, 255] to the standard normal distribution to the intensity range of [0, 1].
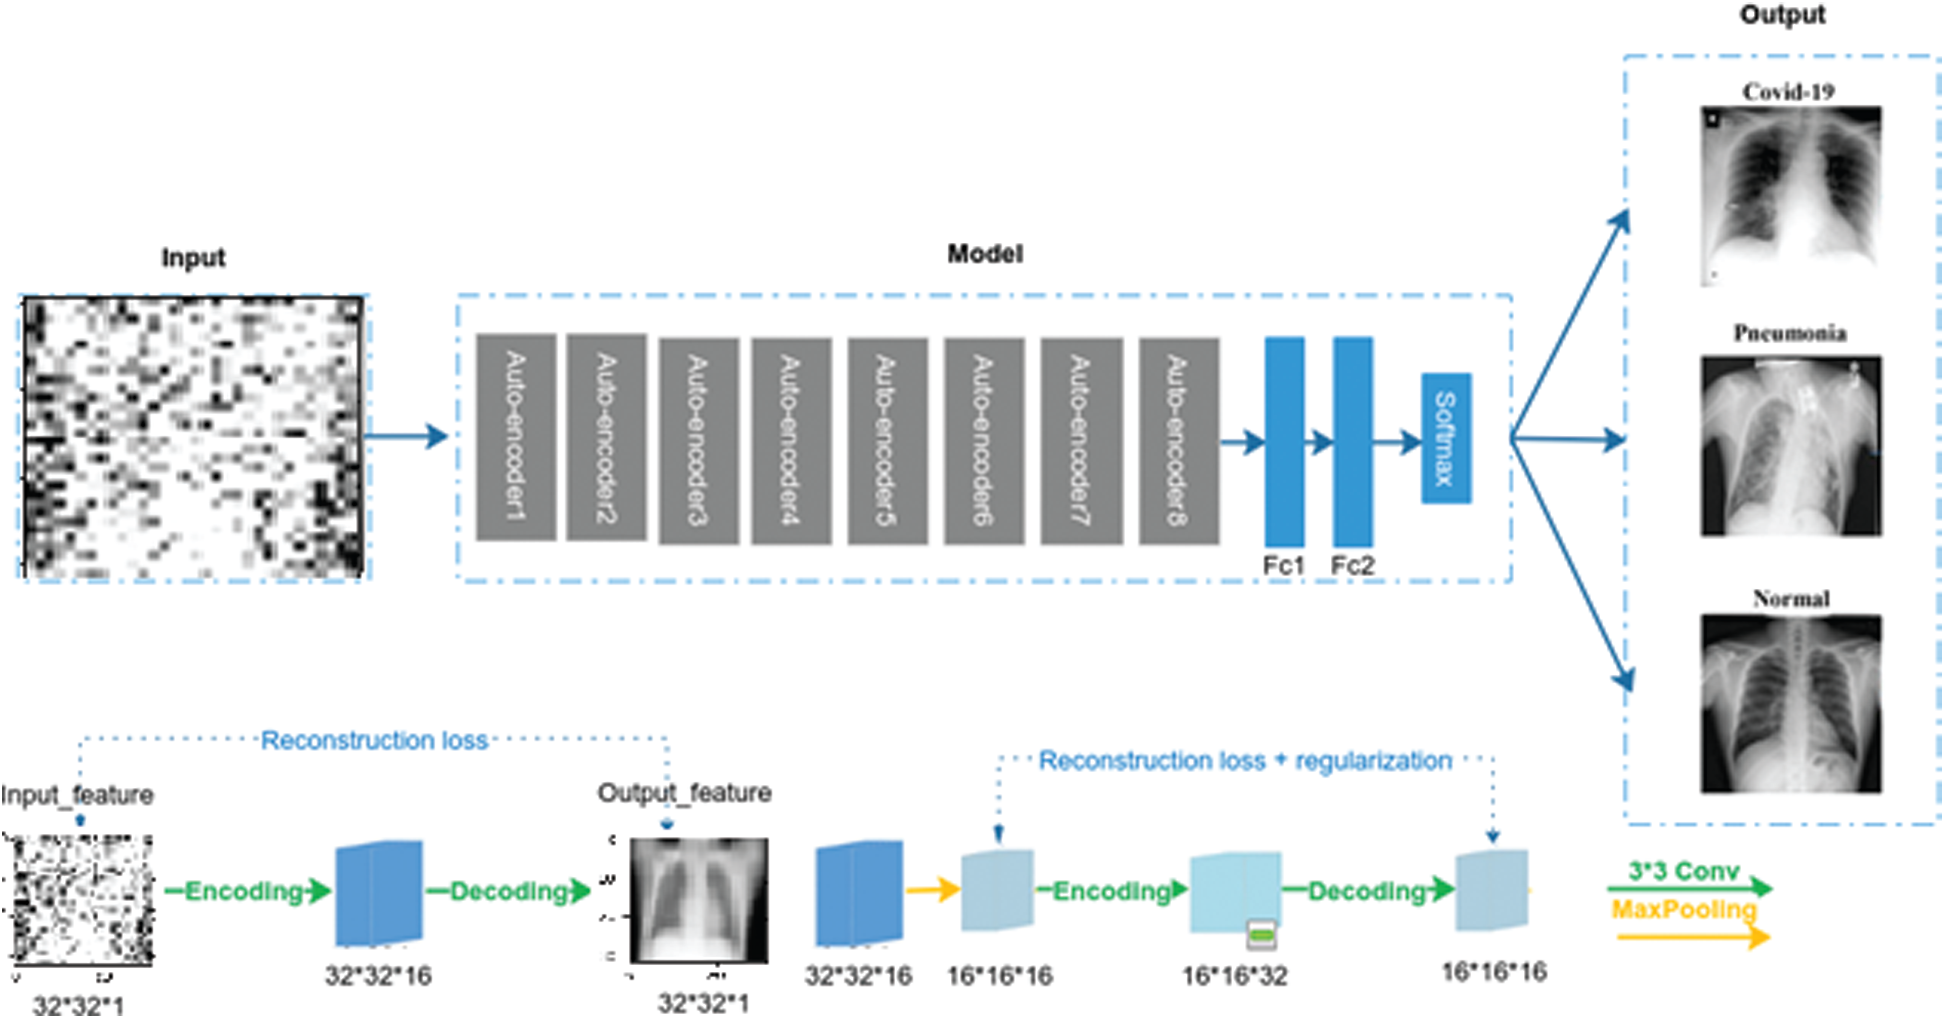
Figure 4: The proposed architecture of SDCA
Imbalanced data can have a critical impact on the training process and detection capability of the deep learning network; therefore, it is considered a limitation for classification. Besides, oversampling technique (SMOTE) [36], random under-sampling, random oversampling, synthetic oversampling: SMOTE, the Adaptive Synthetic Sampling Method (ADASYN) [37] has been identified as one of the techniques that can solve the problem of unbalanced data. For example, new training examples from existing training data are added to the classes with fewer samples using the augmentation procedure to reduce the problem of imbalanced data. Usually, this method is used only on the training dataset, and not on the validation and test datasets. This technique is based on several transforms, such as shifts, flips, zooms, and rotation, that can be applied to an image. In this study, the following operations have been applied to the input images: random rotation of ±10%, zoom range of ±10%, horizontal flipping of ±10%, and, finally, the vertical flipping shift of 10%.
In this study, several metrics, accuracy, precision, recall, and F1 are used to evaluate the proposed model. The metrics are calculated, respectively, as:
where TP, FN, FP, and TN represent the number of true positives, false negatives, false positives, and true negatives, respectively.
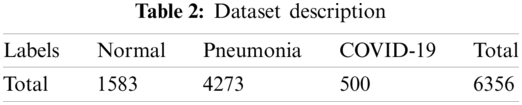
The SDCA was applied to a dataset containing 6356 images to verify the effectiveness of the proposed model. The dataset was collected from diverse sources of images of normal, pneumonia, and COVID-19 cases. First, 5856 X-ray images were collected from the Kaggle repository [38], including 4273 pneumonia and 1583 normal. Then, 125 images were collected from Ozturk et al. [39] and augmented to obtain 500 images. The number of X-ray images of each class was calculated (Tab. 2).
In this study, Python was used for the experiment. A Windows-based computer system with an Intel (R) Core (TM) i7-7700 HQ 2.8 GHz processor and 16 GB RAM was used. The proposed architecture was implemented using the Keras package with TensorFlow on Nvidia GeForce GtX 1050 Ti GPU with 4 GB RAM. The SDCA was evaluated using an 80% training and 20% test set, combined with a fivefold cross-validation method. The accuracy, precision, recall, F1-score, and confusion matrix were computed for each experiment. For all the experiments the average of error is taken from 30 executed runs for all the used methods. All the parameters are chosen based on literature used value.
In the first experiment, 1589 images of the dataset were used for the test stage. As mentioned above, the appropriate dataset of noisy X-ray images was developed by applying the Gaussian noise. The initial value of the Gaussian is selected as
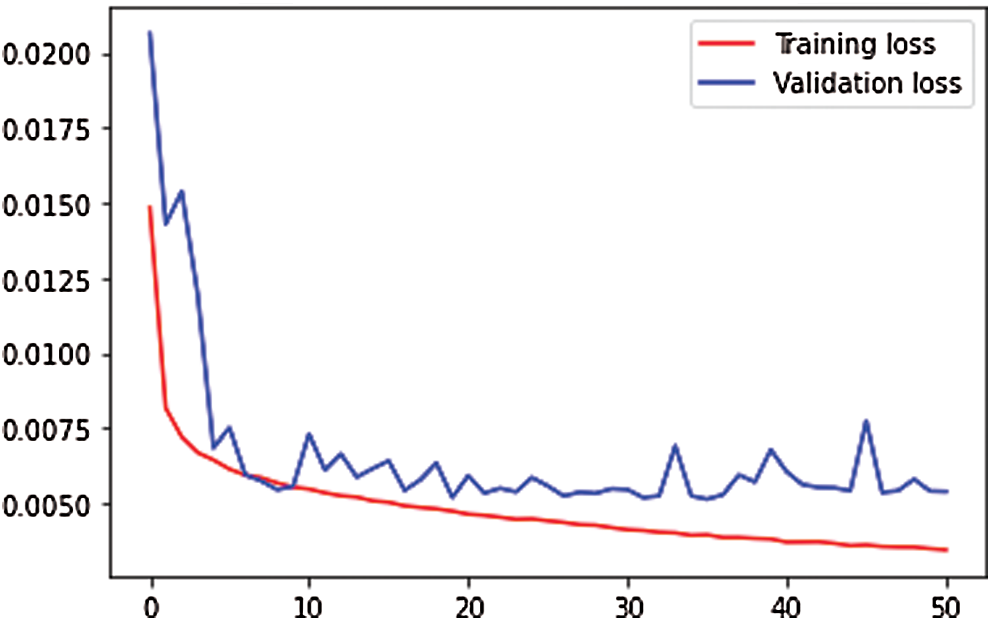
Figure 5: Training and validation loss of features extraction map
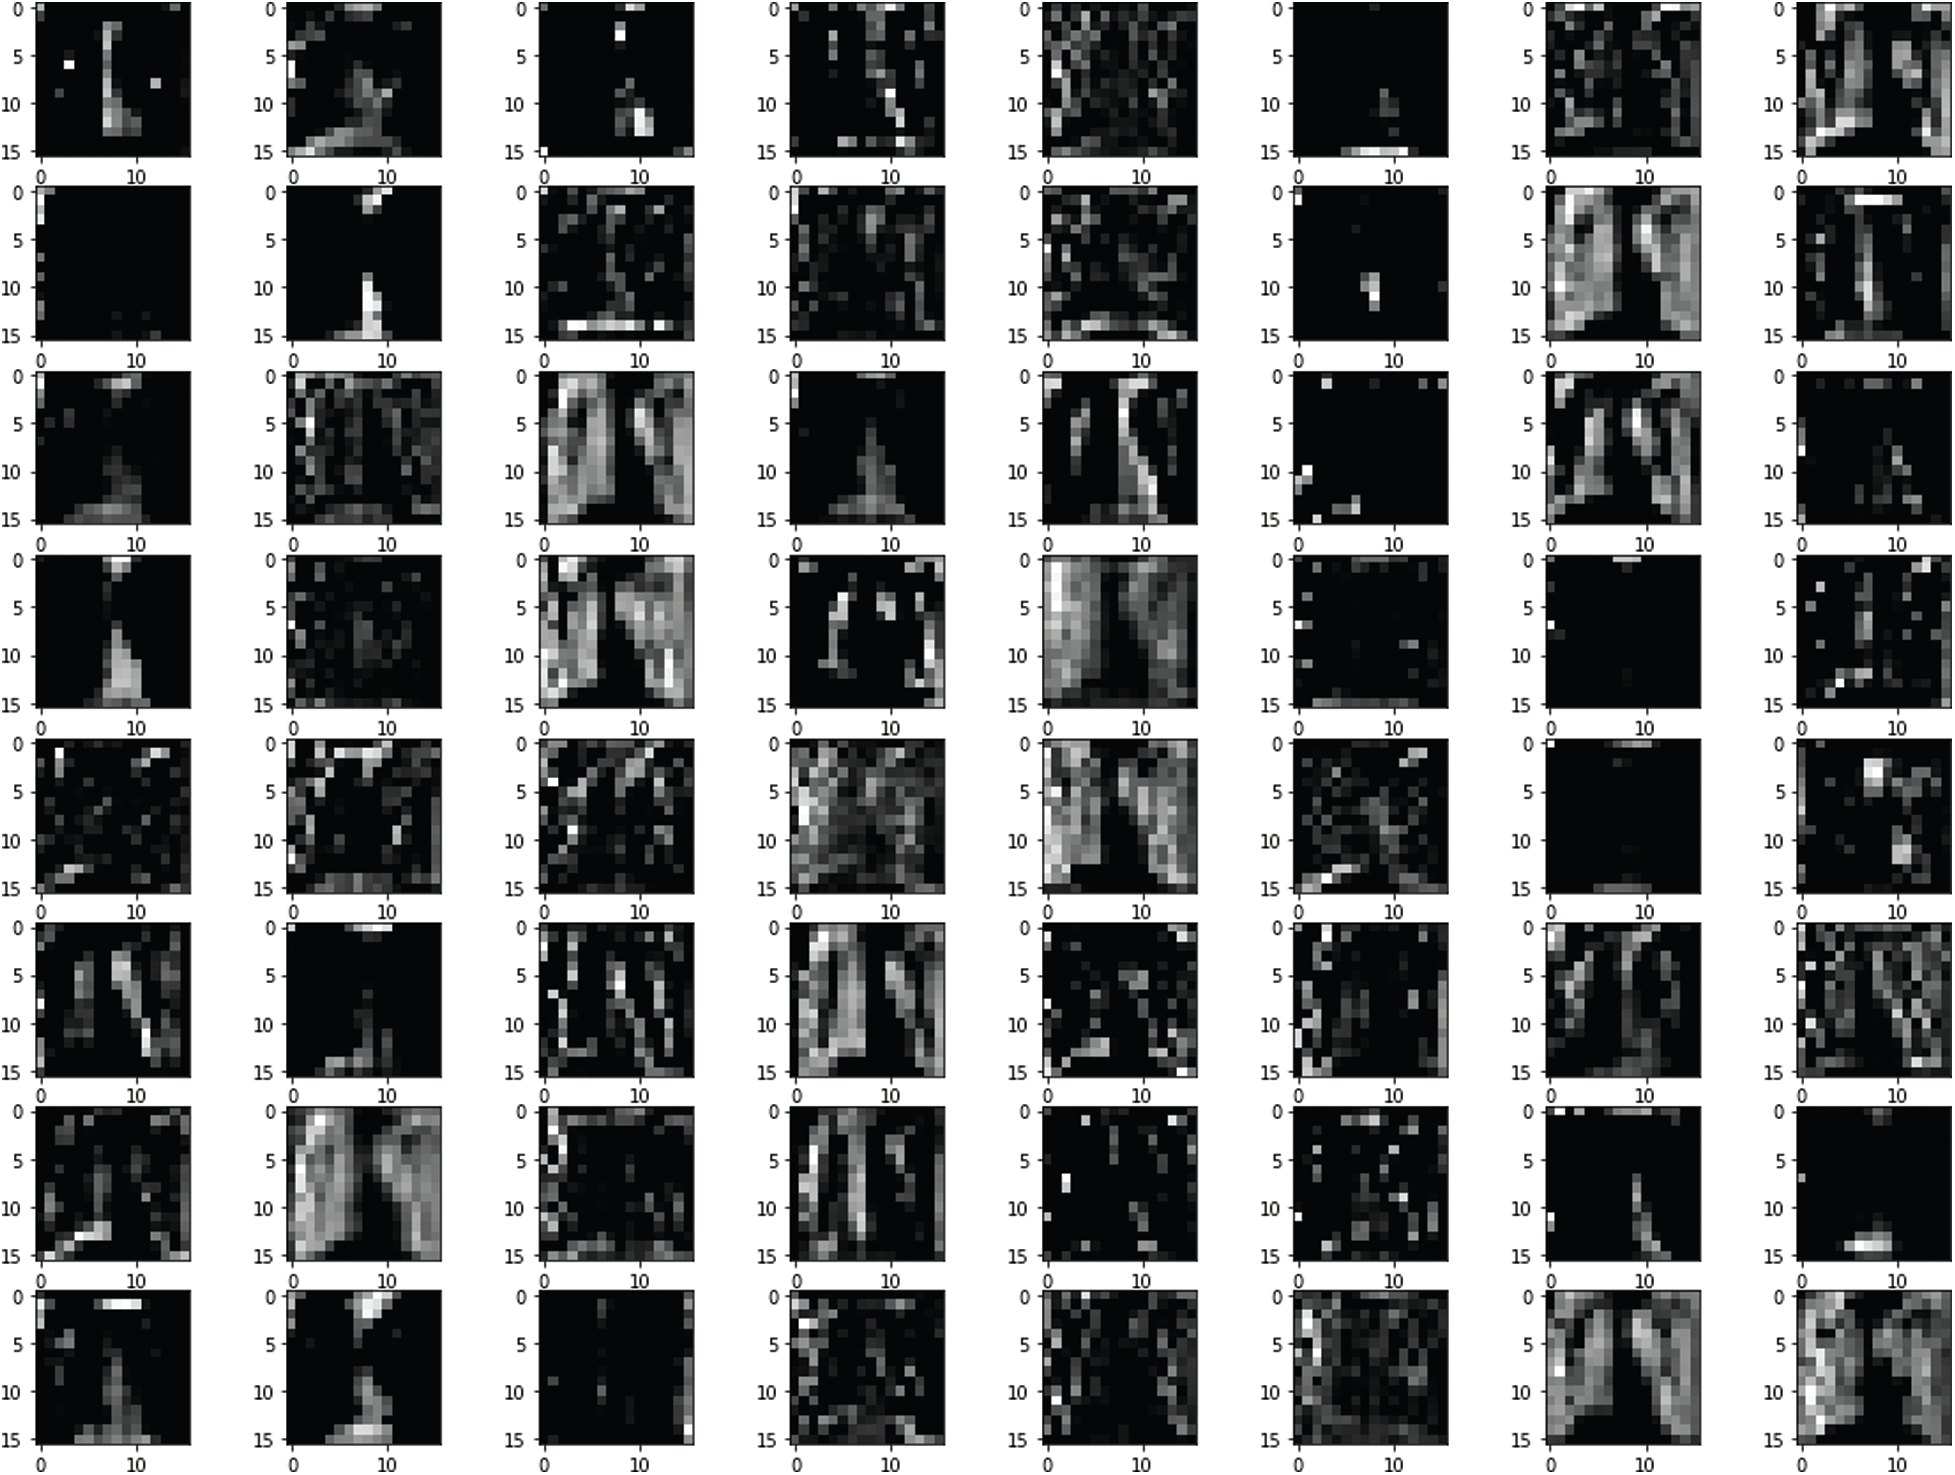
Figure 6: Features map at block 6
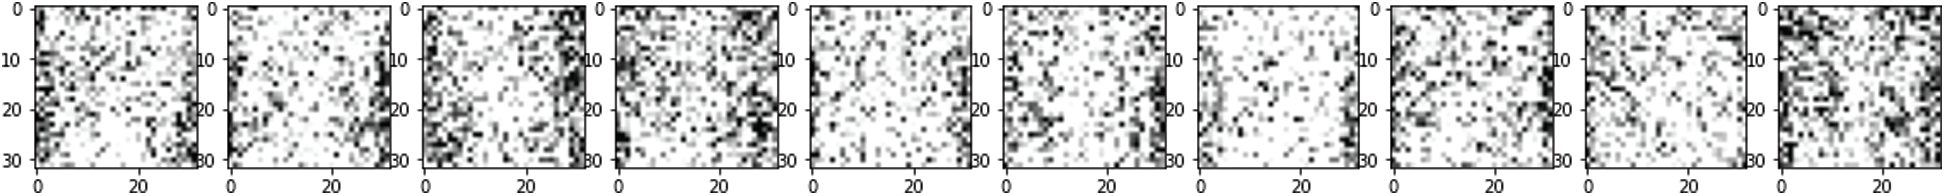
Figure 7: Test images with noise
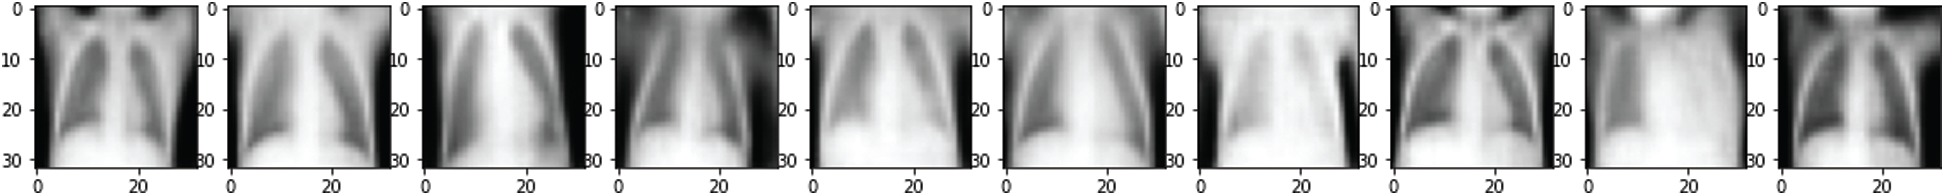
Figure 8: Reconstruction of the noisy test images
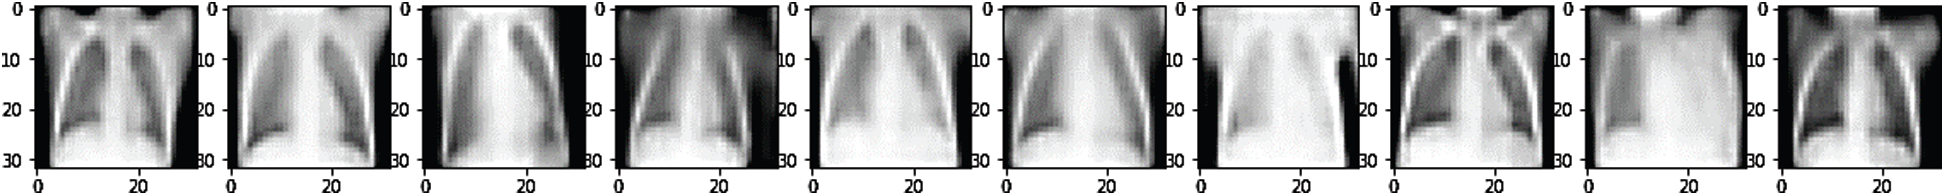
Figure 9: Original image without noise
Figs. 7 and 8 depict the noised image used as input of the SDCA model and restored images after the training, respectively. Fig. 9 represents the original image without noise. The SDCA model succeeded in removing the noises with a loss of 0.003, but some contract improvements are needed for more visibility.
Then, the performance metrics of the proposed model between two splitting ratios were analyzed. The results of the metric performance by data splitting (80%, 20%) were reported (Tab.3).
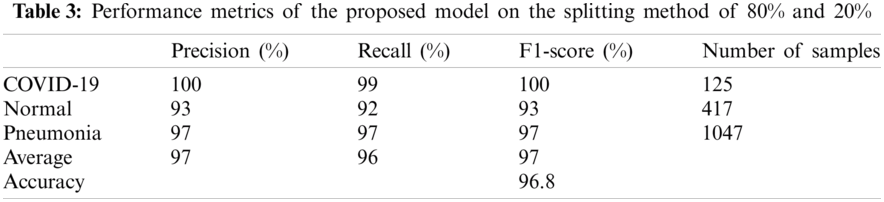
Also, the precision, recall, and F1-score values for the three cases were visualized (Fig.10). All the used metrics with the number of samples for each test class were summarized (Tab. 3). For the COVID-19 cases, the proposed SDCA deep learning model has reportedly achieved 100% precision, 99% recall, and 100% F1-score. For the pneumonia cases, the model accomplished 97% for all the metrics. For the normal cases, the model achieved slightly lower scores than the other cases, i.e., 93% precision, 92% recall, and 93% F1-score. The average accuracy that the proposed model achieved was 96.8%. The test results of the confusion matrix (Fig.11) demonstrated that the proposed model accurately detected COVID-19 and pneumonia images. Among the 1589 images of the test dataset, only 62 images were misclassified. Among the 125 COVID-19 images, only 1 image was misclassified. Lastly, the validation accuracy and loss (Fig.12) were displayed.
The metric performance results of the proposed SDCA by using fivefold cross-validation were shown in Tab. 4.
From Fig. 13, notably, the proposed model successfully detected COVID-19. In Fold 1, only 5 images were misclassified among the 90 COVID-19 samples. In addition, only 2 images among the 79 images were misclassified. In Fold 3, all the images were correctly classified. Meanwhile, only three and two images were misclassified in Folds 4 and 5, respectively. The average accuracy was 96.80% and 95.75% in the 80%, 20% data splitting and fivefold cross-validation, respectively. The accuracy of the proposed SDCA in this study was compared to that of other models (Tab. 5). The precision, F1-score, and recall scores for the five folds are shown in Fig. 14.
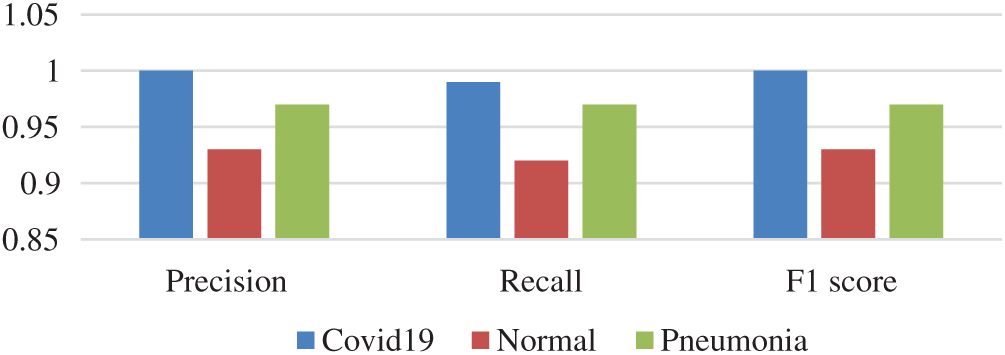
Figure 10: Results of SDCA on train test split
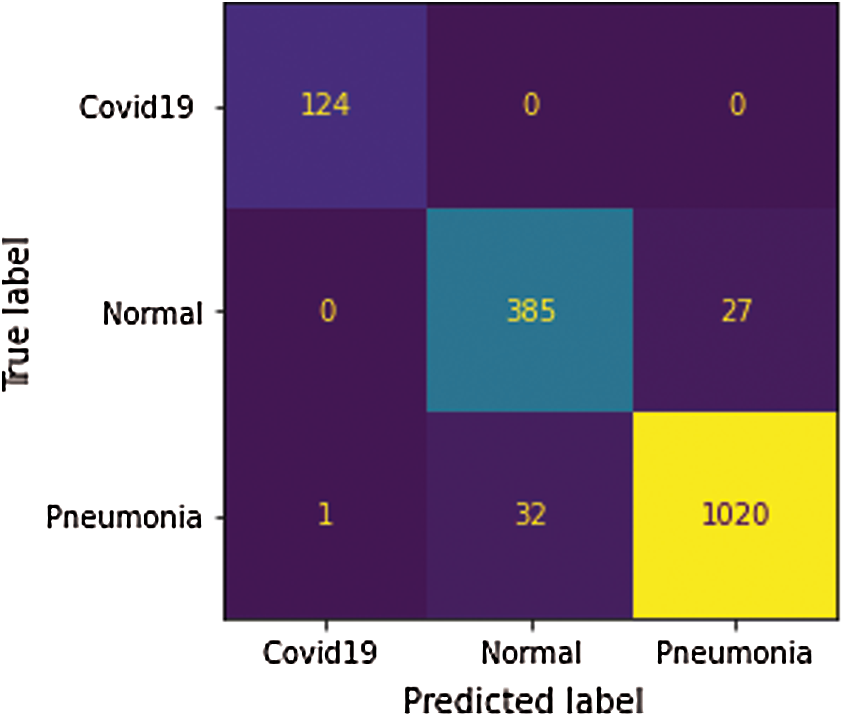
Figure 11: Confusion matrix by 80%, 20% data splitting
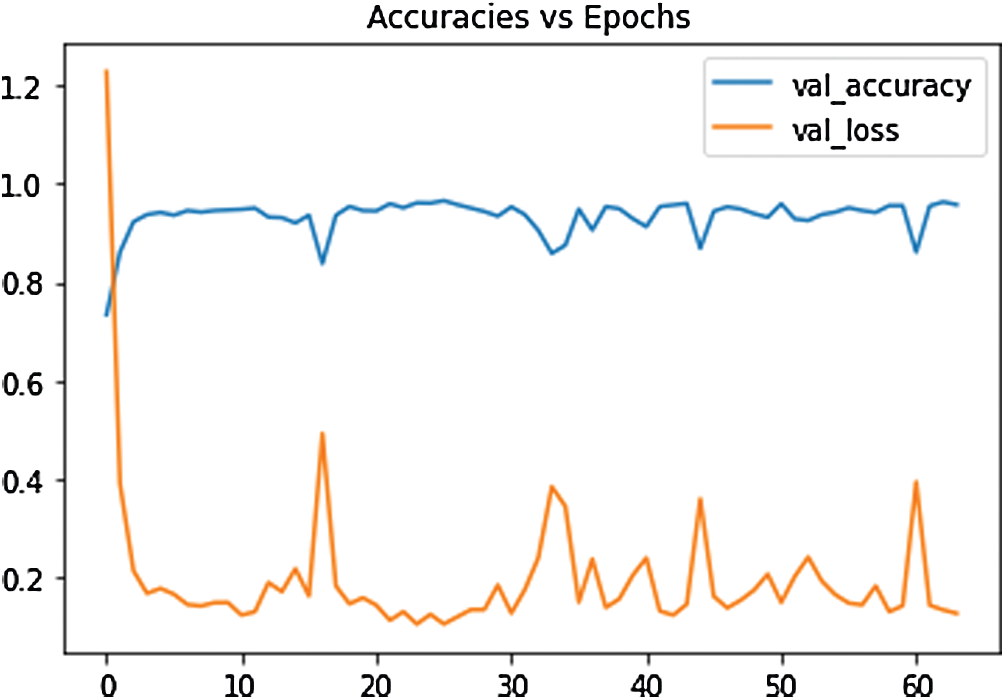
Figure 12: The loss function of the SDCA model
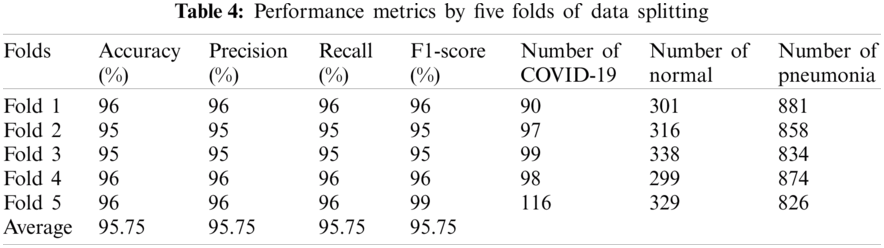
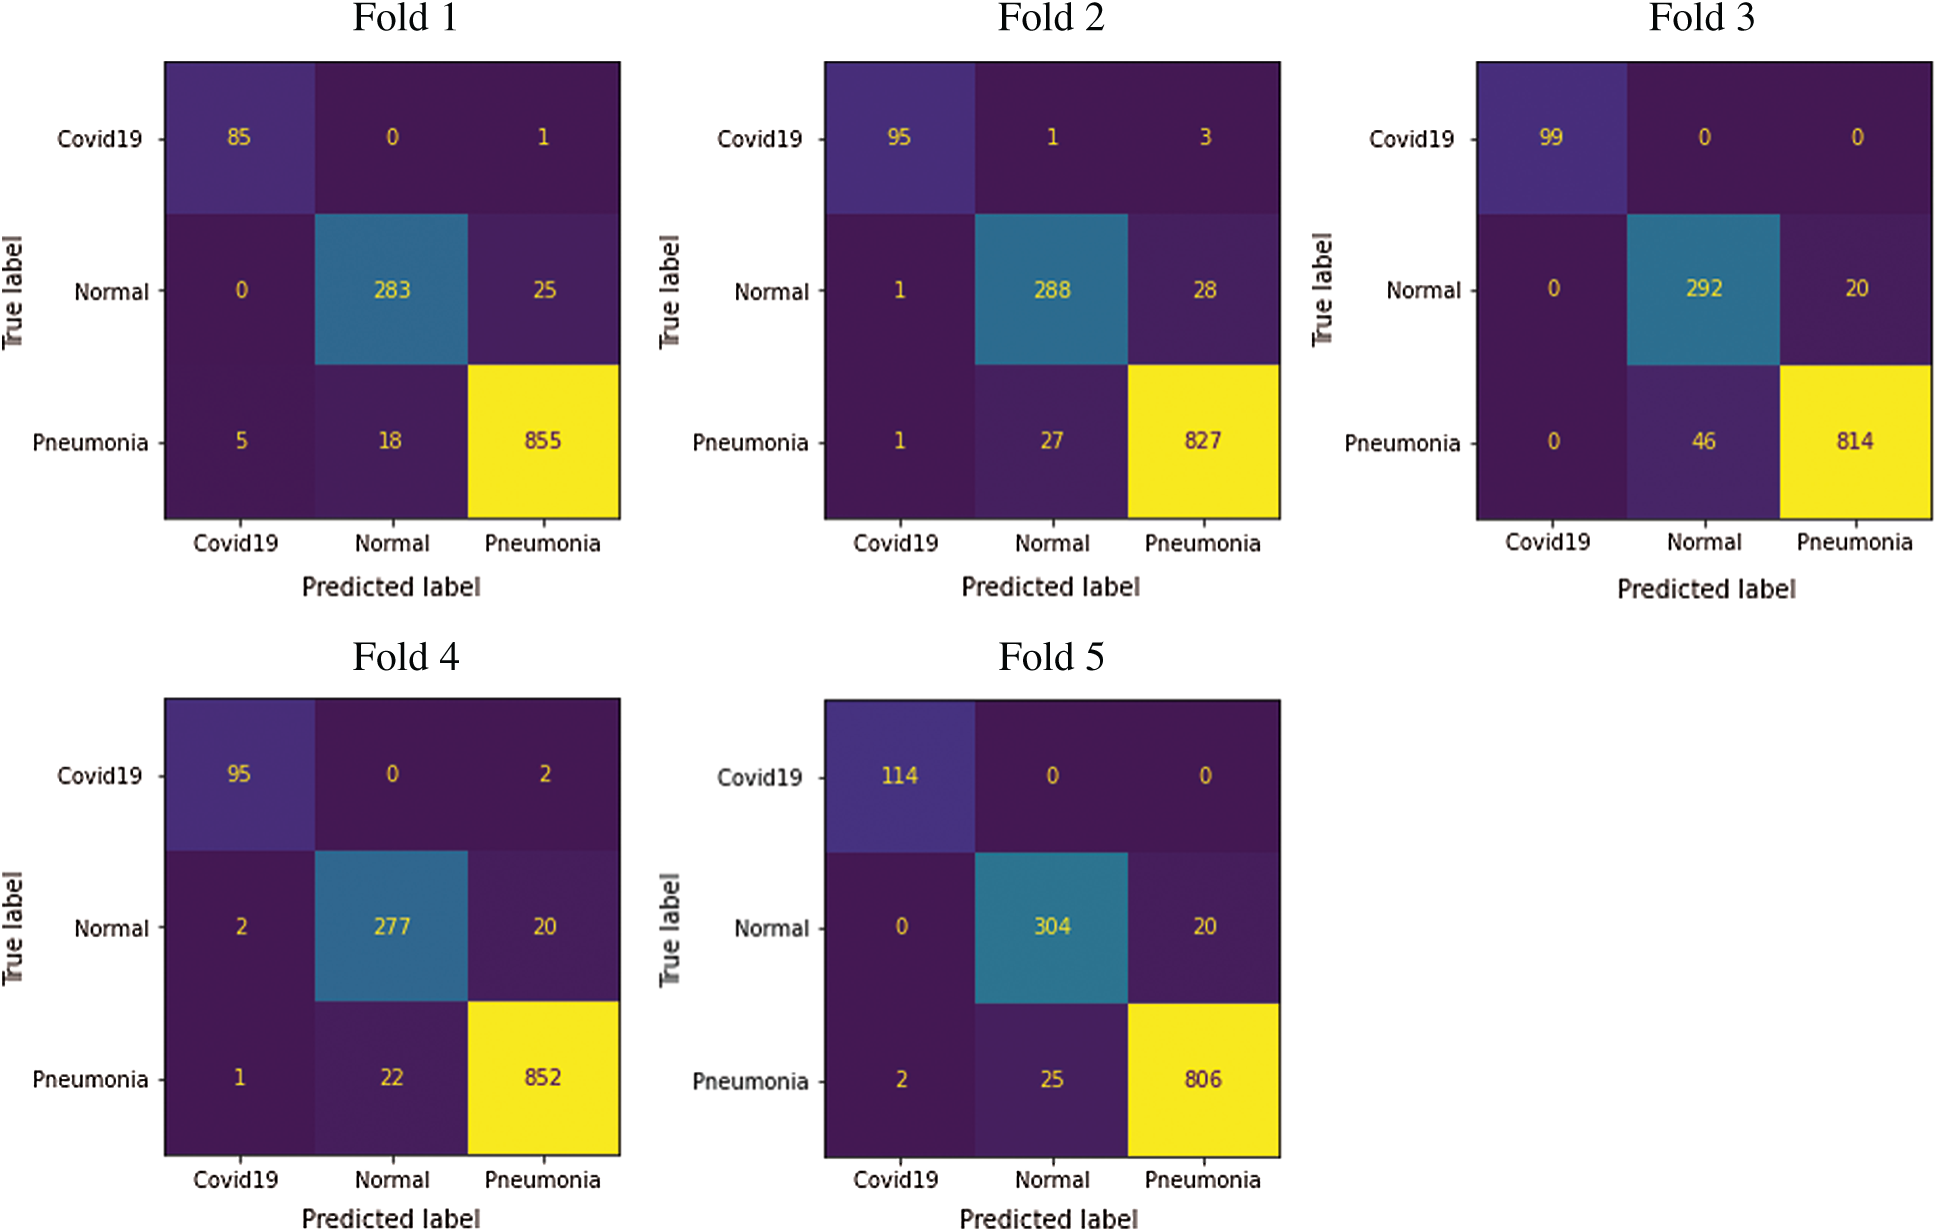
Figure 13: Five folds confusion matrix for multiclassification tasks
This work was evaluated based on a public dataset of X-ray images to detect diseases. Based on deep learning, the proposed model succeeded in differentiating the CXR radiographs of COVID-19, pneumonia, and healthy patients with high accuracy, sensitivity, and specificity. The SDCA model achieved the extraction of the relevant features based on noisy images and the augmentation approach. The model’s validation was based on 6356 X-ray images divided into training and test data splitting and fivefold cross-validations, respectively. Although the data were imbalanced, the results derived from the proposed model were impressive. The experiment results on CXR images demonstrated that the features extracted by stacked denoising autoencoder architecture and trained by the feed-forward neural network classifier achieved an accuracy of 96.8%. Therefore, physicians can use this framework to accelerate the diagnosis of COVID-19 and improve their decisions regarding misclassified X-ray images by radiologists.

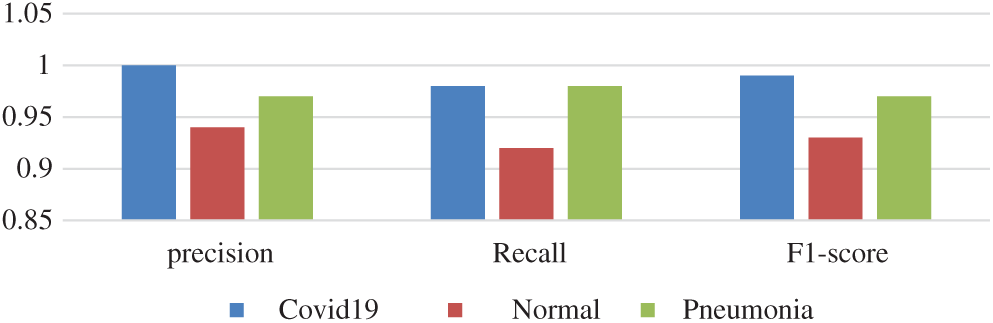
Figure 14: Fold 5 results
Clinical diagnosis based on computed tomography images faces many challenges as the number of people with COVID-19 pneumonia is huge, and in contrast there is a shortage of highly experienced radiologists to continuously distinguish between CT images of pneumonia and images of the emerging COVID-19 virus.
The large amount of CT scans is also one of the factors affecting the quality of CT images during the data storage and transmission process.
As it is mentioned that diagnosis of COVID-19 is a challenging task. In this paper, the SDCA has been applied to X-ray images of two types of pulmonary diseases, including COVID-19. It is found that the results COVID-19 is very much similar to the results of pneumonia disease. For this reason, it is better to have an experienced radiologist to continuously distinguish X-ray images of pneumonia to COVID-19 pneumonia.
Although the high performance of the proposed model for the COVID-19 pneumonia diagnosis, there are nonetheless certain limitation and these issues should be additionally considered in future works.
First of all, the experimentations of this works just used only the chest X-ray images for the diagnosis of the COVID-19 cases, however clinical data and laboratory tests are considered of the pillars a correct diagnosis. Second, the strategy for getting a X-ray images additionally influence on its quality.
Funding Statement: The authors extend their appreciation to the Deanship of Scientific Research at King Saud University for funding this work through research Group No. RG-1441-379 and for their technical support.
Conflict of Interest: The authors declare that they have no conflicts of interest to report regarding this present study.
1. Y. Fang, H. Zhang, J. Xie, M. Lin, L. Ying et al., “Sensitivity of chest ct for covid-19: Comparison to RT-PCR,” Radiology, vol. 296, no. 2, pp. 200432, 2020. [Google Scholar]
2. Z. Falaschi, P. S. C. Danna, R. Arioli, A. Pasché, D. Zagaria et al., “Chest CT accuracy in diagnosing covid-19 during the peak of the italian epidemic: A retrospective correlation with RT-PCR testing and analysis of discordant cases,” European Journal of Radiology, vol. 130, no. 4, pp. 109192, 2020. [Google Scholar]
3. H. Mahmoud, M. S. Taha, A. Askoura, M. Aleem, A. Omran et al., “Can chest ct improve sensitivity of covid-19 diagnosis in comparison to pcr? A meta-analysis,” The Egyptian Journal of Otolaryngology, vol. 36, no. 1, pp. 1–7, 2020. [Google Scholar]
4. M. Rahimzadeh and A. Attar, “A modified deep convolutional neural network for detecting COVID-19 and pneumonia from chest X-ray images based on the concatenation of Xception and ResNet50V2,” Informatics in Medicine Unlocked, vol. 19, pp. 100360, 2020. [Google Scholar]
5. A. M. Alqudah, S. Qazan, H. Alquran, I. A. Qasmieh and A. Alqudah, “COVID-2019 detection using X-ray images and artificial intelligence hybrid systems,” in Biomedical Signal and Image Analysis and Machine Learning Lab, Boca Raton, FL, USA, 2019. [Google Scholar]
6. I. D. Apostolopoulos and T. A. Mpesiana, “Covid-19: Automatic detection from x-ray images utilizing transfer learning with convolutional neural networks,” Physical and Engineering Sciences in Medicine, vol. 43, no. 2, pp. 635–640, 2020. [Google Scholar]
7. A. I. Khan, J. L. Shah and M. M. Bhat, “CoroNet: A deep neural network for detection and diagnosis of COVID-19 from chest X-ray images,” Computer Methods and Programs in Biomedicine, vol. 196, no. 18, pp. 105581, 2020. [Google Scholar]
8. P. K. Sethy, S. K. Behera, P. K. Ratha and P. Biswas, “Detection of coronavirus disease (COVID-19) based on deep features and support vector machine,” International Journal of Mathematical, Engineering and Management Science, vol. 5, no. 4, pp. 643–651, 2020. [Google Scholar]
9. M. Loey, F. Smarandache and N. E. M. Khalifa, “Within the lack of chest COVID-19 X-ray dataset: A novel detection model based on GAN and deep transfer learning,” Symmetry, vol. 12, no. 4, pp. 651, 2020. [Google Scholar]
10. X. Li, C. Li and D. Zhu, “OVID-MobileXpert: On-device COVID-19 patient triage and follow-up using chest X-rays,” in 2020 IEEE Int. Conf. on Bioinformatics and Biomedicine, pp. 1063–1067, 2020. https://doi.org/10.1080/07391102.2020.1767212. [Google Scholar]
11. K. El Asnaoui and Y. Chawki, “Using X-ray images and deep learning for automated detection of coronavirus disease,” Journal of Biomolecular Structure and Dynamics, pp. 1–12, 2020. [Google Scholar]
12. O. Ronneberger, P. Fischer and T. Brox, “U-net: Convolutional networks for biomedical image segmentation,” in Int. Conf. on Medical Image Computing and Computer-Assisted Intervention, Munich, Germany, pp. 234–241, 2015. [Google Scholar]
13. T. M. Tuan, T. T. Ngan and C. N. Giap, “Semisupervised fuzzy clustering methods for X-ray image segmentation,” in Handbook of Data Science Approaches for Biomedical Engineering, Cambridge, Massachusetts, United States: Academic Press, pp. 251–289, 2020. [Google Scholar]
14. A. Shoeibi, N. Ghassemi, H. Hosseini-Nejad and M. Rouhani, “An Efficient brain MR images segmentation hardware using kernel fuzzy C-means,” in National and 4th Int. Iranian Conf. on Biomedical Engineering, Tehran, Iran, pp. 93–99, 2019. [Google Scholar]
15. A. Shoeibi, M. Khodatars, R. Alizadehsani, N. Ghassemi, M. Jafari et al., “Automated detection and forecasting of covid-19 using deep learning techniques: A review,” arXiv preprint arXiv: 2007.10785, 2020. [Google Scholar]
16. S. Tabik, A. Gómez-Ríos, J. L. Martín-Rodríguez, I. Sevillano-García, M. Rey-Area et al., “COVIDGR dataset and COVID-SDNet methodology for predicting COVID-19 based on chest X-Ray images,” IEEE Journal of Biomedical and Health Informatics, vol. 24, pp. 3595–3605, 2020. [Google Scholar]
17. R. Murugan and T. Goel, “E-DiCoNet: Extreme learning machine-based classifier for diagnosis of COVID-19 using deep convolutional network,” Journal of Ambient Intelligence and Humanized Computing, pp. 1–12, 2021. https://doi.org/10.1007/s12652-020-02688-3. [Google Scholar]
18. K. Martini, C. Blüthgen, J. E. Walter, M. Messerli, T. D. L. Nguyen-Kim et al., “Accuracy of conventional and machine learning enhanced chest radiography for the assessment of COVID-19 pneumonia: Intra-individual comparison with CT,” Journal of clinical medicine, vol. 9, pp. 3576, 2020. [Google Scholar]
19. N. C. Pratiwi, N. Ibrahim, Y. N. Fu’adah and K. Masykuroh, “Computer-aided detection (CAD) for COVID-19 based on chest X-Ray images using convolutional neural network,” IOP Conference Series: Materials Science and Engineering, vol. 982, no. 1, pp. 12004, 2020. [Google Scholar]
20. P. Silva, E. Luz, G. Moreira, C. Gomes, L. Viana et al., “Pictures of X-rays displayed in monitors for deep learning-based COVID-19 screening: Implications for mobile application development,” Research Square, 2020. https://doi.org/10.21203/rs.3.rs-37908/v1. [Google Scholar]
21. M. Farooq and A. Hafeez, “Covid-resnet: A deep learning framework for screening of covid19 from radiographs,” arXiv preprint arXiv: 2003.14395, 2020. [Google Scholar]
22. H. S. Maghdid, A. T. Asaad, K. Z. Ghafoor, A. S. Sadiq and M. K. Khan, “Diagnosing COVID-19 pneumonia from X-ray and CT images using deep learning and transfer learning algorithms,” in Multimodal Image Exploitation and Learning, vol. 11734, pp. 117340E-1, 2021. [Google Scholar]
23. E. E.-D. Hemdan, M. A. Shouman and M. E. Karar, “Covidx-net: A framework of deep learning classifiers to diagnose covid-19 in x-ray images,” arXiv preprint arXiv: 2003.11055, 2020. [Google Scholar]
24. J. Zhang, Y. Xie, Y. Li, C. Shen and Y. Xia, “Covid-19 screening on chest x-ray images using deep learning-based anomaly detection,” arXiv preprint arXiv: 2003.12338, 2020. [Google Scholar]
25. L. Wang, Z. Q. Lin and A. Wong, “Covid-net: A tailored deep convolutional neural network design for detection of covid-19 cases from chest x-ray images,” Scientific Reports, vol. 10, no. 1, pp. 1–12, 2020. [Google Scholar]
26. V. Chouhan, S. K. Singh, A. Khamparia, D. Gupta, P. Tiwari et al., “A novel transfer learning-based approach for pneumonia detection in chest X-ray images,” Applied Sciences, vol. 10, no. 2, pp. 559, 2020. [Google Scholar]
27. A. Narin, C. Kaya and Z. Pamuk, “Automatic detection of coronavirus disease (covid-19) using X-ray images and deep convolutional neural networks,” arXiv preprint arXiv: 2003.10849, 2020. [Google Scholar]
28. P. Vincent, H. Larochelle, Y. Bengio and P. A. Manzagol, “Extracting and composing robust features with denoising autoencoders,” in Proc. of the 25th Int. Conf. on Machine Learning, New York, United States, pp. 1096–1103, 2008. [Google Scholar]
29. J. Xie, L. Xu and E. Chen, “Image denoising and inpainting with deep neural networks,” Advances in Neural Information Processing Systems, vol. 25, pp. 341–349, 2012. [Google Scholar]
30. T. Van Erven and P. Harremos, “Rényi divergence and Kullback–Leibler divergence,” IEEE Transactions on Information Theory, vol. 60, no. 7, pp. 3797–3820, 2014. [Google Scholar]
31. D. Erhan, Y. Bengio, A. Courville, P. A. Manzagol, P. Vincent et al., “Why does unsupervised pre-training help deep discriminant learning,” The Journal of Machine Learning Research, vol. 11, pp. 625–660, 2010. [Google Scholar]
32. Jentzen and P. Von Wurstemberger, “Lower error bounds for the stochastic gradient descent optimization algorithm: Sharp convergence rates for slowly and fast decaying learning rates,” Journal of Complexity, vol. 57, no. 4, pp. 101438, 2020. [Google Scholar]
33. A. Krizhevsky, I. Sutskever and G. E. Hinton, “Imagenet classification with deep convolutional neural networks,” Advances in Neural Information Processing Systems, vol. 25, pp. 1097–1105, 2012. [Google Scholar]
34. E. Hinton and R. R. Salakhutdinov, “Reducing the dimensionality of data with neural networks,” Science, vol. 313, no. 5786, pp. 504–507, 2006. [Google Scholar]
35. S. Rifai, X. Glorot, Y. Bengio and P. Vincent, “Adding noise to the input of a model trained with a regularized objective,” arXiv preprint arXiv: 1104.3250, 2011. [Google Scholar]
36. N. V. Chawla, K. W. Bowyer, L. O. Hall and W. P. Kegelmeyer, “SMOTE: Synthetic minority over-sampling technique,” Journal of Artificial Intelligence Research, vol. 16, pp. 321–357, 2002. [Google Scholar]
37. H. He, Y. Bai, E. A. Garcia and S. Li, “ADASYN: Adaptive synthetic sampling approach for imbalanced learning,” in 2008 IEEE Int. Joint Conf. on Neural Networks (IEEE World Congress on Computational IntelligenceHong Kong, China, pp. 1322–1328, 2008. [Google Scholar]
38. D. S. Kermany, M. Goldbaum, W. Cai, C. C. Valentim, H. Liang et al., “Identifying medical diagnoses and treatable diseases by image-based deep learning,” Cell, vol. 172, no. 5, pp. 1122–1131, 2018. [Google Scholar]
39. T. Ozturk, M. Talo, E. A. Yildirim, U. B. Baloglu, O. Yildirim et al., “Automated detection of covid-19 cases using deep neural networks with x-ray images,” Computers in Biology and Medicine, vol. 121, no. 7798, pp. 103792, 2020. [Google Scholar]
 | This work is licensed under a Creative Commons Attribution 4.0 International License, which permits unrestricted use, distribution, and reproduction in any medium, provided the original work is properly cited. |