DOI:10.32604/cmc.2021.018758
| Computers, Materials & Continua DOI:10.32604/cmc.2021.018758 | |
| Article |
Fruit Ripeness Prediction Based on DNN Feature Induction from Sparse Dataset
1Department of Statistics, Chonnam National University, Gwangju, 61186, Korea
2Department of Electronics Eng., Mokpo National University, Muan, 58557, Korea
3National Program of Excellence in Software Centre, Chosun University, Gwangju, 61452, Korea
*Corresponding Author: In Seop Na. Email: ypencil@hanmail.net
Received: 20 March 2021; Accepted: 03 May 2021
Abstract: Fruit processing devices, that automatically detect the freshness and ripening stages of fruits are very important in precision agriculture. Recently, based on deep learning, many attempts have been made in computer image processing, to monitor the ripening stage of fruits. However, it is time-consuming to acquire images of the various ripening stages to be used for training, and it is difficult to measure the ripening stages of fruits accurately with a small number of images. In this paper, we propose a prediction system that can automatically determine the ripening stage of fruit by a combination of deep neural networks (DNNs) and machine learning (ML) that focus on optimizing them in combination on several image datasets. First, we used eight DNN algorithms to extract the color feature vectors most suitable for classifying them from the observed images representing each ripening stage. Second, we applied seven ML methods to determine the ripening stage of fruits based on the extracted color features. Third, we propose an automatic prediction system that can accurately determine the ripeness in images of various fruits such as strawberries and tomatoes by a combination of the DNN and ML methods. Additionally, we used the transfer learning method to train the proposed system on few image datasets to increase the training speed. Fourth, we experimented to find out which of the various combinations of DNN and ML methods demonstrated excellent classification performance. From the experimental results, a combination of DNNs and multilayer perceptron, or a combination of DNNs and support vector machine or kernel support vector machine generally exhibited excellent classification performance. Conversely, the combination of various DNNs and statistical classification models shows that the overall classification rate is low. Second, in the case of using tomato images, it was found that the classification rate for the combination of various DNNs and ML methods was generally similar to the results obtained for strawberry images.
Keywords: Ripening stage prediction; deep neural network; machine learning; tomato; strawberry; small dataset
Studying the ripening stages of fruits is important for economy of precision agriculture. Recently, with the development of image processing, machine learning (ML), and deep learning (DL) technologies for camera-based automation system, various attempts have been made to predict the ripening stages of fruit easily without manual labor.
Among a large variety of produce, strawberries and tomatoes are two of Korea’s favorites and are used as additives in diverse foods. Therefore, as the consumption of these fruits increases, annually they have become the most economically valuable fruits in Korea. For this reason, strawberries and tomatoes have become the most popular crops for farmers to grow. The freshness and ripeness of fruits, such as tomatoes and strawberries, is a major concern for both consumers and fruit farmers. To improve the economic value of fruit, it is of utmost importance to determine the ripening stage of the fruit quickly and accurately. It is an essential requirement to establish a classification system that can determine the ripening stage on the fruit farm. In addition, the ripeness of fruits is a very important factor in determining their taste and price [1]. Recently, farmers who grow strawberries and tomatoes became interested in to cultivating smart farms as a way to improve the quality and value of fruit as shown in Fig. 1 [1–3]. Smart farm technology is a cultivation technology that automates the entire process from sowing to growth, fruiting and harvesting [1].
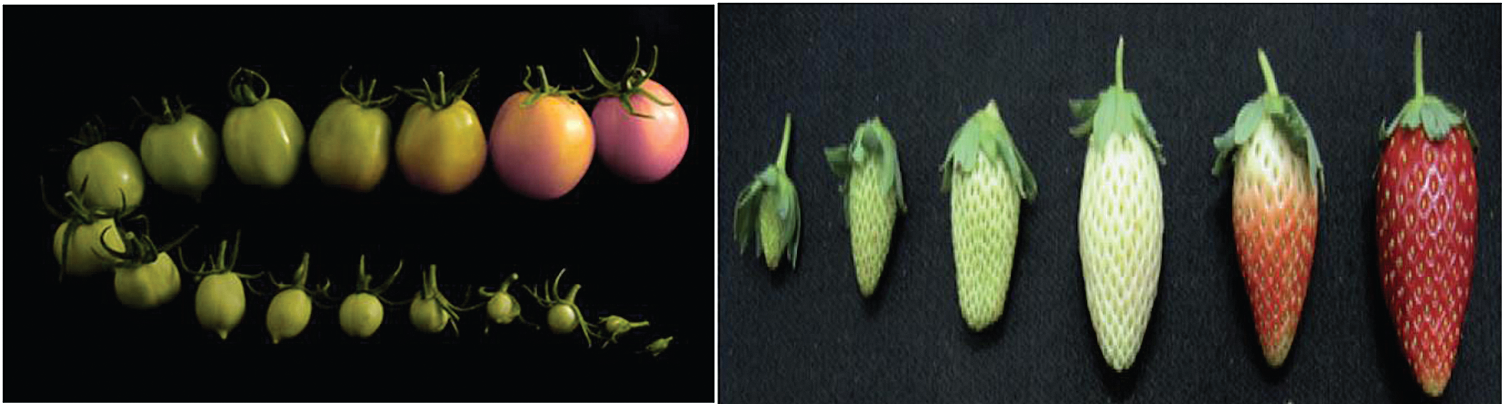
Figure 1: Example of ripening stages on tomato (left) [2], and strawberry (right) [3]
In this paper, we propose a ripening stage prediction system for determining the harvest time using deep neural network (DNN) technology on most popular Korean fruits ‘strawberries and tomatoes’. However, as is widely knows, developing a prediction system based on DNN such as visual geometry group (VGG), residual network (ResNet), Inception and MobileNet requires a huge amount of training data. However, it is practically impossible to acquire enough images in the wild that represent the ripening stages of various fruits such as strawberries and tomatoes. The softmax function is a non-locality function that is not 0 or negative and makes a relative comparison with the output values of other neurons. The softmax function is mainly used to perform classification at the last output node of the DNN. By performing one of K coding with softmax in the last layer, one of several classes is selected. The softmax function normalizes k-dimensional vector values to a probability distribution between 0 and 1. However, if the training dataset is insufficient, the variance of the training error appears large. To overcome this, we attempt to find the optimal ML method for fruit ripening from various combinations of MLs.
Therefore, to solve the problem of having minimal data [4], as much data as possible must be collected and augmented and an efficient training method must be considered. For this reason, we propose a novel prediction method that efficiently predicts the harvest time of fruits by combining DNN driven features with traditional machine learning algorithms. First, the classification rate can be improved by replacing the soft-max algorithm [5] used for classification in existing convolutional neural networks (CNNs) with various classification algorithms that are widely used in pattern recognition. Second, as a method of compensating for insufficient learning data, we attempt to train the proposed system efficiently using the transfer learning [6] method proposed by several scholars.
The remainder of this paper is organized as follows: In Section 2, we review the previous studies on discrimination strategies for the ripeness stages of fruits using deep learning network technology in the computer vision field. In Section 3, we describe the method of collecting the fruit image data required for our research, propose the structure of a new classification system and suggest a method to learn them. In Section 4, the experimental methods and results of the proposed system’s performance evaluation are presented and the comparative performance of existing prediction systems is analyzed. In Conclusion, we comprehensively analyze and summarize the results obtained through this study to present the outcomes clearly.
2.1 Fruit Images Analysis Based on Color Features, Statistical Classification and ML Methods
In the reviewed studies, the authors provide research guides to both researchers and practitioners for applying cognitive technologies to agriculture. They also reviewed related studies on various agricultural activities that support crop production, such as fruit grading, fruit counting, and yield estimation [7–14]. Pandy et al. [7] reviewed efficient algorithms for color feature extraction and then compared various classification techniques. They provided an introduction to machine learning and color-based grading algorithms and an automatic fruit grading system. Nambi et al. [8] conducted a study related to the development of a model to determine the ripening index of Indian mangoes. They measured the physical and chemical composition, color, and size of mangoes to find out what changes occur during ripening, and divided the process into five stages. They used partial least squares regression, principal component regression, and multiple regression models to determine the ripening stages of mangoes, and evaluated their predictive ability. Maheswaran et al. [9] developed a system using image processing technology artificially to determine the ripening stage of mangoes. Their proposed system used mango’s color histogram feature vectors to compare and evaluate the quality of naturally and artificially aged fruits. Torre et al. [10] compared five multivariate techniques to classify the ripening stages of cape gooseberies. They used nine characteristics including the RGB color model, the HSV color model, and the L * a * b color model. In addition, machine learning technology was used as a method to classify cape gooseberry ripening. Mazen et al. [11] proposed a new computer vision system to check the ripening status of bananas. First, they prepared a database of four handcrafted categories. Second, they used color features, brown spots, and Tamura statistical texture features to classify the ripening stages and grades of bananas. Third, they evaluated the performance using various machine learning methods and statistical discriminant analysis techniques. Mavridou and his colleagues [12] reviewed the overall content of how a computer vision system can be used to establish an efficient cultivation strategy for fruit crops. In this study, they provided research guides for researchers and practitioners applying cognitive technologies to agriculture. These ML-based fruit tree image-processing methods are problematic because they are difficult to automate as the feature vectors must be manually extracted and used for recognition.
2.2 Determining the Ripening Stages of Fruit Images Based on DNNs
Several papers have been published on determining the ripening stages of fruit in images using a deep learning algorithm such as CNN, which has recently received great attention [15–22]. Muresan et al. [15] collected and published high-quality image data on various fruits. They also presented several experimental methods for training artificial neural networks that are used to detect fruits. In addition, they proposed an application system that can be used to classify various fruits and examined the effectiveness of these systems. Vaviya et al. [16] proposed a system capable of obtaining an image of the fruit under testing and comparing it with the characteristics of naturally and artificially ripened fruit and providing an output with a probability distribution. The proposed system detects ripe fruits artificially using a smartphone running an Android application and a CNN. Sakib et al. [17] proposed a fruit recognition system using a deep learning algorithm. They used the Fruits-360 database representing several fruits to evaluate the proposed system. This dataset is organized into 25 categories and contains 17823 images. In addition, they compared and analyzed the performance of several hidden layers in combination and different numbers of repetitions to confirm the accuracy of the classification. Gao et al. [18] photographed strawberries with a hyperspectral system, collected image data, and classified the maturity of strawberries using SVM, a machine learning method, and the AlexNet CNN, a deep learning method. Both methods showed excellent performance, however, it was experimentally proved that the CNN method exhibited the better performance. Kusuma Sri et al. [19] proposed a new CNN structure to accurately determine the ripening stage of bananas. In addition, they trained the proposed system using data-based feature vectors and the trained system produced an index indicating the ripening stage of bananas. Rojas-Aranda et al. [20] applied a lightweight CNN to fruit classification to reduced the settlement time in fruit stores. In addition, they added various feature vectors to the CNN structure to improve the classification rate of the proposed system. These input feature vectors are RGB color and histogram features, and the RGB center values given by the clustering algorithm. Naranjo-Torres et al. [21] reviewed the use of a CNN for classification, qualitative characteristics, and detection for various processing techniques for fruit trees. They also proved that the use of deep learning, which applied direct learning and transfer learning methods to fruit recognition over the past 2 years (2019–2020), performed very well. They found that appropriate datasets should be used depending on the method applied for the particular experiment. However, when processing or classifying an image using the CNN-based deep learning method, there are two problems. First, copious big data is required to estimate a large number of parameters, and second, using the softmax classifier when performing classification using the CNN algorithm greatly degrades its performance.
2.3 Integrated Model Based on Combining the DNN and ML Methods
To solve the problem of decrease in the classification rate due to the use of the softmax classifier, the CNN algorithm is first used to automatically extract a feature vector suitable for classification from an input image, and then an existing ML method is used to classify objects by using the extracted feature vector. Recently, several studies on this subject have been published [22–31]. Niu et al. [23] presented an integrated model that combines DNN and ML methods that provide good results in recognizing different patterns. In this model, they used CNN as the feature extractor and SVM [32] as the classifier. The integrated model they proposed is used to extract feature vectors automatically from the input image for classification. In addition, the well-known MNIST [33] dataset was used to evaluate the performance of the proposed system. Zhou et al. [24] proposed a new model that combines biomimetic pattern recognition (BPR) and deep learning networks for image classification. In this model, a deep learning network is used to extract feature vectors from the input image, and the BPR algorithm performs image classification using geometric properties in a high-dimensional space. Finally, they used three popular datasets, MNIST, AR and CIFAR10 [34], to evaluate the performance of the proposed system. In their paper, Turkoglu et al. [25] considered nine deep learning networks to detect plant diseases. These network-learning methods first pre-learned the weights using transfer learning and fine-tuned them using the given observation data. Feature vectors were extracted using the trained deep learning network, and image classification was performed using the following three pattern recognition methods: SVM, extreme learning machine (ELM), and K-nearest neighbor (LNN). Mo and colleagues [26] considered an image recognition system that combines an ensemble learning algorithm and a deep learning network. To increase the effectiveness of the learning algorithm, they used various deep learning network models [29]. In addition, various data expansion plans were considered to solve the problem of insufficient learning data. Hasan et al. [27] presented a new method for the spectral classification of hyperspectral images. The proposed classification method uses deep learning algorithms including an appropriate SVM architecture, the SVM radial basis function, and principal component analysis [35] to extract neighboring spatial regions. Next, for classification, the soft max classifier in the existing CNN is used. In addition, they present the results of comparing and analyzing the performance of the three feature extraction algorithms considered above with other methods for classifying spectral images. Basly et al. [28] proposed a classification system that can replace the existing manual image feature extraction method, which is widely used in human behavior recognition problems, with a deep learning algorithm capable of automatically extracting image features. The proposed system first uses a deep CNN that allows more powerful features from sequenced video frames to be extracted. The resulting feature vector is the input to an SVM classifier to assign each instance to its label and recognize the activity performed.
2.4 Dealing with Data from Sparse Dataset
Another problem with deep learning algorithms is that a vast amount of training data is required to apply them algorithms. However, in reality, it is often difficult or impossible to collect such large amounts of data. Therefore, several researchers have been interested in a data expansion method that generates new data from previously collected data. As for research related to this subject, at the SAS Global Forum 2020 Gonfalonieri [36] presented the following four methods as a solution to data insufficiency in machine learning. These use Naive Bayes methods based on Bayesian theory. They learn the weights of networks using large-scale big data in advance and use transfer learning, which takes them as the initial values of the weights of a given network. Data Augmentation using various mathematical transformations, or Synthetic data using synthetic minority over sampling technique (SMOTE) or Modified-SMOTE is also used. In another study, Shorten et al. [37] presented various algorithms in a review paper on the problem of expanding image data. These are the geometric transformation, color space increase, kernel filter, image blending, random deletion, feature space increase, adversarial training, generative adversarial networks, neural-type transfer and meta-learning algorithms. In a third study, Zhao [38] proposed the following method to train deep learning from a small amount of data. First, he considered a method of increasing the number of training data using the data expansion method, and secondly, he used the transfer learning method to train deep learning algorithms using the expanded data. Feng et al. [39] tried to predict coagulation defects using a new algorithm that combines a deep learning network and a regression analysis method using a small dataset containing 487 data points. They confirmed that the proposed deep learning algorithm with transfer learning demonstrates much better performance than the deep learning algorithm combined with the existing three pattern recognition methods.
3 Fruit Ripeness Prediction Based on DNN Feature Induction
Fig. 2 shows the flow chart of the proposed prediction for fruit ripening stage on a small fruit dataset. As the first step, we collect the data, i.e., the strawberry and tomato images, from a website. As the second step, we extract the feature with various DNNs based on transfer learning. As the third step, we estimate the optimal parameters for the fine-tuning between various DNN and traditional ML methods to predict the four ripening stages of the fruit. Finally, we use the results to identify the ripening stages.
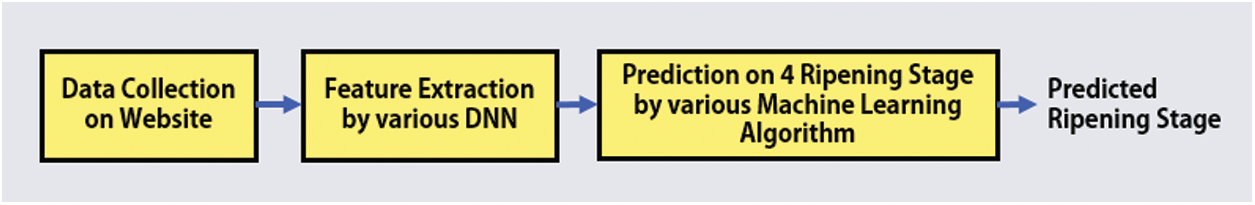
Figure 2: Proposed prediction flow-char on a small wild fruit dataset
3.1 Data Collection from a Website
In this section, we introduce to the procedure for collecting the fruit image data for analysis from a website. In this step, we manually select the strawberry and tomato fruit image data for the four ripening stages (unripe, partially ripe, ripe, and overripe) from a website.
Fig. 3 shows that examples of the fruit image data, upper five images of the four ripening stages are of strawberries and the lower five are of tomatoes.
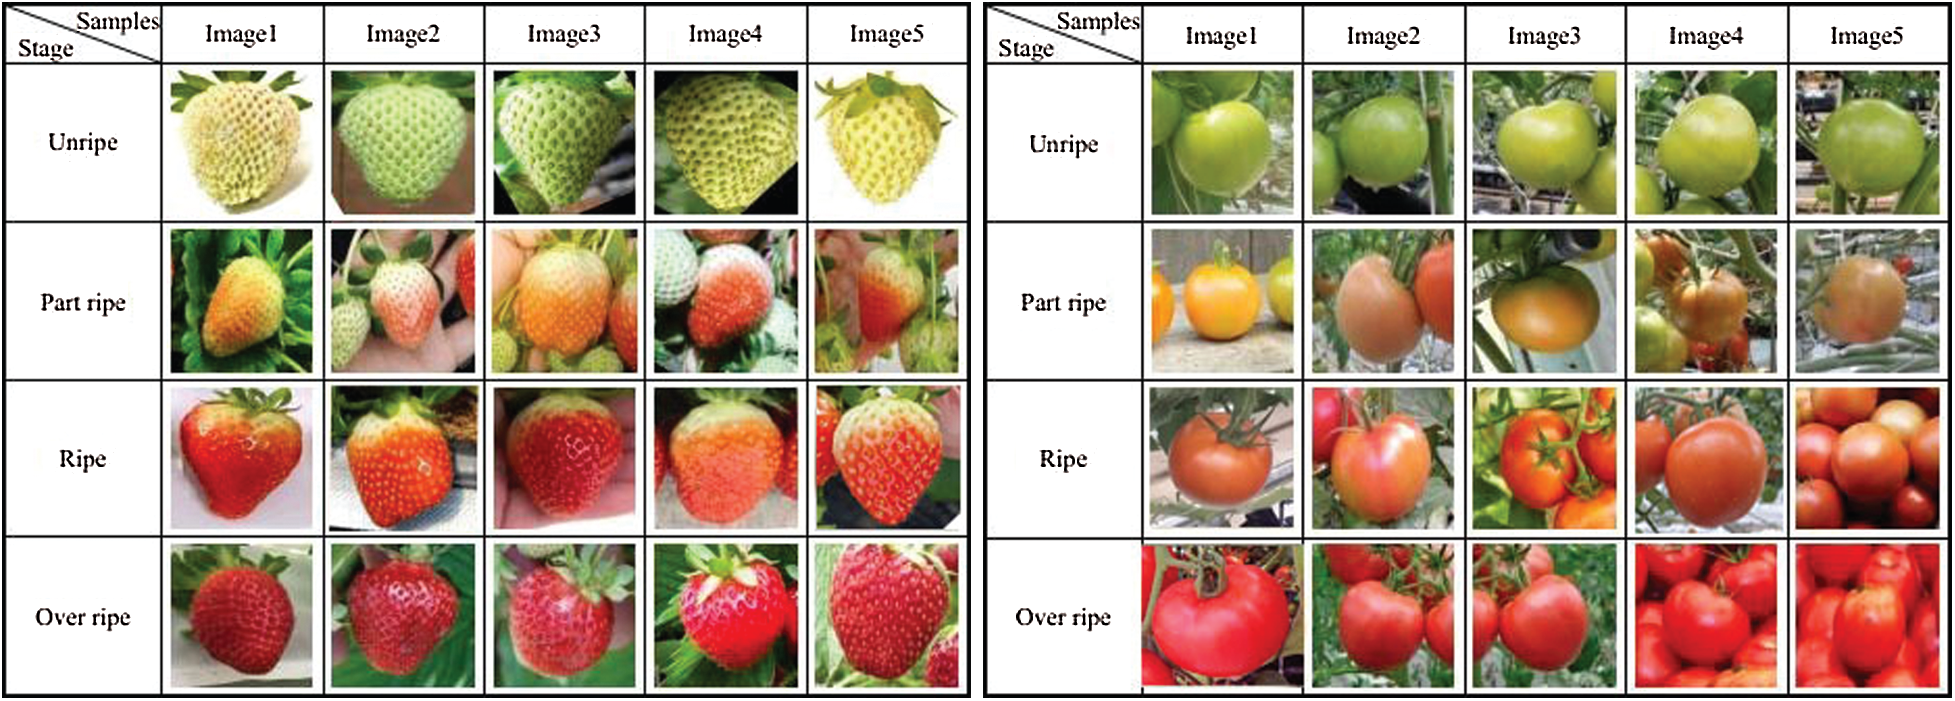
Figure 3: Examples of image data for each ripening stage of strawberries (left) and tomato (right)
We define the four-stages ripeness levels as unripe, partially ripe, ripe, and overripe. The unripe level for strawberries means “white or green strawberries” and for tomatoes, it means “green tomato”. The partially ripe level means the partial redness of the green strawberries or tomatoes. Ripe means “red strawberries or tomatoes”. Overripe means that they are too ripe and are starting to decay, meaning “deep red strawberries and tomatoes”, that are scratched or eaten by insects due to their soft surface’. We gathered the 250 strawberry and 300 tomato images that consisted of approximately 60 images for strawberries at each ripeness stage and approximately 75 images for tomatoes at each ripeness stage.
3.2 DNNs for Feature Extraction
In this section, eight pre-trained DNN architectures are used to extract the feature vectors required to predict the ripening stage of fruits. They are VGG 16, 19, ResNet v2 50, 101, Inception v1, v2, v3, and MobileNet v2. First, the VGG network [40] proposed by the Oxford Visual Geometry Groupis a homogeneous architecture used to obtain better results in the ILSVRC-2014 competition. The VGG 16 and 19 networks as shown in Fig. 4 use smaller filters but are deeper than conventional CNNs. The difference between VGG 16 and 19 is that they have 16 and 19 layers, respectively, however, because there is not much difference in structure or recognition performance, many people use VGG 16 with its smaller number of parameters to be estimated.

Figure 4: VGG network architecture; VGG16 (left), VGG 19 (right)1
1
Second, as shown in Fig. 5, the ResNet network [41] was developed by Microsoft’s Kaiming He and his colleagues with a structure that won the ILSVRC-2015 competition. This introduced the concept of a residual framework that makes it easy to train Deeper NNs with many more layers than existing DNNs. The ResNet 18, 34 and ResNet 50, 101, and 152 have the same overall structure, however in ResNet 18 and 34, the ResNet block are two layers deeper, and in ResNet 50, 101, 152, the ResNet block are three layer deeper.
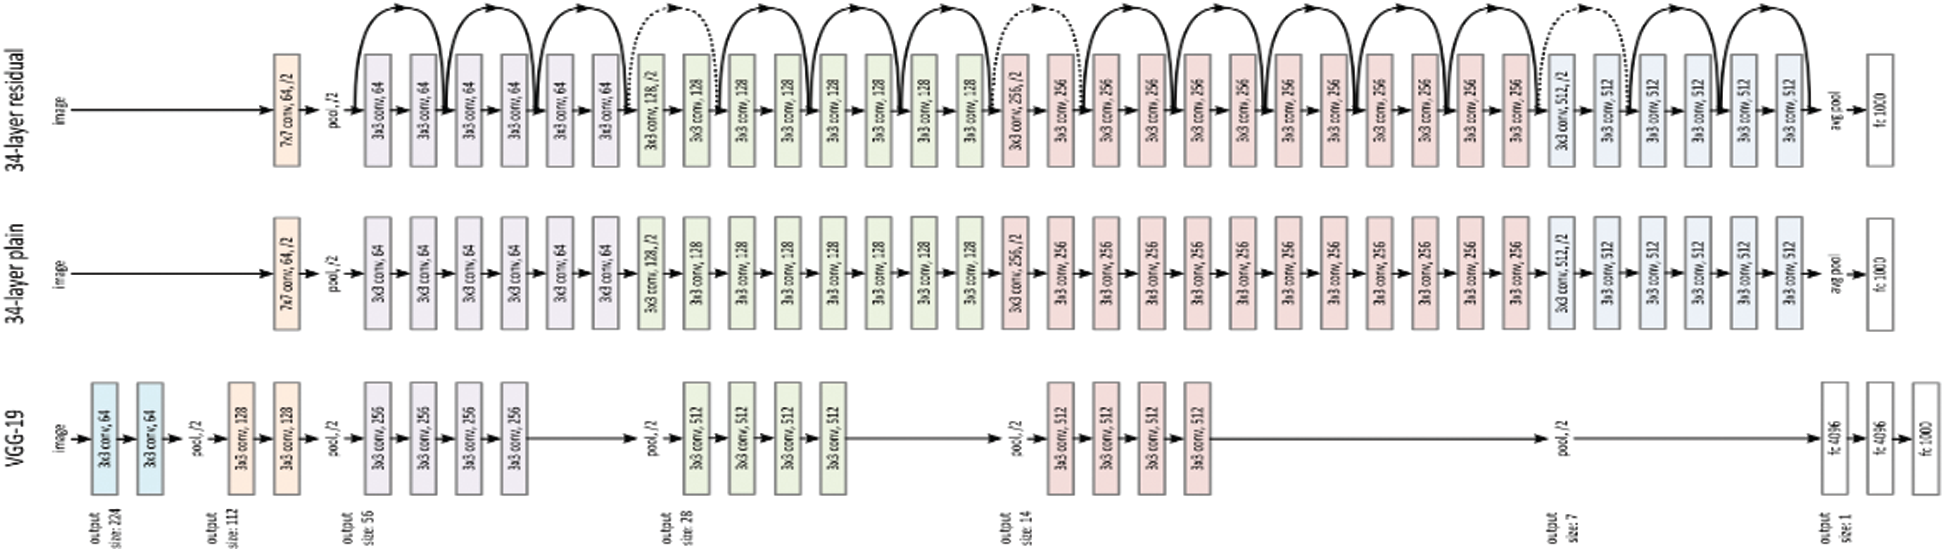
Figure 5: ResNet 50 network architecture 2
2
Third, as shown in Fig. 6, the Inception network [42] was proposed by Szegedy et al. at the ImageNet Large-Scale Visual Recognition Challenge 2014 (ILSVRC 2014). It is a deep CNN architecture, which stablished the then state-of-the-art for classification and detection. Some of the latest popular versions include: Inception v1, Inception v2, Inception v3, Inception v4 and Inception-ResNet. Each version is an iterative improvement on the previous one. Understanding the upgrades can help us to build custom classifiers that are optimized for both speed and accuracy.
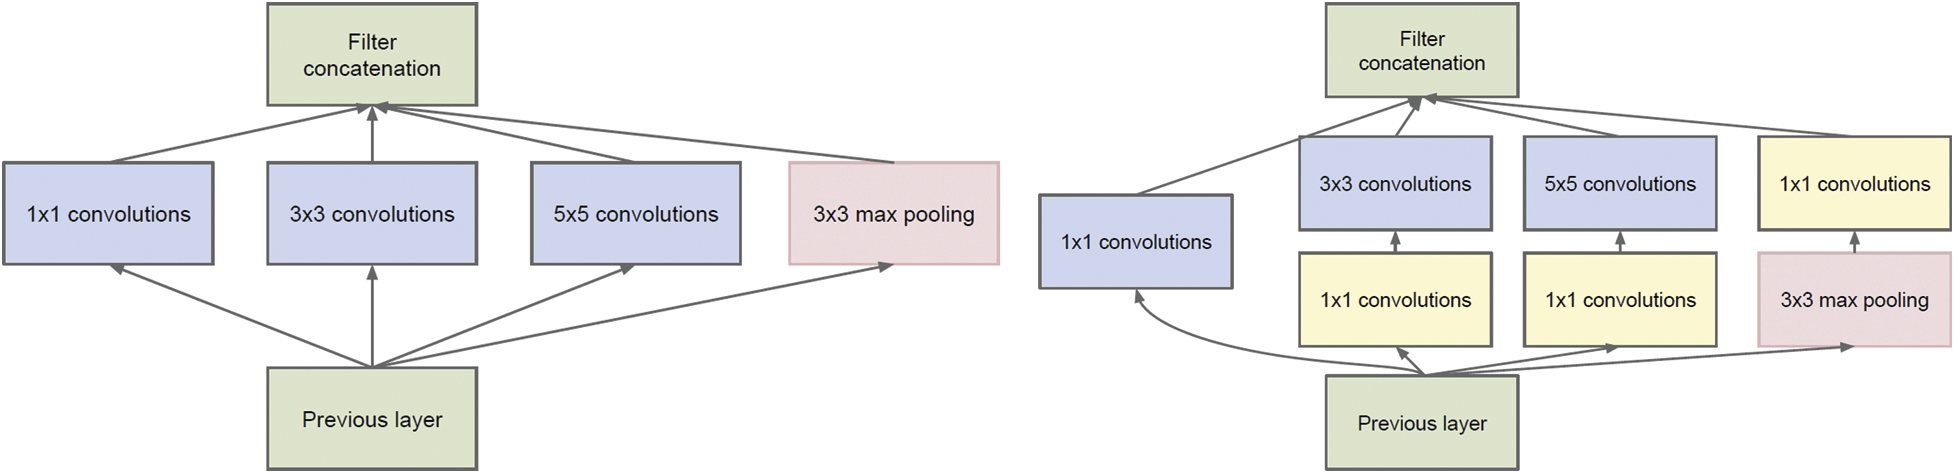
Figure 6: Inception module; Inception module, naive version (left), inception module with dimension reductions (right) [42]
Fourth, as shown in Fig. 7, MobileNets [43] was proposed by Howard et al. for mobile and embedded vision applications. MobileNets are based on a streamlined architecture that uses depth-wise separable convolution. MobileNets is a network designed for easy use in environments such as automobiles, drones, and smartphones that often have one CPU, may not have a GPU or sufficient memory.
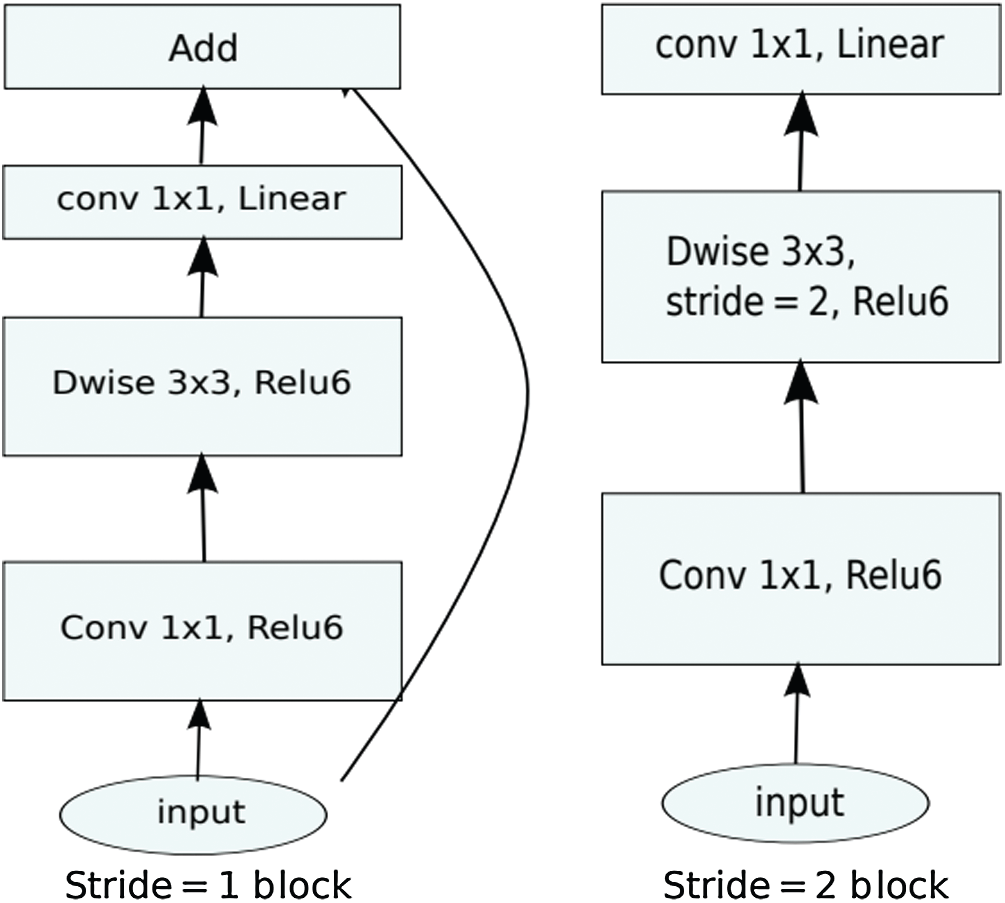
Figure 7: MobileNet v2 architecture [44]
3.3 ML for Ripening Stage Prediction
In this section, seven traditional ML methods are used to classify the ripeness stages of fruit using deep features extracted from pre-trained DNN models. They are the SVM and kernel support vector machine (KSVM), KNN, decision tree classifiers (DTC), random forest (RF), gradient boosting regression tree (GBRT), and multilayer perceptron (MLP). First, the SVM [45] is a method developed by Vapnik is based on Statistical learning theory. The SVM is a model that classifies data based on finding a line (or plane) with the largest margin between data belonging to different classifications. Such lines or planes are termed maximum margin hyperplane and are the criteria for classification. However, as shown in Fig. 8, not all data can be divided into linear hyperplanes.
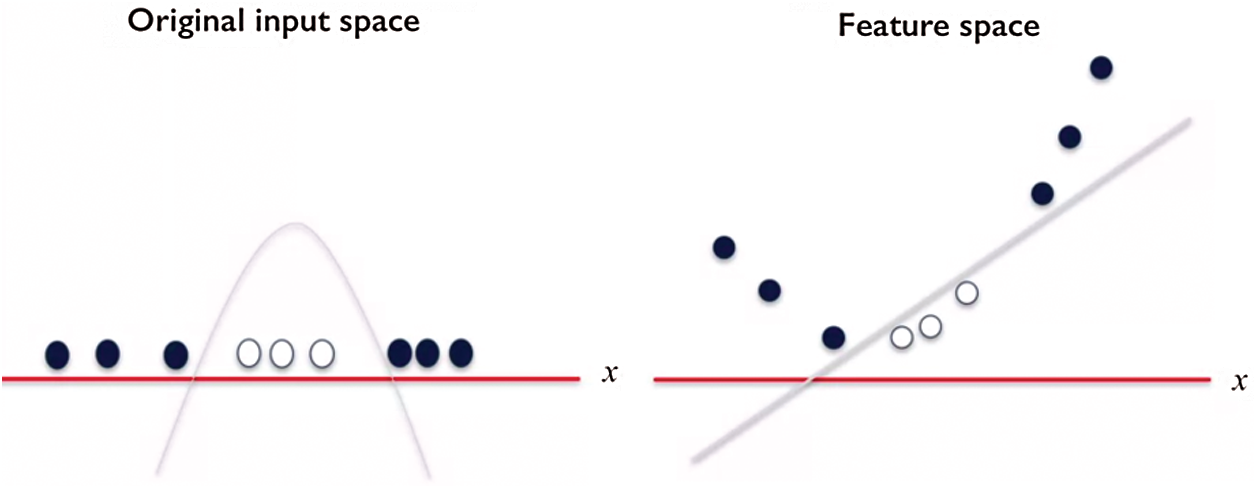
Figure 8: Example of kernelize in SVM 3
3
The black and white dots shown on the left-hand side of the figure are mixed on the X axis. The criterion that distinguishes these classifications is a curve; consequently, a support vector machine that finds planes cannot be used. To solve this problem, a technique termed the kernel trick is used. The basic idea of the kernel trick is to move the given data to an appropriate higher dimension and then use a support vector machine to find the hyperplane in the transformed dimension. This is called KSVM. In KSVM, data is converted to a higher dimension using a kernel function, the dot product is calculated between vectors in the transformed space, and the hyperplane that maximizes the margin is found and classified. The representative kernel functions in current use include polynomial and Gaussian kernels (radial base function kernel).
Second, as shown in Fig. 9, the KNN classifier is a method for classifying the input samples into the class having the highest number of training data among them by selecting the K nearest neighboring training data. Then, the distance between the input data and the training data is calculated using various distance scales. Typically, the measures are Euclidean, Minkowski, Mahalanobis, and Manhattan distances. This method is also very convenient to apply and generally has excellent classification performance.
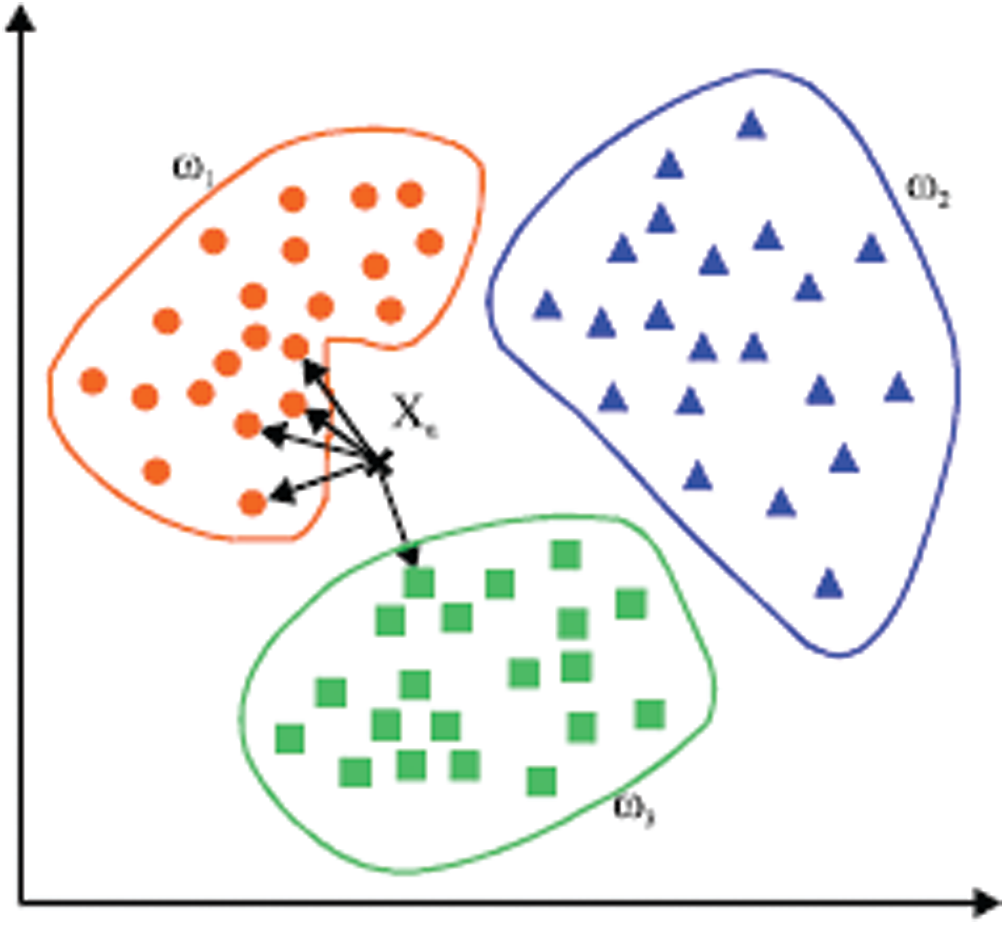
Figure 9: An example of kernelizing in KNN 4
4
Third, as shown in Fig. 10, DTC is tree-shaped and is generally the classification method with the most easily interpretable classification results. This is a binary classification method in which each node makes one of two decisions a series of questions. In addition, the decision tree classifier consists of three node-types: a root node and the decision, and leaf nodes. Presently, the classification is performed by repeatedly dividing into two branches from the root node to the leaf nodes.

Figure 10: Decision tree classifier 5
5
Fourth, as shown in Fig. 11, RF is one of the supervised learning algorithms and is a classification method that can be used for both classification and regression problems. In addition, the RF is a method of generating the best classifier that votes on the generated decision trees by creating a decision tree for randomly selected training data. In addition, RF is a classification method that shows relatively good performance and provides solutions for recommendation engines, image classification and selection, and various applications. It’s a classification method that can be used to identify financial scams or predict the spread of various diseases.
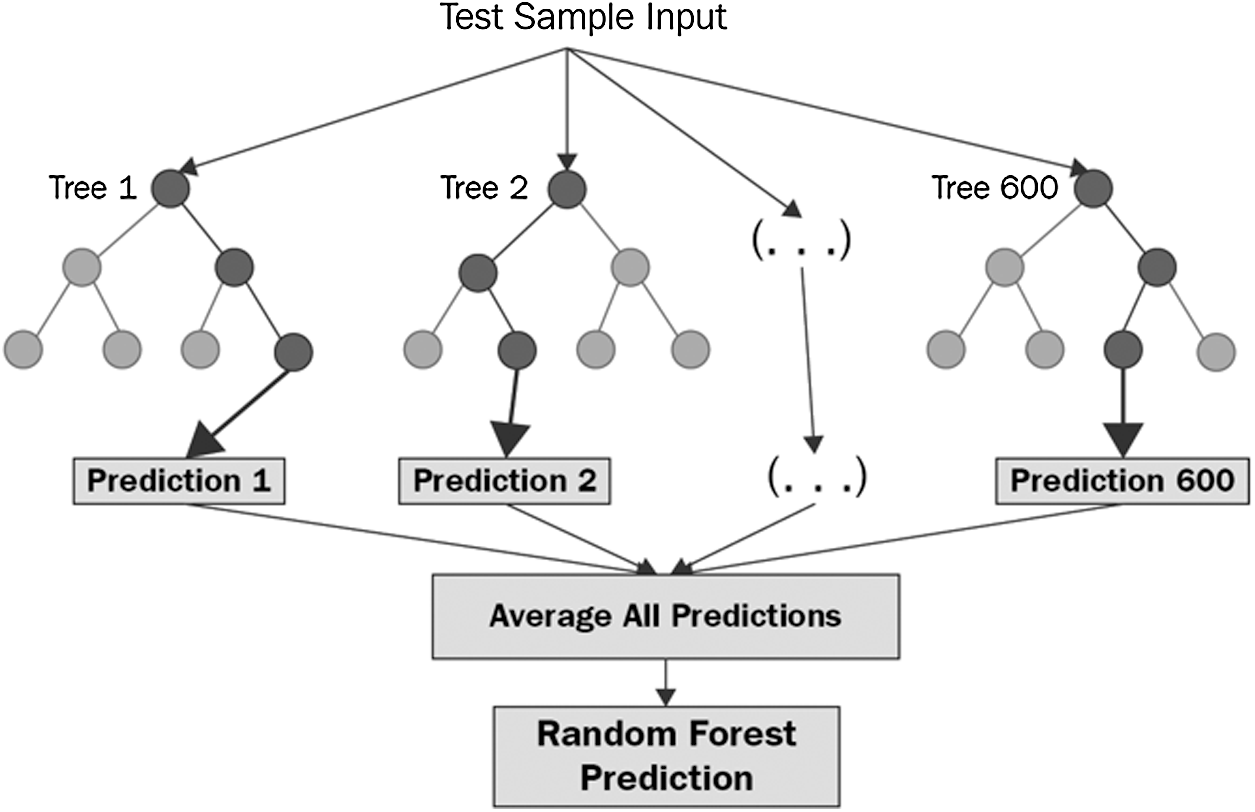
Figure 11: Random forest prediction 6
6
Fifth, as shown in Fig. 12, GBRT is the most recently developed machine learning algorithm and is widely used in data mining applications [34].

Figure 12: Gradient Boosting regression tree 7
7
GBRT uses a decision tree of limited depth as a basic learner and constructs a more powerful learning algorithm termed a gradient boosted decision tree. In addition, this method has excellent classification performance and it is easy to interpret the learned content. The core processing method of the GBDT is a classification model in which each calculation is performed in the basic model, the residual is calculated in the final model, and the basic models are trained in the direction toward which the residual is reduced. Therefore, the weights of the basic classifier are continuously adjusted finally to build a powerful learning algorithm that minimizes the loss function.
Sixth, as shown in Fig. 13, the MLP is composed of an input layer, a hidden layer, and an output layer. The input layer receives signals, and the output layer discriminates the input and outputs the result. In addition, there may be more than one hidden layer and this approximates a continuous function or acts as a true computation engine. MLP is a supervised learning method that uses a paired of input feature vector and an output target and learns in the direction that minimizes the error between the output value and the target value. This learning method is termed an error back propagation algorithm. Also, the error between the output and the target is calculated by various methods including root mean squre error (RMSE). Recently, with the development of hardware such as GPU and the use of various activation functions, it has developed into a deep learning algorithm that greatly increases the number of hidden layers.
Here, we presented the pipeline of a prediction system that can discriminate the fruit ripening stage based on DNN feature induction as shown in Fig. 14.
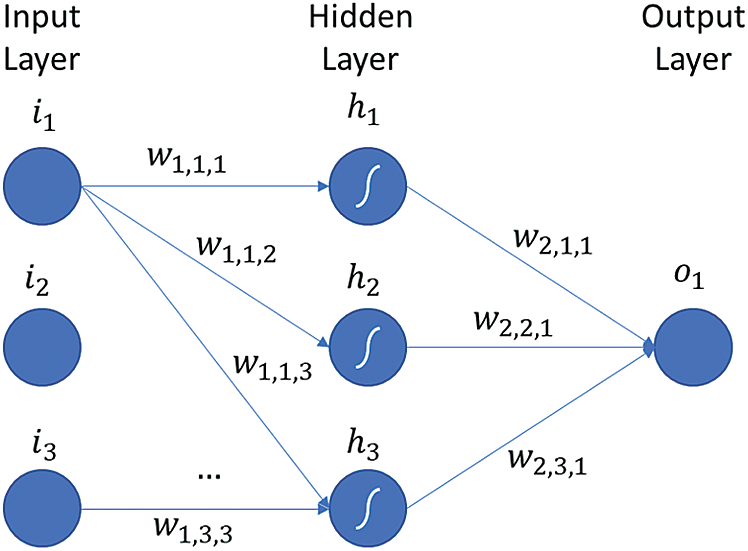
Figure 13: Multi-layer architecture 8
8
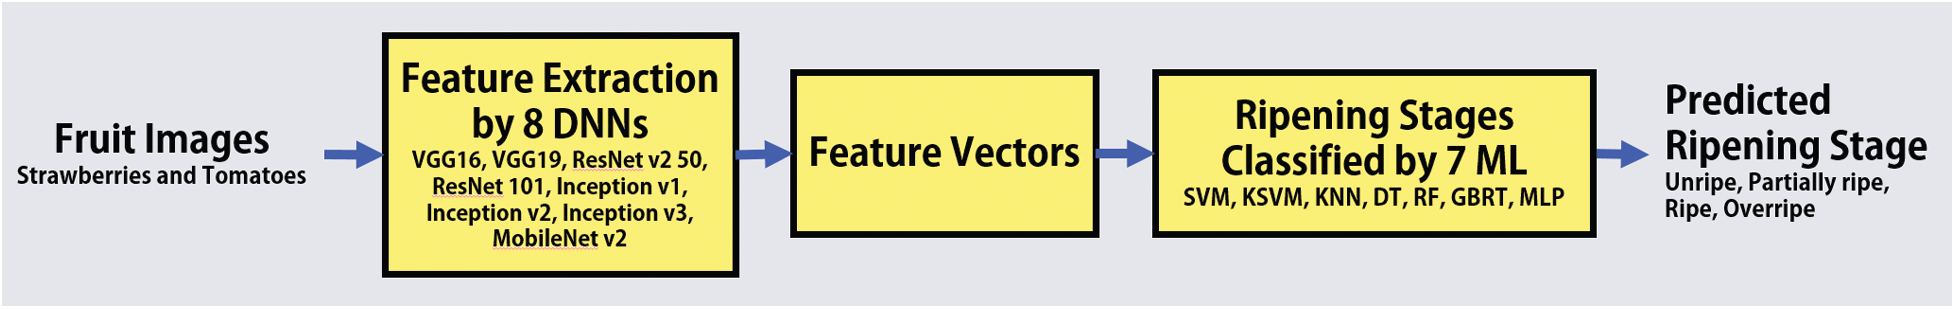
Figure 14: Pipeline of prediction based on DNN feature induction
The first half of this system extracts the appropriate feature vector from the input fruit image using various DNNs, and the second half determines the maturation of the input fruit image using various ML Methods based on the extracted feature vector. For the feature extraction step, various pre-trained DNN models with alternating convolutional and max-pooling layers are used to extract deep features as mentioned in Section 3.2. The deep features extracted from the DNN model are used as the input to the ML methods used for classification. For the prediction step, we remove the last output layer of the pre-trained DNN models and replace it with an ML method for classification as mentioned in Section 3.3.
In this case, the output values of the last node of the DNN models from which the full connected layers have been removed were used as input values for pattern recognition in the ripeness prediction process. We performed pre-training for transfer learning on an adapted DNN model as mentioned in Section 3.2 using a big public dataset such as ImageNet. The reason for using a pre-trained DNN model is that it is reliable, faster, and easier than training a DNN model with randomly initialized weights. Next, we removed the last three full connected layers of the pre-training DNN model and replace them with the layers that implement the selected pattern recognition method. Finally, the newly constructed prediction model was fine-tuned using the collected fruit image data.
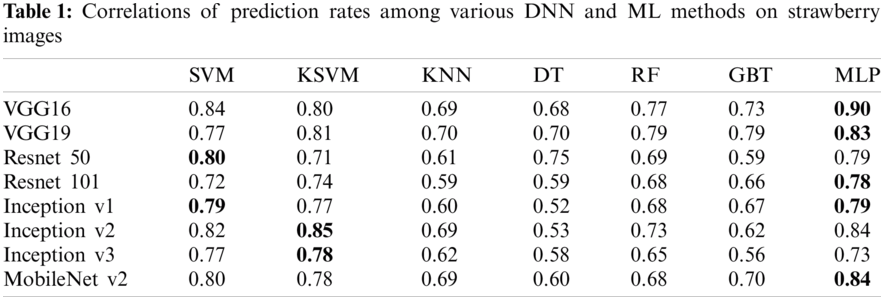
Here, to train the proposed classification methods, we used 30 images as the training dataset for each ripening stage. We also used 20 images as the testing data for each stage to verify the performance of the trained prediction system. Tab. 1 shows the correlation of prediction rate among various DNN and ML methods on strawberry images. And Fig. 15 shows the geometric map of correlating the prediction rates for the ripening stages in strawberry images. From the results of Tab. 1 and Fig. 15, we note that the combination of VGG16 or 19 and MLP (softmax) showed the highest classification rates of approximately 90% and 83%, respectively. Second, the combination of Resnet 50 and SVM or the combination of Resnet 101 and MLP showed the best classification rates at 80% and 78%, respectively. Third, the combination of Inception v1 and SVM or the combined model of Inception v2 and KSVM or the combination of Inception v3 and KSVM showed the best classification rates at 79%, 85% and 78%, respectively. Finally, the combination of MobileNet v2 and MLP showed the best classification rates at 84%. Overall, one notes that a combination of various DNNs and MLPs, or a combination of SVM or KSVM generally produce excellent classification performance. Conversely, the combination of various DNNs and statistical classification models shows that the overall classification rate is low as shown in Fig. 15. In general, DNN-based features classify objects using shape-based information. However, the ripeness of most of the fruits we want to classify depends on changes in color. Therefore, it is necessary to find out what type of DNN feature extractor best reflects the change in color component and to establish how many feature values among the extracted features are used to classify the ripeness of fruit.
Here, we express the maturity feature vectors as a heat map to find which part of the feature vectors extracted from various deep learning networks affects the determination of the ripeness of strawberries. In other words, we looked at which and how many feature vectors influence ripeness discrimination. Fig. 16 shows the heat map of the feature vectors of extracted by various DNNs according to ripeness.
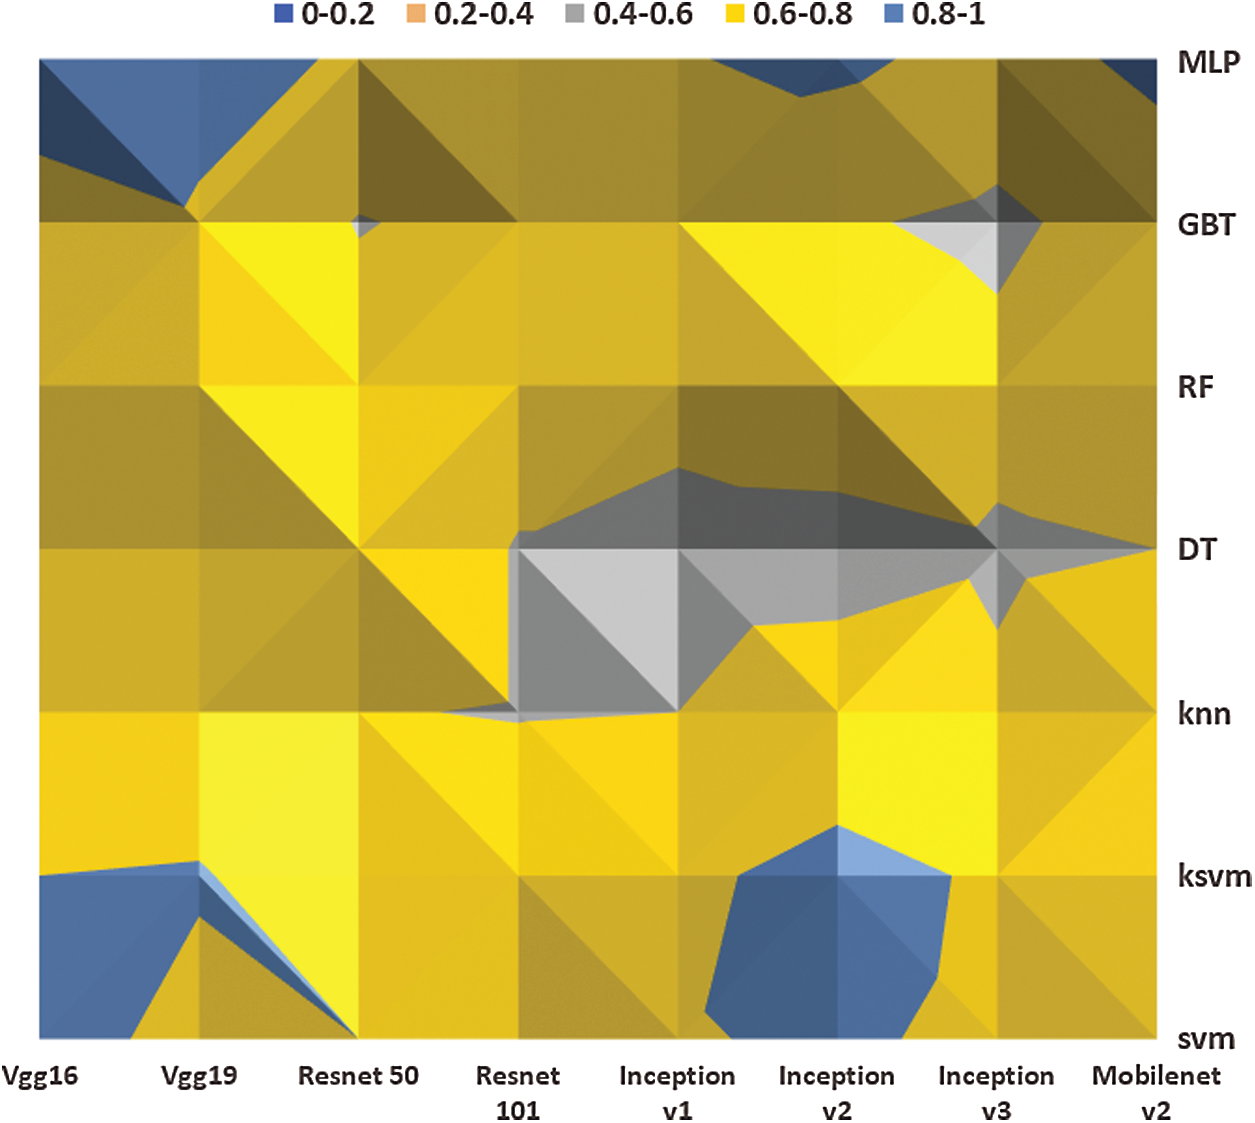
Figure 15: Geometric map of the ripening prediction rate correlations for strawberries
As shown in Fig. 16, Resnet v2 50 and 101 do not identify many features for determining the ripeness of strawberries. Therefore, the classification accuracy of the ripeness features generated by these two network feature extractors was lower than that of others. In the case of the Inception v1, v2, v3, and MobileNet v2 feature extractors, many feature values are affected by strawberry ripeness, however, many of the common ripeness feature value, and unique values are relatively inadequate. It was found that VGG16 and 19 had relatively many feature values suitable for determining maturity, and as a result, high accuracy was shown for various classifiers.
To train the proposed classification methods, we used 40 images as the training dataset for each ripening stage. We also used 20 images as testing data for each stage to verify the performance of the trained prediction system. Tab. 2 shows the correlation of the prediction rate between various DNN and ML methods on tomato images. Fig. 17 shows the geometric map of correlations for the ripening prediction rate on tomato images.
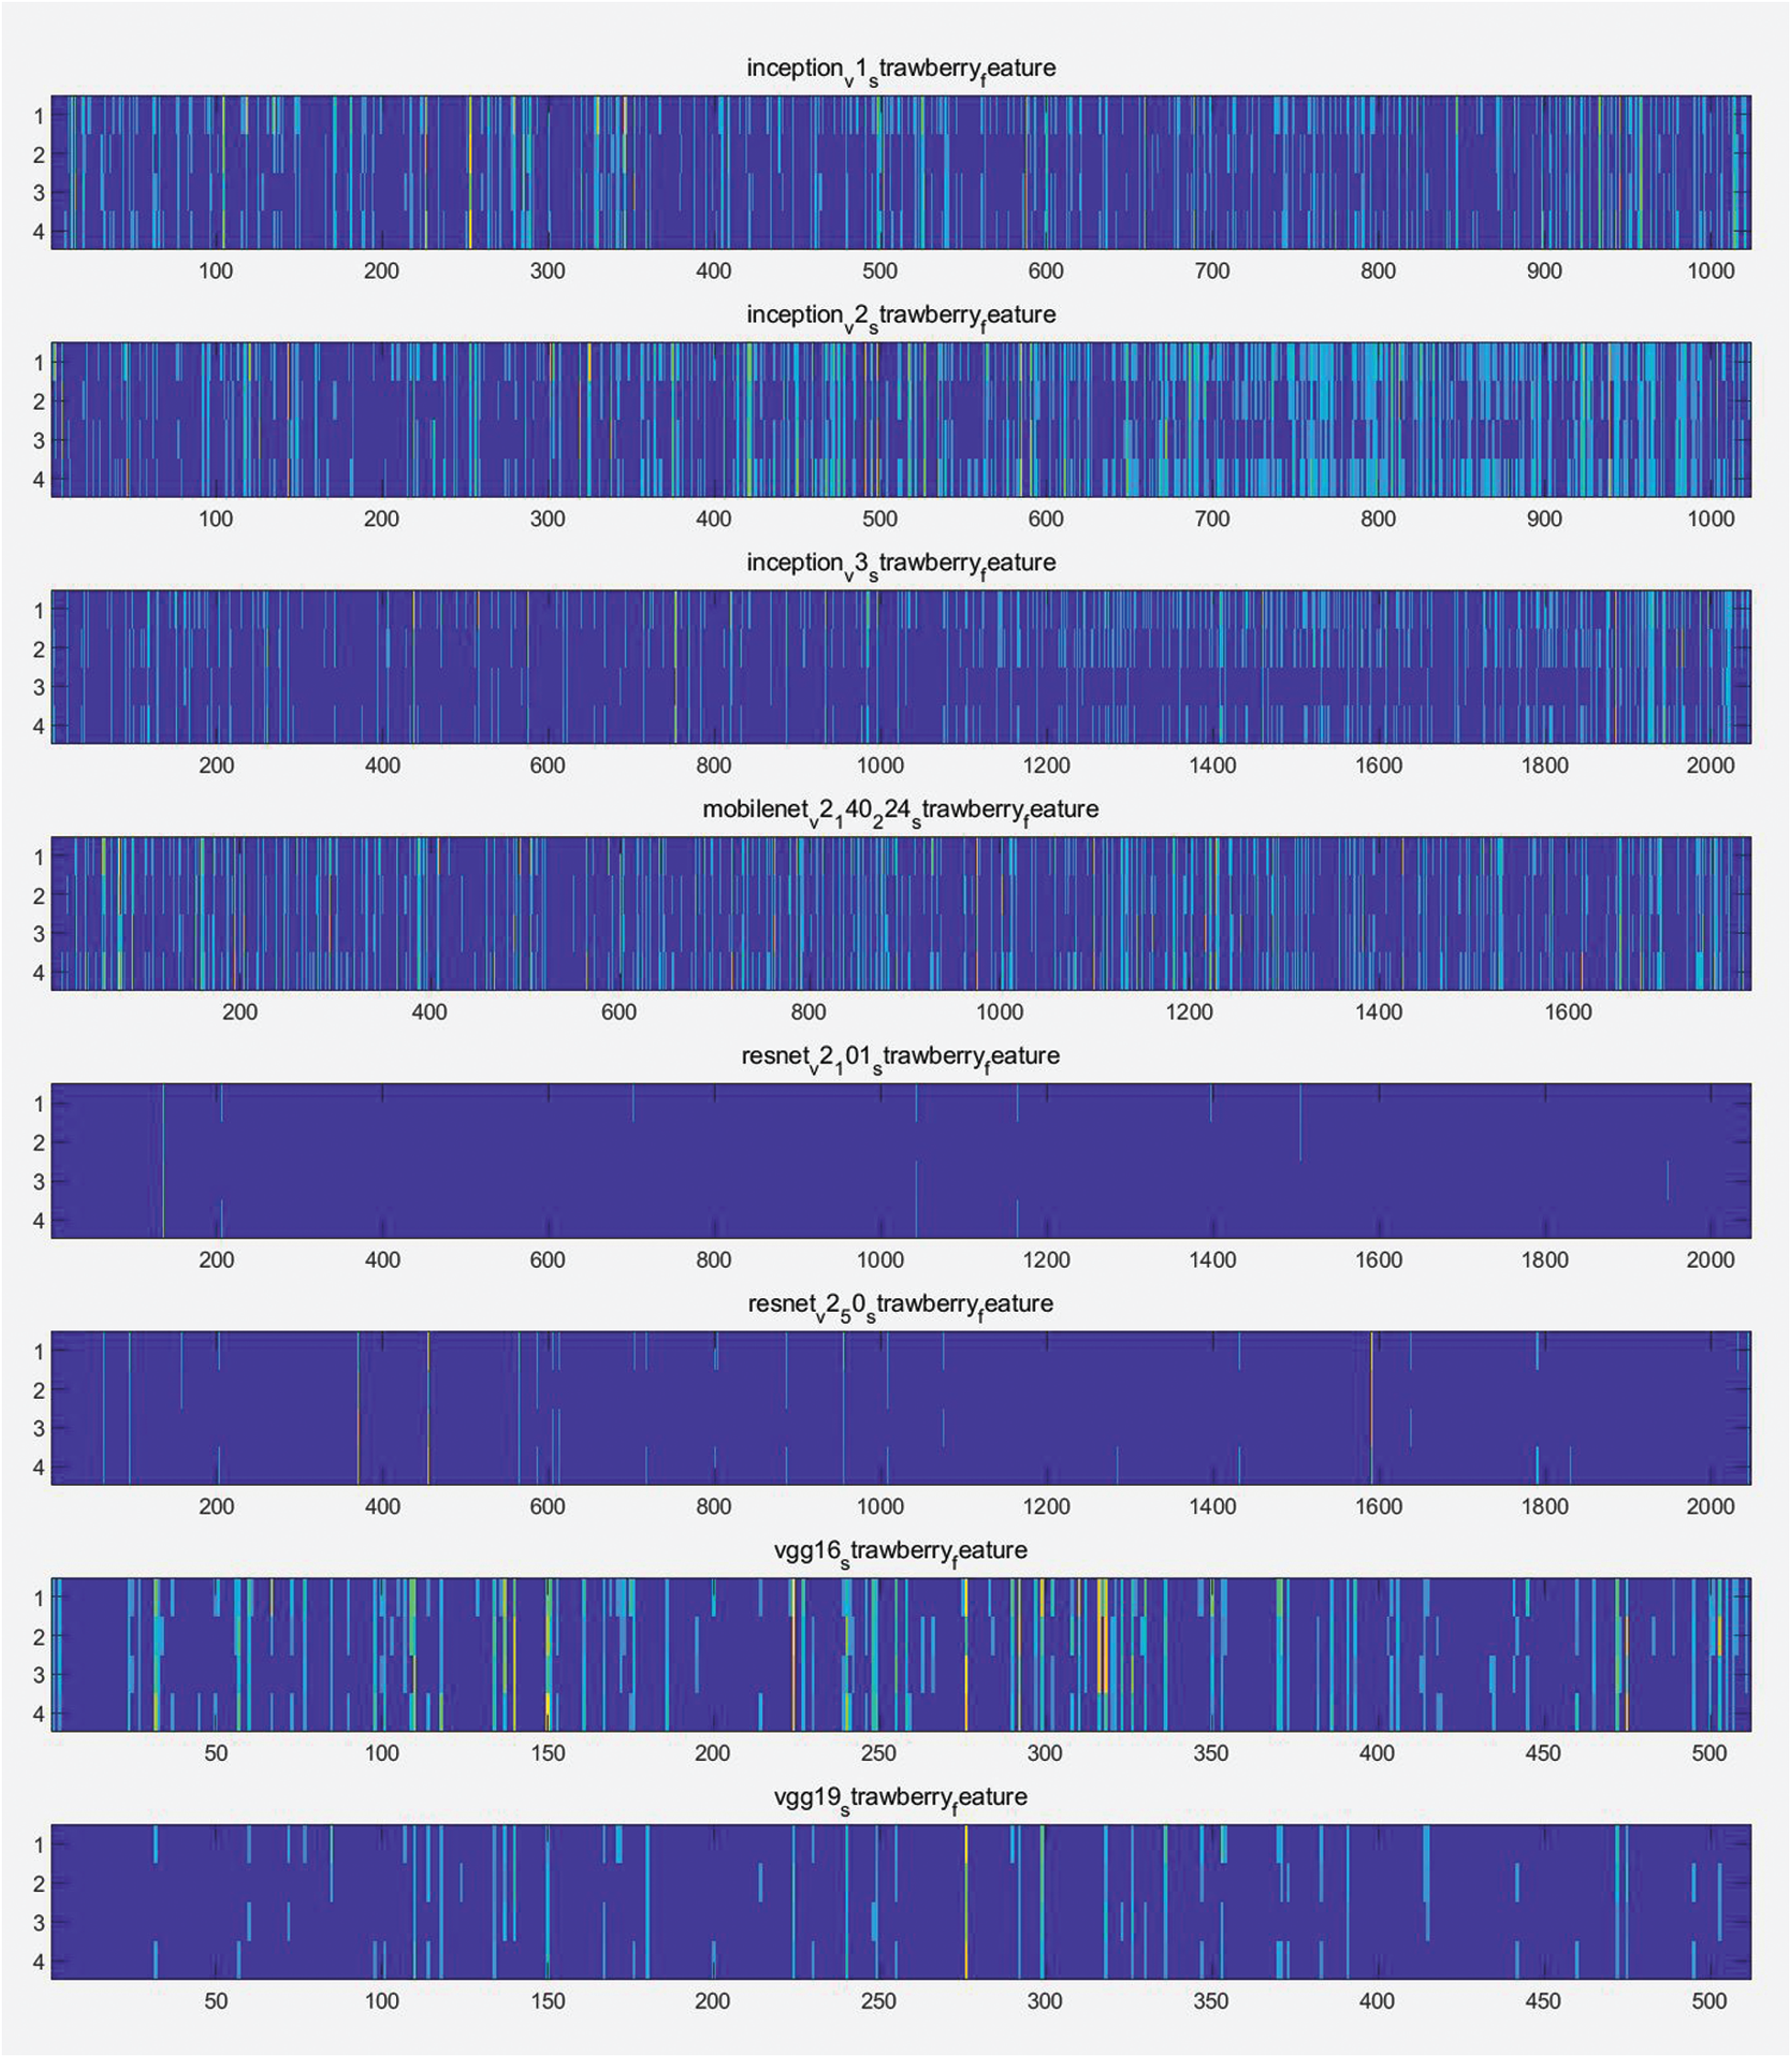
Figure 16: Heat map of the maturity feature vectors of strawberry images extracted by various DNNs
From the results in Tab. 2 and Fig. 17, we note that the combination of VGG16 and KSVM or VGG19 and MLP (softmax) showed the highest classification rate at approximately 83% and 82%, respectively. Second, the combination of Resnet 50 and SVM or Resnet 101 and SVM showed the best classification rates at 67% and 78%, respectively. Third, the combination of Inception v1 and SVM, the combination of Inception v2 and KSVM, and the combination of Inception v3 and KSVM showed the best classification rates at 81%, 80%, and 77%, respectively. Finally, the combination of MobileNet v2 and MLP showed the best classification rates at 78%. Overall, in the case of using tomato images, the classification rate for the combination of various DNN and ML methods was found to be generally similar to the results obtained from the strawberry images. Here, we express the feature vectors according to maturity as a heat map to see which part of the feature vectors extracted from various deep learning networks affects the determination of tomato maturity. In other words, we looked at which or how many feature vectors influence the discrimination of maturity. Fig. 18 shows the heat map of the feature vectors of tomato images extracted according to maturity by various DNNs. As shown in Fig. 18, Resnet v2 50 and 101 do not have many features for determining the ripeness of tomatoes. Therefore, the classification accuracy for maturity among the features generated by these two network feature extractors was lower than that of others. In the case of the Inception v1, v2, v3, and MobileNet v2 feature extractors, there are many feature values affected by tomato maturity, however, there are many common maturity feature values and unique values that are relatively inadequate. It was found that VGG16 and 19 had relatively many feature values suitable for determining maturity and consequently, high accuracy was shown for various classifiers.
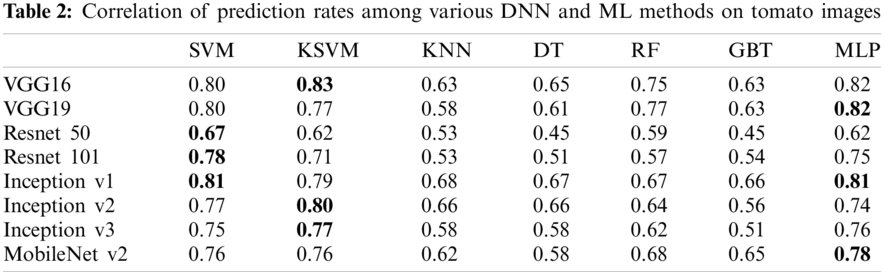
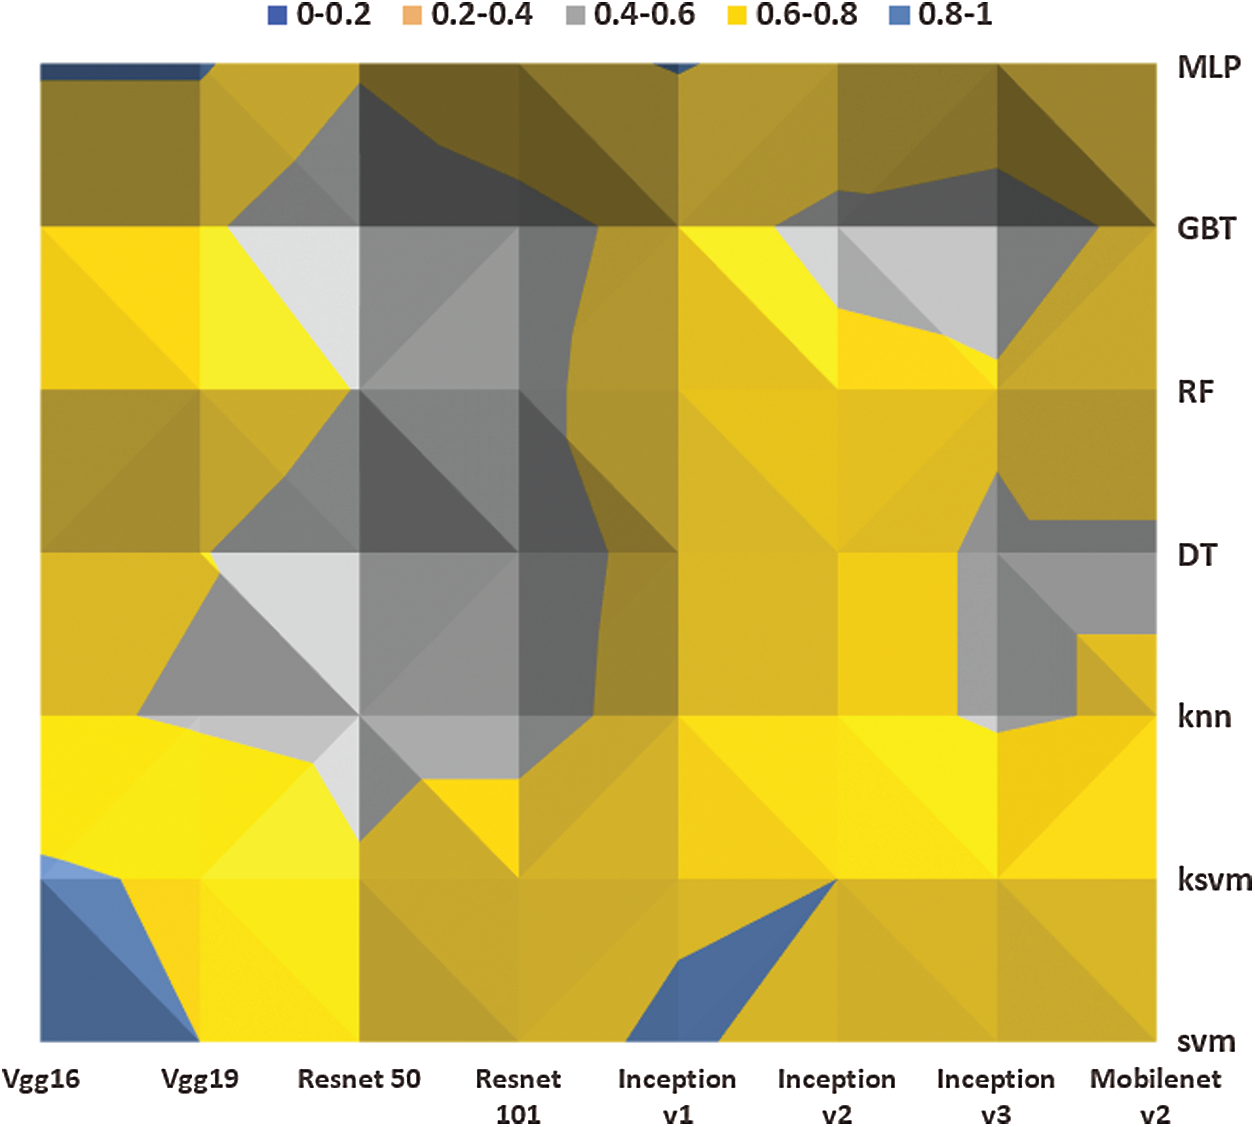
Figure 17: Geometric map of the ripening prediction rate correlations for tomatoes
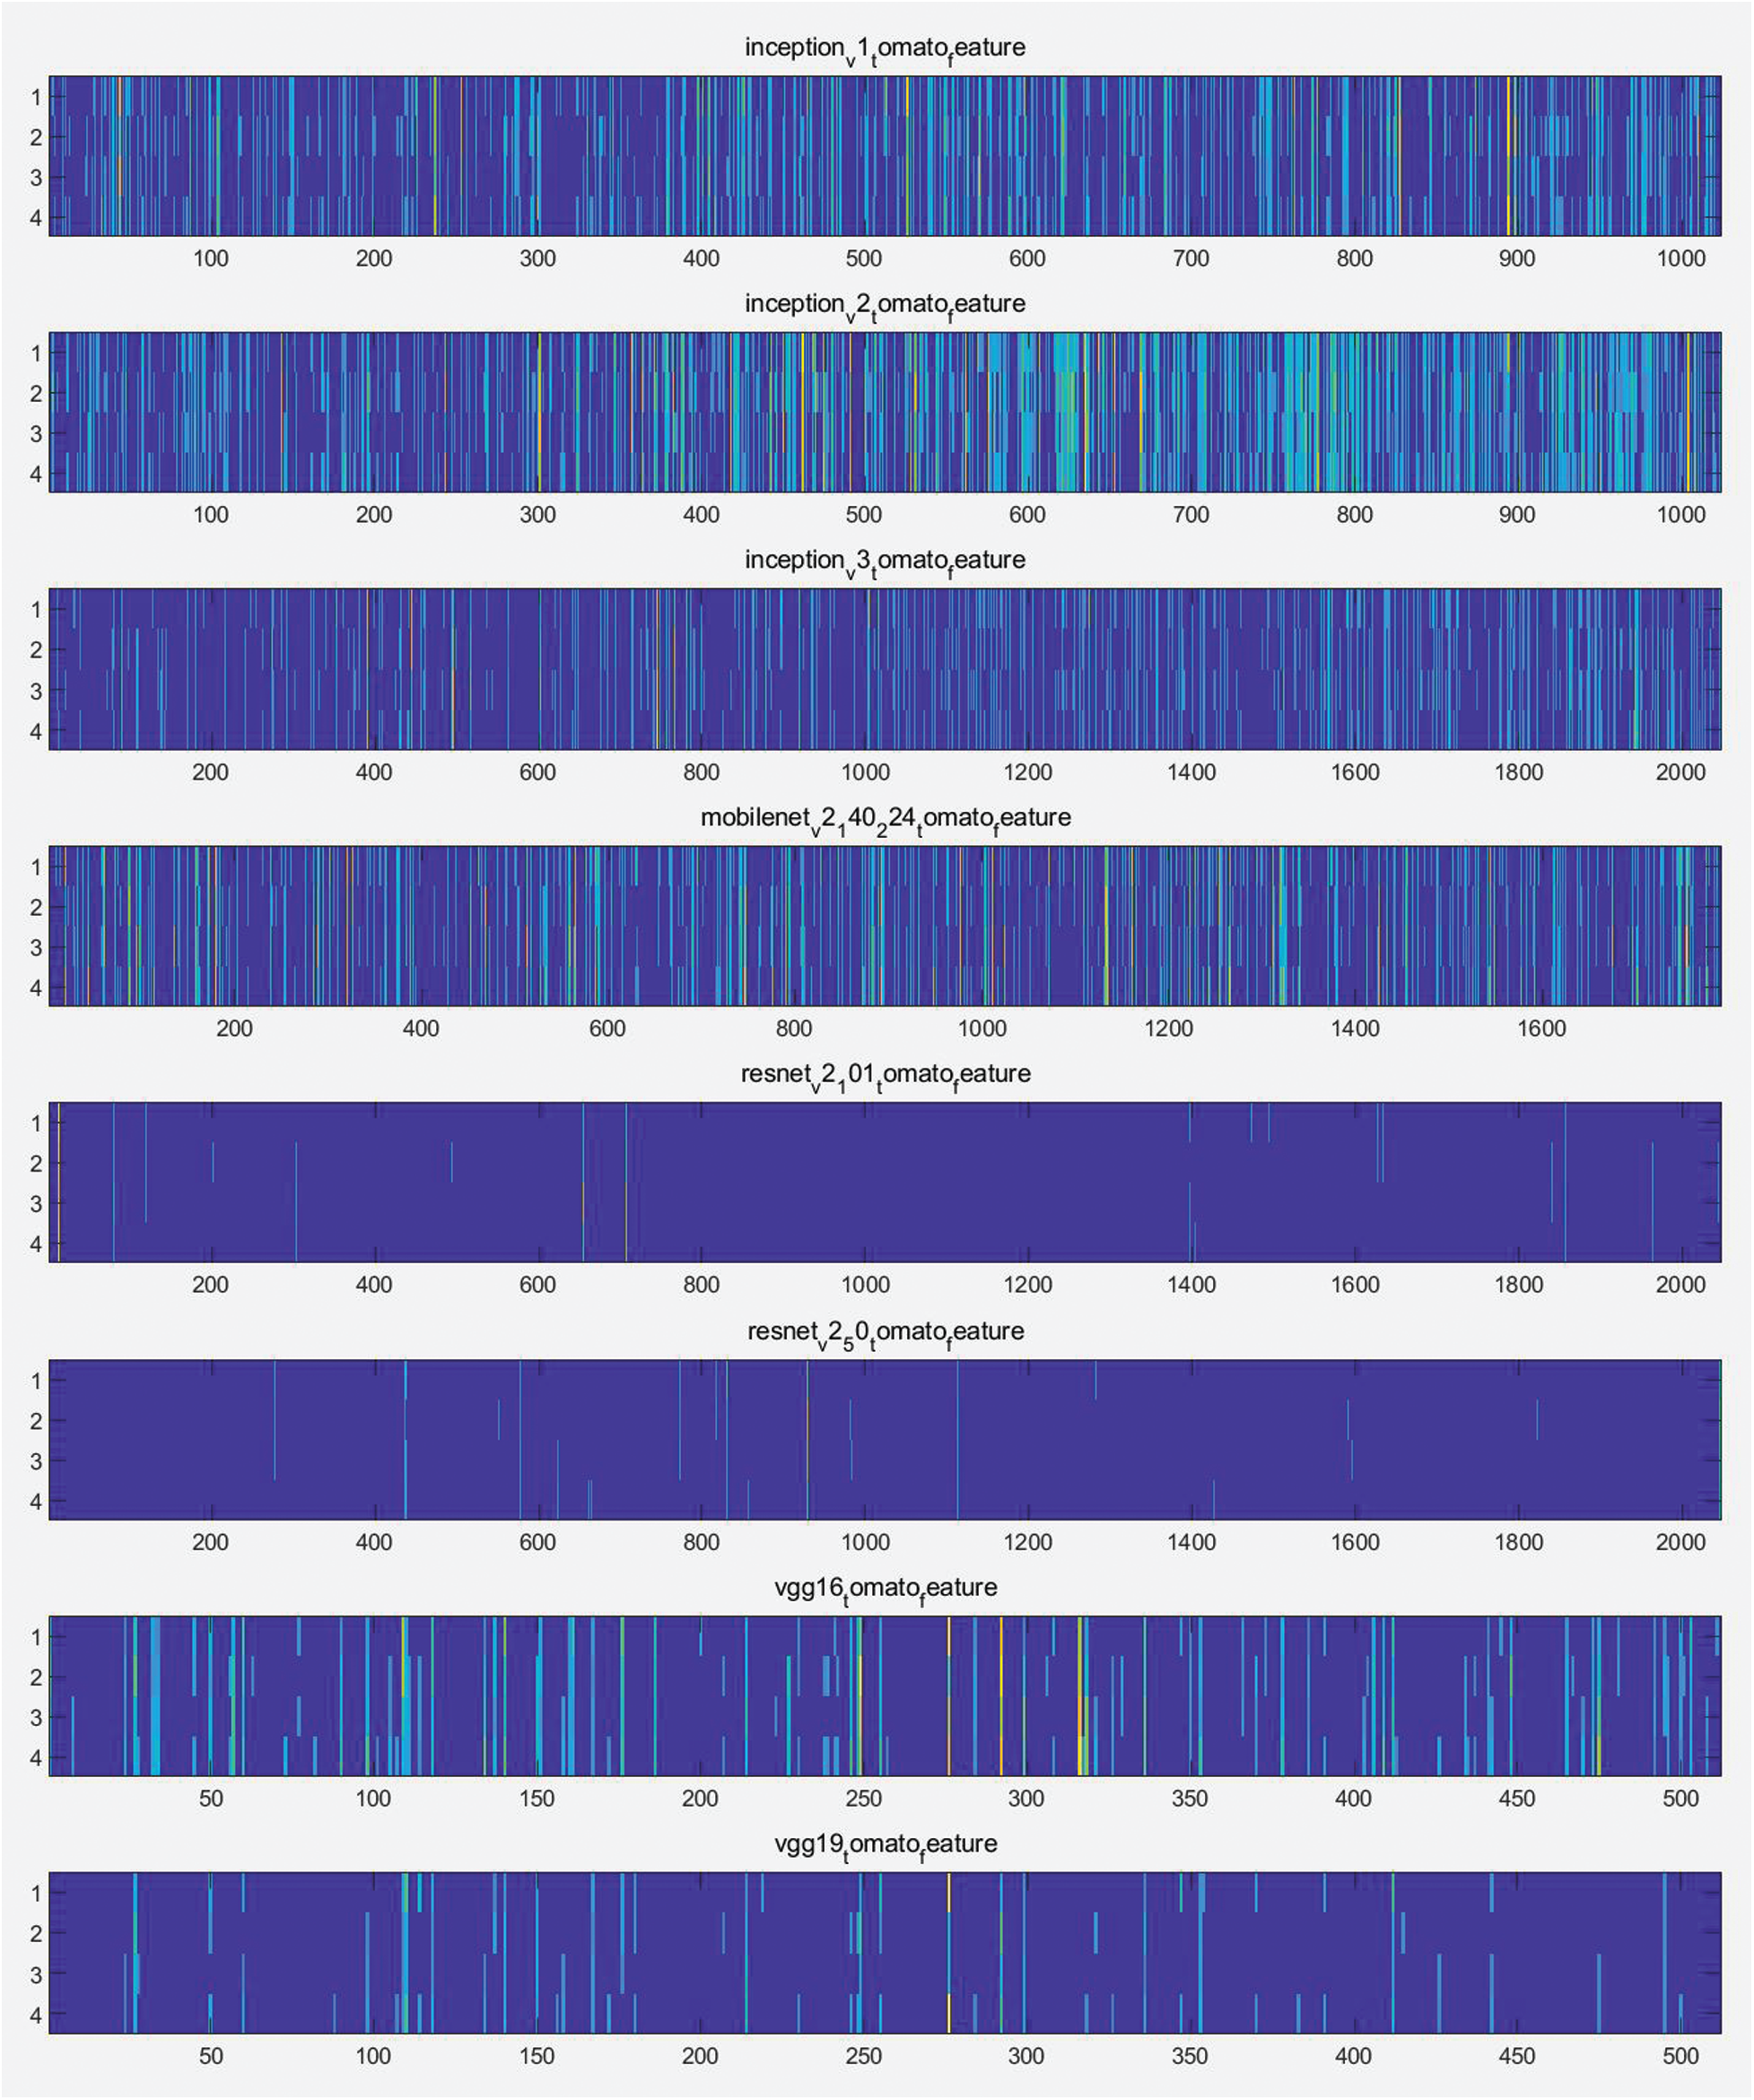
Figure 18: Heat map of maturity feature vectors of tomato images extracted by various DNNs
In this paper, we proposed a prediction system that can automatically discriminate the ripening stages of fruits such as strawberries and tomatoes from a sparse fruit image dataset. The proposed prediction system was constructed by combining various DNN and ML methods for application to a sparse fruit image dataset. DNNs are generally trained using the color, shape, and texture-based properties of the image. If the dataset is too small, the training cannot proceed normally, and accurate classification is not obtained. The softmax function is a non-locality function and one of several classes is selected by one of K coding in the last layer. When the training dataset is too small, the variance of the training error appears to be large. To overcome this, we attempted to find the optimal ML network instead of softmax function with a combination of DNNs and ML for extracting fruit ripeness features. In this system, the DNNs were used to extract feature vectors for classification from fruit images, and the ML method was used method for classifying the ripening stages using the extracted feature vectors. The proposed model’s is, initial pre-training using the ImageNet dataset published for various existing CNN models. Then, after replacing the layer that governs CNN classification with a pattern recognition model fine-tuning is conducted using the observed fruit image. Experiment were performed on the strawberry and tomato images that downloaded from the internet and the following results were obtained. First, we found that a combination of various DNNs and MLPs, or a combination of DNNs and SVM or KSVM generally produced excellent classification results. Conversely, the combination of various DNNs and statistical classification models shows that the overall classification rate was low. Second, in the case of using the tomato images, we found that the classification rate for the combination of the various DNN and ML methods was generally similar to the results obtained from the strawberry images. Resnet v2 50 and 101 did not identify many features for determining the ripeness of strawberries and tomatoes. Therefore, the classification accuracy for the maturity of the features generated by these two network feature extractors was lower than that of others. In the case of the Inception v1, v2, v3, and MobileNet v2 feature extractors, many feature values were affected by the maturity of the strawberries and tomatoes, however, many of the common maturity feature values and unique values relatively inadequate. It was found that VGG16 and 19 had relatively many feature values suitable for determining maturity, and consequently, they displayed high accuracy for various classifiers.
Acknowledgement: We would like to thank Editage (www.editage.co.kr) for English language editing.
Notes
1https://towardsdatascience.com/extract-features-visualize-filters-and-feature-maps-in-VGG16-and-VGG19-cnn-models-d2da6333edd0.
2https://www.kaggle.com/keras/resnet50.
3.
4https://kr.mathworks.com/matlabcentral/fileexchange/63621-knn-classifier.
5https://medium.com/machine-learning-bites/machine-learning-decision-tree-classifier-9eb67cad263e.
6https://medium.com/swlh/random-forest-and-its-implementation-71824ced454f.
7https://relguzman.blogspot.com/2018/04/gradient-boosting-decision-tree-gbdt.html.
8https://www.playandlearntocode.com/article/multilayer-perceptron-tutorial-building-one-from-scratch.
Funding Statement: This work was supported by Korea Institute of Planning and Evaluation for Technology in Food, Agriculture, Forestry (IPET) through Smart Plant Farming Industry Technology Development Program, funded by Ministry of Agriculture, Food and Rural Affairs (MAFRA) (421017-04), and the National Research Foundation of Korea (Project No. 2020R1F1A1067066) and (NRF-2019K2A9A1A06100184).
Conflicts of Interest: The authors declare that they have no conflicts of interest to report regarding the present study.
1. S. K. Kim, W. H. Cho, M. H. Na and I. S. Na, “Prediction of ripeness stages of fruit trees by combining machine learning techniques and deep learning networks,” in Proc. the 12th Int. Conf. on Internet (ICONI) 2020, Jeju, Korea, pp. 770–773, 2020. [Google Scholar]
2. P. Waldron, “$4.7 million to sips and bti for more tomato research,” [Online]. Available: https://btiscience.org/explore-bti/news/post/4-7-million-sips-bti-tomato-research/, 2014. [Google Scholar]
3. A. Fait, K. Hanhineva, R. Beleggia, N. Dai, I. Rogachev et al., “Reconfiguration of the achene and receptacle metabolic networks during strawberry fruit development,” Plant Physiology, vol. 148, no. 2, pp. 730–750, 2008. [Google Scholar]
4. N. Abdo, H. Kretzschmar, L. Spinello and C. Stachniss, “Learning manipulation actions from a few demonstrations,” in Proc. 2013 IEEE Int. Conf. on Robotics and Automation, Karlsruhe, Germany, pp. 1268–1275, 2013. [Google Scholar]
5. I. Goodfellow, Y. Bengio and A. Courville, “Chapter 6.2.2.3 softmax units for multinoulli output distributions,” in Deep Learning, USA: MIT Press. pp. 180–184, 2016. ISBN 978-0-26203561-3. [Google Scholar]
6. J. West, D. Ventura and S. Warnick, “Spring research presentation: A theoretical foundation for inductive transfer,” Brigham Young University, College of Physical and Mathematical Sciences, 2007. Archived from the original on 2007-08-01, Retrieved 2007-08-05, [Online]. Available: https://web.archive.org/web/20070801120743/http://cpms.byu.edu/springresearch/abstract-entry?id = 861. [Google Scholar]
7. R. Pandy, S. Naik and R. Marfatia, “Image processing and machine learning for automated fruit grading system: A technical review,” International Journal of Computer Application, vol. 81, no. 16, pp. 29–39, 2013. [Google Scholar]
8. V. Nambi, K. Thangavel, A. Manickavasagan and S. Shahir, “Comprehensive ripeness-index for prediction of ripening level in mangoes by multivariate modeling of ripening behavior,” International Agrophysics, vol. 31, pp. 35–44, 2017. [Google Scholar]
9. S. Maheswaran, S. Sathesh, P. Priyadharshini and B. Vivek, “Identification of artificially ripened fruits using smart phones,” in Proc. Int. Conf. on Intelligent Computing and Control, Coimbatore, India, pp. 1–6, 2017. [Google Scholar]
10. M. D. Torre, O. Zatarain, H. A. George, M. Munoz, J. Oblitas et al., “Multivariate analysis and machine learning for ripeness classification of cape gooseberry fruits,” Processes, vol. 7, no. 928, pp. 1–15, 2019. [Google Scholar]
11. F. M. A. Mazen and A. A. Nashat, “Ripeness classification of bananas using an artificial neural network,” Arabian Journal for Science and Engineering, vol. 44, pp. 6901–6910, 2019. [Google Scholar]
12. E. Mavridou, E. Vrochidou, G. A. Papakostas, T. Pachidis and V. G. Kaburlasos, “Machine vision system in precision agriculture for crop farming,” Journal of Imaging, vol. 5, no. 89, pp. 1–32, 2019. [Google Scholar]
13. M. N. Reza, I. S. Na, S. W. Baek and K. H. Lee, “Rice yield estimation based on K-means clustering with graph-cut segmentation using low-altitude UAV images,” Biosystems Engineering, vol. 177, pp. 109–121, 2019. [Google Scholar]
14. M. N. Reza, I. S. Na and K. H. Lee, “Automatic counting of rice plant numbers after transplanting using low altitude uav images,” International Journal of Contents, vol. 13, no. 3, pp. 1–8, 2017. [Google Scholar]
15. H. Muresan and M. Oltean, “Fruit recognition from images using deep learning,” Acta Univ. Sapientiae, Informatica, vol. 10, no. 1, pp. 26–42, 2018. [Google Scholar]
16. H. Vaviya, V. Vishwakarma, A. Yadav and N. Shah, “Identification of artificially ripened fruits using machine learning,” in Proc. 2th Int. Conf. on Advances in Science & Technology, Mumbai, India, pp. 1–6, 2019. [Google Scholar]
17. S. Sakib, Z. Ashrafi and M. A. B. Siddique, “Implementation of fruits recognition classifier using convolutional neural network algorithm for observation of accuracies for various hidden layers,” arXiv preprint arXiv: 1904.00783v6, 2019. [Google Scholar]
18. Z. Gao, Y. Shao, G. Xuan, Y. Wang, Y. Liu et al., “Real-time hyperspectral imaging for the infield estimation of strawberry ripeness with deep learning,” Artificial Intelligence in Agriculture, vol. 4, pp. 31–38, 2020. [Google Scholar]
19. M. Kusuma Sri, K. Saikrishna and V. Vinay kumar, “Classification of ripening of banana fruit using convolution neural networks,” in Proc. Int. Conf. on Innovative Advancement in Engineering and Technology, Jaipur National University, Jaipur, India, pp. 21–22, 2020. [Google Scholar]
20. J. L. Rojas-Aranda, J. I. Nunez-Varela, J. C. Cuevas-Tello and G. Rangel-Ramirez, “Fruit classification for retail stores using deep learning,” in Proc. Mexican Conf. on Pattern Recognition, LNCS 12088, Morelia, Michoacán, México, pp. 3–13, 2020. [Google Scholar]
21. J. Naranjo-Torres, M. Mora, R. Hernandez-Garcia, R. J. Barrientos, C. Fredes et al., “A review of convolution neural network applied to fruit image processing,” Applied Sciences, vol. 10, no. 3443, pp. 1–31, 2020. [Google Scholar]
22. I. S. Na, C. Tran, D. Nguyen and S. Dinh, “Facial UV map completion for pose-invariant face recognition: A novel adversarial approach based on coupled attention residual UNets,” Human-Centric Computing and Information Sciences, vol. 10, no. 45, pp. 1–17, 2020. [Google Scholar]
23. X. X. Niu and C. Y. Suen, “A novel hybrid CNN-SVM classifier for recognizing handwritten digits,” Pattern Recognition, vol. 45, pp. 1318–1325, 2012. [Google Scholar]
24. L. Zhou, Q. Li, G. Huo and Y. Zhou, “Image classification using biomimetric pattern recognition with convolutional neural networks features,” Hindawi Computational Intelligence and Neuroscience, vol. 2017, pp. 1–12, 2017. [Google Scholar]
25. M. Turkoglu and D. Hanbay, “Plant disease and pest detection using deep learning-based features,” Turkish Journal of Electrical Engineering & Computer Science, vol. 27, pp. 1636–1651, 2019. [Google Scholar]
26. W. Mo, X. Luo, Y. Zhong and W. Jiang, “Image recognition using convolutional neural network combined with ensemble learning algorithm,” in Proc. ICSP 2019, Conf. Series 1237, Xi’an, China, pp. 1–6, 2019. [Google Scholar]
27. H. Hasan, H. Z. M. Shafri and M. Habshi, “A comparison between support vector machine (SVM) and convolutional neural network (CNN) models for hyperspectral image classification,” IOP Conference Series: Earth and Environmental Science, vol. 357, pp. 1–10, 2019. [Google Scholar]
28. H. Basly, W. Ouarda, F. E. Sayadi, B. Ouni and A. M. Alimi, “CNN-Svm learning approach based human activity recognition,” in Proc. ICISP, LNCS 12119, Marrakech, Morocco, pp. 271–281, 2020. [Google Scholar]
29. D. N. Tai, I. S. Na and S. H. Kim, “HSFE network and fusion model based dynamic hand gesture recognition,” KSII Transactions on Internet and Information Systems, vol. 14, no. 9, pp. 3924–3940, 2020. [Google Scholar]
30. H. D. Nguyen, I. S. Na, S. H. Kim, G. S. Lee, H. J. Yang et al., “Multiple human tracking in drone image,” Multimedia Tools and Applications, vol. 78, pp. 4563–4577, 2019. [Google Scholar]
31. G. S. Choe, S. B. Lee and J. H. Nang, “CNN-based visual/auditory feature fusion method with frame selection for classifying video events,” KSII Transactions on Internet and Information Systems, vol. 13, no. 3, pp. 1689–1701, 2019. [Google Scholar]
32. C. Cortes and V. Vapnik, “Support-vector networks,” Machine Learning, vol. 20, pp. 273–297, 1995. [Google Scholar]
33. Y. LeCun, “The MNIST database of handwritten digits,” Courant Institute, NYU Corinna Cortes, Google Labs, New York Christopher J.C. Burges, Microsoft Research, Redmond, 1998. [Google Scholar]
34. CIFAR-10 (Canadian Institute For Advanced Research“AI progress measurement,” Electronic Frontier Foundation. 2017-06-12. Retrieved 2017-12-11. 2017. [Google Scholar]
35. T. P. Barnett and R. Preisendorfer, “Origins and levels of monthly and seasonal forecast skill for United States surface air temperatures determined by canonical correlation analysis,” Monthly Weather Review, vol. 115, no. 9, pp. 1825–1850, 1987. [Google Scholar]
36. A. Gonfalonieri, “5 way to deal with the lack of data in machine learning,” in SAS Global Forum 2020 (Virtualpp. 1–9, 2019. [Google Scholar]
37. C. Shorten and T. M. Khoshgoftaar, “A survey on image augmentation for deep learning,” Journal of Big Data, vol. 6, no. 60, pp. 1–38, 2019. [Google Scholar]
38. W. Zhao, “Research on the deep learning of the small sample data based on transfer learning,” in Proc. AIP Conf. Proc. 1864, Chongqing, China, pp. 1–8, 2017. [Google Scholar]
39. S. Feng, H. Zhou and H. Dong, “Using deep neural network with small dataset to predict martial defects,” Materials and Design, vol. 162, pp. 300–310, 2019. [Google Scholar]
40. K. Simonyan and A. Zisserman, “Very deep convolutional networks for large-scale image recognition,” arXiv preprint arXiv: 1409.1556, 2014. [Google Scholar]
41. K. He, X. Zhang, S. Ren and J. Sun, “Deep residual learning for image recognition,” arXiv preprint arXiv: 1512.03385, 2015. [Google Scholar]
42. C. Szegedy, W. Liu, Y. Jia, P. Sermanet, S. Reed et al., “Going deeper with convolutions, inception network,” arXiv preprint arXiv: 1409.4842v1, 2014. [Google Scholar]
43. A. G. Howard, M. Zhu, B. Chen and D. Kalenichenko, “Mobilenets: Efficient convolutional neural networks for mobile vision applications,” arXiv preprint arXiv: 1704.04861, 2017. [Google Scholar]
44. M. Sandler, A. Howard, M. Zhu, A. Zhmoginov and L. C. Chen, “Mobilenetv2: Inverted residuals and linear bottlenecks,” arXiv preprint arXiv: 1801.04381v4, 2019. [Google Scholar]
45. C. Cortes and V. N. Vapnik, “Support-vector networks,” Machine Learning, vol. 20, no. 3, pp. 273–297, 1995. [Google Scholar]
 | This work is licensed under a Creative Commons Attribution 4.0 International License, which permits unrestricted use, distribution, and reproduction in any medium, provided the original work is properly cited. |