DOI:10.32604/cmc.2021.018901
| Computers, Materials & Continua DOI:10.32604/cmc.2021.018901 | |
| Article |
Fake News Detection on Social Media: A Temporal-Based Approach
Department of Computer Engineering, Yeungnam University, Gyeongsan, 38541, Korea
*Corresponding Author: Yeong-Seok Seo. Email: ysseo@yu.ac.kr
Received: 24 March 2021; Accepted: 25 April 2021
Abstract: Following the development of communication techniques and smart devices, the era of Artificial Intelligence (AI) and big data has arrived. The increased connectivity, referred to as hyper-connectivity, has led to the development of smart cities. People in these smart cities can access numerous online contents and are always connected. These developments, however, also lead to a lack of standardization and consistency in the propagation of information throughout communities due to the consumption of information through social media channels. Information cannot often be verified, which can confuse the users. The increasing influence of social media has thus led to the emergence and increasing prevalence of fake news. In this study, we propose a methodology to classify and identify fake news emanating from social channels. We collected content from Twitter to detect fake news and statistically verified that the temporal propagation pattern of quote retweets is effective for the classification of fake news. To verify this, we trained the temporal propagation pattern to a two-phases deep learning model based on convolutional neural networks and long short-term memory. The fake news classifier demonstrates the ability for its early detection. Moreover, it was verified that the temporal propagation pattern was the most influential feature compared to other feature groups discussed in this paper.
Keywords: Artificial intelligence; deep learning; fake news; rumor; smart city; data analysis
A smart city is a futuristic and intelligent city in which the resources required for its operation are utilized efficiently and optimally. Advanced disruptive technologies such as the Internet of Things (IoT) are leveraged to create these hyper-connected yet eco-friendly societies [1–8]. In these cities, data on healthcare, assets, and traffic is collected using various techniques such as sensors, IoT, etc., and translated into tangible information that can be used for the residents’ benefits. People in a hyper-connected society also consume and generate a large amount of online data. Companies can analyze this data to provide customized online content on channels such as online streaming platforms, online stores, and social media.
Social media is now the preferred avenue for common people to exchange information and share images, videos, etc. [9–15]. The speed and reach of the propagation of information through social media often overwhelms traditional news media. For instance, real-time information on unexpected accidents (e.g., natural disasters) is usually captured first on social media [16–20]. Flanagin et al. [21] show that social media is a highly influential news media for modern people. Posts by popular and influential personalities (i.e., influencers described in Section 1.2) are usually considered highly reliable [22].
Unfortunately, not all information on social media is real news. Social media generates a massive amount of information and users are exposed to it continuously and unconditionally. Information on social media can be unreliable, and it is difficult to judge its authenticity [23]. Most information on social media is shared to make news headlines [24]. Thus, there is a high likelihood of social media being abused politically and economically. Lately, false information shared in the garb of actual news has been confusing and misleading many users. In the past, false information was slowly propagated, and its range of influence was local. However, in today’s hyper-connected society, individuals are connected across geographical boundaries. Because the speed of propagation is also very fast, it is important to identify false information early [25,26].
Many social media providers have made efforts to identify false information. However, most of them rely on user reports or experiments [27]. Even to use fact-checking websites such as Snopes, FactCheck, PolitiFact, etc., extensive manual effort is required. Thus, it has now become essential to provide automated content reliability evaluation services to social media users [28,29].
1.2 The Powerful Spreaders of False Information
Globally, Twitter and Facebook are the most popular social media platforms. People are attracted to Twitter because they can communicate informally with popular people such as movie actors or sports players. Twitter provides a subscription-like function, the follow button. Twitter users can obtain information from other users and can check their awareness, reputation, and influence based on the number of followers. People with many followers, called influencers, have a strong impact on their field of expertise. Because a post by the influencers is shared with their followers, the propagation power of information is stronger than that of common users. Twitter users share their opinions with followers by posting tweets, including texts, pictures, and videos. The followers express their interest in the tweet using buttons such as reply, like, and retweet. The retweet function is the most influential function because, on retweeting, a person’s follower shares the tweet with his or her followers. This can translate into a long cycle, which, in turn, popularizes the original tweet manifold.
Retweets may have a significant influence in certain fields because of their strong propagation power. However, retweets also can cause social upheavals. Retweets are highly likely to be abused by individuals or groups with malicious purposes. During the 2016 US presidential election, fake news spread indiscriminately through retweets, confusing many voters [30]. Moreover, because retweets exhibit a powerful real-time propagation of information, they have a strong influence even in emergencies such as natural disasters. During the 2010 earthquake in Chile, many rumors spread through retweets immediately after the accident, which aggravated confusion and anxiety among the locals [31].
In 2015, the function of the retweet was updated, and it was called a quote retweet by some researchers [32–36]. Because the original retweet did not contain the user’s opinion, it was possible only to express reactions such as interest and agreement. Therefore, the users do not retweet if they are not interested in a particular tweet or if there is a feeling of rejection. In contrast, a quote retweet can include user’s opinions, unlike the original retweet. Thus, users can express their opinions on the quoted tweet as positive, negative, or neutral. According to Garimella et al. [32] study, the number of cases where users use quote retweets instead of retweets is increasing. In addition, because a quote retweet not only spreads information but also includes the user’s official stance, it can provide a new pattern of spreading information. Therefore, quote retweets can potentially be more effective than original retweets in detecting false information. In this study, we analyze this new pattern of information diffusion using quote retweets and propose an effective methodology to detect fake news. This study introduces a methodology for detecting fake news using temporal propagation patterns of quote retweets to protect people who are exposed to false information as they are bombarded with online information in the hyper-connected world of smart cities. First, we collect news from Kaggle and analyze Twitter content that mentions each news item. Then, the temporal news propagation pattern based on quote retweets is extracted from the collected content and analyzed using visualization and statistics. We also identify the features of the content that spread fake news and classify them into four groups. We processed the time-series dataset for learning by using the temporal information of the identified features. Finally, to verify our methodology, we created a fake news classifier using convolutional neural network (CNN) and long short-term memory (LSTM)-based two-phase deep learning to evaluate its performance. The summary of the contributions of this study is as follows:
• To detect fake news more efficiently, we introduce a methodology for detecting fake news based on the temporal propagation pattern of quote retweets.
• We identify and define new features of fake news using visualization and statistics from the temporal propagation patterns of quote retweets.
• We define a time-series dataset to train a deep learning-based fake news classifier that combines CNN and LSTM.
• We verify the effectiveness of our methodology by comparing it with existing content-based fake news detection techniques.
The rest of this paper is organized as follows: Section 2 introduces related works; the propagation graph-based fake news detection method is presented in Section 3; we evaluate the performance of the proposed method in Section 4; and finally, Section 5 concludes the paper.
2.1 Content Feature-Based Reliability Verification
To identify fake news or rumors, many researchers have analyzed the features of content that spread fake news from Twitter. Studies on content feature-based reliability verification use the information posted on Twitter to spread the news. Features used in content-based systems are mainly defined as basic, linguistic, user-based, and propagation and network-based groups [33,34].
The basic group includes intuitive information such as hashtags (#) and mansions (@) in tweets, retweets, likes, and replies, and can be collected using Selenium or Tweepy application programming interfaces (APIs). The linguistic group includes information such as tone of speech, positive or negative, extracted from the text in the tweet. To extract linguistic information from text, additional processing using natural language processing (NLP) technique is necessary. The user-based group contains information on the influence of the user who wrote the tweet, such as the number of followers, who they are following, and the number of tweets. The propagation and network-based groups contain information such as temporal propagation features and propagation depth. Propagation and network-based features are quite complicated and it is difficult to collect and process data to trace the network between users [34].
Castillo et al. [33] defined message-based, user-based, topic-based, and propagation-based groups to verify the reliability of online content. In addition, the differences between rumors and non-rumors were analyzed by extracting group-specific features from the tweets. Then, the extracted features were machine-learned to verify the performance of the rumor classifier. Kwon et al. [34,35] identified rumors and found a phenomenon in which rumors were spread for a short time in a low-density network. User-based, linguistic, temporal, and network-based feature groups were defined, and through rumor classification experiments, it was observed that temporal groups have a great influence on rumor classification. Yang et al. investigated rumors from the Sina Weibo platform. They argued that the type of client that created the content and the platform on which the content is uploaded are the key features of rumor detection. They further defined the client-based features and the location-based features from the content obtained from Sina Weibo for further evaluation. The experiment showed that the rumor classifier with learned client-based features and location-based features slightly (5%) improved the performance compared to classifiers in which they were not trained. Jang et al. analyzed the features of quote retweets that spread news using various visualizations and machine learning and showed that the quote retweets were effective in propagating fake news [36].
2.2 User Stance-Based Reliability Verification
Social media tend to adopt a stance on the accessed information. A user’s stance is generally expressed as agreement, disagreement, neutrality, and others. Many researchers have expressed it in various forms. Maddock et al. [37] defined the stance of a user who heard a specific rumor as misreport, guess, modification, question, neutral, disagree, and others. Procter et al. [38] classified user stances as agree, disagree, objection, and comment. Zubiaga et al. [39] divided it into support, comment, and mock. Mendoza et al. [40] highlighted that there is a strong correlation between user stance and reliability and found that many users refute a rumor uncovered as fake with negative opinions. A study by Jin et al. [41] showed that users hearing the news that seems important immediately portray their stance and the stance is effective in detecting fake news. He mentions that there is a high possibility that users who come across a tweet doubted to be fake news post negative opinions. Thus, he proposed building a reliability network based on stances about Twitter news. He created a pair of <topic, viewpoint> using latent Dirichlet allocation (LDA) and then classified them into supporting and objecting tweets related to specific news using k-means clustering. After the classification, in the news-propagation network, news showing a high ratio of objecting tweets is classified as fake news. Jin et al.’s method shows a slight improvement in classification accuracy (5%–9%) compared to Kwon et al.’s method.
Stance detection of social media users is of interest to many researchers, and hence it is brought up in competitions such as SemEval and FNC-1 [42,43]. SemEval is an international NLP workshop for developing semantic analysis techniques. In SemEval, various challenges, including the detection of user sentiment and the stance, are performed. Various teams participate in this annual event that began in 2007 [44–46].
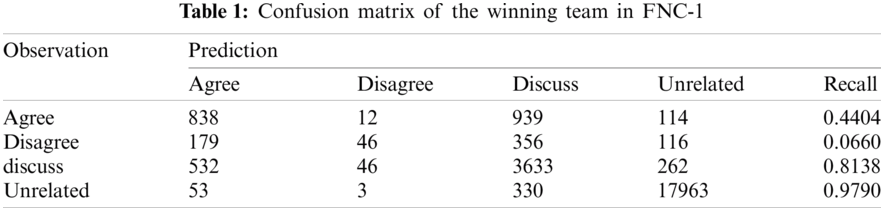
Organized in 2017, the Fake News Challenge stage 1 (FNC-1) was adopted as the first stage to detect fake news. In this competition, the classification accuracy of various stances for news such as “Agree,” “Disagree,” “Discuss,” and “Unrelated” is evaluated. Tab. 1 presents the confusion matrix of the FNC-1 winner [47]. In Tab. 1, the classification accuracy is not satisfactory compared to other classes because the ratio of the class is extremely biased to “Unrelated.” Thus, we assume that it is difficult to identify a small number of agreement and objection classes. Although there are studies for improving their performance, the detection of user stances remains a very difficult challenge [48,49].
This section introduces a fake news detection technique using the temporal propagation pattern of quote retweets. Fig. 1 is an overview of the fake news detection methodology using the temporal propagation pattern of the quote retweet we propose. It is composed of time series dataset processing using the propagation pattern of quote retweet and fake news classifier based on deep learning. Fig. 1a summarizes the process of constructing a training dataset based on the propagation tree of a quote retweet for fake news detection. The data collected from Twitter are processed after feature analysis and processed into a training dataset for fake news classification. Then, the fake news classifier applies deep learning learns the processed training dataset, as shown in Fig. 1b.
The training dataset for the fake news classifier was processed as shown in Fig. 1a. The headlines, content, and the reliability of the news were collected from Kaggle. Selenium and Tweepy API were used as data collection tools and the Twitter contents were stored in a database using Jang et al. [36] method. Twitter contents stored in the database undergo pre-processing including natural language processing to extract additional features. In addition, the schema of the table that is merged into one table through join operation is shown in Tab. 2. Tab. 2 shows the features of the collected content, grouped into four types. The feature group consists of basic, linguistic, user-based, and propagation pattern-based quote retweets. The propagation feature group of quote retweets is composed of the usage ratio and propagation depth of quote retweets denoted as HtoL (high to low), HtoH, LtoH and LtoL.
3.2 Features Analysis of Twitter Content that Spread News
Fig. 2 shows the spreading tree of tweets and quote retweets that spread the news over time. The root of the tree (blue, depth 0) refers to news articles and the child nodes of the root (depth 1) are tweets that spread these news articles. Child nodes of a level 1 node are quote retweets, and all nodes above level 1 are quote retweets. In addition, the red nodes are tweets written by influencers.
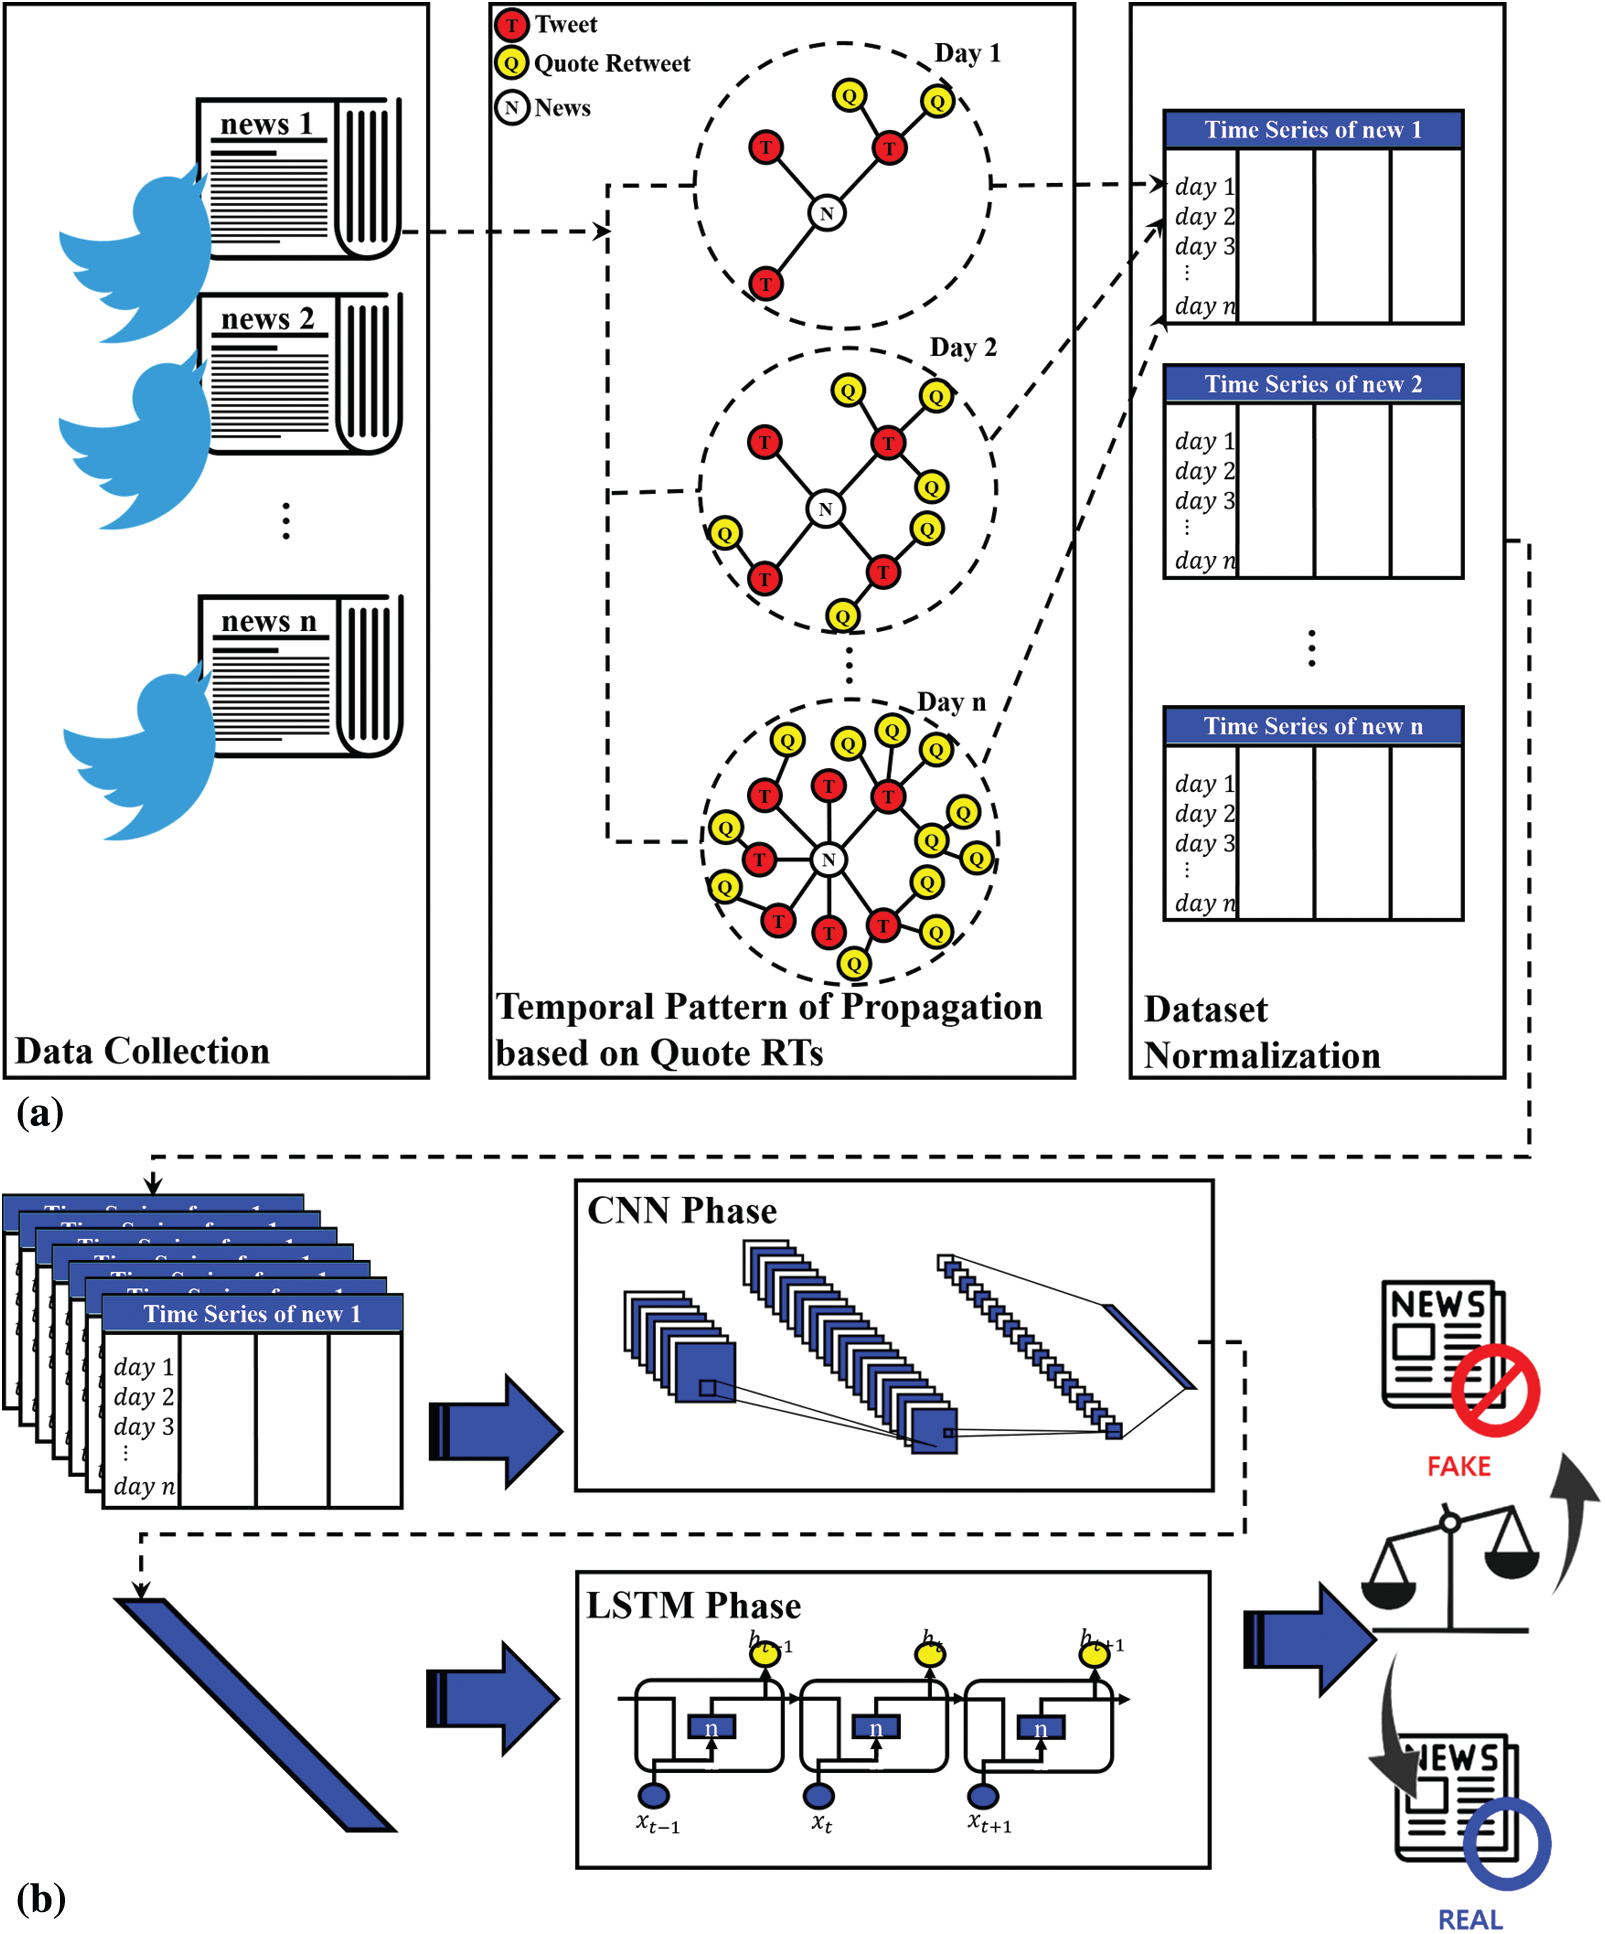
Figure 1: Overview of the fake news detection methodology (a) Dataset processing (b) Fake news classifier two phases deep learning
As shown in Fig. 2, there are several differences between the spreading patterns of fake news and real news. As time passes, it can be seen that the depth of the propagation tree of real news becomes deeper than that of fake news. This means that the frequency of quote retweets is higher in the propagation tree of real news. In addition, the relatively low frequency of using quote retweets in fake news propagation patterns means that users who encounter fake news are very cautious about using quote retweets. This is because the quote retweet projects an official stance of the user. Therefore, it is suspected that the main spreading method of fake news is through tweets or normal retweets that directly mention news headlines or links. In addition, there is a difference in the ratio of influencers between the two propagation patterns. Generally, the spread of information from influencers is much stronger than that of general users. As time passes, relatively more influencers are included in the distribution tree of real news. The reason is that if influencers spread fake news, their reputation could be adversely affected. Therefore, it is suspected that the more popular the users, the more cautious they are about spreading information.
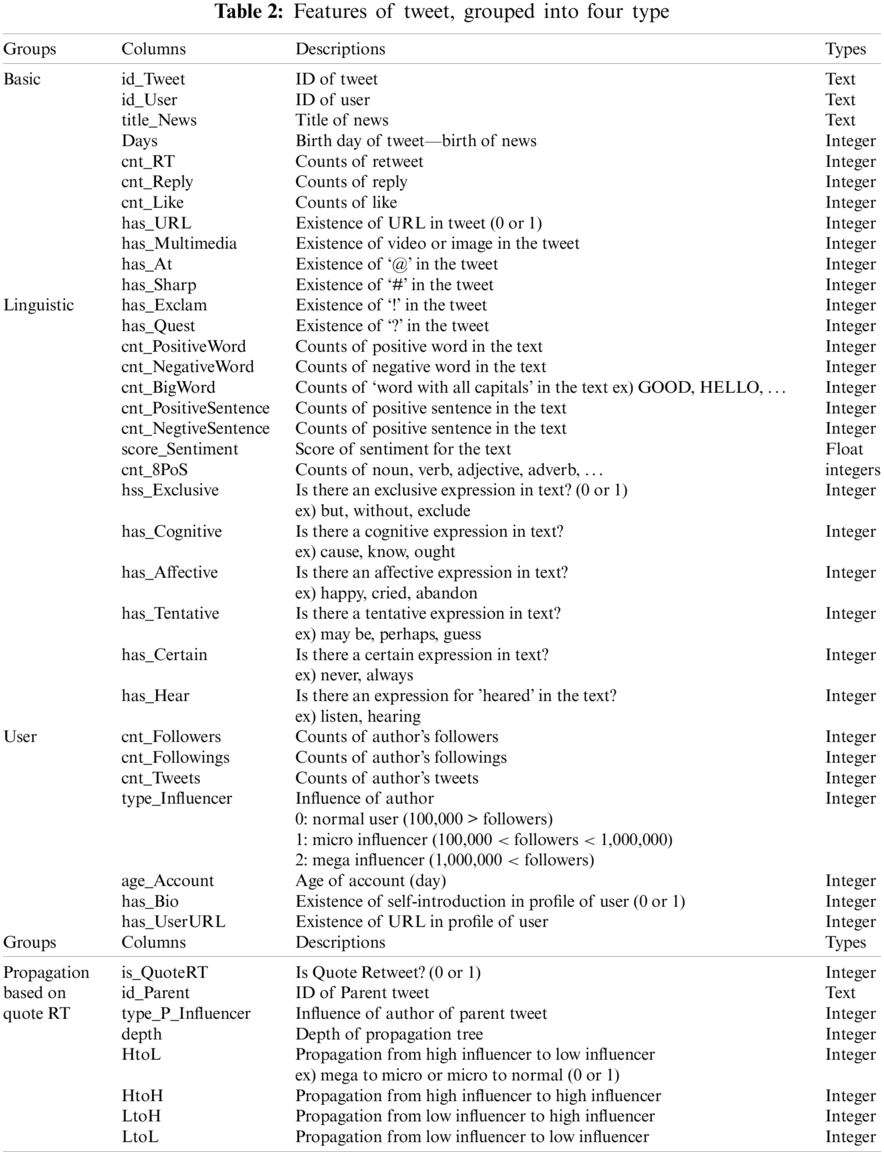
Figure 2: Temporal propagation patter of fake and real news (blue: root, red: tweets or quote RTs of influencer) (a) Temporal propagation pattern of fake news (b) Temporal propagation pattern of real news
Fig. 3 depicts a box plot comparing the average counts of retweets aggregated for each news item, the ratio of quote retweets, the counts of followers, and the average age (days) of the author’s account. According to the propagation trees shown in Fig. 3a, there is no noticeable difference in the frequency of retweets between real and fake news. Because the spread of news by retweets has a simpler procedure than a quote retweet, a retweet can be easily exploited to propagate fake news. In contrast, Fig. 3b shows a significant difference between the two boxes depicting the frequency of use of quote retweets. In the case of real news, it can be seen that the frequency of quote retweets is high, and it can be assumed that the official reaction of users to real news is more active. Fig. 3c shows that there is a very large difference between the range of the average number of followers of fake news and real news. In the real news representation, we can see that a diverse user base, including influencers, is included, which established that the more popular the users, the more cautious they are about suspicious information. Fig. 3d shows that the average age (days) of user accounts is lower in the case of fake news. It is suspected that this was an account that someone suddenly created to spread fake news.
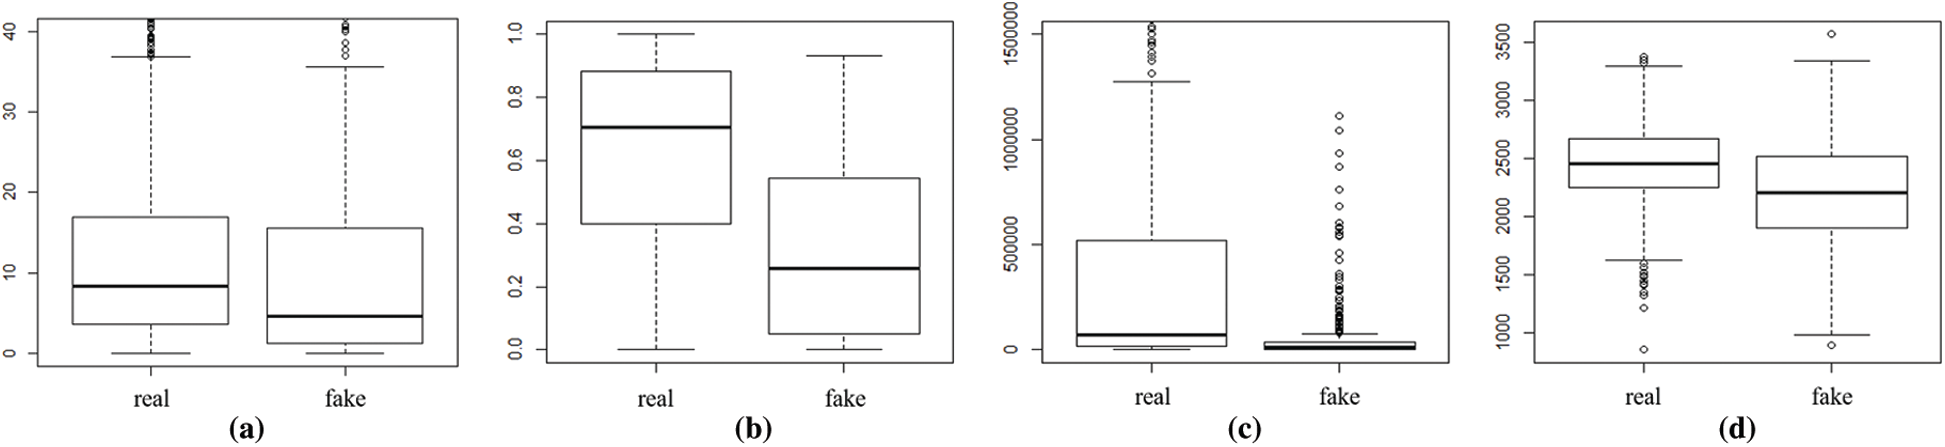
Figure 3: Box plot comparing the (a) Average of RTs (b) Rate of quote RTs (c) Average of followers and (d) Average of age (day) of account
3.3 Training Dataset Processing and Fake news Classification Based on Deep Learning
We processed the time series dataset for training of the classifier using the registration date information of the contents from the collected data. The procedure is shown in Fig. 4. Each step-by-step description is as follows.
3.3.1 Step 1. Aggregation by News and Day
Contents of tweets within n days after the news is generated may be filtered using the difference between the news registration date and the tweet registration date from the contents of the previous tweets aggregated by news. The features of tweets (all elements of the four feature groups) are aggregated for each news from day 1 to day n using filtering. For example, if the features from Day 1 to Day 3 of each news are respectively aggregated, the aggregate results up to day 1 of each news, the aggregate results up to day 2, and the aggregate results up to day 3 are respectively generated.
3.3.2 Step 2. Integration and Sort
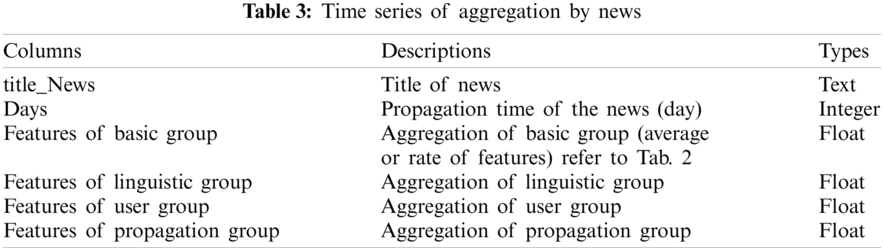
Each aggregate result from day 1 to day n created in Step 1 are integrated into one table, and its schema is expressed in Tab. 3. Then, the integrated table is sorted by news and day in ascending order. In the integrated table defined by the schema of Tab. 3, one record is the aggregation of the features of tweets registered within a few days after a specific news occurs, and we can analyze the aggregation of features over time of each news by referring to the integrated table. As a result, the integrated table expresses the temporal propagation features of each news in a time series.
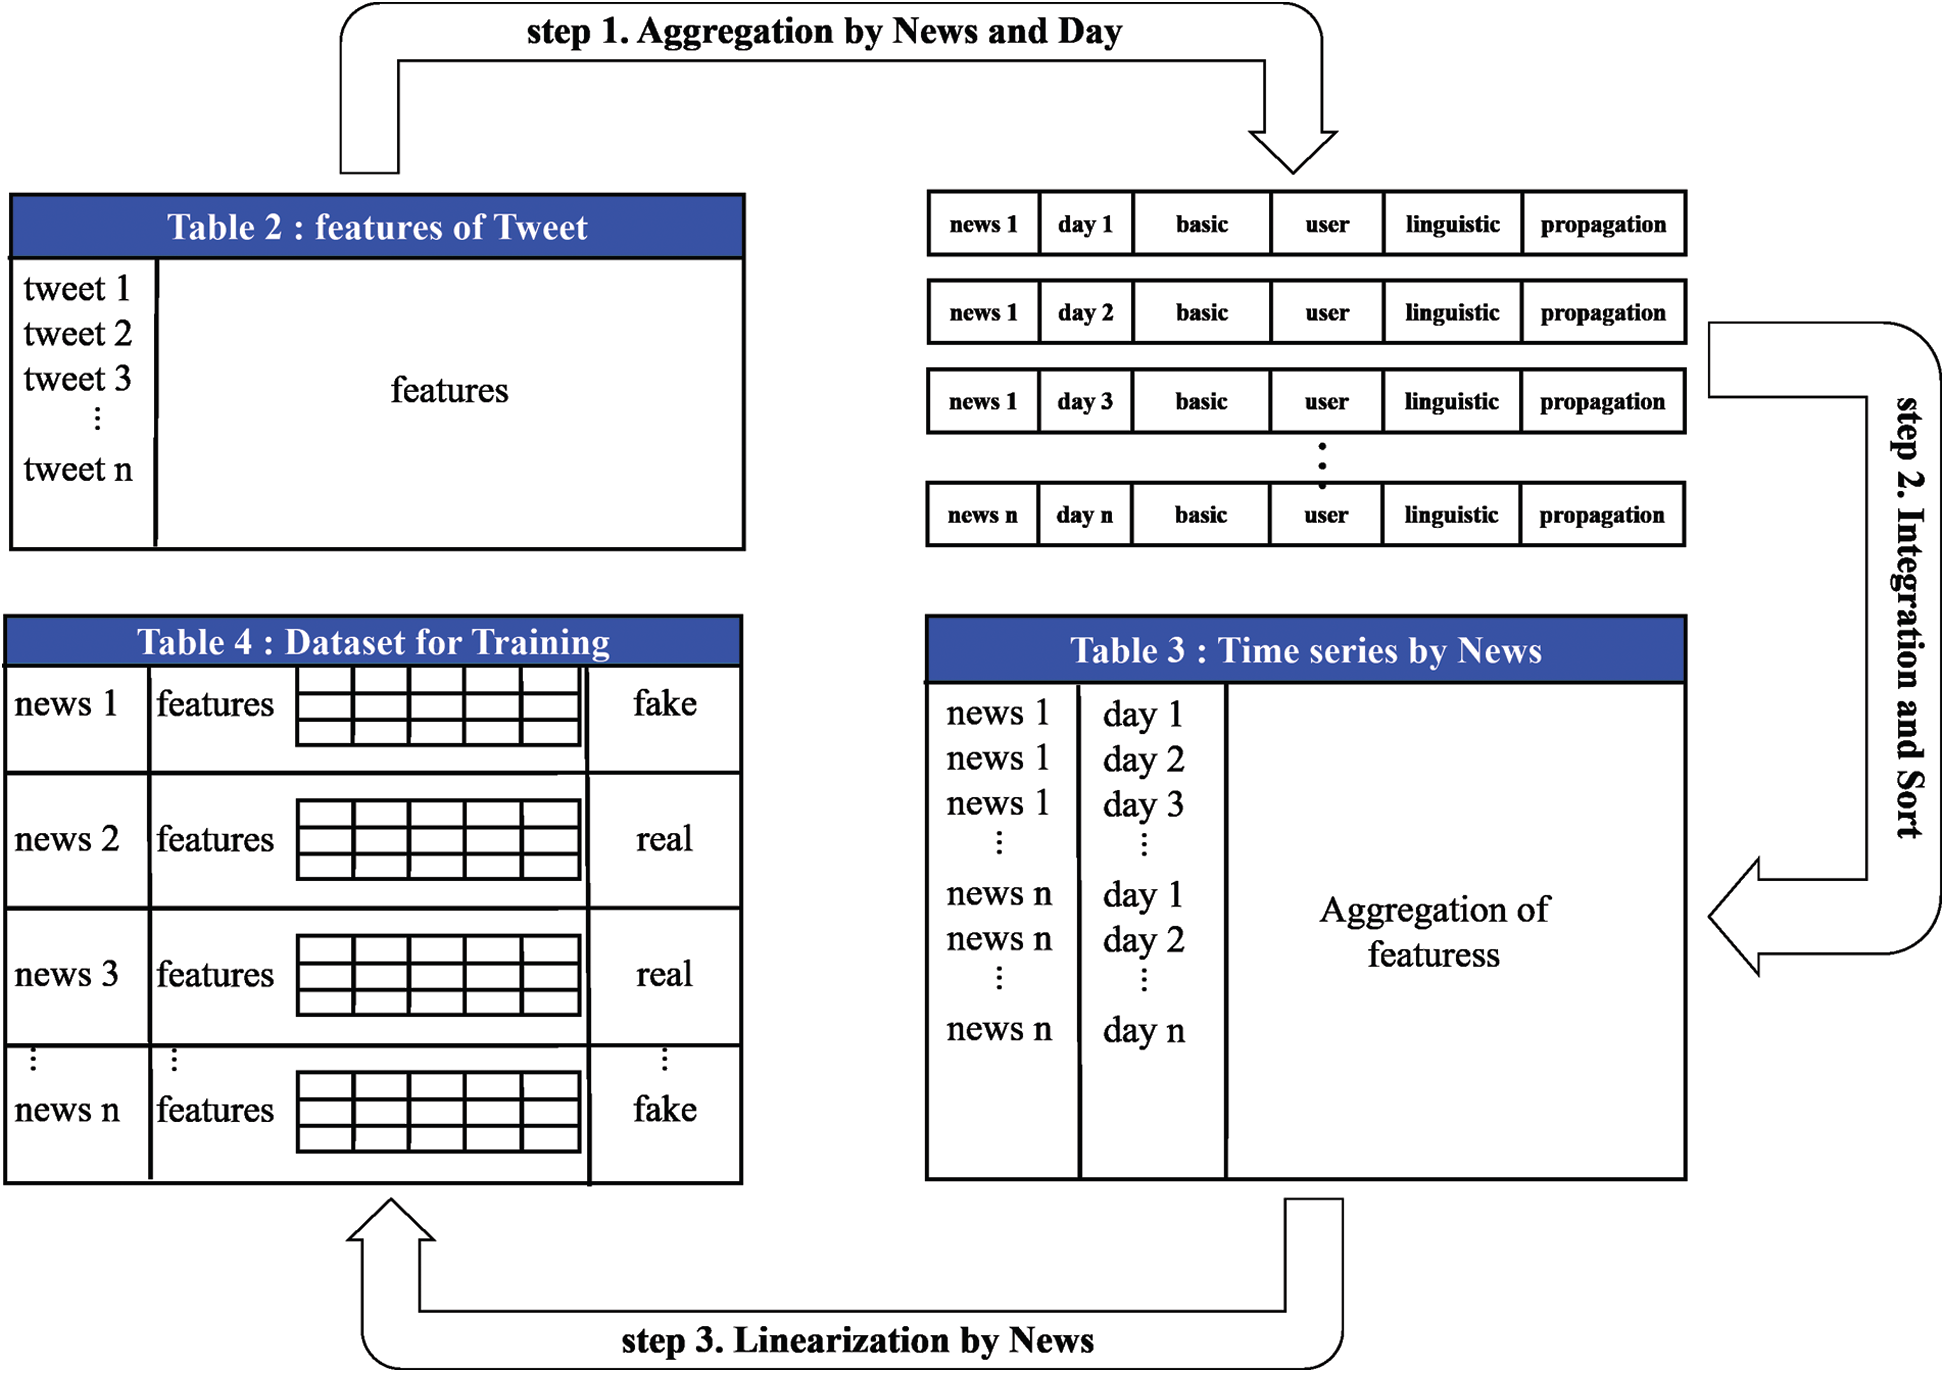
Figure 4: Time series-based data set processing for training
3.3.3 Step 3. Linearization by News
In order to be used as a dataset for training of the fake news classifier, the time series of each news in the integrated time series table in Step 2 must be processed into one row. Therefore, as shown in Tab. 4, the schema of the dataset for training was defined. The dataset for learning consists of a news title, a time series-based feature, and a fake or not. Among these, the time-series-based feature columns are features for learning and are two-dimensional arrays that means the propagation pattern of news over time. To implement this multi-dimensional dataset, Python’s NumPy module was used. As a result, each news in the dataset for training has a two-dimensional time series feature and a label for the reliability of the news.

The time series-based training dataset is trained on a two-phases deep learning-based fake news classifier represented as in Fig. 1b. Two-phases deep learning-based fake news classifier is composed of a CNN that maintains spatial and regional information of multidimensional data and is strong in abstraction of features, and an LSTM suitable for processing time-series sequences. When the dataset is input, the features of the fake news are extracted from the temporal propagation pattern of the news composed of two dimensions in the CNN phase through convolution operation, and the size of the features extracted through the max pooling operation is reduced and simplified. Then, the extracted features are processed into a one-dimensional vector and then transferred to the LSTM phase. The extracted features are processed into a one-dimensional vector and then transferred to the LSTM phase. In the LSTM phase, the reliability of news is finally determined by extracting sequence information using the extracted one-dimensional compressed time series information.
4 Evaluation of the Proposed Technique
Using the time series-based training dataset described in Section 3 and a fake news classifier using two-phase deep learning, we evaluate the performance of the proposed technique. For the experiment, 16,453 tweets and quote retweets related to 1,149 fake news items, and 56,651 tweets and quote retweets related to 2,278 real news items were collected. Two phases of deep learning for the fake news classifier were implemented using Keras 2.0. The performance of the fake news classifier was evaluated through five-fold cross-validation. The evaluation criteria used accuracy, recall, precision, F1 score, and macro F1 score.
4.1 Performance Evaluation Over Time
Fig. 5 shows the recall, precision, and F1 scores for fake news and real news over time. The x-axis represents days and the y-axis represents the value. Fig. 5a shows the performance of the fake news classification over time. The recall of the classifier that learned the time series pattern up to day 3 was approximately 0.896 and then decreased slightly to approximately 0.889 until day 28. In contrast, the precision reached approximately 0.656 on day 3 and rose to about 0.69 by day 28. The F1 score, a balanced score, reached 0.756 on day 3 and rose to 0.772 until day 28. Overall, the recall performance decreased slightly over time, but the precision increased. However, as a result, the balance of the F1 score improved. Fig. 5b shows the classification performance for real news. It demonstrates better performance compared to fake news. The precision shows a decreasing trend, but little change is observed. In contrast, recall started at 0.819 on day 3 and rose to 0.849 on day 28. The F1 score also rose slightly and rose to 0.89 on day 28. Fig. 5c shows the Macro F1 score and accuracy. The macro F1 score indicates the average F1 score for fake news real news side. It can be seen that the Macro F1 score is lower than the accuracy by about 0.02. Accuracy rose from 0.840 (day 3) to 0.856 (day 28) and the Macro F1 score also rose from 0.818 to 0.833. As shown in Fig. 5, the classification performance of real news was better than that of fake news. This is identified as a problem (about twice the difference) due to an imbalance in the number of samples between fake news and real news. Moreover, the overall performance tends to improve as time passes, but even if only the time series data of day 3 are learned, the performance is almost similar to that of the classifier on day 28.
4.2 Performance Evaluation by Dataset
In this experiment, we compare the performance between non-time series data and time series data. Tab. 5 defines the dataset to be used in the experiment. Each news feature in a non-time series dataset is one-dimensional (Last row of 2D features of each news). For example, in the data set on Day 3, information from Day 1 to Day 3 of each news is aggregated and expressed in one row. Since the non-time series data set has one-dimensional features, the convolution operation in the CNN stage has been modified to be one-dimensional.
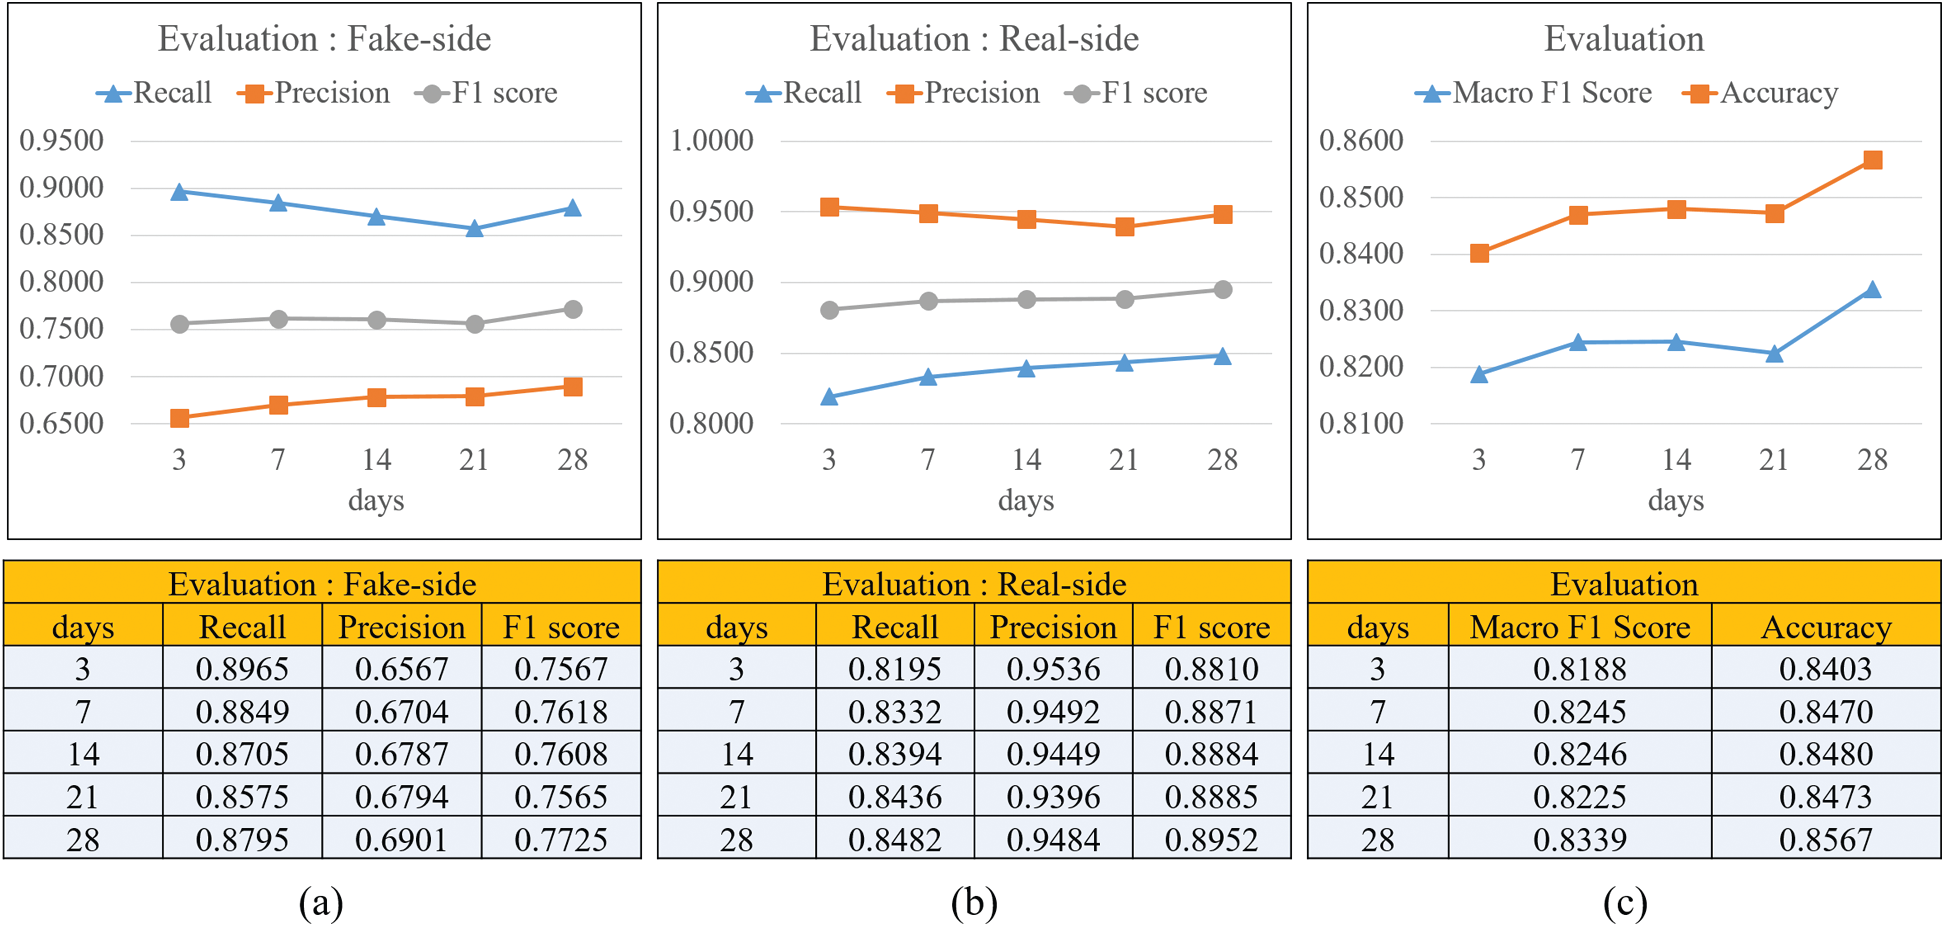
Figure 5: Evaluation of classification for our method over time (a) Fake news-side (b) Real news-side (c) Macro f1 score and accuracy

Fig. 6 shows the performance of the classifier learning each dataset in terms of F1 score, macro F1 score, and accuracy. Fig. 6a shows the F1 score for fake news classification. The classifier that learned the baseline achieved 0.6667 on day 3 and rose to 0.7169 on day 28. The classifier that learned our method-1 achieved 0.6930 on day 3 and rose to 0.7430 on day 28. Overall, the classifier learning our-method-1 showed about 2% higher performance than the classifier learning the baseline. Therefore, it was proved that the classifier that learned the features of a quote retweet has a better performance in classifying fake news. The classifier learning our method-2, which is a time series, shows about 6% to 9% better performance than the classifier learning two non-time series. Fig. 6b shows the F1 score for thereal news classification. It shows a pattern that is almost similar to the F1 score for fake news classification. In addition, the same pattern is shown in the Macro F1 score and accuracy in Figs. 6c and 6d. In addition, the same pattern is shown in the Macro F1 score and accuracy in Figs. 6c and 6d. As a result of the analysis in Fig. 6, it can be seen that the time series data set reflecting the temporal propagation pattern has a great influence on the classification of fake news.
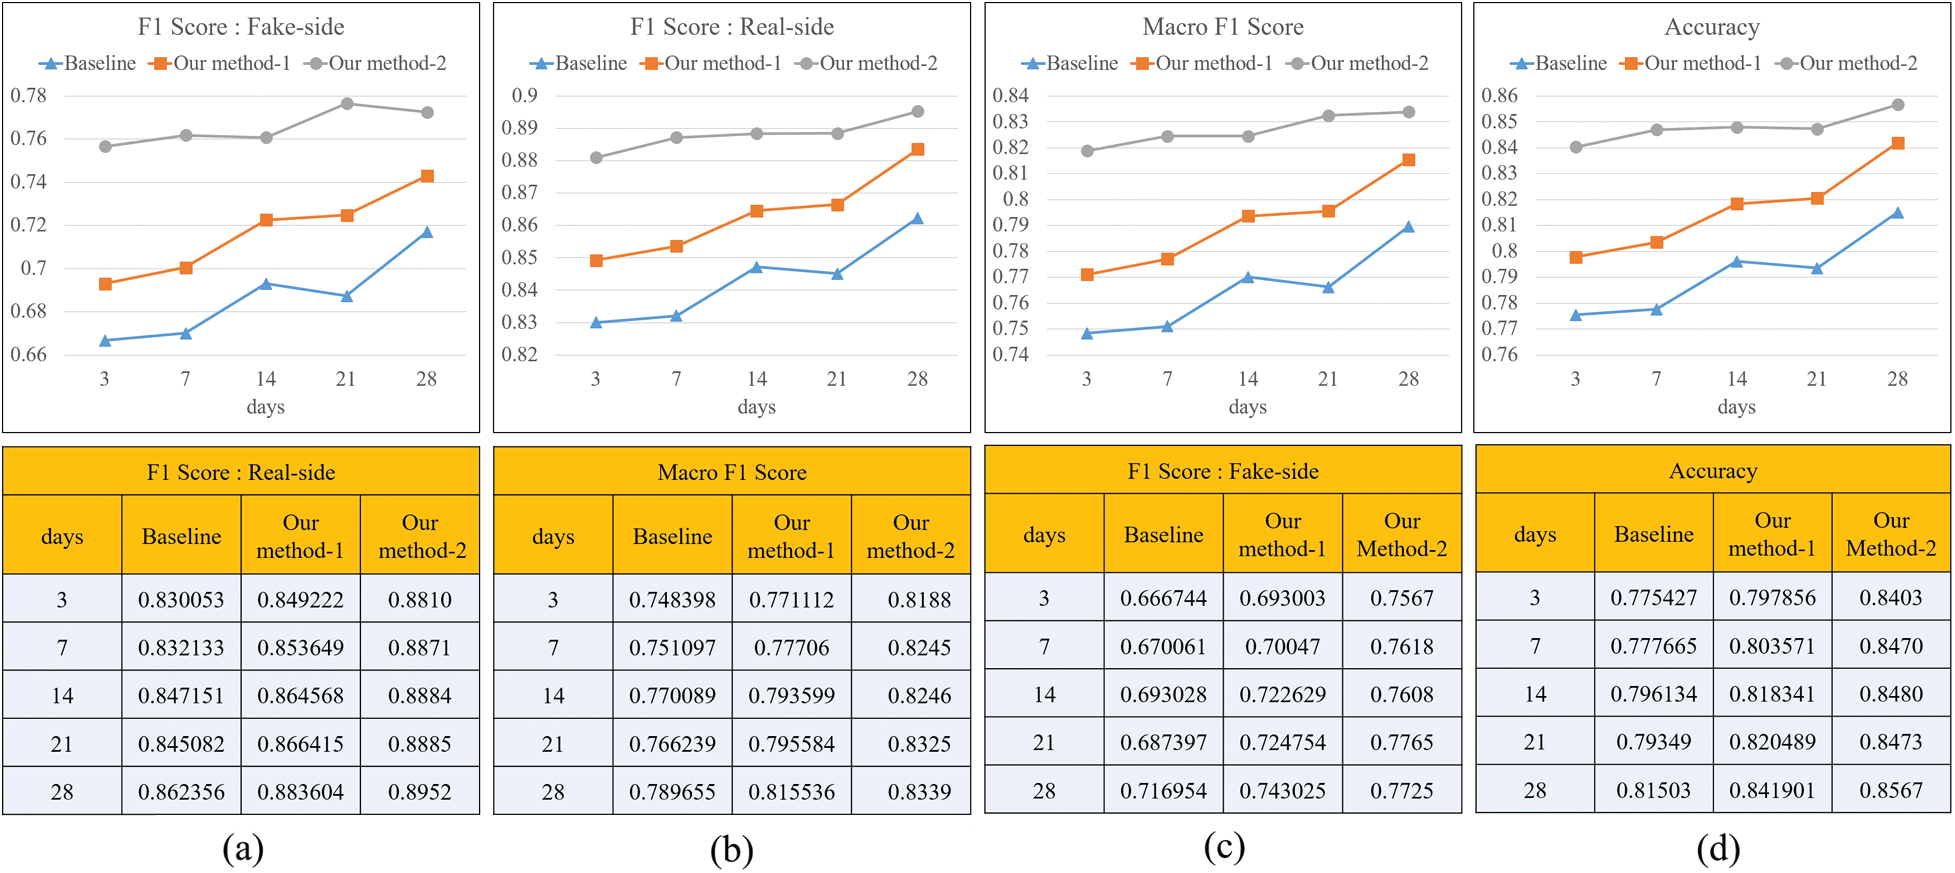
Figure 6: Evaluation of classification by datasets (a) F1 score of fake news classification (b) F1 score of real news classification (c) Macro f1 Score (d) Accuracy
4.3 Performance Evaluation by Feature Group
In this experiment, after learning for each feature group, we evaluated the performance to determine which feature group had a significant influence on the classification performance. Fig. 7 demonstrates the performance of each feature group using the F1 score, the macro F1 score, and the accuracy. Fig. 7a shows the F1 score for fake news classification based on feature group. On day 3, except for the total group, the Prop group showed the highest performance at 0.7345. Subsequently, the performance decreases in the order of user, linguistic, and basic groups. The performance showed an increasing trend until day 28, and the Prop group demonstrated the highest performance at 0.769. The p group shows a slightly lower performance compared to the total, which learns all groups but is still superior to the other groups. The performance of the user group and the linguistic group is generally similar, but it is observed that the performance of the linguistic group is slightly better.
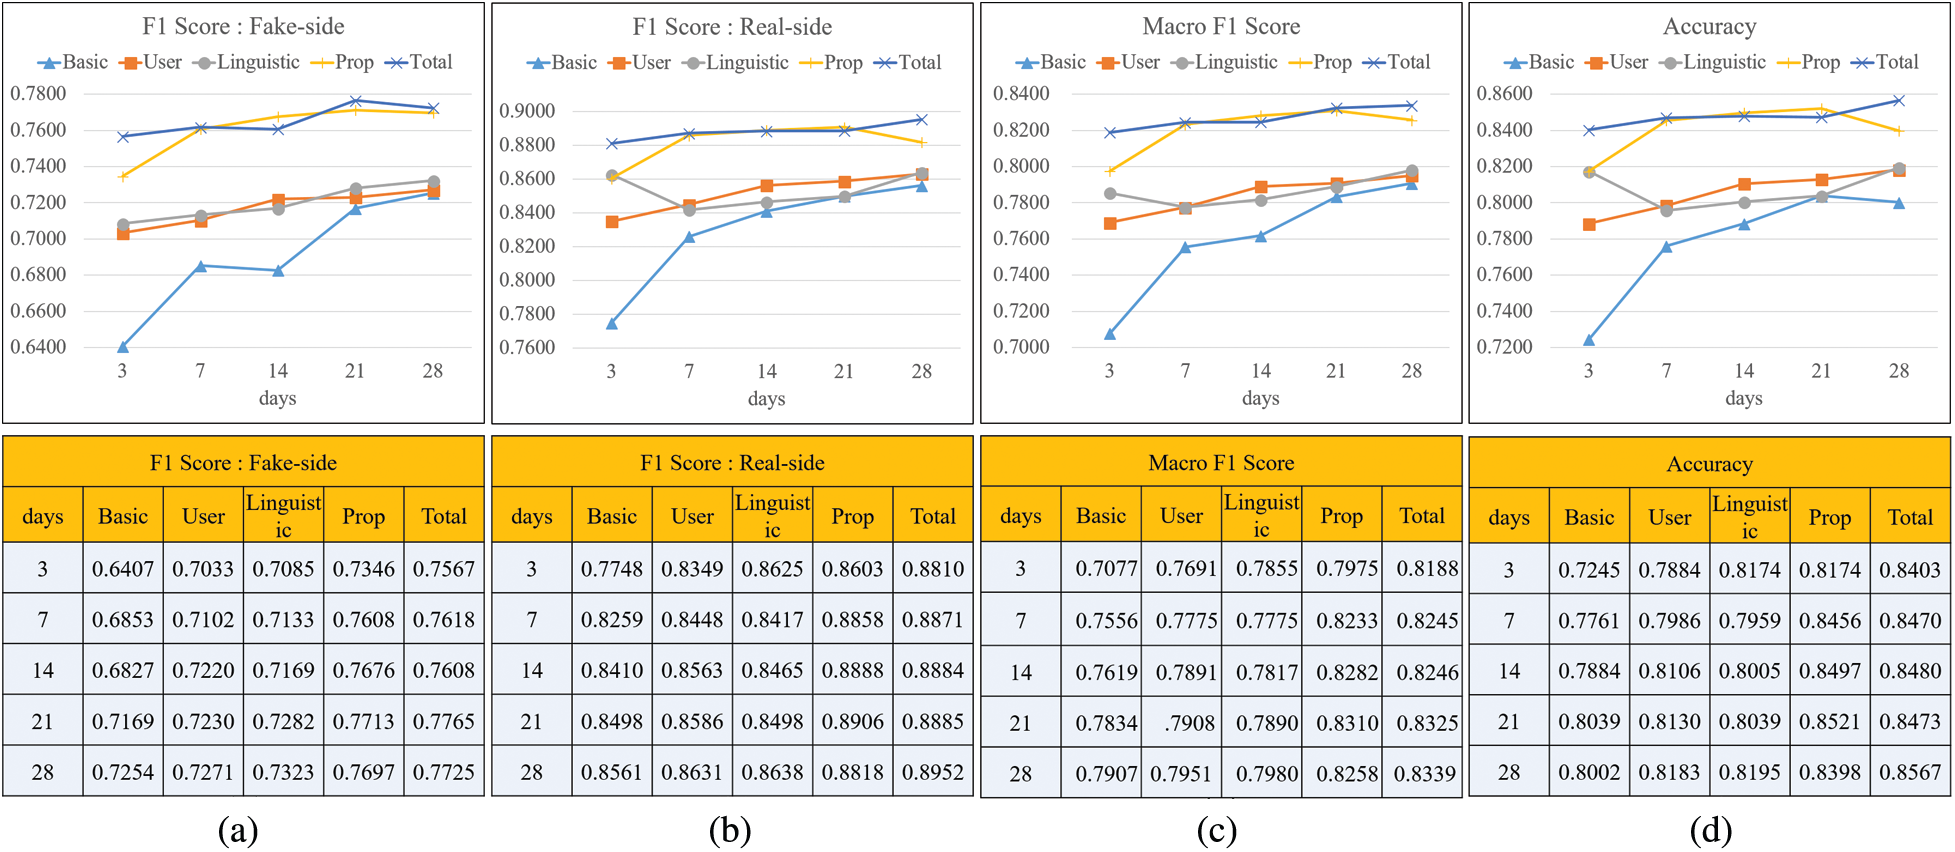
Figure 7: Evaluation of classification by feature groups (a) F1 score of fake news classification (b) F1 score of real news classification (c) Macro f1 Score (d) Accuracy
Fig. 7b shows the F1 score for the real news classification by feature group. Except for the linguistic group, all groups show an upward trend. The order of overall performance is similar to Fig. 7a and the Prop group demonstrates the best performance except for total. Fig. 7c shows macro F1 scores by feature groups. Overall, it shows a similar pattern to the previous figures. (Figs. 7a and 7b), and the accuracy of Fig. 7d also shows a similar pattern. By reviewing Fig. 7, we can conclude that the Prop group demonstrates the best performance that is close to the total of all features. This proves that the propagation pattern of a quote retweet is an effective feature in classifying fake news and has a great influence.
In this study, we proposed a fake news detection method using the temporal propagation pattern of quote retweets to protect people from false information in the fast-developing hyper-connected smart cities of today. To detect fake news, we collected content that spreads information from Twitter using the Selenium and Tweepy API. Furthermore, we defined groups as temporal propagation-based on quote retweets, user-based, linguistic, and basic, and processed the collected data to extract the features of each group. Then, from the extracted data, we analyzed the features of Twitter content that spread fake news and expressed it visually. The results showed that social media influencers who encountered suspicious news showed a cautious attitude toward the use of quote retweets. In addition, the spread of quote retweets in fake news was weak.
We processed the time-series training dataset based on the propagation pattern to verify that the temporal propagation pattern of the quote retweets is an effective means of detecting fake news. Then, we trained the time-series training dataset on a fake news classifier using two phases of deep learning based on CNN and LSTM and verified its performance. The experiment showed that the proposed fake news detection methodology achieved superior performance compared to the existing techniques and showed effective performance in the early detection of fake news. Finally, through a performance experiment based on feature groups, it was verified that the temporal propagation pattern of the quote retweet is a very influential feature in detecting fake news.
In conclusion, we identified a new propagation pattern in which information was spread on Twitter. However, the proposed technique did not consider the user’s stance, which was found to be valid for the classification of fake news. Identifying a tweet user’s stance is an important but difficult issue. It is expected that the performance of the fake news classifier that considers the user’s stance will further improve the proposed technique.
Funding Statement: This research was supported by the Basic Science Research Program through the National Research Foundation of Korea (NRF) funded by the Ministry of Education (NRF-2020R1I1A3073313).
Conflicts of Interest: The authors declare that they have no conflicts of interest to report regarding the present study.
1. Z. Allam and P. Newman, “Redefining the smart city: Culture, metabolism and governance,” Smart Cities, vol. 1, no. 1, pp. 4–25, 2018. [Google Scholar]
2. J. Julian, H. Borrion and B. Bradford, “Security and the smart city: A systematic review,” Sustainable Cities and Society, vol. 55, pp. 102023, 2020. [Google Scholar]
3. M. D. Lytras and A. Visvizi, “Who uses smart city services and what to make of it: Toward interdisciplinary smart cities research,” Sustainability, vol. 10, no. 6, pp. 1998, 2018. [Google Scholar]
4. S. K. Kim and J. H. Huh, “Blockchain of carbon trading for UN sustainable development goals,” Sustainability, vol. 12, no. 10, pp. 4021, 2020. [Google Scholar]
5. C. Yin, S. Ding and J. Wang, “Mobile marketing recommendation method based on user location feedback,” Human-Centric Computing and Information Sciences, vol. 9, no. 1, pp. 1–17, 2019. [Google Scholar]
6. C. Yin, L. Shi, R. Sun and J. Wang, “Improved collaborative filtering recommendation algorithm based on differential privacy protection,” The Journal of Supercomputing, vol. 76, no. 7, pp. 5161–5174, 2020. [Google Scholar]
7. J. H. Park, S. Rathore, S. K. Singh, M. M. Salim, A. E. Azzaoui et al., “A comprehensive survey on core technologies and services for 5G security: Taxonomies, issues, and solutions,” Human-Centric Computing and Information Sciences, vol. 11, no. 3, pp. 1–22, 2021. [Google Scholar]
8. S. K. Singh, A. E. Azzaoui, T. W. Kim, Y. Pan and J. H. Park, “DeepBlockScheme: A deep learning-based blockchain driven scheme for secure smart city,” Human-Centric Computing and Information Sciences, vol. 11, no. 12, pp. 1–12, 2021. [Google Scholar]
9. A. Hermida, “Twittering the news: The emergence of ambient journalism,” Journalism Practice, vol. 4, no. 3, pp. 297–308, 2010. [Google Scholar]
10. R. Procter, J. Crump, S. Karstedt, A. Voss and M. Cantijoch, “Reading the riots: What were the police doing on Twitter?,” Policing and Society, vol. 23, no. 4, pp. 413–436, 2013. [Google Scholar]
11. J. Van Dijck, The Culture of Connectivity: A Critical History of Social Media. New York, NY, USA: Oxford University Press, pp. 3–18, 2013. [Google Scholar]
12. C. Fuchs, Social Media: A Critical Introduction, 2nded., London, UK: SAGE Publications Ltd., pp. 33–61, 2017. [Google Scholar]
13. S. S. Jeong and Y. S. Seo, “Improving response capability of chatbot using Twitter,” Journal of Ambient Intelligence and Humanized Computing, vol. 6, no. 7, pp. 1–14, 2019. [Google Scholar]
14. S. Phuvipadawat and T. Murata, “Breaking news detection and tracking in Twitter,” in Proc. 2010 IEEE/WIC/ACM Int. Conf. on Web Intelligence and Intelligent Agent Technology, Toronto, ON, Canada, pp. 120–123, 2010. [Google Scholar]
15. J. Yu, E. Kim, H. Kim and J. H. Huh, “Design of a framework to detect device spoofing attacks using network characteristics,” IEEE Consumer Electronics Magazine, vol. 9, no. 2, pp. 34–40, 2020. [Google Scholar]
16. D. Yates and S. Paquette, “Emergency knowledge management and social media technologies: A case study of the 2010 Haitian earthquake,” International Journal of Information Management, vol. 31, no. 1, pp. 6–13, 2011. [Google Scholar]
17. J. Yin, A. Lampert, M. Cameron, B. Robinson and R. Power, “Using social media to enhance emergency situation awareness,” IEEE Annals of the History of Computing, vol. 27, no. 6, pp. 52–59, 2012. [Google Scholar]
18. M. Imran, C. Castillo, F. Diaz and S. Vieweg, “Processing social media messages in mass emergency: A survey,” ACM Computing Surveys, vol. 47, no. 4, pp. 1–38, 2015. [Google Scholar]
19. J. H. Huh, “PLC-based design of monitoring system for ICT-integrated vertical fish farm,” Human-Centric Computing and Information Sciences, vol. 7, no. 1, pp. 1–19, 2017. [Google Scholar]
20. T. Sakaki, M. Okazaki and Y. Matsuo, “Tweet analysis for real-time event detection and earthquake reporting system development,” IEEE Transactions on Knowledge and Data Engineering, vol. 25, no. 4, pp. 919–931, 2012. [Google Scholar]
21. A. J. Flanagin and M. J. Metzger, “Perceptions of internet information credibility,” Journalism & Mass Communication Quarterly, vol. 77, no. 3, pp. 515–540, 2000. [Google Scholar]
22. T. J. Johnson, B. K. Kaye, S. L. Bichard and W. J. Wong, “Every blog has its day: Politically-interested Internet users’ perceptions of blog credibility,” Journal of Computer-Mediated Communication, vol. 13, no. 1, pp. 100–122, 2007. [Google Scholar]
23. A. Zubiaga, A. Aker, K. Bontcheva, M. Liakata and R. Procter, “Detection and resolution of rumours in social media: A survey,” ACM Computing Surveys, vol. 51, no. 2, pp. 1–36, 2018. [Google Scholar]
24. H. Kwak, H. Lee, H. Park and S. Moon, “What is Twitter, a social network or a news media?,” in Proc. the 19th Int. Conf. on World Wide Web, Raleigh, NC, USA, pp. 591–600, 2010. [Google Scholar]
25. S. K. Kim and S. Kim, “Brain-inspired method for hyper-connected and distributed intelligence,” in Proc. 2020 ICAIIC, Fukuoka, Japan, IEEE, pp. 657–660, 2020. [Google Scholar]
26. I. Mavromatis, A. Tassi, R. J. Piechocki and A. Nix, “Efficient V2V communication scheme for 5G MmWave hyper-connected CAVs,” in Proc. ICC Workshops, Kansas City, MO, USA, IEEE, pp. 1–6, 2018. [Google Scholar]
27. V. H. Nguyen, K. Sugiyama, P. Nakov and M. Y. Kan, “FANG: Leveraging social context for fake news detection using graph representation,” in Proc. the 29th ACM Int. Conf. on Information & Knowledge Management, Galway, Ireland, pp. 1165–1174, 2020. [Google Scholar]
28. M. Lukasik, P. K. Srijith, D. Vu, K. Bontcheva, A. Zubiaga et al., “Hawkes processes for continuous time sequence classification: An application to rumour stance classification in Twitter,” in Proc. the 54th Annual Meeting of the Association for Computational Linguistics, Berlin, Germany, vol. 2, pp. 393–398, 2016. [Google Scholar]
29. J. Schwarz and M. Morris, “Augmenting web pages and search results to support credibility assessment,” in Proc. SIGCHI Conf. on Human Factors in Computing Systems, Vancouver, BC, Canada, pp. 1245–1254, 2011. [Google Scholar]
30. A. Bovet and H. A. Makse, “Influence of fake news in Twitter during the 2016 US presidential election,” Nature communications, vol. 10, no. 1, pp. 1–14, 2019. [Google Scholar]
31. K. Starbird, J. Maddock, M. Orand, P. Achterman and R. M. Mason, “Rumors, false flags, and digital vigilantes: Misinformation on Twitter after the 2013 boston marathon bombing,” in I Conf. 2014 Proc., Berlin, Germany, pp. 654–662, 2014. [Google Scholar]
32. K. Garimella, I. Weber and M. De Choudhury, “Quote RTs on Twitter: Usage of the new feature for political discourse,” in Proc. the 8th ACM Conf. on Web Science, Hannover, Germany, pp. 200–204, 2016. [Google Scholar]
33. C. Castillo, M. Mendoza and B. Poblete, “Information credibility on Twitter,” in Proc. the 20th Int. Conf. on World Wide Web, Hyderabad, India, pp. 675–684, 2011. [Google Scholar]
34. S. Kwon, M. Cha and K. Jung, “Rumor detection over varying time windows,” PLoS One, vol. 12, no. 1, pp. e0168344, 2017. [Google Scholar]
35. S. Kwon, M. Cha, K. Jung, W. Chen and Y. Wang, “Prominent features of rumor propagation in online social media,” in Proc. 13th Int. Conf. on data mining, Dallas, TX, USA, IEEE, pp. 1103–1108, 2013. [Google Scholar]
36. Y. Jang, C. H. Park and Y. S. Seo, “Fake news analysis modeling using quote retweet,” Electronics, vol. 8, no. 12, pp. 1377, 2019. [Google Scholar]
37. J. Maddock, K. Starbird, H. J. Al-Hassani, D. E. Sandoval, M. Orand et al., “Characterizing online rumoring behavior using multi-dimensional signatures,” in Proc. 18th ACM Conf. on Computer Supported Cooperative Work & Social Computing, Vancouver, BC, Canada, pp. 228–214, 2015. [Google Scholar]
38. R. Procter, F. Vis and A. Voss, “Reading the riots on Twitter: Methodological innovation for the analysis of big data,” International Journal of Social Research Methodology, vol. 16, no. 3, pp. 197–214, 2013. [Google Scholar]
39. A. Zubiaga, M. Liakata, R. Procter, G. Wong Sak Hoi and P. Tolmie, “Analysing how people orient to and spread rumours in social media by looking at conversational threads,” PLoS One, vol. 11, no. 3, pp. e0150989, 2016. [Google Scholar]
40. M. Mendoza, B. Poblete and C. Castillo, “Twitter under crisis: Can we trust what we RT?,” in Proc. the First Workshop on Social Media Analytics, Washington, DC, USA, pp. 71–79, 2010. [Google Scholar]
41. Z. Jin, J. Cao, Y. Zhang and J. Luo, “News verification by exploiting conflicting social viewpoints in microblogs,” in Proc. the AAAI Conference on Artificial Intelligence, Phoenix, AZ, USA, vol. 30, 2016. [Google Scholar]
42. D. Chandrasekaran and V. Mago, “Evolution of semantic similarity—A survey,” ACM CSUR, vol. 54, no. 2, pp. 1–37, 2021. [Google Scholar]
43. A. E. Lillie and E. R. Middelboe, “Fake news detection using stance classification: A survey,” arXiv preprint, arXiv: 1907.00181, 2019. https://arxiv.org/abs/1907.00181. [Google Scholar]
44. G. Zarrella and A. Marsh, “Mitre at semeval-2016 task 6: Transfer learning for stance detection,” arXiv preprint, arXiv: 1606.03784, 2016. https://arxiv.org/abs/1606.03784. [Google Scholar]
45. E. W. Pamungkas, V. Basile and V. Patti, “Stance classification for rumour analysis in Twitter: Exploiting affective information and conversation structure,” arXiv preprint, arXiv: 1901.01911, 2019. https://arxiv.org/abs/1901.01911. [Google Scholar]
46. R. Yang, W. Xie, C. Liu and D. Yu, “BLCU_NLP at SemEval-2019 task 7: An inference chain-based GPT model for rumour evaluation,” in Proc. the 13th Int. Workshop on Semantic Evaluation, Minneapolis, Minnesota, USA, pp. 1090–1096, 2019. [Google Scholar]
47. S. Baird, D. Sibley and Y. Pan, “Talos targets disinformation with fake news challenge victory,” Fake News Challenge, 2017. [Online]. Available: https://blog.talosintelligence.com/2017/06/talos-fake-news-challenge.html. [Google Scholar]
48. B. Ghanem, P. Rosso and F. Rangel, “Stance detection in fake news a combined feature representation,” in Proc. FEVER, Brussels, Belgium, pp. 66–71, 2018. [Google Scholar]
49. A. Hanselowski, A. Pvs, B. Schiller, F. Caspelherr, D. Chaudhuri et al., “A retrospective analysis of the fake news challenge stance detection task,” in Proc. the 27th Int. Conf. on Computational Linguistics, Santa Fe, New Mexico, USA, pp. 1859–1874, 2018. [Google Scholar]
 | This work is licensed under a Creative Commons Attribution 4.0 International License, which permits unrestricted use, distribution, and reproduction in any medium, provided the original work is properly cited. |