DOI:10.32604/cmc.2021.018930
| Computers, Materials & Continua DOI:10.32604/cmc.2021.018930 | |
| Article |
TBDDoSA-MD: Trust-Based DDoS Misbehave Detection Approach in Software-defined Vehicular Network (SDVN)
1Department of CSE, Government College of Engineering (BPUT University, Rourkela), Kalahandi, 766002, India
2Department of CSE Indira Gandhi Institute of Technology (BPUT University Rourkela), Sarang, 759146, India
3Department of CSE, Parala Maharaja Engineering College (BPUT University Rourkela), Berhampur, 761003, India
4Department of CSE, SRM University, Amaravati, 522502, AP, India
5School of Computer Science and Engineering, Taylor’s University, Subang Jaya, 47500, Malaysia
6Material Research Science Institute, King Addulaziz City for Science and Technology (KACST), Riyad, 6086, Kingdom of Saudi Arabia
7King Addulaziz City for Science and Technology (KACST), Riyad, 6086, Kingdom of Saudi Arabia
*Corresponding Author: Zahrah A. Almusaylim, E-mail: zalmusaylim@kacst.edu.sa
Received: 26 March 2021; Accepted: 26 April 2021
Abstract: Reliable vehicles are essential in vehicular networks for effective communication. Since vehicles in the network are dynamic, even a short span of misbehavior by a vehicle can disrupt the whole network which may lead to catastrophic consequences. In this paper, a Trust-Based Distributed DoS Misbehave Detection Approach (TBDDoSA-MD) is proposed to secure the Software-Defined Vehicular Network (SDVN). A malicious vehicle in this network performs DDoS misbehavior by attacking other vehicles in its neighborhood. It uses the jamming technique by sending unnecessary signals in the network, as a result, the network performance degrades. Attacked vehicles in that network will no longer meet the service requests from other vehicles. Therefore, in this paper, we proposed an approach to detect the DDoS misbehavior by using the trust values of the vehicles. Trust values are calculated based on direct trust and recommendations (indirect trust). These trust values help to decide whether a vehicle is legitimate or malicious. We simply discard the messages from malicious vehicles whereas the authenticity of the messages from legitimate vehicles is checked further before taking any action based on those messages. The performance of TBDDoSA-MD is evaluated in the Veins hybrid simulator, which uses OMNeT++ and Simulation of Urban Mobility (SUMO). We compared the performance of TBDDoSA-MD with the recently proposed Trust-Based Framework (TBF) scheme using the following performance parameters such as detection accuracy, packet delivery ratio, detection time, and energy consumption. Simulation results show that the proposed work has a high detection accuracy of more than 90% while keeping the detection time as low as 30 s.
Keywords: Software-defined vehicular network; trust; evaluator node; denial of service; misbehavior
Vehicular Network (VN) is a kind of networking infrastructure where Vehicle-to-Vehicle (V2V) and Vehicle-to-Infrastructure (V2I) communication takes place using wireless network [1]. Each vehicle in the network is treated as a network node and is equipped with sensing, processing, forwarding, and wireless communication capabilities. Since each vehicle in the network system performs the sensing, processing, and forwarding operation, the system is called an Intelligent Transportation System (ITS) [2]. The main objective of the ITS is to provide safety and services to people. Service requests in a network cannot be provided or fulfilled if the number of requests exceeds the capability of the network. The malicious vehicles can jam the network by performing Distributed Denial of Service (DDoS) attacks to their neighbor vehicles and Road Side Units (RSUs). In a vehicular network V2V and V2I communication takes place using Dedicated Short Range Communication (DSRC) [3].
Due to the dynamic nature of vehicles in the network, communication links between vehicles establish for a very short span of time. Hence, a short span of misbehavior can disrupt the entire network, and tracing the misbehavior causing vehicle is a challenging task. So, misbehavior causing vehicles need to be detected as early as possible. There is also a high chance of uncertainty in the network due to different road layouts, lane structure, vehicle driver behaviors, and density of traffic. Vehicle density also varies in different geographical locations and timing. Locations like market places, traffic and highway jams, the density of vehicles are more as compared to other remote areas and also timing like an office hour and evening time, the density of vehicles is normally more. During these periods and locations, vehicles are going to receive multiple pieces of the same information from different nodes present in that area and also from different RSUs directly or through multihop communication. This makes the network more vulnerable to one of the catastrophic attacks, i.e., Distributed Denial of Service (DDoS) attack. Hence, this type of attack needs to be detected to save the network from catastrophic consequences.
The contributions of the paper are stated as follows:
• In a vehicular network, DDoS attackers overwhelm packets in a particular network with redundant packets or information; as a result, legitimate nodes become deprived of different network services due to the network congestion [4]. Further, dynamic topology and decentralization of the VN make it difficult to detect malicious attackers. To overcome these challenges, a Trust-Based Distributed DoS Misbehave Detection Approach (TBDDoSA-MD) is proposed to secure the SDVN.
• The trust value is calculated for a vehicle based on the direct trust and recommendations received from other surrounding vehicles. Before taking any action based on the information received from any other vehicle, the trust value of that vehicle is calculated by an Evaluator Node (EN). Based on the trust value, the EN decides a vehicle is malicious or genuine. If the vehicle is malicious, the EN simply discards the packets received from that vehicle, else the authenticity of packets is further checked by using the data trust model. SDN-based vehicular network is used to carry out the simulation using Veins hybrid simulator.
The rest of the paper is organized as follows. Related works based on misbehavior detection are extensively studied in Section 2. Section 3 explains the network model, misbehavior model, and the proposed misbehavior detection method. In Section 4, the detailed simulation is described and its results are analyzed. The conclusion and future work are presented in Section 5.
Many research works relating to DDoS detection in VN have been carried out by researchers. Some of those works are discussed as follows. Kolandaisamy et al. [5] presented a Multivariant Stream Analysis (MVSA) approach to detect DDoS attacks in VANET. The MVSA approach has three stages for DDoS attack detection. Preprocessing stage is the first stage of detection where packets received from different vehicles are used for classification. The multivariant stream weight stage is the next stage where traffic types and multivariant stream factors are computed. The DoS attack is detected using the computed stream weight. The last step is the DDoS mitigation stage where vehicles use network traces and process the Payload, Hop Count, Time to Live (TTL), and Packet Frequency at different time windows (for each stream class). These four features are measured and computed to generate rule sets. By using computed stream weight, the method classifies the packet into either genuine or malicious. The main drawback of the proposed work is its computation overhead, which needs to be reduced to increase the efficiency of the system. Poongodi et al. [6] have designed a system based on the reCAPTCHA controller to prevent the DDoS attack in VANET. The reCAPTCHA controller helps to check automated DDoS attacks. To analyze the deviation, an information theory-based metric is used in terms of entropy. Results show that the reCAPTCHA based method has higher PDR and DR but lower EC and AL than the AODV and Firecol techniques. The proposed work shows good results in terms of the detection of DDoS attacks but does not mention prevention and post scenario of DDoS attack detection. In [7], the authors have proposed a distributed and robust approach against DoS attack. IP addresses are used by authors to check the identities of malicious vehicles. So, if a node observes some similar ip addresses in the database, then those similar IP addresses are treated as DoS attackers. The proposed method works well for detection in small-scale networks, but detection in large-scale networks is a challenging one. Lahrouni et al. [8] presented a solution to the DoS attack using different mathematical models. To check the effects of the DoS attack, each parameter for the simulation was analyzed by the authors using the logistic regression method. To avoid DoS attacks, authors in [9] have added a pre-authentication process before the signature verification process. The pre-authentication process uses a one-way hash chain and a group revoking scheme. By adding the pre-authentication process, the authors have successfully reduced the network load, however, the proposed scheme can be applied to vehicles within the network; not to the outside attackers. Vermal et. al [10] presented a defense method against User Datagram Protocol (UDP) based flooding attacks. This UDP-based flooding is a DoS attack where it creates fake identities. Adding IP spoofing in the DoS attack makes it more difficult to detect in the network. Authors have further extended their work in [11], where they have used Bloom-Filter based detection method, which helps to provide services to legitimate vehicles and also used to detect and defend against IP address spoofing in DoS attacks. The proposed method works well from the detection point of view, but values used during the simulation are not practically feasible in a real-life scenario. In [12], authors have shown the impact of DDoS attacks on the control plane of the Software-Defined Internet of Vehicles (SD-IoV) network. Due to the flooding by packets in the network, drastic reduction of overall throughput and increase of controller load is studied in this paper. This work focuses only on the control plane and left the other important plane, i.e., the data plane of the SDN network completely. Gao et al. [13] developed a distributed network intrusion detection system for DDoS attack detection in VANET. The two main components of the proposed detection system are the real-time network traffic collection module and network traffic detection module. Detection is carried out using two publicly available NSL-KDD and UNSW-NB15 data sets and results are compared with other machine learning-based classifiers. The authors simulated their work on the publicly available data sets and they have not designed any network model to prove the authenticity of the work.
From the literature discussed above, it is observed that DDoS attack spreads very fast in a network. Hence, vehicles that try to perform DDoS attacks need to be detected as early as possible. To the best of our knowledge, very little work has been done to prevent a vehicle to perform a DDoS attack on a network. In most of the research work, vehicles performing a DDoS attack are detected. Hence, to prevent a vehicle to perform a DDoS attack, we have used node trust and data trust modules and make a relationship between them. By using these modules, we can easily detect as well as prevent DDoS attacks in a network.
3 Proposed Trust Based Misbehavior Detection Method
In this section, network and misbehavior models are described in detail. After discussing the models, a trust-based distributed DoS misbehavior attack detection method is proposed to save the network from the DDoS attack.
In this work, we have used an SDVN network to detect DDoS attacks. The communication in the designed SDVN based network is shown in Fig. 1. Based on functionality and operation, the network is divided into three planes [14]. Those are application plane, control plane, and data plane [15]. The northbound interface connects the application plane to the control plane and the southbound interface connects the control plane with the data plane [16]. The network load is reduced by decoupling the network plane into the control plane and the data plane, which also brings the network intelligence into logically centralized [17]. This will overcome the ancient decentralized behavior of vehicular network architecture. This centralization of the network makes the network flexible, scalable, programmable, and adaptive to different environments [18]. The southbound interface works based on the OpenFlow protocol. Due to the open flow structure, the network traffic is centrally controlled by the control plane and the data plane is responsible for forwarding data [19].
Any behavior which is a deviation from the normal behavior of a vehicle in a network is called misbehavior [20]. In our network model, a vehicle is allowed to generate 10 packets per second (event information). So, if a vehicle generates more than 10 packets, we treat that as a malicious node responsible for DoS attack in the network. By overloading the network resources like network bandwidth, computational power, etc., different types of services could not be offered to intended drivers or passengers. This is a severe problem in the network as unreachable life-critical information to drivers at the right time may lead to major accidents. These accidents may lead to the death of many people. There is also a probability that, a malicious node may target RSU. The attacker may flood the RSU, so that it may not be available for communication with legitimate nodes. A malicious vehicle can perform the DoS attack on its surrounding vehicles or RSUs by attacking the network using network jamming operation by self or with the help of surrounding vehicles. A malicious vehicle intentionally sends a number of packets in the network and consumes the network resources. This will lead to the non-availability of network resources to the intended vehicles that may lead to a DoS attack. To overcome such situations, we proposed a trust-based scheme to detect DDoS based misbehavior on the SDVN network.
3.3 Proposed Misbehavior Detection Method
The objective of the proposed misbehavior detection scheme is to identify the DDoS attackers, determine the genuineness of events, and identifying false recommendations to avoid DDoS attacks in the network. To carry out the work, we have used an SDN-based vehicular network. Initially, a trust-based framework is designed which is shown in Fig. 2. In our framework, we have taken certain parameters while calculating the node trust and data trust. In the used SDN-based network, the trust is calculated by the EN. We have assumed that an EN has the power to calculate the trustworthiness of surrounding nodes as well as TN. Based on those trusts, EN decides whether to accept or reject any information from surrounding nodes or TN. So the trust calculation and actions based on those trusts are done in the control Plane of the SDVN network. In the data plane of the SDVN network, EN performs the SDN-based broadcasting based on the updated trust. Hence, the data plane helps in the data forwarding in the network.
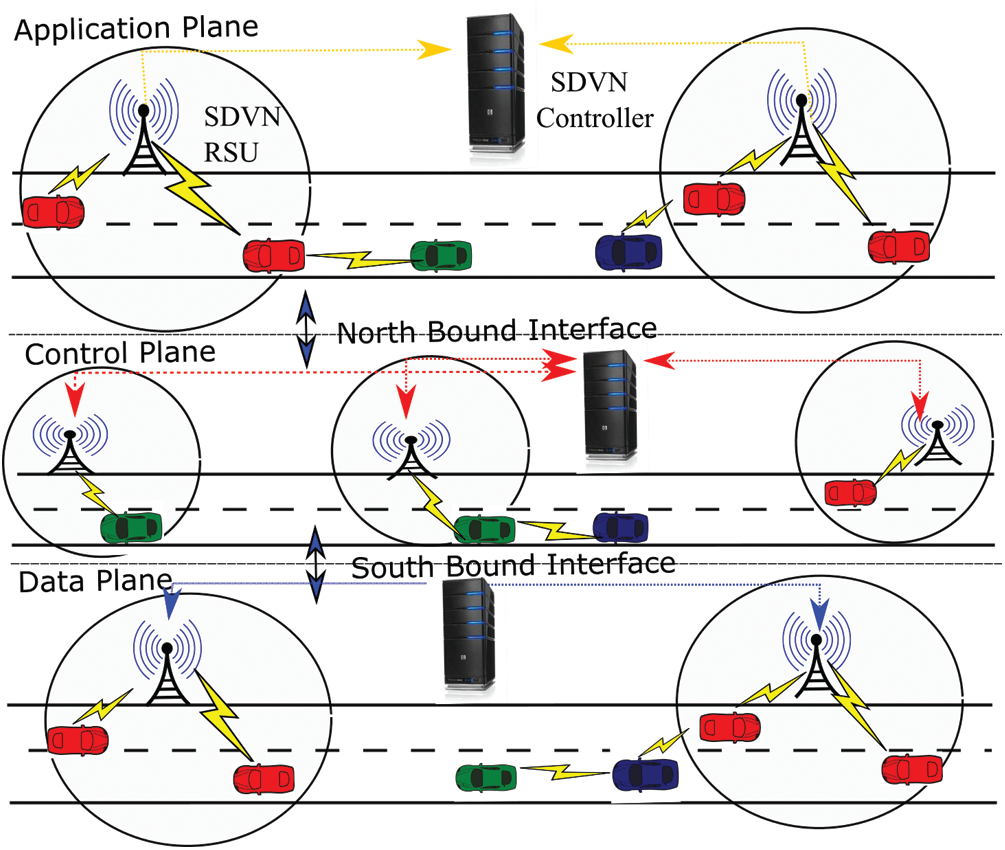
Figure 1: Communication in SDVN network
In the proposed trust framework, we have used the Node Trust and Data Trust modules and established a relationship between them. To calculate the trust of the target agent, i.e., another vehicle, the evaluator node uses its own experience as well as needs to depend upon the experience of neighbors of that agent. Hence, we have used sub modules like current direct trust, previous direct trust, the similarity with neighbors, and their recommendation credibility to calculate effective node trust (ENT). The data trust of an event is calculated based on the observation of the event by the EN directly or through the intermediate nodes. For the above two scenarios, updated data trust is calculated independently by the EN. The updated data trust is used to determine the authenticity of the reported events. We established a relationship between these two modules, i.e., updated effective node trust with that of the updated data trust. Before accepting any event information from any node, the node trust of the TN is evaluated first by the EN. If the calculated node trust is less than a set threshold limit, then we discard the event information received from the TN. In this paper, we have created some nodes having less node trust and assumed that these nodes will try to disrupt the network by sending unnecessary packets. Then, we try to detect such nodes; as a result, DoS attacks in the network can be avoided. Another situation, where the event information sent by a node may be faulty. To reduce the spreading of the wrong event information, we have calculated the updated data trust and compared it with a threshold value. If the calculated value is less than the threshold, we simply discard that event information. By doing so, we reduce overwhelming the network because of this false event information. The detailed evaluation of trust parameters is discussed in the following sections.
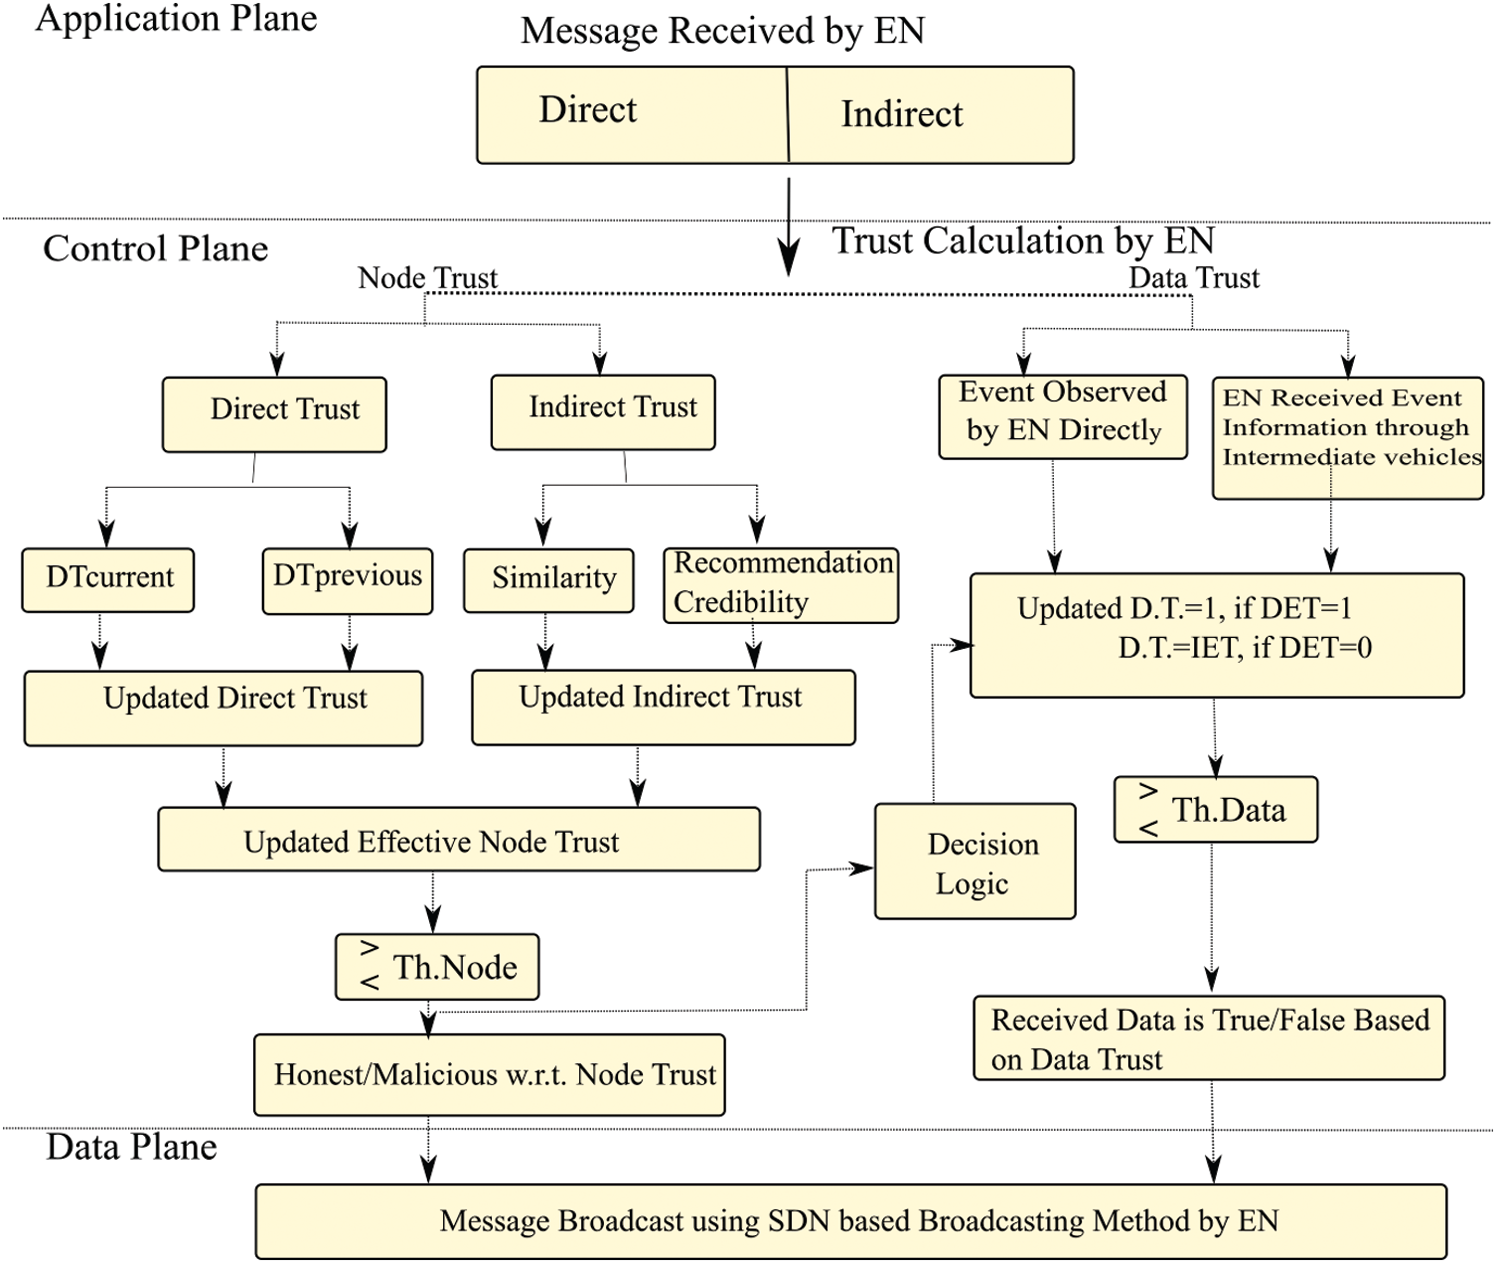
Figure 2: Designed SDN based trust framework
1) Node Trust:
This is the trust established by the EN on the sender using direct and indirect trust. Direct trust is calculated by the EN using its own experience on the TN. Indirect trust is derived from recommendations received from the surrounding vehicles of the TN about the TN. Hence, while calculating the updated effective node trust of a TN, both direct and indirect trusts play vital roles.
i) Direct Trust:
This is calculated based on the direct current trust on the TN as well as using the previous direct trust on the TN by the EN. We have taken the previous direct trust as a parameter while calculating the updated direct trust to avoid the sudden behavioral changes of the TN. Let DTn(EN, TN) represent the direct trust of the EN on the TN in the nth time instant. So, the direct trust updating function is defined as follows:
Here, DTcurrent represents the most recent direct trust value and DTn−1 is the past trust value. EN assigns the trust value to the TN based on the following function:
In Eq. (1), unsatisfied means, a TN sends unnecessary signals greater than a threshold value according to the misbehavior model. The weight factor, i.e., α makes a balance between the current direct trust and the past history. In our model, we have assigned α to 0.5. Hence, we give equal importance to the current direct trust and the past history. Initially, we set the value of direct trust, i.e., DT0(EN,TN) and α to 1. After a certain interval of time as a vehicle performs well in the network, the trust rating of that vehicle increases gradually.
ii) Indirect Trust:
It is not always feasible that an EN will directly communicate with the TN. In that case, it is necessary for the evaluator node to rely on the data received from intermediate vehicles about the TN. Hence intermediate nodes are those nodes that are either at the intersection of the radio range of both EN and TN or just left the radio range of TN recently and entered the radio range of the EN as shown in Fig. 3. Fig. 3a shows the indirect communication between the EN and the TN where the EN is a vehicle with less radio range. V2I communication is shown in Fig. 3b where the EN is an RSU having a higher radio range than the vehicle.
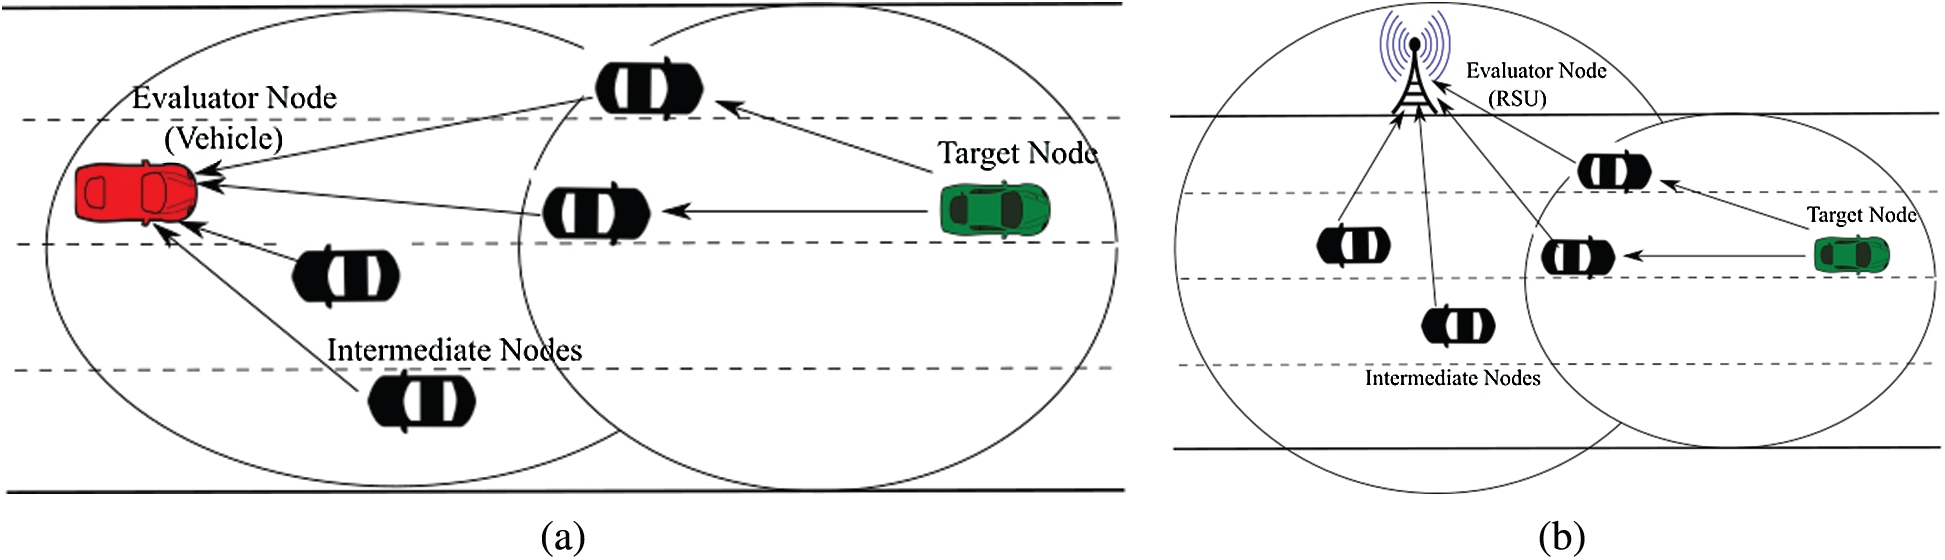
Figure 3: Vehicular communications using intermediate nodes (a) V2V Indirect communication (b) V2I Indirect communication
If an EN has never interacted with any TN, then trust recommendations that it receives from intermediate nodes become the only data that it has to rely on to evaluate the trustworthiness of TN. In our trust model, we have calculated the indirect trust between EN and TN using similarity and recommendation parameters. The similarity parameter shows to what extent the EN and intermediate nodes are alike. After calculating the similarity, this similarity metric is used to calculate the Recommendation Credibility (RC) of the information provided by intermediate nodes to the evaluator. The similarity shows the degree of trust between the EN and intermediate nodes. In this paper, we have used the cosine-based similarity [21]. Let N = [N1, N2, …, Nm] be the set of intermediate nodes between the EN and TN as shown in Fig. 3. Let
After calculating the similarity between the EN and intermediate nodes, we use this similarity metric to find the recommendation credibility of the information provided by the intermediate nodes to the evaluator. Hence, the recommendation credibility is used to measure the level of accuracy of recommendations that intermediate nodes provide to the evaluator. During trust evaluation, it is assumed that nodes with higher feedback credibility are more trustworthy than the lower credibility nodes and are given more weight than the low credibility nodes. Using this credibility score, we have reduced the extra load in the network by accepting and forwarding the data from high credibility nodes and discarding the data from low credibility nodes. Let RCn(EN, Ni) represents the recommendation credibility of intermediate node Ni from EN's point of view.
where θ represents the lowest allowed similarity value and set to 0.01. It is observed from Eq. (3) that, the recommendation credibility is directly proportional to the logarithmic function of similarity. Hence, intermediate nodes with higher similarity value with respect to the EN, have higher recommendation credibility. After knowing the similarity and the recommendation credibility value of intermediate nodes, the EN calculates the indirect trust of TN with the help of intermediate nodes. Let ITn(EN, TN) represent the indirect trust of the evaluating node on the target node in the nth time interval.
From Eq. (4), it is observed that indirect trust depends upon the direct trust between intermediate nodes and the TN, as well as the recommendation credibility between the evaluating node and intermediate nodes. Hence, we can say that indirect trust is the weighted average of recommendations from intermediate nodes. After calculating the direct and indirect trust, these trusts are used by the EN to obtain the updated effective node trust on the TN. Hence, the effective node trust is calculated as follows:
Then the updated effective node trust at nth time instant is calculated as follows:
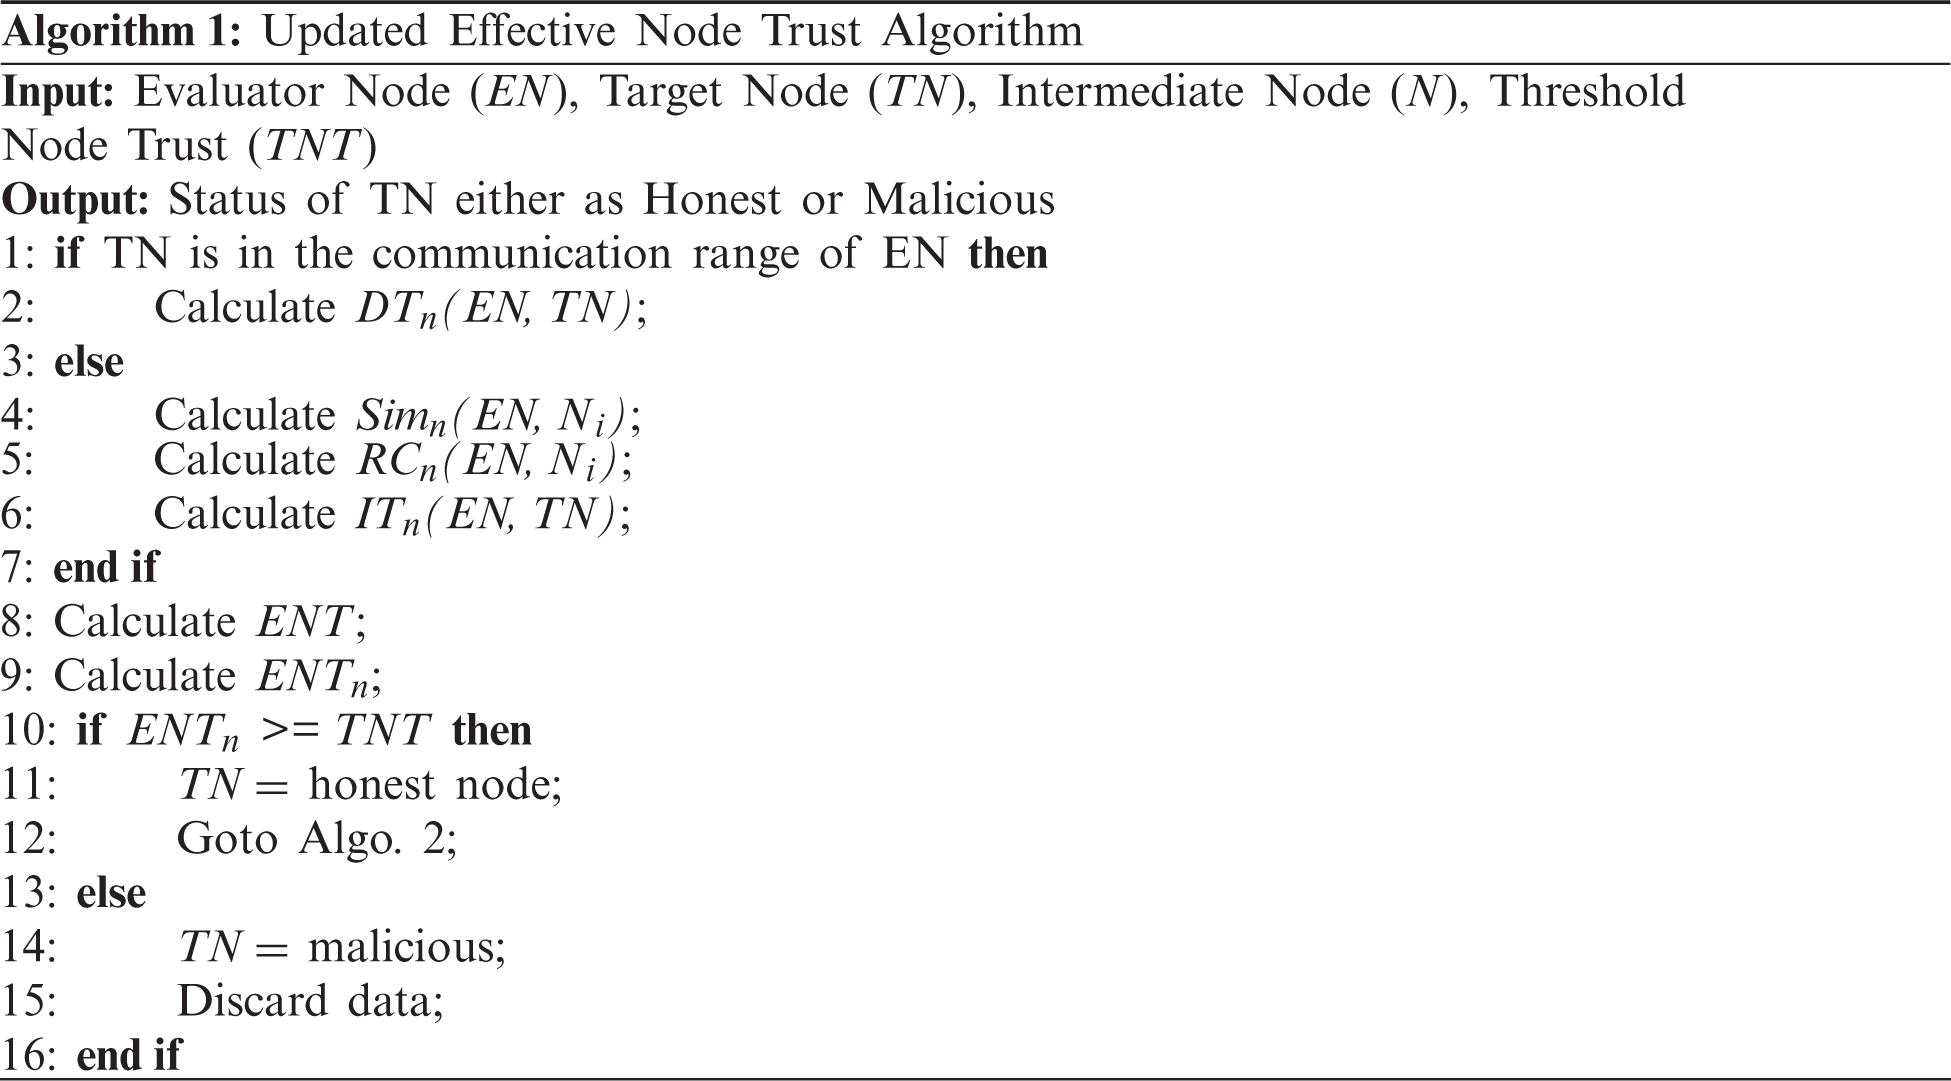
where β and γ are weight parameters between 0−1. For example, the sum of the weight parameters β and (1 − β) is 1. ENTn−1 is the past ENT value. This calculated ENT plays a vital role in identifying attackers in the network. This updated ENT value of a node is compared with that of the previously set Threshold Node Trust (TNT) value. We set the threshold value based on the trust values of the majority of nodes. Let for a particular time, the majority of nodes have trust values approximately 0.3, then the threshold is set to 0.3. But, this threshold can be selected dynamically based on the current trusts of nodes. If the updated ENT is less than the set threshold value, then the EN treats that node as a malicious otherwise legitimate one. If the EN finds the node as malicious then it will take the decision to discard all messages from that node as a result, congestion in the network can be reduced. The whole process is shown in Algorithm 1.
2) Data Trust:
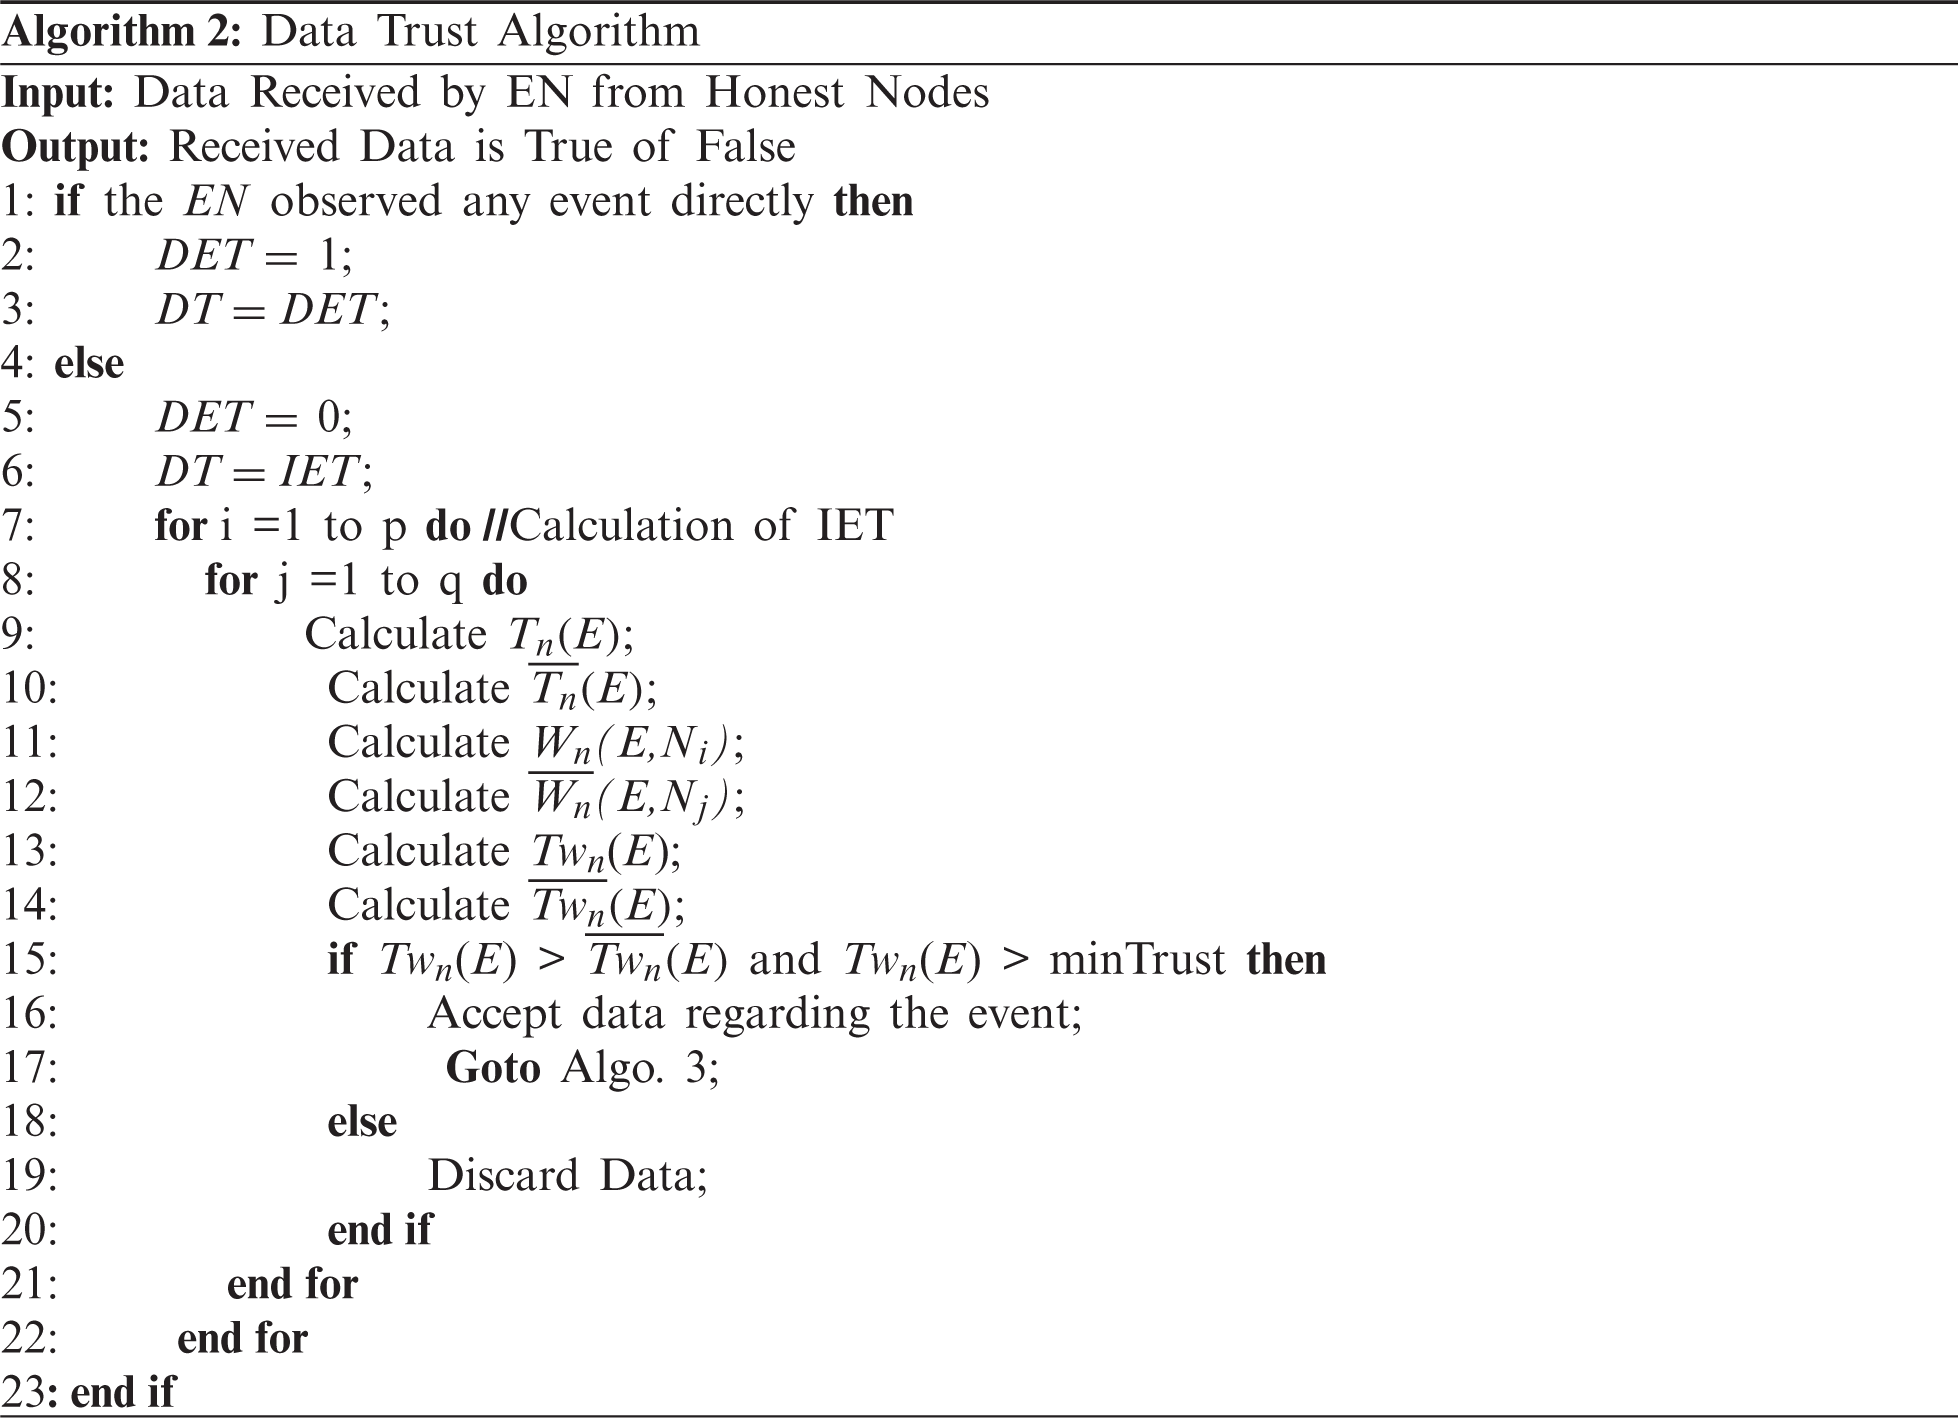
Before accepting any data from surrounding vehicles, we check the authenticity of the data using the data trust. In this paper, we simply discard data received from a malicious node. However, sometimes to show as a genuine node, a malicious node may send legitimate information which we have not discussed in this paper and left for our future study. In a network, a trusted node normally sends legitimate data, however, to take advantage of a particular situation, it may send false data. So to check whether the reported data is true or false, we calculate a trust metric known as Data Trust (DT). An EN is going to calculate the DT by using the following two methods. In the first method, an event occurred in the radio range of an EN, hence the EN observed the event directly. In this situation, the Direct Event Trust (DET) is set to 1 as a result the DT is set to 1 for that event. In the second method, the EN receives event information from intermediate nodes. In this situation, the value of DET is 0. Hence, DT is equal to the Indirect Event Trust (IET). The whole process is shown in Algorithm~2.
We calculate the IET based on the average trust values of surrounding nodes reporting or not reporting events. Let N = [N1, N2, …, Nm] be the number of intermediate nodes reporting at a particular time instant n. Out of N nodes, let p and q be the number of nodes whose messages contain and have no information regarding the occurrence of events in the nth time instant respectively. Hence, N is the summation of p and q. Let Tn (E) and
To reduce the impact of a sudden change in the behavior of a node in the network, we use the weighted mean trust of nodes reporting or not reporting events instead of node trusts directly. So the individual weight of nodes reporting and not reporting event with respect to the average trust of nodes in the nth time interval are Wn(E,Ni) and
Now, weighted mean trust of nodes reporting and not reporting events in the nth time interval are denoted as Twn(E) and
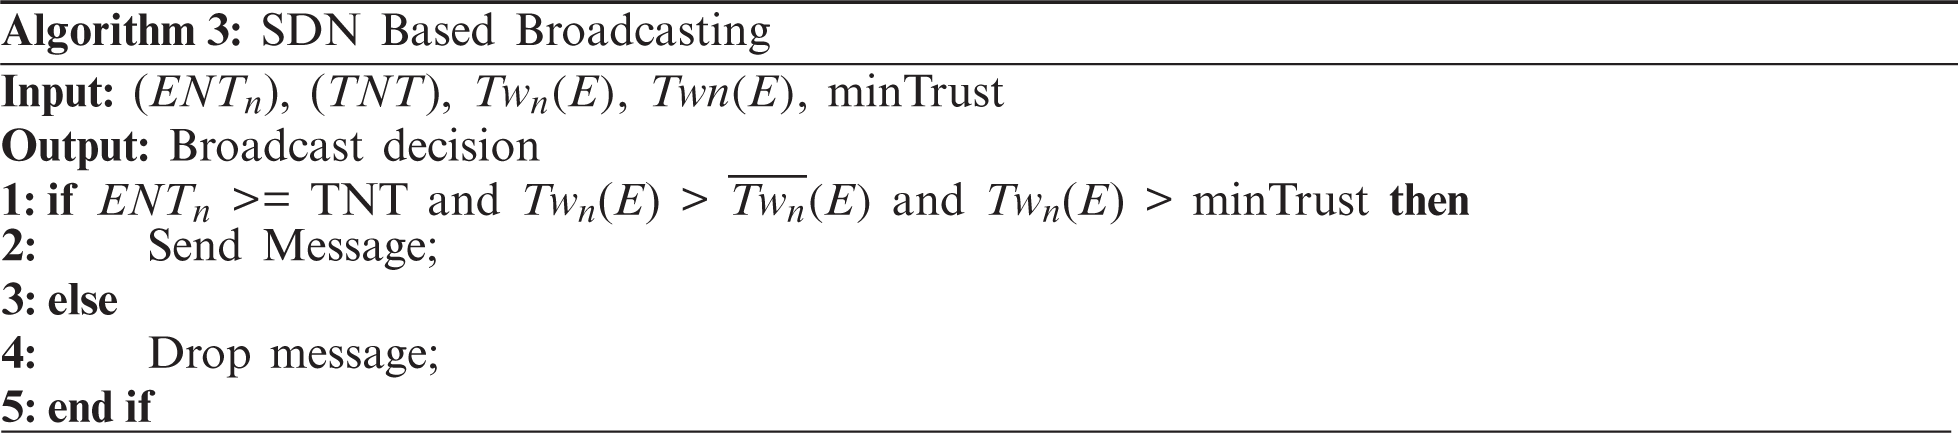
An EN after calculating the ENT and DT uses SDN based broadcasting algorithm to broadcast this message in the network (Algorithm 3). Before accepting any data from the surrounding vehicle, the ENT of the sender vehicle is compared with that of the Threshold Node Trust (TNT). If the calculated node trust is greater than the TNT, we receive the message from that vehicle. After getting the message from that vehicle, the EN checks the genuineness of the event information present in the message. If the calculated data trust is greater than the minimum event trust value, then the message containing the event information is received by the EN. By checking the node trust as well as event trust, we can easily restrict nodes to send unnecessary packets in the network. After getting confirmation about the event, the EN broadcasts this message in the network so that other nodes also get this event information and becomes alert for this. If either of these conditions will not satisfy, then the EN simply discards this message as a result, the network congestion gets reduced.
In this way, a DDoS attack can be prevented. To test the effectiveness of the proposed work, we have simulated it using the Veins hybrid simulator, which is discussed in the next section.
In this section, simulation setup and results are presented and compared with the recently proposed TBF [22] scheme. As the TBF scheme also uses trust as a parameter for misbehavior detection, we compare our scheme with the TBF scheme. We evaluate the performance of our proposed work using the following parameters: Detection Accuracy (DA), Detection Time (DT), Packet Delivery Ratio (PDR), and Energy Consumption (EC). DA reflects the percentage of malicious nodes detected. DT is the time required to detect the DDoS attack in the network. PDR gives information regarding the number of packets received by the receiver to the number of packets sent by the sender and EC shows the energy consumption during data transmission in a network.
To carry out the simulation, we have used the Veins hybrid simulator framework. This simulator uses IEEE 802.11p standard for communication [23]. Since the framework is a hybrid type, it uses OMNeT++ and Simulation of Urban Mobility (SUMO) as network and road traffic simulators respectively. These simulators are integrated using a Traffic Control Interface (TraCI). This interface provides the TCP connection between the network and road traffic simulator and maintains real-time interaction between them [24]. We simulate our work in both Grid Map and OpenStreetMap scenarios and compared the results with the TBF scheme. We simulate our work in our network where bitrate is 6 Mbps, the packet generation rate is 10 packets/s, update interval is 0.1 s, communication range of vehicle 300 m, communication range of RSU is 500 m, and IEEE 802.11p sensitivity is −80 dBm.
We compare our work with that of TBF scheme under two cases. In the first case, we keep increasing the percentage of the anomaly of vehicles in the network, but keeping the number of vehicles constant. In the second case, we change the network size, keeping the percentage of anomaly fixed, and compared the efficiency of both cases.
We perform the simulation and each simulation is an average of 20 runs with different random seeds. Hence, each run is carried out with a unique initial node placement. Initially, we performed the simulation by changing the percentage anomaly in the network while keeping the network size fixed. Later, we kept the percentage of anomaly fixed and changed the network size. Simulation results for both cases are shown in Figs. 4 and 5.
Case 1: Impact of Percentage of Anomaly on Performance Parameters:
We study the impact of the percentage anomaly on four performance parameters as mentioned earlier. Simulation is performed by creating 100 nodes in the network, out of which, we make 80 percentage nodes malicious i.e., 80 nodes. Again, out of these 80 nodes, we vary the percentage of anomaly between 20% to 100%. Based on this calculation, 20% and 100% anomaly scenarios have 16 and 80 malicious nodes respectively. The impact of percentage anomaly on DA is shown in Fig. 4a for both grid map and OpenStreetMap by using (G) and (O) notations. It is observed from the figure that when the percentage of anomaly is 20%, DA of TBDDoSA-MD scheme in grid and OpenStreetMap scenarios are 95% and 90% respectively. DA of TBF scheme in grid and OpenStreetMap scenarios at 20% anomaly are 90% and 85% respectively. It is also observed from the figure that as the percentage of anomaly increases, the DA decreases in all cases. However, it is observed that up to 70% of the anomaly, the grid map outperforms the OpenStreetMap. But, as the percentage of anomaly increases further, the OpenStreetMap gives better results than the grid scenario in TBDDoSA-MD due to the diversified network structure. The same trend is also observed in Fig. 4b. As the percentage of anomaly increases, the number of malicious nodes increases in the network as a result false event messages increase. This increase in the false event messages in the network is the prime cause of the decrease in the DA and PDR percentage. But, in TBDDoSA-MD, we take special care of the false event message propagation by checking the node trust and the event trust in our SDVN network. The impact of percentage anomaly on DT is shown in Fig. 4c for both grid map and OpenStreetMap scenarios. The figure shows that when the percentage of anomaly is 20%, DT of TBDDoSA-MD and TBF schemes in the grid and OpenStreetMap scenarios are 32, 38 s, and 30, 35 s respectively. It is also observed that the detection time increases as the percentage of anomaly increases in all cases. At the initial period, i.e., when the percentage of anomaly varies from 20% to 40%, TBF shows better results than the TBDDoSA-MD under both scenarios. However, as the percentage of anomaly moves from 60% to 100%, the detection time in TBF increases rapidly as compared to the TBDDoSA-MD scheme. By comparing the grid scenario with the OpenStreetMap it is also observed that, the DT in OpenStreetMap is always more than the grid due to the large network size and the presence of physical objects. The impact of percentage anomaly on EC is shown in Fig. 4d for both grid map and OpenStreetMap scenarios. It is observed from the figure that up to 40% of the anomaly, both schemes under different scenarios consume nearly equal energy. However, as the percentage of anomaly increases further, the EC varies in different cases. Hence, at 100% anomaly the EC of TBDDoSA-MD and TBF in the grid and OpenStreetMap scenarios are 29.6, 33.34 j and 32, 36.54 j respectively. During packet transmission in the network, some amount of energy is consumed. So, more is the packet transmission, more is the energy consumption. Because of the node trust and event information verification, TBDDoSA-MD consumed more energy in the initial period, but as the percentage of anomaly increases, false messages reduce in our scheme. As a result, energy consumption becomes lesser as compared to TBF scheme in our grid scenario.
Case 2: Impact of Network Size on Performance Parameters:
The impact of network size on performance parameters is examined. To carry out the experiment, we keep the malicious node percentage to 80% and they are always malicious (i.e., percentage of anomaly is 100%). Based on this calculation, network size having 20 nodes has 16 nodes malicious and 4 are honest. We vary the network size from 20 nodes up to 200 nodes and perform the simulation in both grid and OpenStreetMap scenarios. Simulation results are shown in Fig. 5. Figs. 5a and 5b illustrate the impact of network size on DA and PDR. It is observed from both figures that, the DA and PDR increase with the increase in network size in both grid and OpenStreetMap scenarios. The impact of network size on DT is shown in Fig. 5c for both grid map and OpenStreetMap scenarios. The figure shows that when the network size is small i.e., 20, DT of TBDDoSA-MD and TBF schemes in the grid and
OpenStreetMap scenarios are 45, 48 s and 42, 47 s respectively. But, as the size of the network increases to 200, the DT of TBDDoSA-MD and TBF schemes in the grid and OpenStreetMap scenarios are 114, 126, and 122, 140 respectively. The presence of node trust and data trust helps in the early detection of our network. It is also observed that the detection time increases as the percentage of anomaly increases in all cases. The impact of network size on EC is shown in Fig. 5d for both grid map and OpenStreetMap scenarios. When the network size is small, both the TBDDoSA-MD and TBF consume nearly equal energy in all scenarios. But, as the size of the network increases, TBF consumes more energy than the TBDDoSA-MD scheme. Hence, it is observed from results that, due to the centralized structure and the open flow nature of the used SDVN network, TBDDoSA-MD performs better than the TBF scheme with the growth of the network.
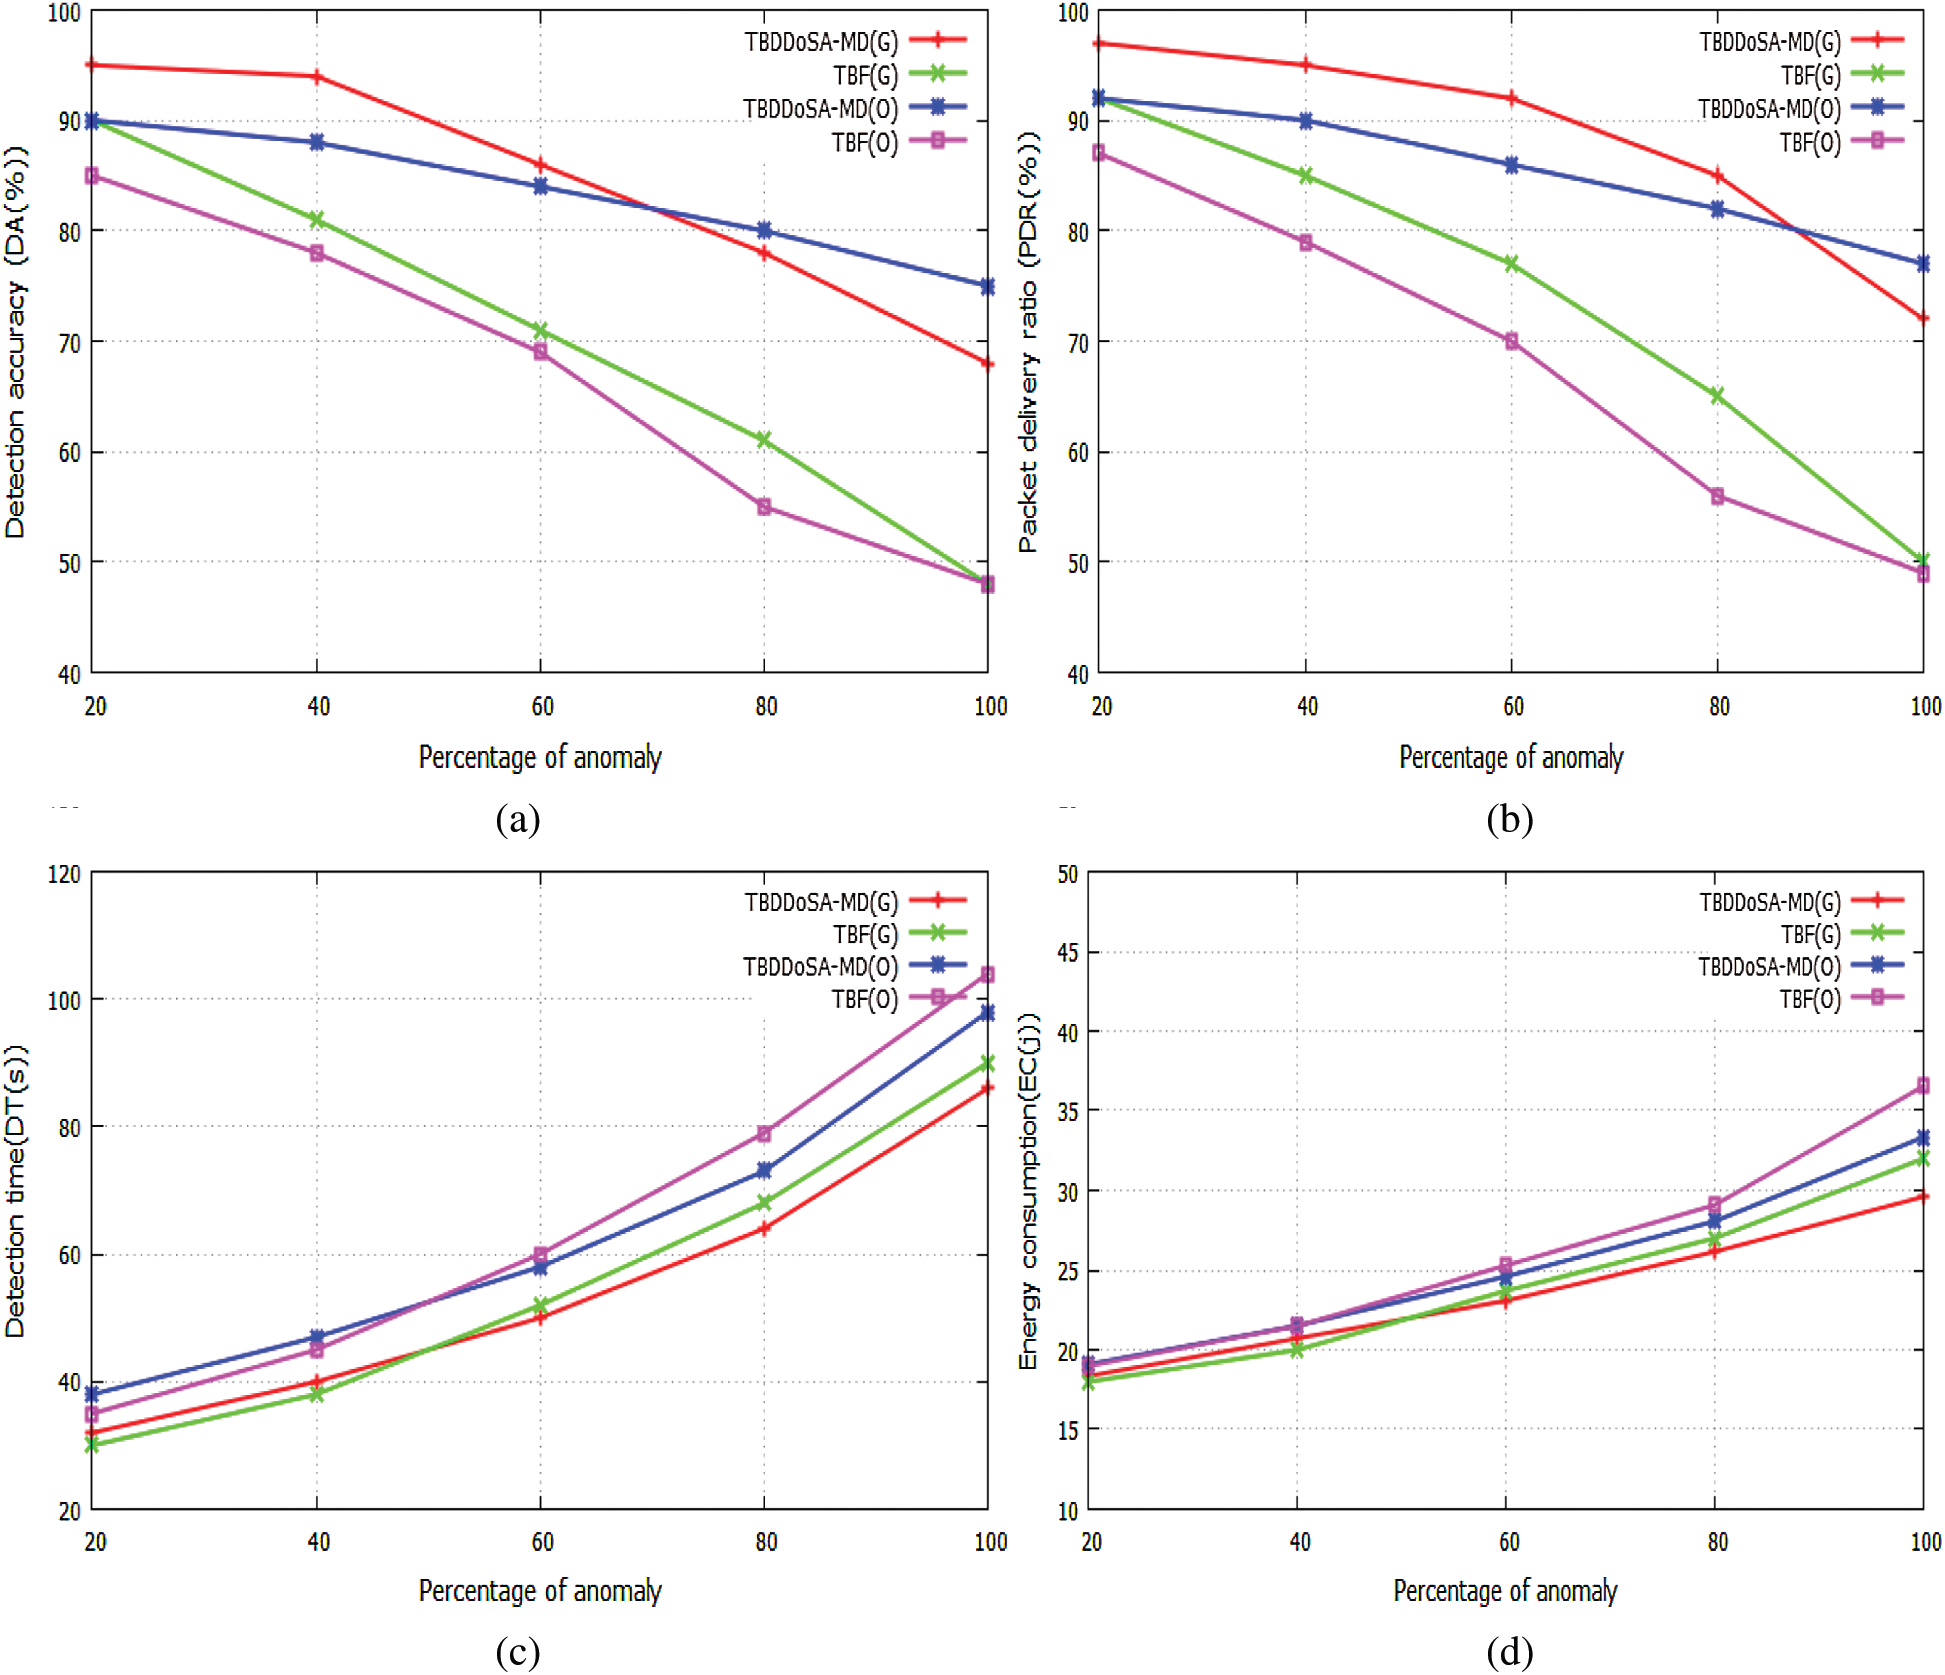
Figure 4: Impact of percentage of anomaly on four performance parameters in Grid and OpenStreetMap (a) Anomaly vs. detection accuracy (b) Anomaly vs. packet delivery ratio (c) Anomaly vs. detection time (d) Anomaly vs. energy consumption
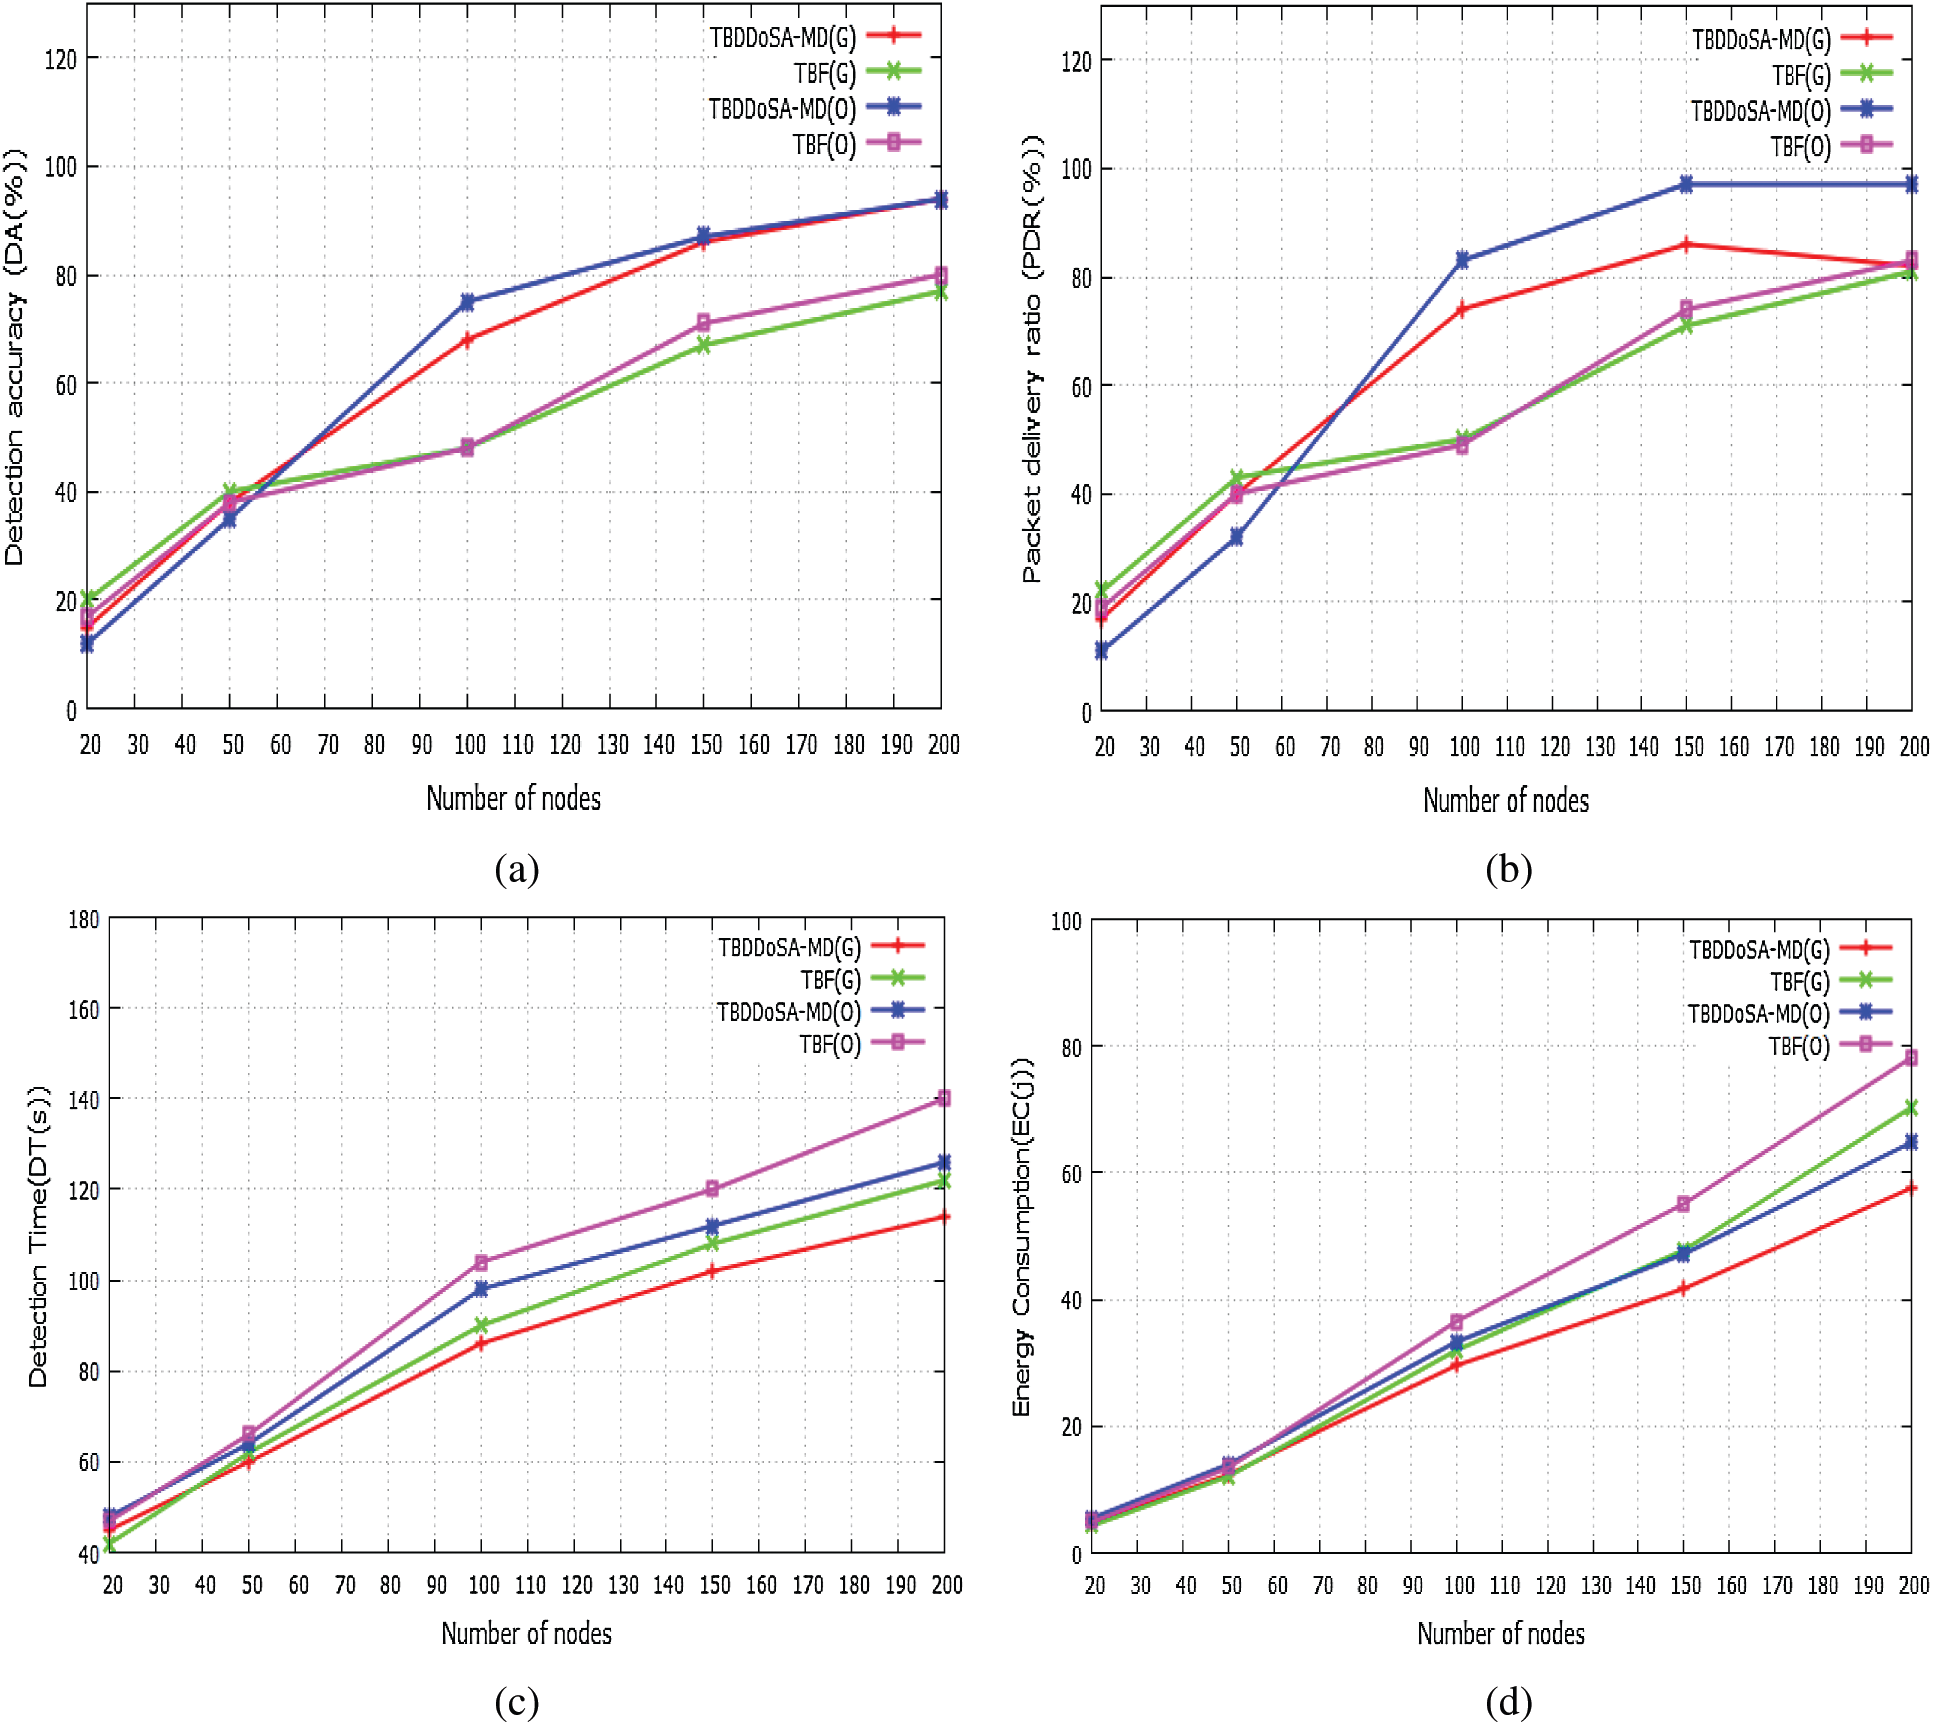
Figure 5: Impact of network size on four performance parameters in Grid and OpenStreetMap (a) Network size vs. detection accuracy (b) Network size vs. packet delivery ratio (c) Network size vs. detection time (d) Network size vs. energy consumption
In this work, a TBDDoSA-MD method is proposed to secure the SDVN from malicious attackers performing DDoS attacks. In this approach, the trust values of vehicles are calculated based on direct trust and recommendations (indirect trust). These trust values are used to check a vehicle as malicious or legitimate. If a vehicle is found to be malicious, then the messages from that vehicle are discarded in the network. For any action based on the messages from the legitimate vehicle, the authenticity of the messages is checked by using the data trust. In addition to this, the SDN concept is mainly used to reduce the network load by dividing the network plane into the control plane and the data plane. The performance of TBDDoSA-MD is evaluated in the Veins hybrid simulator, which uses OMNeT++ and Simulation of Urban Mobility (SUMO). We compared our results with the TBF scheme using the following performance parameters such as detection accuracy, packet delivery ratio, detection time, and energy consumption. Simulation results show that the proposed TBDDoSA-MD performs better as compared to the TBF scheme. From the above results, it is inferred that the proposed method would be a better misbehavior detection approach against the DDoS attack. Our work uses node trust and data trust to detect the DDoS attack; however, we can also integrate machine learning algorithms for trust calculation. In this work, we are discarding data from malicious vehicles irrespective of the validity of those data. In future work, we are also going to use machine learning methods to check the genuineness of data before discarding it.
Funding Statement: The authors received no specific funding for this study.
Conflicts of Interest: The authors declare that they have no conflicts of interest to report regarding the present study.
1. S. Zeadally, R. Hunt, S. Y. Chen, A. Irwin and A. Hassan, “Vehicular ad hoc networks (VANETSStatus, results, and challenges,” Telecommunication Systems, vol. 50, pp. 1–25, 2010. [Google Scholar]
2. Y. Yang and R. Bagrodia, “Evaluation of VANET-based advanced intelligent transportation systems,” in Proc. of the Sixth ACM Int. Workshop on VehiculAr InterNETworking, Beijing, China, pp. 3–12, 2009. [Google Scholar]
3. S. K. Bhoi and P. M. Khilar, “Vehicular communication: A survey,” IET networks, vol. 3, no. 3, pp. 204–217, 2013. [Google Scholar]
4. A. Durrani, S. Latif, R. Latif and H. Abbas, “Detection of denial of service (DoS) attack in vehicular ad hoc networks: A systematic literature review,” Adhoc & Sensor Wireless Networks, vol. 42, no. 1, pp. 35–61, 2018. [Google Scholar]
5. R. Kolandaisamy, R. Md Noor, I. Ahmedy, I. Ahmad, M. Reza Z’aba et al., “A multivariant stream analysis approach to detect and mitigate DDoS attacks in vehicular ad hoc networks,” Wireless Communications and Mobile Computing, vol. 2018, no. 10, pp. 1–13, 2018. [Google Scholar]
6. M. Poongodi, V. Vijayakumar, F. Al-Turjman, M. Hamdi and M. Ma, “Intrusion prevention system for DDoS attack on VANET with reCAPTCHA controller using information based metrics,” IEEE Access, vol. 7, pp. 158481–158491, 2019. [Google Scholar]
7. K. Verma, H. Hasbullah and A. Kumar, “Prevention of DoS attacks in VANET,” Wireless Personal Communications, vol. 73, no. 1, pp. 95–126, 2013. [Google Scholar]
8. Y. Lahrounil, C. Pereira, B. A. Bensaber and I. Biskri, “Using mathematical methods against denial of service (DoS) attacks in VANET,” in Proc. of the 15th ACM Int. Symp. on Mobility Management and Wireless Access, Miami, USA, pp. 17–22, 2017. [Google Scholar]
9. L. He and W. T. Zhu, “Mitigating DoS attacks against signature-based authentication in VANETs,” in 2012 IEEE Int. Conf. on Computer Science and Automation Engineering, Zhangjiajie, China, pp. 261–265, 2012. [Google Scholar]
10. K. Vermal, H. Hasbullah and A. Kumar, “An efficient defense method against UDP spoofed flooding traffic of denial of service (DoS) attacks in VANET,” in 2013 3rd IEEE Int. Advance Computing Conf., Ghaziabad, India, pp. 550–555, 2013. [Google Scholar]
11. K. Vermal and H. Hasbullah, “IP-CHOCK (filter)-based detection scheme for denial of service (DoS) attacks in VANET,” in 2014 Int. Conf. on Computer and Information Sciences, Kuala Lumpur Convention Center, pp. 1–6, 2014. [Google Scholar]
12. A. J. Siddiqui and A. Boukerche, “On the impact of DDoS attacks on software-defined internet-of-vehicles control plane,” in 2018 14th Int. Wireless Communications & Mobile Computing Conf., Limassol, Cyprus, pp. 1284–1289, 2018. [Google Scholar]
13. Y. Gao, H. Wu, B. Song, Y. Jin, X. Luo et al., “A distributed network intrusion detection system for distributed denial of service attacks in vehicular ad hoc network,” IEEE Access, vol. 7, pp. 154560–154571, 2019. [Google Scholar]
14. I. Ku, Y. Lu, M. Gerla, R. L. Gomes, F. Ongaro et al., “Towards software-defined VANET: Architecture and services,” in 2014 13th Annual Mediterranean Ad Hoc Networking Workshop, Piran, Slovenia, pp. 103–110, 2014. [Google Scholar]
15. N. B. Truong, G. M. Lee and Y. Ghamri-Doudane, “Software defined networking-based vehicular adhoc network with fog computing,” in 2015 IFIP/IEEE Int. Symp. on Integrated Network Management, Ottawa, ON, Canada, pp. 1202–1207, 2015. [Google Scholar]
16. S. K. Bhoi, M. S. Obaidat, D. Puthal, M. Singh and K. F. Hsiao, “Software defined network based fault detection in industrial wireless sensor networks,” in 2018 IEEE Global Communications Conf., Abu Dhabi, UAE, pp. 1–6, 2018. [Google Scholar]
17. M. Zhu, J. Cao, D. Pang, Z. He and M. Xu, “SDN-based routing for efficient message propagation in VANET,” in Int. Conf. on Wireless Algorithms, Systems, and Applications, Qufu, China, pp. 788–797, 2015. [Google Scholar]
18. I. Yaqoob, I. Ahmad, E. Ahmed, A. Gani, M. Imran et al., “Overcoming the key challenges to establishing vehicular communication: Is SDN the answer?,” IEEE Communications Magazine, vol. 55, no. 7, pp. 128–134, 2017. [Google Scholar]
19. K. S. Sahoo and D. Puthal, “SDN-assisted DDoS defense framework for the internet of multimedia things,” ACM Transactions on Multimedia Computing, Communications, and Applications, vol. 16, no. 3s, pp. 1–18, 2020. [Google Scholar]
20. B. Mahapatra, A. K. Turuk, A. Nayyar and K. S. Sahoo, “Multilevel authentication and key agreement protocol for D2D communication in LTE based C-IoT network,” Microprocessors and Microsystems, pp. 103720, 2021. [Google Scholar]
21. C. H. Piao, J. Zhao and L. J. Zheng, “Research on entropy-based collaborative filtering algorithm and personalized recommendation in e-commerce,” Service Oriented Computing and Applications, vol. 3, no. 2, pp. 147–157, 2009. [Google Scholar]
22. M. Poongodi, M. Hamdi, A. Sharma, M. Ma and P. K. Singh, “DDoS detection mechanism using trust-based evaluation system in VANET,” IEEE Access, vol. 5, pp. 183532–183544, 2019. [Google Scholar]
23. C. Sommer, D. Eckhoff, A. Brummer, D. S. Buse, F. Hagenauer et al., “Veins: The open source vehicular network simulation framework,” in Recent Advances in Network Simulation, Berlin, Germany: Springer, pp. 215–252, 2019. [Google Scholar]
24. C. Sommer, R. German and F. Dressler, “Bidirectionally coupled network and road traffic simulation for improved IVC analysis,” IEEE Transactions on Mobile Computing, vol. 10, no. 1, pp. 3–15, 2010. [Google Scholar]
 | This work is licensed under a Creative Commons Attribution 4.0 International License, which permits unrestricted use, distribution, and reproduction in any medium, provided the original work is properly cited. |