DOI:10.32604/cmc.2021.020765
| Computers, Materials & Continua DOI:10.32604/cmc.2021.020765 | |
| Article |
A Material Identification Approach Based on Wi-Fi Signal
1Cyberspace Institute of Advanced Technology, Guangzhou University, Guangzhou, 510700, China
2PCL Research Center of Cyberspace Security, Peng Cheng Laboratory, Shenzhen, 518052, China
3Department of Computer Science and Computer Engineering, University of Arkansas, Fayetteville, 72701, USA
4College of Electrical Engineering, Zhejiang University, Hangzhou, 310058, China
5China Industrial Control Systems Cyber Emergency Response Team, Beijing, 100040, China
*Corresponding Author: Lihua Yin. Email: yinlh@gzhu.edu.cn
Received: 07 June 2021; Accepted: 22 July 2021
Abstract: Material identification is a technology that can help to identify the type of target material. Existing approaches depend on expensive instruments, complicated pre-treatments and professional users. It is difficult to find a substantial yet effective material identification method to meet the daily use demands. In this paper, we introduce a Wi-Fi-signal based material identification approach by measuring the amplitude ratio and phase difference as the key features in the material classifier, which can significantly reduce the cost and guarantee a high level accuracy. In practical measurement of Wi-Fi based material identification, these two features are commonly interrupted by the software/hardware noise of the channel state information (CSI). To eliminate the inherent noise of CSI, we design a denoising method based on the antenna array of the commercial off-the-shelf (COTS) Wi-Fi device. After that, the amplitude ratios and phase differences can be more stably utilized to classify the materials. We implement our system and evaluate its ability to identify materials in indoor environment. The result shows that our system can identify 10 commonly seen liquids with an average accuracy of 98.8%. It can also identify similar liquids with an overall accuracy higher than 95%, such as various concentrations of salt water.
Keywords: Internet of Things; Wi-Fi signal; channel state information; material identification; noise elimination
Internet of Things (IoT) has changed people’s lives [1]. It has been applied to many scenarios such as healthcare [2], threat detection [3,4], smart cars [5,6], smart homes [7,8], and smart cities [9,10]. Material identification is widely used in IoT. For example, the detection of explosives at airports is an important link of security detection [11]. A robot can control holding power by identifying what it grasps to avoid breaking fragile items such as eggs [12]. Material identification can also be applied to food quality analysis or food safety detection [13].
Existing material identification approaches, such as infrared spectroscopy [14], atomic emission spectroscopy [15], atomic absorption spectroscopy [16], Raman spectroscopy [17], X-ray diffraction [18], CT/MRI [19] and ultrasound [20], are widely used in many fields. These approaches depend on expensive instruments, complicated pre-treatments and professional users. What’s more, some of approaches using ultra-high frequency electromagnetic waves, which are harmful to human health [21,22]. A number of new approaches to identify material have been proposed in recent years. For example, infrared sensors can be used to identify material to help mobile robots control speed [23], but the identification is only limited to the surface material of the target. A mobile sensor system, which is based on the photoacoustic effect, can be used to characterize the nutrients in liquid foods and detect food additives [24]. However, it cannot detect the properties of target in opaque containers. The photo-based system can be used to identify liquid with high surface tension [25], or automatically identify wood [26]. While it requires a lighting environment and will cause privacy risk.
Compared to the existing works above, Wi-Fi based method is no need to ubiquitous infrastructure. Wi-Fi signals can penetrate most targets to achieve deep detection. Additionally, it does not require a lighting environment, which protects user privacy. Therefore, Wi-Fi based material identification is a promising research direction. However, there are two main challenges.
The first challenge is how to understand the relationship between the channel state information (CSI) and the type of target material. Each material has its unique physical properties. Unlike the single parameter method designed by TagScan [27], we believe that simultaneously using the two features, amplitude and phase, is beneficial for improving the accuracy of identification. We try to associate them with the physical properties of material.
The second challenge is that the raw CSI obtained from Wi-Fi signal has noise. We find that in a single time-domain, we can obtain very similar amplitude/phase fluctuations from the two receiving antennas, which share the same Wi-Fi network interface card (NIC) and the same transmitting antenna. We try to calculate the amplitude ratio and phase difference of the two paths, to obtain stable values for identification.
In this paper, we propose a material identification approach based on Wi-Fi signal. We find that when the wireless signal penetrates target, amplitude and phase of the signal changes. Meanwhile, the changes vary depending on material types, which makes them suitable for material identification. However, the omnidirectional antennas used by commercial Wi-Fi routers suffer serious multipath effects, and the transceivers of wireless signals are accompanied by hardware noise. The raw amplitude/phase values extracted are very rough, which cannot be directly applied to fine-grained material identification. Our main contributions are as follows:
• We design a material identification approach combining amplitude ratio and phase difference. These two features are associated with the dielectric constant and the loss factor of material, which can therefore significantly improve the effectiveness.
• We propose a solution to remove the software/hardware noise in captured raw CSI, which improves the stability of amplitude ratio and phase difference. This solution depends on the similarity of router antennas, which can help to eliminate noise and makes it lightweight.
• We implement a prototype system and evaluate it in an indoor environment. The experiment results show a 98.8% accuracy of our method, which outperforms the previous research [28].
The rest of this paper is organized as follows. In Section 2, we surveys recent works on material identification and CSI amplitude/phase noise elimination. Section 3 reviews the background of this paper and analyzes the theory of material identification. In Section 4, we present the proposed Wi-Fi-based material identification approach in detail. We explain the implementation of experiment in Section 5. The experiment results are shown in Section 6. Section 7 summarizes this paper.
Our contributions are mainly focused on material identification and amplitude/phase noise elimination. The related work is summarized as follows.
Material Identification: The most recent works using wireless signal for material identification are TagScan [27], LiquID [29] and WiMi [28]. TagScan [27] can obtain stable phase and amplitude from radio frequency identification (RFID) tags directly, using them to identify target material. However, additional hardware is required, and the same approach cannot be applied to Wi-Fi devices. LiquID [29] uses an ultra wide band (UWB) device to estimate picosecond flight time. It compensates for the container effect on the multipath, and estimates the dielectric constant, to identify liquid. A special container and UWB devices are needed, which are too expensive. WiMi [28] is a low-cost approach utilizing commercial Wi-Fi infrastructure to identify materials, where a new material feature Ω is extracted independent of the target size and extra noise is eliminated by using a complex noise reduction approach. However, since the electromagnetic wave behavior is neglected, the shape of the target material can still affect the system. Additionally, the variety of materials will significantly impede the method based on the individual feature, i.e., Ω.
Amplitude/Phase Noise Elimination: The raw CSI captured by commercial off-the-shelf (COTS) Wi-Fi devices inevitably contains a lot of noise, which will affect the fluctuation and absolute value of the CSI. Most of the existing works about Wi-Fi sensing refer to motion sensing, while overlook the extraction of absolute amplitude/phase values. Principal component analysis (PCA) has been widely used to eliminate the environmental noise of a single antenna [30,31], but it is only designed for blind signal separation and fluctuation feature extraction. Some researchers have implemented linear regression [32] and multiple linear regression [33] to eliminate noise, but their methods are resource consuming for IoT environment.
Unlike the above works, we develop our system based on amplitude ratio and phase difference of Wi-Fi signal. These two features can be conveniently extracted from the CSI and can correct the bias of
In this section, we will introduce the basic concepts of CSI and noise. The relationship between CSI and target material type will also be described.
CSI is a channel attribute in a communication link, which describes the attenuation factor of a signal on each transmission path. IEEE 802.11 uses orthogonal frequency division multiplexing (OFDM) scheme to modulate signals. Signals will be transmitted through multiple orthogonal subcarriers, and each subcarrier has its own amplitude and phase [34]. The channel frequency response (CFR) of a single CSI entry can be expressed as [35]:
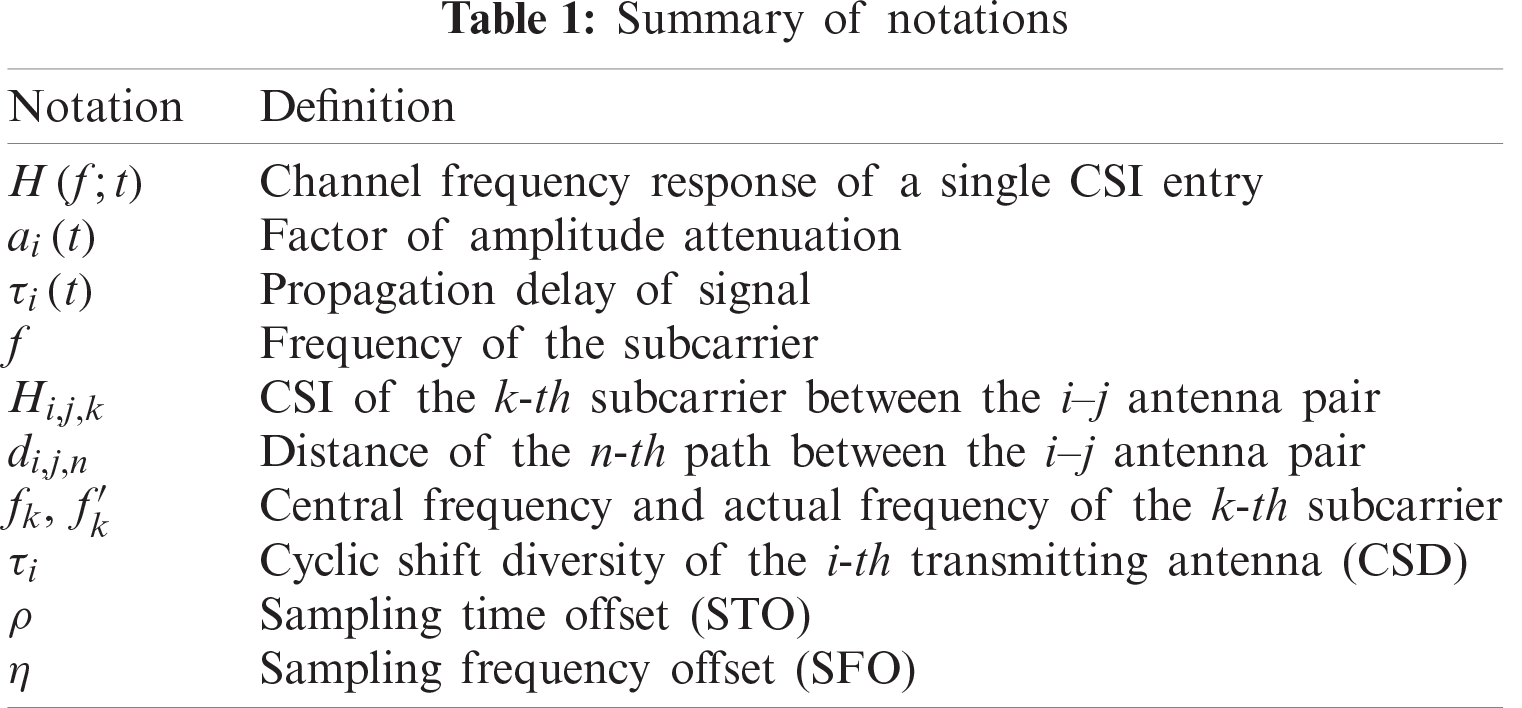
The summary of notations is shown in Tab. 1. In Wi-Fi systems with multi-input multi-output (MIMO), the measured CSI is affected by multipath effect, transmit/receive processing, and software/hardware errors [36], which can be expressed as:
We need to extract information from the multipath channel, which is associated with the target material type. Therefore, it is necessary to find a way to eliminate the influence of the multipath effect, CSD, STO, and SFO. A denoising approach is proposed in this paper. We choose the relative position of the target material and Wi-Fi antenna to reduce multipath effect. By using the two transmitting antennas on the same circuit board, the impact of STO and SFO can be reduced, and we use ratio or difference of CSI to eliminate CSD impact. The approach will be discussed in detail in Section 4.
CSI can be used in many fields, such as passive perception and device-to-device communication [37,38]. Thanks to the emergence of new tools, it is easy to obtain CSI on commercial Wi-Fi network cards. There are two main tools for extracting CSI from the Wi-Fi NIC, which are the 802.11n CSI tool [39] and the Atheros CSI tool [40]. The 802.11n CSI tool uses the Intel 5300 Wi-Fi NIC to provide the compressed CSI with 30 subcarriers, and the Atheros CSI tool provides uncompressed CSI with 56 subcarriers. Considering the quality of the raw CSI, we choose the Atheros CSI tool. More subcarriers will be more conducive to our extraction of stable CSIs.
Some of the physical properties of the wireless signal, such as amplitude and phase, are recorded in CSI. Owning to its variable speed, wireless signals will vary as they penetrate different material. The refractive index of material can be expressed as:
The summary of notations is shown in Tab. 2. The speed of the wireless signal in the material will slow down, but its frequency will not change, then the wavelength will become smaller. It can be described as:
The relationship between the refractive index and the complex permittivity can be expressed as [41]:
Each pure material has a corresponding complex dielectric constant, which will change the amplitude/phase of the wireless signal when the signal penetrates the material. When the shape and position of the material are fixed, changes in signal amplitude and phase are related to the dielectric constant and the loss factor of material [29]. This is the theoretical basis for us to select the features of the CSI that can be used to identify material.

We propose a material identification system, which can detect stable CSI of Wi-Fi signal penetrating the target material and identify the material type. The system workflow is shown in Fig. 1. The process contains data collection, CSI preprocessing and material identification. In data collection, Wi-Fi routers are used for transmit and receive data packets of Wi-Fi signal. After receiving data packets, the raw CSI is extracted, and sent to CSI pre-processing for analysis. Then, the amplitude and phase are obtained, and the amplitude ratio and phase difference of the CSI are calculated, which are the features used for material identification. As the noise contained in the raw CSI will affect the effectiveness, we present a denoising algorithm to get the stable values of features needed. In material identification, the average amplitude ratios/phase differences are collected as the identification samples. The support vector machines (SVM) is a machine learning approach based on statistical learning theory, which can be used for data classification and regression analysis. We use the material identification samples and the SVM classifier to identify the material type. Details will be described in this section.

Figure 1: System workflow of the approach
Wi-Fi systems supporting MIMO-OFDM are typically equipped with multiple antennas. In our system, two antennas on the same Wi-Fi router are used as the receiving antennas, and one antenna on the other Wi-Fi router is used as the transmitting antenna, to form an antenna array. We collect the CSI of the two pairs of antennas simultaneously. As shown in Fig. 2a, Tx/Rx is the transmitting/receiving antenna of the Wi-Fi router, and LoS is line-of-sight of two antennas. The target material is located on LoS1 and close to Rx1. We hope that the amplitude ratio and phase difference can be affected by the type of target material as much as possible. To achieve this goal, we need to make full use of the Fresnel zone [42] and the structure of Wi-Fi routers. As shown in Fig. 2a, we keep the target material on the LoS of path 1 and away from path 2, thus reducing the impact of path 2. In the meanwhile, we put the target material near Rx1, to block the inner Fresnel zone of Rx1 [42]. This method reduces diffraction and reflection signals reaching the receiver, allowing the receiver to obtain more wireless signals penetrating the material. The impact of size, shape and position of the target material can also be reduced.

Figure 2: Experimental design: (a) an antenna array composed of three antennas in two Wi-Fi routers; (b) two Wi-Fi routers receive and transmit Wi-Fi signals on both sides of the liquid-filled container
In this section, we will explain the operations of CSI pre-processing, including extraction of amplitude ratio and phase difference.
4.2.1 Amplitude Ratio Extraction
The amplitude of raw CSI oscillates with the change of multipath and the fluctuation of routers, as shown in Fig. 3. It is difficult to directly obtain a stable amplitude value. We design a denoising method to eliminate the impact of noise. First, we remove the outliers in the amplitude extracted from raw CSI. We calculate the median

Figure 3: The raw amplitude fluctuation
4.2.2 Phase Difference Extraction
In general, the phase extracted from raw CSI contains noise caused by delays and errors. We find that since the two receiving antennas are on the same circuit board, their sampling clock and oscillator clock are consistent, and the two antennas receive the signal almost at the same time. CSIs of the two paths are in the same time-domain, which effectively reduces the impact caused by objects in the surrounding environment. As shown in Fig. 4b, for antenna pairs with the same transmitting antenna, the fluctuations of their phase are very similar, just like amplitude fluctuations. After unwrapping [44] and Kalman filtering, we obtain a stable phase difference.

Figure 4: (a) The CSI amplitude and (b) the CSI phase in an antenna array
We have discussed the relationship between CSI and the type of material in Section 2. To verify our point, we use four bottles of pure water and one bottle of salt water with a concentration of 20 g/100 ml as our target material (the saturated solubility of salt in water is about 36 g/100 ml), since liquid shape is easy to control. We conduct the tests under the same environment, to preliminarily verify the repeatability and response of the approach to different types of material. The system is equipped with three transmitting antennas and three receiving antennas. To strengthen identification effect, we choose the antenna pair with more stable amplitude ratio/phase difference for testing. We combine the material identification database and SVM classifier to identify the target material. Please note that while we try to ensure the environment of all test groups were the same, it is difficult to completely avoid interference caused by factors, such as position changes, volume changes, multipath changes, and hardware fluctuations during multiple measurements. The results are shown in Fig. 5. We place the test results in a Cartesian coordinate system, taking the amplitude ratio as the abscissa and the phase difference as the ordinate. We find that the two liquids were clearly clustered in two clusters. After multiple measurements of pure water, the characteristic values are still in the pure water cluster. The results show that our approach offers a good repeatability of the same type of material. In the meantime, it has a strong ability to identify material with large differences in composition.
5 Implementation and Experiment
This section describes the specific operations and the results of our experiments, including implementation, basic experiments and identification performance.
Hardware Setup: We use two TP-LINK WDR4900 v2 Wi-Fi routers as transmitter and receiver. The Wi-Fi routers work in the 5 GHz frequency band. The transmitter work in 802.11n access point (AP) mode and transmits a data packet every 10 ms. The receiver work in 802.11n client mode.

Figure 5: The preliminary test results of the material identification effect
Experimental Environment: To evaluate the material identification performance of our approach, we conduct experiments in a common family living room. Due to the presence of furniture and walls, there are multipath in the living room. The distance between the laptop and routers is 2 m, and the interval between routers is 1 m. The target material is located in the LoS, as close as possible to the receiving antenna. The position of the target material is fixed.
Target Material: We use 10 types of common liquids as our target material: pure water, vinegar, 75% ethanol, 5 g/100 ml sugar water, 5 g/100 ml salt water, orange juice, apple juice, milk, Coca Cola and beer. The liquids are placed in a plastic beaker made of polypropylene (PP) with a diameter of 11 cm, and the volume of liquids used in the test is 1 L.
5.2.1 Verification of Amplitude Denoising
The experiments are implemented to verify the effectiveness of the amplitude denoising method. We collect the CSI in 10 s and repeat it 20 times. We obtain the raw amplitude values and amplitude ratios, and process them with the same denoising operation. The results are shown in Fig. 6. The processed amplitudes of a single antenna pair are still not stable enough. For the two antenna pairs, the processed amplitude ratios are obviously much more stable. The results demonstrate the effectiveness of our amplitude denoising method.

Figure 6: Performance of the CSI amplitude denoising
5.2.2 Verification of Phase Denoising
We use the phase difference extracted from the obtained CSI, and process it with unwrapping and Kalman filtering. The results are shown in Fig. 7. The phase values of raw CSI (*) are evenly distributed in the polar coordinate system. The processed phase difference values (*) are concentrated in an area of about 5°. The distance between the point and the center of the circle in Fig. 7 represents the amplitude value. It can be seen that the unprocessed amplitude values are still evenly distributed. The results show that with the help of our method, we can obtain a CSI phase difference value with a fluctuation range of 5°, which is more stable than existing work [28].

Figure 7: The raw CSI phase (∗) and the processed CSI phase difference (∗)
5.3 Identification Performance
We evaluate the identification performance of our system by repeating the experiment 20 times for each target material. Our system employed 30 packets for material identification. Fig. 8 shows the experiment results of 10 types of liquids. We achieved an average accuracy rate of 98.8%.

Figure 8: Identification performance for 10 liquids
To evaluate the identification performance of the system for similar materials, we test one bottle of pure water and three bottles of salt water with different concentrations (1.2 g/100 ml, 2.7 g/100 ml and 5.9 g/100 ml). Fig. 9 shows the test results. For materials with similar components, we obtained an average accuracy of 95.8%. The identification ability decreases with the increasing concentration. We believe that it is because when a small amount of salt is dissolved in pure water, the dielectric constant and loss factor of the solution will change significantly (this is manifested as a rapid increase in conductivity), and this change decreases with the rise of salt concentration. The experiment results show that our approach has a good distinguishing ability between pure water and different concentrations of salt water.

Figure 9: Identification performance for different concentrations of salt water
We presented a new material identification approach, which used Wi-Fi signal to identify material. First, we investigated previous works about material identification approaches, analyzed the relationship between the CSI of Wi-Fi signal and target material type, and found two distinguishing features which were amplitude ratio and phase difference. The two features could be used to identify material, but the software/hardware noise of CSI affected the effectiveness. To reduce the volatility of the raw CSI, a new noise elimination method was proposed. We used the designed antenna array and basic signal processing methods to obtain stable features, therefore improving the accuracy of material identification. We implemented a prototype system and evaluated it in an indoor environment. The experiment results showed that the accuracy of our system was higher than previous work.
Funding Statement: This work supports in part by National Key R&D Program of China (No.2018YFB2100400), National Science Foundation of China (No. 61872100), Industrial Internet Innovation and Development Project of China (2019), PCL Future Regional Network Facilities for Large-scale Experiments and Applications (PCL2018KP001), Guangdong Higher Education Innovation Team (NO. 2020KCXTD007).
Conflicts of Interest: The authors declare that they have no conflicts of interest to report regarding the present study.
1. J. Qiu, Z. Tian, C. Du, Q. Zuo, S. Su et al., “A survey on access control in the age of internet of things,” IEEE Internet of Things Journal, vol. 7, no. 6, pp. 4682– 4696, 2020. [Google Scholar]
2. V. S. Naresh, S. S. Pericherla, P. Sita and S. Reddi, “Internet of things in healthcare: Architecture, applications, challenges, and solutions,” Computer Systems Science and Engineering, vol. 35, no. 6, pp. 411–421, 2020. [Google Scholar]
3. X. Zhao, H. Zhu, X. Qian and C. Ge, “Design of intelligent drunk driving detection system based on Internet of Things,” Journal of Internet of Things, vol. 1, no. 2, pp. 55–62, 2019. [Google Scholar]
4. H. Zhu, D. Gao and S. Zhang, “A perceptron algorithm for forest fire prediction based on wireless sensor networks,” Journal of Internet of Things, vol. 1, no. 1, pp. 25–31, 2019. [Google Scholar]
5. S. Su, Z. Tian, S. Liang, S. Li, S. Du et al., “A reputation management scheme for efficient malicious vehicle identification over 5G networks,” IEEE Wireless Communications, vol. 27, no. 3, pp. 46–52, 2020. [Google Scholar]
6. W. Liu, Y. Tang, F. Yang, C. Zhang and D. Cao, “Internet of things based solutions for transport network vulnerability assessment in intelligent transportation systems,” Computers Materials & Continua, vol. 65, no. 3, pp. 2511–2527, 2020. [Google Scholar]
7. B. K. Sovacool and D. D. F. Del Rio, “Smart home technologies in Europe: A critical review of concepts, benefits, risks and policies,” Renewable and Sustainable Energy Reviews, vol. 120, no. 4, pp. 109663, 2020. [Google Scholar]
8. J. Park and S. Kim, “Noise cancellation based on voice activity detection using spectral variation for speech recognition in smart home devices,” Intelligent Automation & Soft Computing, vol. 26, no. 1, pp. 149–159, 2020. [Google Scholar]
9. J. Qiu, L. Du, D. Zhang, S. Su and Z. Tian, “Nei-TTE: Intelligent traffic time estimation based on fine-grained time derivation of road segments for smart city,” IEEE Transactions on Industrial Informatics, vol. 16, no. 4, pp. 2659–2666, 2020. [Google Scholar]
10. S. Jha, L. Nkenyereye, G. P. Joshi and E. Yang, “Mitigating and monitoring smart city using internet of things,” Computers Materials & Continua, vol. 65, no. 2, pp. 1059–1079, 2020. [Google Scholar]
11. C. A. Kendziora, R. Furstenberg, M. Papantonakis, V. Nguyen, J. Byers et al., “Infrared photothermal imaging spectroscopy for detection of trace explosives on surfaces,” Applied Optics, vol. 54, no. 31, pp. F129–F138, 2015. [Google Scholar]
12. S. Cussat-Blanc and J. Pollack, “Cracking the egg: Virtual embryogenesis of real robots,” Artificial Life, vol. 20, no. 3, pp. 361–383, 2014. [Google Scholar]
13. U. Ha, Y. Ma, Z. Zhong, T. M. Hsu and F. Adib, “Learning food quality and safety from wireless stickers,” in Proc. of the 17th ACM Workshop on Hot Topics in Networks, Redmond, WA, USA, pp. 106–112, 2018. [Google Scholar]
14. C. Pasquini, “Near infrared spectroscopy: Fundamentals, practical aspects and analytical applications,” Journal of the Brazilian Chemical Society, vol. 14, no. 2, pp. 198–219, 2003. [Google Scholar]
15. R. F. Barth, D. M. Adams, A. H. Soloway, E. B. Mechetner, F. Alam et al., “Determination of boron in tissues and cells using direct-current plasma atomic emission spectroscopy,” Analytical Chemistry, vol. 63, no. 9, pp. 890–943, 1991. [Google Scholar]
16. J. Gupta and A. Gupta, “Determination of trace metals in the leaves of Rauwolfia serpentina by using atomic absorption spectroscopy,” International Journal of Chemical Studies, vol. 4, pp. 94–96, 2016. [Google Scholar]
17. S. P. Mulvaney and C. D. Keating, “Raman spectroscopy,” Analytical Chemistry, vol. 72, no. 12, pp. 145–158, 2000. [Google Scholar]
18. H. Toraya, “Introduction to X-ray analysis using the diffraction method,” Rigaku Journal, vol. 32, no. 2, pp. 35–43, 2016. [Google Scholar]
19. H. Zhou, Y. X. J. Wang, H. Y. Lou, X. J. Xu and M. M. Zhang, “Hepatic sinusoidal obstruction syndrome caused by herbal medicine: CT and MRI features,” Korean Journal of Radiology: Official Journal of the Korean Radiological Society, vol. 15, no. 2, pp. 218–225, 2014. [Google Scholar]
20. D. E. Goertz, E. Cherin, A. Needles, R. Karshafian, A. S. Brown et al., “High frequency nonlinear B-scan imaging of microbubble contrast agents,” IEEE Transactions on Ultrasonics, Ferroelectrics, and Frequency Control, vol. 52, no. 1, pp. 65–79, 2005. [Google Scholar]
21. R. M. Marsh and M. Silosky, “Patient shielding in diagnostic imaging: Discontinuing a legacy practice,” American Journal of Roentgenology, vol. 212, no. 4, pp. 755–757, 2019. [Google Scholar]
22. W. J. Zhi, L. F. Wang and X. J. Hu, “Recent advances in the effects of microwave radiation on brains,” Military Medical Research, vol. 4, no. 1, pp. 1–14, 2017. [Google Scholar]
23. J. Sankar, S. Adarsh and K. I. Ramachandran, “Performance evaluation of ultrasonic and infrared waves on human body and metal surfaces for mobile robot navigation,” Materials Today: Proceedings, vol. 5, no. 8, pp. 16516–16525, 2018. [Google Scholar]
24. T. Rahman, A. T. Adams, P. Schein, A. Jain, D. Erickson et al., “Nutrilyzer: A mobile system for characterizing liquid food with photoacoustic effect,” in Proc. of the 14th ACM Conf. on Embedded Network Sensor Systems CD-ROM, Stanford, CA, USA, pp. 123–136, 2016. [Google Scholar]
25. S. Yue and D. Katabi, “Liquid testing with your smartphone,” in 17th Annual Int. Conf., Las Vegas, Nevada, USA, pp. 275–286, 2019. [Google Scholar]
26. J. Števek, S. Katuščák, L. Dubinyová and M. Fikar, “An automatic identification of wood materials from color images,” in 2016 Cybernetics & Informatics (K&I). Geneva, Switzerland, pp. 1–6, 2016. [Google Scholar]
27. A. Dhekne, M. Gowda, Y. Zhao, H. Hassanieh and R. R. Choudhury, “Liquid: A wireless liquid identifier,” in Proc. of the 16th Annual Int. Conf. on Mobile Systems, Applications, and Services, Munich, Germany, pp. 442–454, 2018. [Google Scholar]
28. C. Feng, J. Xiong, L. Chang, J. Wang, X. Chen et al., “WiMi: Target material identification with commodity Wi-Fi devices,” in 2019 IEEE 39th Int. Conf. on Distributed Computing Systems, Dallas, TX, USA, pp. 700–710, 2019. [Google Scholar]
29. A. Dhekne, M. Gowda, Y. Zhao, H. Hassanieh and R. R. Choudhury, “Liquid: A wireless liquid identifier,” in Proc. of the 16th Annual Int. Conf. on Mobile Systems, Applications, and Services, Munich, Germany, pp. 442–454, 2018. [Google Scholar]
30. W. Wang, A. X. Liu, M. Shahzad, K. Ling and S. Lu, “Understanding and modeling of WiFi signal based human activity recognition,” in Proc. of the 21st Annual Int. Conf. on Mobile Computing and Networking, Paris, France, pp. 65–76, 2015. [Google Scholar]
31. C. Wu, Z. Yang, Z. Zhou, K. Qian, Y. Liu et al., “PhaseU: Real-time LoS identification with WiFi,” in 2015 IEEE Conf. on Computer Communications (INFOCOMHong Kong, China, pp. 2038–2046, 2015. [Google Scholar]
32. M. Chowdhury and I. Stoica, “Efficient coflow scheduling without prior knowledge,” ACM Sigcomm Computer Communication Review, vol. 45, no. 4, pp. 393–406, 2015. [Google Scholar]
33. Y. Ma, G. Zhou, S. Wang, H. Shao and W. Jung, “SignFi: Sign language recognition using WiFi,” Proceedings of the ACM on Interactive, Mobile, Wearable and Ubiquitous Technologies, vol. 2, no. 1, pp. 1–21, 2018. [Google Scholar]
34. G. L. Stuber, J. R. Barry, S. W. Mclaughlin, Y. Li and M. A. Ingram, “Broadband MIMO-OFDM wireless communications,” Proceedings of the IEEE, vol. 92, no. 2, pp. 271–294, 2004. [Google Scholar]
35. D. Tse and P. Viswanath, “The wireless channel,” in Fundamentals of Wireless Communication. vol. 1. New York, USA: Cambridge University Press, pp. 21–22, 2005. [Google Scholar]
36. Y. Ma, G. Zhou and S. Wang, “WiFi sensing with channel state information: A survey,” ACM Computing Surveys, vol. 52, no. 3, pp. 1–36, 2019. [Google Scholar]
37. M. Waqas, M. Ahmed, J. Zhang and Y. Li, “Confidential information ensurance through physical layer security in device-to-device communication,” in 2018 IEEE Global Communications Conf. (GLOBECOMAbu Dhabi, United Arab Emirates, pp. 1–7, 2018. [Google Scholar]
38. M. Waqas, M. Ahmed, Y. Li, D. Jin and S. Chen, “Social-aware secret key generation for secure device-to-device communication via trusted and non-trusted relays,” IEEE Transactions on Wireless Communications, vol. 17, no. 6, pp. 3918–3930, 2018. [Google Scholar]
39. D. Halperin, W. Hu, A. Sheth and D. Wetherall, “Tool release: Gathering 802.11n traces with channel state information,” ACM Sigcomm Computer Communication Review, vol. 41, no. 1, pp. 53, 2011. [Google Scholar]
40. Y. Xie, Z. Li and M. Li, “Precise power delay profiling with commodity Wi-Fi,” IEEE Transactions on Mobile Computing, vol. 18, no. 6, pp. 1342–1355, 2018. [Google Scholar]
41. R. L. Haupt, “An introduction to genetic algorithms for electromagnetics,” IEEE Antennas and Propagation Magazine, vol. 37, no. 2, pp. 7–15, 1995. [Google Scholar]
42. H. Wang, D. Zhang, J. Ma, Y. Wang, Y. Wu et al., “Human respiration detection with commodity WiFi devices: Do user location and body orientation matter?” in Proc. of the 2016 ACM Int. Joint Conf. on Pervasive and Ubiquitous Computing, Heidelberg, Germany, pp. 25–36, 2016. [Google Scholar]
43. Q. Li, R. Li, K. Ji and W. Dai, “Kalman filter and its application,” in 8th Int. Conf. on Intelligent Networks and Intelligent Systems, Tianjin, China, pp. 74–77, 2015. [Google Scholar]
44. K. Itoh, “Analysis of the phase unwrapping algorithm,” Applied Optics, vol. 21, no. 14, pp. 2470, 1982. [Google Scholar]
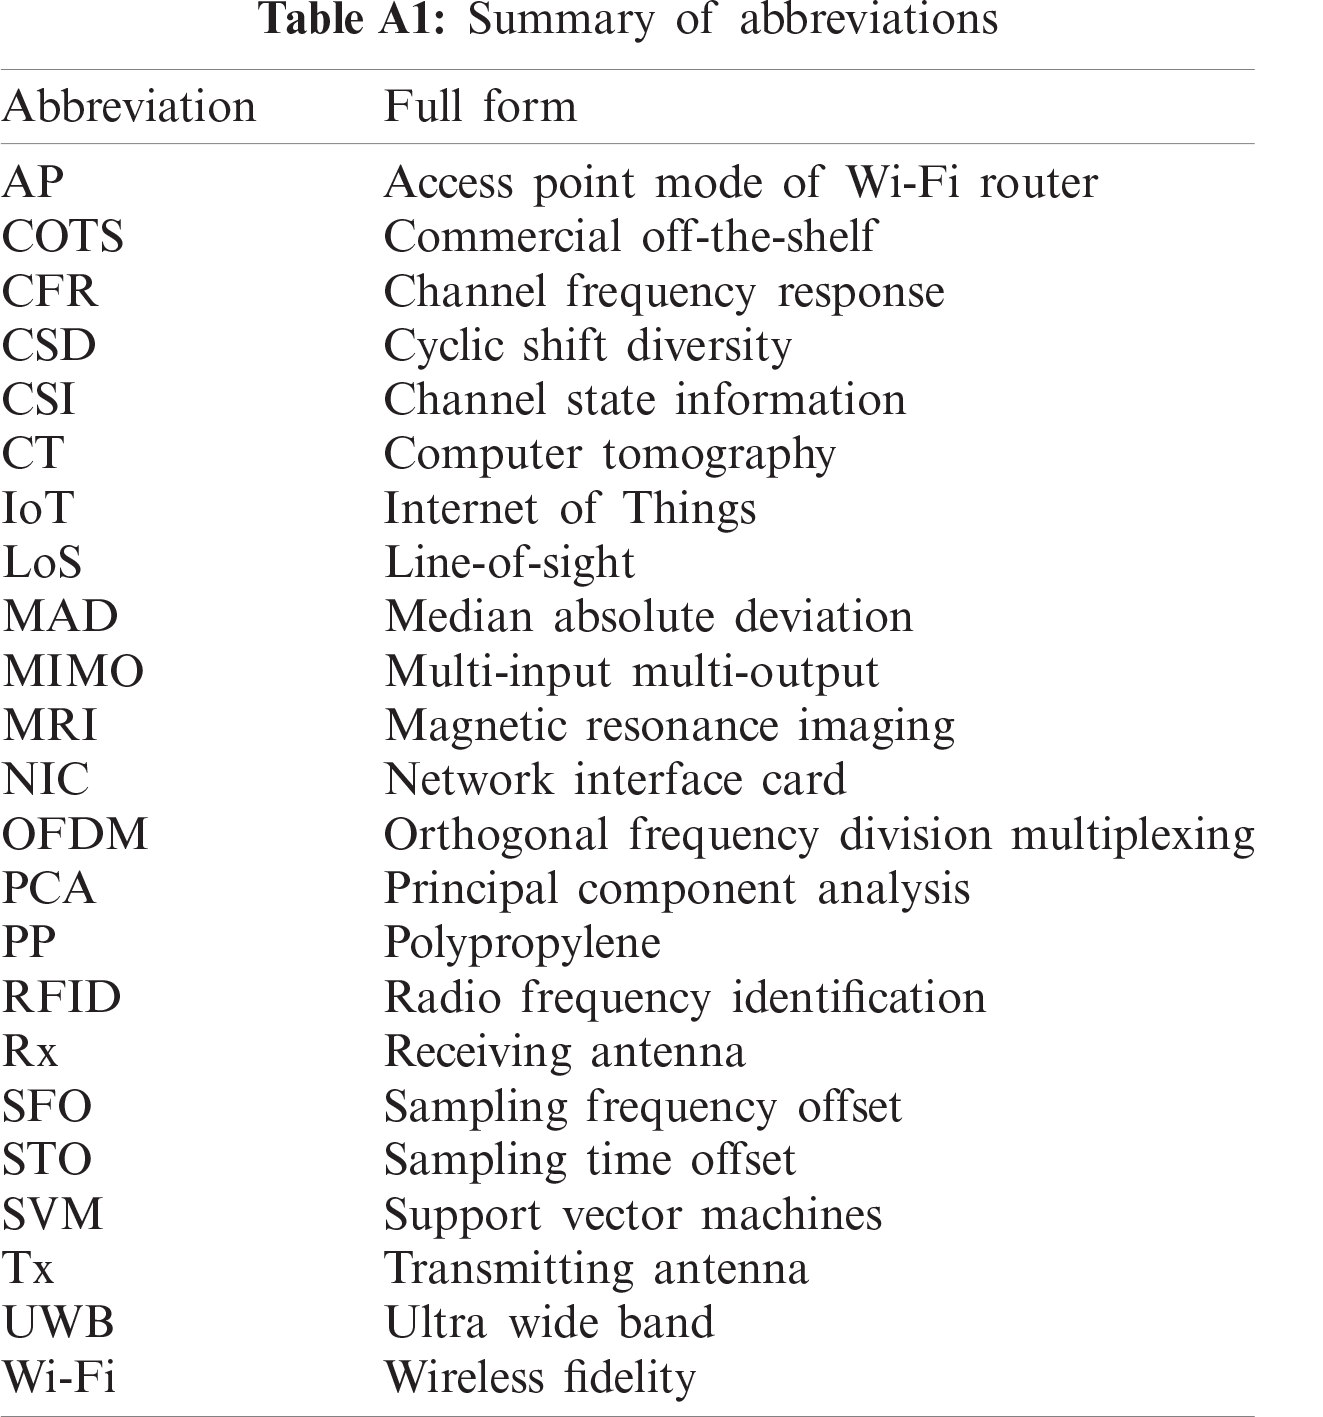
Appendix A. Abbreviations and Full Forms
We have summarized the abbreviations and their full forms which is used in this paper. We use alphabetical order to make Tab. A1 easier to search.
 | This work is licensed under a Creative Commons Attribution 4.0 International License, which permits unrestricted use, distribution, and reproduction in any medium, provided the original work is properly cited. |