DOI:10.32604/cmc.2022.014637
| Computers, Materials & Continua DOI:10.32604/cmc.2022.014637 | |
| Article |
Stock Prediction Based on Technical Indicators Using Deep Learning Model
1Department of Computer Science & Engineering, University Institute of Technology, Rajiv Gandhi Proudyogiki Vishwavidyalaya, Bhopal-462033, Madhya Pradesh, India
2Faculty of Department of Computer Science & Engineering, University Institute of Technology, Rajiv Gandhi Proudyogiki Vishwavidyalaya, Bhopal-462033, Madhya Pradesh, India
3Faculty of Department of Computer Science & Engineering, School of Engineering and Technology, Jagran Lakecity University, Bhopal, 462026, Madhya Pradesh, India
4Graduate School, Duy Tan University, Da Nang, 550000, Vietnam
5Faculty of Information Technology, Duy Tan University, Da Nang, 550000, Vietnam
6Department of Computer Science, College of Computers and Information Technology, Taif University, Taif, 21944, Saudi Arabia
*Corresponding Author: Anand Nayyar. Email: anandnayyar@duytan.edu.vn
Received: 05 October 2020; Accepted: 12 May 2021
Abstract: Stock market trends forecast is one of the most current topics and a significant research challenge due to its dynamic and unstable nature. The stock data is usually non-stationary, and attributes are non-correlative to each other. Several traditional Stock Technical Indicators (STIs) may incorrectly predict the stock market trends. To study the stock market characteristics using STIs and make efficient trading decisions, a robust model is built. This paper aims to build up an Evolutionary Deep Learning Model (EDLM) to identify stock trends’ prices by using STIs. The proposed model has implemented the Deep Learning (DL) model to establish the concept of Correlation-Tensor. The analysis of the dataset of three most popular banking organizations obtained from the live stock market based on the National Stock exchange (NSE) – India, a Long Short Term Memory (LSTM) is used. The datasets encompassed the trading days from the 17th of Nov 2008 to the 15th of Nov 2018. This work also conducted exhaustive experiments to study the correlation of various STIs with stock price trends. The model built with an EDLM has shown significant improvements over two benchmark ML models and a deep learning one. The proposed model aids investors in making profitable investment decisions as it presents trend-based forecasting and has achieved a prediction accuracy of 63.59%, 56.25%, and 57.95% on the datasets of HDFC, Yes Bank, and SBI, respectively. Results indicate that the proposed EDLA with a combination of STIs can often provide improved results than the other state-of-the-art algorithms.
Keywords: Long short term memory; evolutionary deep learning model; national stock exchange; stock technical indicators; predictive modelling; prediction accuracy
The country's stock market offers excellent investors opportunities by buying a stock and becoming a stockholder to earn from long-term benefits or trading on the stock. The stock market is dynamic and volatile [1]. The launch of the business and other unexpected national, global, and social changes instantly negatively or positively affects stock prices. Therefore, it is not possible to reliably foresee stock prices and their directions; instead, stock traders only predict significant developments in the future. Investors generally decide to buy or sell the stock based on the company's past and present performance. The parameters for studying the company's performance include typically numerical data and essential news.
The stock trends prediction methods are categorized into two groups, i.e., as per the number of information sources: single and dual source methods [2]. In available information sources methods, the semantic or numerical information is hauled out from current news and public reviews, whereas in particular source information methods, both are utilized. Nevertheless, over the last few years, 5Vs: Volume, Variety, Velocity, Veracity, and Value of happenings and reviews have overwhelmed the investor's ability to analyze these meticulously [3,4]. Therefore, automated systems are of utmost importance for studying stock prices based on past price data and STIs.
Different classifications approach for predicting stock prices is discussed in [5–8]. The role of stock price prediction is categorized in other classifications as Fundamental Analysis, Technical Analysis, and Time Series Forecasting [9]. Time series analytical research involves linear models like Auto-Regressive Integrated Moving Average (ARIMA) [10] and Nonlinear models like Artificial Neural Network (ANN) [11] and Deep Learning [12]. The existing forecasting methods make use of both linear and nonlinear algorithms [13].
Many recent researches on predicting stocks employs Machine Learning (ML) algorithms [14–15]. The researchers commonly use Artificial Neural Network (ANN) [16] and Support Vector Machine (SVM) [17] for analysis and prediction of time series data. These methods mostly utilize historical prices and STIs from price data. The research community has taken a great deal of interest in discovering successful STIs, news, and algorithms.
DNN prediction techniques are widely valued, and authors used experimental data to determine the properties of deep learning techniques [13,18]. This work proposes an approach that is capable of finding unseen relationships in the data. Specifically, this work involves (1) the Study of popular Deep Learning architectures and STIs. (2) Identification of STIs that are positively correlated to close price. (3) Propose and build a Deep Learning based model for stock market forecasting using technical indicators. (4) Demonstrate and gauge the performance of the suggested model concerning popular ML classifiers. (5) Present an efficient approach that helps the investor's view on sustainable investment.
The rest of this paper is structured accordingly. Section II presents the technical background and related work. In section III, we introduce the proposed deep learning architecture foreclosing price and stock trends prediction. For evaluation, section IV presents an experimental setup, methodology, and analysis. Section V will cover the conclusion of the paper with future remarks.
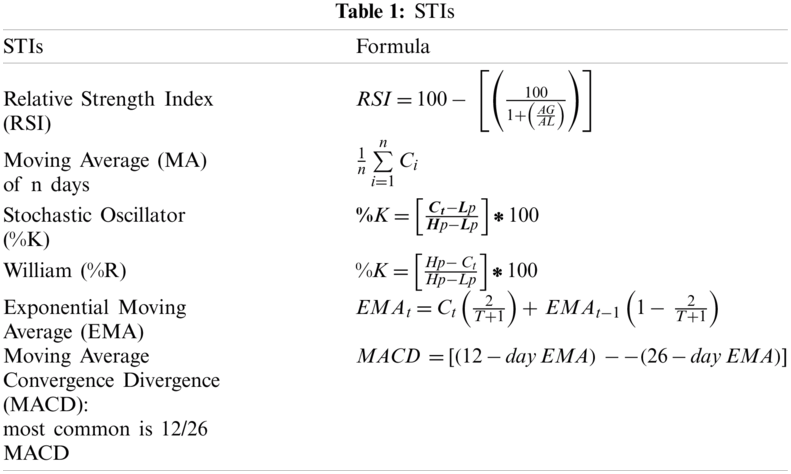
2.1 Stock Technical Indicators (STIs)
These are statistical estimates based on the price, volume, or value of a share. They are not dependent on a business's details, like profit, margin, revenue, or earnings. Technical analysts consider that price patterns can be recognized from historical figures and are generally based on trends. Analysts derive indicators by analyzing historical data to predict future price movements [19]. The active stock traders commonly use STIs to study short-term price movements, and long-term investors use STIs to recognize buy or sell periods. STIs can be combined with trading systems and beneficial while forecasting stocks’ future prices [20].
The technical indicators have two basic types: overlays and oscillators; the Overlays use the same scale as prices. Examples include Simple Moving Average (SMA) and Bollinger Bands [21]. The Oscillators oscillate between a local minimum and maximum and are plotted above or below a price chart. MACD or RSI is a typical example. For removing the noise from stock data that occurs due to price variations, this work utilizes SMA to smooth out prices. It is also called a lagging or trend-following indicator as it is calculated from past prices.
In the above Tab. 1,
2.2 Deep Learning Architectures
The Neural Network (NN) shows how complex non-linear systems are treated and thus proved successful in stock market prediction [22]. In NN, the output is based on input X and their weighted sum

Figure 1: Perceptron network
The feature information is activated by each neuron's functions and propagated through layers, finally to the desired output. The network is called Deep Neural Network (DNN) if there are multiple hidden layers between the input and output layers [23,24]. These hidden layers might alter the weighted sum of inputs’ linearity to make the outputs linearly separable. It can be said that we can map information to the production by approximating any function if the neurons are not limited. The prediction model for stocks is exceptionally intricate, and NN helps to attain higher accuracy. The output function in each neuron is called the activation function, and to increase the probability space, we can say it as a continuous output function rather than discrete [25]. The most common activation function is the sigmoid function, which is smooth. The simple sigmoid function
The deep learning technique operates a collection of computational layers intended to acquire patterns from input data. At each layer, some specific information is extracted, and the output of a particular layer is input to the next layer. It's called deep because the adding of additional levels typically leads to results. The two most popular NN architectures for stock prices based on the previous prices are the Convolutional Neural Network [26,27] and Recurrent Neural Networks (CNNs and RNNs) [28].
The nonlinear function in CNNs makes weight adjustment a challenging task, and two standard activation functions used are sigmoid function and Rectified Linear Unit (ReLU) [29], which are shown in Figs. 2 and 3, respectively. The sigmoid trims the input into an interval of 0 and 1. On the other hand, ReLU cuts negative values to 0 while keeping favorable costs unchanged.

Figure 2: Sigmoid

Figure 3: ReLU
The most common technique used to build DL architectures is deep RNN. To learn the network weights, the node in the hidden layers uses the data from preceding processing steps in addition to current input data. The following equation can best explain the RNN neural network
where
Souza et al. [30] investigated the performance of technical analyses applied for capital markets in the BRICS Member States. They also looked for evidence that technical studies and simple analyses could complement each other in specific markets. They created a full spectrum of assets exchanged in each BRICS member's needs to carry out these investigations. The findings of previous inquiries have been updated with new data and the inclusion of South Africa to the BRICS. Action classes exceeded the average portfolio in each country and exceeded the returns produced by a purchase and maintenance strategy. The sample portfolio was high in Russia and India.
A revolutionary approach to neural networks to improve stock market predictions is Pang et al. [31]. Data from live stock markets on real-time and off-line monitoring, visualization, and analysis of results were collected for digital internet for stock analysis. They clarified the “stock vector theory,” based on the production in a word vector research. It is not a single index or an available inventory index, but historical information for several inventories. An embedded and long-term network memory (LSTM) is given by an automated encoder to forecast the stock market [32]. The test results show that the LSTM is more robust with a built-in layer. In particular, for the Shanghai A-share composite index, two models have achieved an accuracy of 57.2 and 56.9 percent, respectively. In comparison, for individual stocks, it amounts to 52.4 and 52.5 percent.
Chen et al. [33] developed a new technical analysis method that helps investors improve their quality and profitability decision-making. This methodology includes:
1. The design of a stock market forecasting methodology based on technical analysis.
2. The development of techniques relating to stock market forecasting based on technical analysis.
3. The presentation and evaluation of the technically developed stock market forecasting analysis process.
Chatzis et al. [34] included a predictive process of probability in multiple timeframes of a stock crash. The approach developed brings together many machine-learned algorithms covering various economies with daily stock data, bond data, and currency details from 39 countries. They employed different machine learning classification and regression methods. In this literature, deep learning and boosting techniques are seen to forecast events in bond crises. The data contain information on the principal financial transmission networks, returns, and uncertainty, as independent variables.
Lee et al. [35] build prediction models on stock returns, which can jointly take into account international markets through deep multimodal education. (1) Visualization of knowledge transmission between South Korea and the U.S. stock exchange through dispersion plots; (2) Integration of knowledge into market prediction models using multimodal deep learning; (3) They have shown that early and medium-sized fusion systems offer substantial performance improvements as compared to late fusion; The work also stated that along with an international stock market, the prediction accuracy could be enhanced and deep neural networks are extremely successful for these tasks.
Maqsood et al. [36] used Twitter for each case to calculate sentiment analysis. The dataset comprises 11.42 million tweets used to analyze the situation. Usage of linear regression, vector regression, and deep learning helps to predict inventories. The efficiency of the computer will be calculated by the Root Mean Square Error (RMSE). The results show that the feeling of these activities improves performance.
Hiransha et al. [26] demonstrated the performance of four DL architectures: RNN, CNN, MLP, and LSTM for predicting a day-wise stock price of Banking, IT, and Automobile sectors from NSE. It has been shown that when training on NSE results, CNN worked considerably better, as well as being able to estimate NYSE. The authors compared the linear and nonlinear models. For comparison, the ARIMA model is chosen, which is also a linear model.
Pyo et al. [37] forecasted the patterns of the Korea Composite Stock Price Index 200 (KOSPI 200) with non-parametric models of machine learning. Furthermore, this analysis explores divisive topics and checks theories. Thus, our findings are incompatible with those of the previous study, which are commonly seen as performing highly predictable. Google Trends also proved that the KOSPI 200 index prices for our frameworks are not forecasted. The ensemble methods have not improved the precision of the predicted. Babu et al. [38] suggested a linear hybrid model with predictive accuracy while retaining trend data. The coherence of the proposed model is often clarified in a logical reasoning analysis.
Agrawal et al. [39] implemented the LSTM and adaptive stock technology indicators (STI's) for the prediction of patterns and prices of the stocks. Correlation tensor is used with STIs for optimizing the deep learning task. The mean prediction accuracy of 59.25 percent over the number of stocks that are much superior to benchmark approaches is achieved via the proposed model.
Yoshihara [40] states that most attempts were made to use numerical information, partly because of the complexity of processing natural language text and making sense of its temporal properties. This study explicitly proposes a market trend prediction approach based on a recurring deep neural network that models previous events’ time effects. On the real-world data for ten Nikkei firms, the validity of the proposed method is seen.
Zhang et al. [41] made statistics on daily returns in history to show the relationship between hidden States and the trend in a price change. CSI 300 and S&P 500 index studies show that high-order HMM is better suited to detect a stock price pattern than the first-order one. The high-order HMM is more reliable and less likely than the first-order model to predict the index's price trend.
Agrawal et al. [42] have used the Stock Technical Indicators (STIs) to predict stock prices and the market trends that help to buy or sell the decision over a short and long period. In this work, two models are implemented; one is for predicting the stock price and the other for storing the decision made on the day during the buying and the selling of the stocks. They integrated the long short-term memory (LSTM) with the correlated STIs to optimize the model.
ML model characterizes the data either as numerical or categorical features and can be converted to numbers for specific algorithms. The method is associated with two primary drawbacks:
i) The word vector often acquires memory equal to the memory of the dictionary. These large vectors and dictionaries make computation difficult.
ii) The semantic analysis and processing are cumbersome with such representation.
The neurons in DNN get activated and perform multiplication and addition operations on input variables with suitable weights. The correlation tensors are input to the model. These tensors contain rich information in STIs and enable rapid and easy calculations by the DNN model. In addition, category ranges of time-series data are fed into the model instead of providing it directly. The low dimension space is sufficient to represent the Tensors.
After deriving correlation vectors using STIs, the concept of tensor representation for higher dimensional stock trend forecasts is implemented. The connection between the quantitative features comes from the Pearson coefficient of correlation. This is the most appropriate method as the correct number value of the degree to which a linear relationship is obtained between two variables X and Y. The Embedded correlation-tensor layer in LSTM is a fundamental idea of the proposed model: EDLA [43].
4.2 EDLA - Evolutionary Deep Learning Approach Using Correlation Tensor for Stock Trends Prediction
The RNN is susceptible to the problem of disappearing gradients, particularly in duration or long-range prediction problems. Many variants of RNN have been evolved to solve of vanishing gradient problem, and one such is LSTM proposed by Hochreiter and Schmidhuber [44]. LSTM is adaptive to resolve such issues; therefore, LSTMs can be said as a ‘go-to’ network for RNN. The RNNs have a hard time storing long time memory. The actual LSTM therefore has been developed to expand the RNN memory status to allow for more input sequences. RNN is only fitted with a regular tanh layer, and the LSTM is four layers as shown in Fig. 4.

Figure 4: Network diagram
The network diagram ‘s introductory module is LSTM. Four transformation stages, as shown in Fig. 5, are part of the LSTM node architecture.

Figure 5: Architecture of EDLA node
The framework proposed is depicted in Fig. 6.
It comprises of IV phases, namely:
• Capture Phase: In this phase, the data of stock to be analyzed is captured through APIs. We extracted the available data at NSE. First, a long term and short term trend analysis is applied using a simple graph method. It is observed that stock prices generally follow non-stationary patterns over a long time. Extraction of Open, High, Low, Close (OHLC) prices from the dataset is also done in this phase. The input features for phase 3 is formed by deriving a correlation between STIs and Close Price in phase 2.
• Correlation Phase: In this phase, STIs are calculated to learn the correlation with the close price. The correlation tensor derived in this phase decides the next phase. The phase extracts the highly correlated features. The 3, 10, and 30 days MAs performed considerably better in this work.
• Evolutionary Deep Learning Approach (EDLA) Application Phase: The LSTM is keeping track of both memories, i.e., long and short term memory that comes in and out of cells. Figs. 4–6 illustrates the EDLA concept. At every stage, with time t the long and short term memory gets merged, and we get new long and short term memory along with prediction. The proposed EDLA approach utilizes the version of LSTM.
Fig. 7 shows the event diagram of the EDLA Application phase. The correlation tensor is transferred to the LSTM layers, and the trends are iteratively calculated. LSTM input has an effect on the previous layer and also the current layer. Thus, LSTMs take the characteristics of time series. For trend prediction, the logistic function is used, and the activation function is employed for price prediction.

Figure 6: Proposed EDLA framework for stock trends forecasting

Figure 7: Event diagram of LSTM prediction
With two class price ups (1) and price downs (0), the stock trend forecast is listed at the end of the day. The price-up indicator determines the buy share signal and the price-down shows the stake sale. The model also demonstrates competitive stock price patterns.
The implementation is performed on the NSE datasets of 3 Banks, accessed through the NSE website. The banks belong to either the nationalized, private, or public sector. The trading data of 2 years, i.e., from 16th of Nov 2016 to 15th of Nov 2018, are considered. The dataset comprises of all numerical values except timestamp.
5.2 Experiment Environment Setup
For the experimental purpose, the computer with Intel Core i3 (2.0 GHz.) running 64 – bit operating system Microsoft - Windows – 10 on 8 GB RAM is used. In this work, we have used Anaconda tool and Python programming language for the implementation of the work. We have used the libraries such as pandas, matplotlib, scikit-learn, Keras, tensor-flow etc.
We conducted several experiments, and performance evaluation is done against state-of-the-art methods. Performance analysis is done on three datasets of financial organizations, and Fig. 8 depicts the complete methodology of the proposed EDLA. The Tab. 2 has represented the EDLA–LSTM Algorithm with their inputs and notations. First, simple graphs are drawn to observe short and long term trends. The primary outputs are obtained in Steps 2, 5, 6, 10, 11 and 12. Several experiments have been conducted to study the correlation between close price and STIs. We have determined MAs as major technical indicators for stock trends prediction.
5.4 Model Results and Performance
The output of experimental Step 2 for all three stocks is shown in Figs. 9–11. It is evident from the representation that the data is non-stationary over the long term and short term.
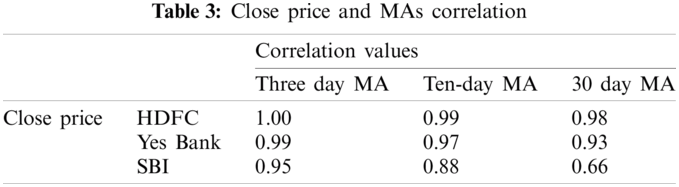
This work studies the effects of various indicators; the Moving Averages among them achieved better correlation. The correlation between MAs and day end price of 3 stocks are shown in Tab. 3. The output is of Step 6.
The correlation table as shown in Tab. 3 has shown the relation between the closed price and moving averages based on three different banks such as HDFC, Yes Bank and SBI by considering three different days computations i.e., 3 day, 10 day and the 30 day moving average.
The model built is assessed based on MSE and prediction accuracy.
Mean Squared Error (MSE): It measures the average of squares of the errors in a set of predictions.
where

Figure 8: Flowchart of proposed methodology

Prediction Accuracy: It is the percentage of correct predictions. The prediction accuracy is calculated on unknown data, and the training size taken is 30 for building classifiers with EDLA. The accuracy is measured on a variable number of iterations or epochs.
The percentage prediction accuracy attained over 100–500 epochs is presented in Tab. 4.

Figure 9: HDFC trend analysis over 2 years

Figure 10: Yes Bank trend analysis over 2 years

Figure 11: SBI trend analysis over 2 years

The highest accuracy achieved through the proposed model is 65.64% on a large number of epochs i.e., 500. The epochs must be taken to avoid model over-fitting. The overall mean accuracy attained for the model is 59.25%, comprehensive experiment datasets. The accuracy is evaluated against two benchmark ML classifiers such as logistic regression (LR) and Support Vector Machine (SVM). The accuracy comparison is shown by taking three different dataset of the banks such as HDFC, Yes Bank and SBI and by putting the different values of epoch.
Logistic Regression (LR) and Support Vector Machine (SVM) and one DNN based model: ELSTM [45]. The performances are tabulated in Tab. 5, and 2D and 3D graph representations are depicted in Figs. 12 and 13. The MSE comparison of ELSTM, MLP, and EDLA is illustrated in Fig. 14. The average MSE value across all datasets is selected for comparison.


Figure 12: EDLA accuracy (%) comparison across 3 datasets

Figure 13: Comparison of EDLA

Figure 14: Comparison of MSE
The paper studied the effects of TA on stock market data. We analyzed whether stock traders could attain more profits than proposed by the current research work of Pang et al. [31] on the deep learning-based model and others. The concept of deriving adaptive STIs is demonstrated. The appropriate STIs are determined supplied as tensors to the EDLA. Finally, we presented a practical approach that aids investors in making profitable investment decisions and profits. EDLA offers a decision indicator (BUY (1) or SELL (0)) to the investor.
The proposed Evolutionary Deep Learning Approach (EDLA) is independent of the market as we can apply the approach on both stocks as well as indices of the stock market. Here potential indicators are discovered by using deep dynamics of LSTM. This study applies EDLA and two benchmark ML algorithms for stock trends forecasting using Technical Indicators. The experiment is done with three prominent stocks from NSE India. The performance evaluation has shown the superiority of the proposed work. Furthermore, the deep learning model can be enhanced by applying various optimization techniques and other STIs.
Acknowledgement: We are very thankful to RGPV, Jagran Lakecity University, Taif University Researchers Supporting Project Number (TURSP-2020/10) and Duy Tan University for their continuous support and the encouragement.
Funding Statement: Funding is provided by Taif University Researchers Supporting Project Number (TURSP-2020/10), Taif University, Taif, Saudi Arabia.
Conflicts of Interest: The authors declare that they have no conflicts of interest to report regarding the present study.
1. E. Guresen, G. Kayakutlu and T. U. Daim, “Using artificial neural network models in stock market index prediction,” Expert Systems with Applications, vol. 38, no. 8, pp. 10389–10397, 2011. [Google Scholar]
2. A. Derakhshan and H. Beigy, “Sentiment analysis on stock social media for stock price movement prediction,” Engineering Applications of Artificial Intelligence, vol. 85, pp. 569–578, 2019. [Google Scholar]
3. H. Jasim, H. Hiba, H. S. Ammar, H. Sarah and H. Azizahb, “Big data and five V'S characteristics,” International Journal of Advances in Electronics and Computer Science, vol. 2, no. 1, pp. 16–23, 2015. [Google Scholar]
4. P. Saporito, “The 5 V's of Big data,” Best's Review, no. 7, pp. 38, 2013. [Google Scholar]
5. J. Patel, S. Shah, P. Thakkar and K. Kotecha, “Predicting stock and stock price index movement using trend deterministic data preparation and machine learning techniques,” Expert System with Appications, vol. 42, no. 1, pp. 259–268, 2015. [Google Scholar]
6. M. Roondiwala, H. Patel, and S. Varma, “Predicting stock prices using LSTM,” International Journal of Scientific Research, vol. 6, no. 4, pp. 1754–1756, 2015. [Google Scholar]
7. S. Basak, S. Kar, S. Saha, L. Khaidem and S. R. Dey, “Predicting the direction of stock market prices using tree-based classifiers,” The North American Journal of Economics and Finance, 47, no. C, pp. 552–567, 2019. [Google Scholar]
8. M. Kim and H. Sayama, “Predicting stock market movements using network science: An information theoretic approach,” Applied Network Science, vol. 2, no. 1, pp. 35, 2017. [Google Scholar]
9. J. C. Lee and C. F. Lee, “Time-Series—Analysis, Model, and Forecasting,” in Financial Analysis, Planning & Forecasting Theory and Application, New York: Springer, pp. 1217–1274, 2016. [Google Scholar]
10. A. A. Adebiyi, A. O. Adewumi and C. K. Ayo, “Stock Price Prediction Using the ARIMA Model,” in Proc. - UKSim-AMSS 16th Int. Conf. on Computer Modelling and Simulation, UKSim 2014, 2014. [Google Scholar]
11. P. M. Buscema, G. Massini, M. Breda, W. A. Lodwick, F. Newman et al., “An introduction. in: Artificial adaptive systems using auto contractive maps,” in studies in systems,” Decision and Control, vol. 131, pp. 1–9, 2018. [Google Scholar]
12. R. Singh and S. Srivastava, “Stock prediction using deep learning,” Multimedia Tools and Applications, vol. 76, no. 18, pp. 18569–18584, 2017. [Google Scholar]
13. M. Gansterer, “Aggregate planning and forecasting in make-to-order production systems,” International Journal of Production Economics, vol. 170, pp. 521–528, 2015. [Google Scholar]
14. D. Lv, S. Yuan, M. Li and Y. Xiang, “An empirical study of machine learning algorithms for stock daily trading strategy,” Mathematical Problems in Engineering, vol. 2019, pp. 7816154D0–7816154JF, 2019. [Google Scholar]
15. J. Patel, S. Shah, P. Thakkar and K. Kotecha, “Predicting stock market index using fusion of machine learning techniques,” Expert Systems with Applications, vol. 48, no. 4, pp. 2162–2172, 2015. [Google Scholar]
16. L. Gatys, A. Ecker and M. Bethge, “A neural algorithm of artistic style,” Journal of Vision, vol. 16, no. 12, pp. 326, 2016. [Google Scholar]
17. L. Nguyen, “Tutorial on support vector machine,” Applied and Computational Mathematics, vol. 6, no. 4, pp. 1–15, 2016. [Google Scholar]
18. P. Samira, S. Saad, Y. Yilin, T. Haiman, T. Yudong et al., “A survey on deep learning: Algorithms, techniques, and applications,” ACM Computing Surveys, vol. 51, no. 5, 2018. [Google Scholar]
19. X. Zhang, Y. Zhang, S. Wang, Y. Yao, B. Fang et al., “Improving stock market prediction via heterogeneous information fusion,” Knowledge-Based System, vol. 143, pp. 236–247, 2018. [Google Scholar]
20. M. Hagenau, M. Liebmann, and D. Neumann, “Automated news reading: Stock price prediction based on financial news using context-capturing features,” Decision Support Systems, vol. 55, no. 3, pp. 685–697, 2013. [Google Scholar]
21. T. T. L. Chong and W. K. Ng, “Technical analysis and the London stock exchange: Testing the MACD and RSI rules using the FT30,” Applied Economics Letters, vol. 15, no. 14, pp. 1111–1114, 2008. [Google Scholar]
22. A. H. Moghaddam, M. H. Moghaddam and M. Esfandyari, “Stock market index prediction using artificial neural network,” Journal of Economics, Finance and Administrative Science, vol. 21, no. 41, pp. 89–93, 2016. [Google Scholar]
23. W. Liu, Z. Wang, X. Liu, N. Zeng, Y. Liu et al., “A survey of deep neural network architectures and their applications,” Neurocomputing, vol. 234, no. 19, pp. 11–26, 2017. [Google Scholar]
24. Q. Shi Zhang and S. Chun Zhu, “Visual interpretability for deep learning: A survey,” Frontiers of Information Technology and Electronic Engineering, vol. 19, pp. 27–39, 2018. [Google Scholar]
25. G. Klambauer, T. Unterthiner, in A. Mayr and S. Hochreiter, “Self-normalizing neural networks,” in Proc. of the 31st Int. Conf. on Neural Information Processing Systems, USA, pp. 972–981, 2017. [Google Scholar]
26. M. Hiransha, E. A. Gopalakrishnan, V. K. Menon and K. P. Soman, “NSE stock market prediction using deep-learning models,” in Procedia Computer Science, vol. 132, pp. 1351–1362, 2018. [Google Scholar]
27. S. Chen and H. He, “Stock prediction using convolutional neural network,” in IOP Conf. Series: Materials Science and Engineering, vol. 435, no. 1, pp. 12026, 2018. [Google Scholar]
28. C. Du and L. Huang, “Text classification research with attention-based recurrent neural networks,” Int. J. Comput. Commun. Control, vol. 13, no. 1, pp. 50–61, 2018. [Google Scholar]
29. B. Ding, H. Qian and J. Zhou, “Activation functions and their characteristics in deep neural networks,” 2018 in Chinese Control and Decision Conf., Shenysang, China, pp. 1836–1841, 2018. [Google Scholar]
30. M. J. S. de Souza, D. G. F. Ramos, M. G. Pena, V. A. Sobreiro and H. Kimura, “Examination of the profitability of technical analysis based on moving average strategies in BRICS,” Financial Innovation, vol. 4, no. 1, pp. 3, 2018. [Google Scholar]
31. X. Pang, Y. Zhou, P. Wang, W. Lin and V. Chang, “An innovative neural network approach for stock market prediction,” The Journal of Supercomputing, vol. 76, pp. 2098–2118, 2020. [Google Scholar]
32. W. Bao, J. Yue, and Y. Rao, “A deep learning framework for financial time series using stacked autoencoders and long-short term memory,” PLoS One, vol. 12, no. 7, pp. e0180944, 2017. [Google Scholar]
33. Y. J. Chen, Y. M. Chen, S. T. Tsao and S. F. Hsieh, “A novel technical analysis-based method for stock market forecasting,” Soft Computing, vol. 22, no. 4, pp. 1295–1312, 2018. [Google Scholar]
34. S. P. Chatzis, V. Siakoulis, A. Petropoulos, E. Stavroulakis and N. Vlachogiannakis, “Forecasting stock market crisis events using deep and statistical machine learning techniques,” Expert Systems with Applications, vol. 112, pp. 353–371, 2018. [Google Scholar]
35. S. I. Lee and S. J. Yoo, “Multimodal deep learning for finance: Integrating and forecasting international stock markets,” J. Supercomput, vol. 76, pp. 8294–8312, 2019. [Google Scholar]
36. H. Maqsood, I. Mehmood, M. Maqsood, M. Yasir and S. Afzalc et al., “A local and global event sentiment based efficient stock exchange forecasting using deep learning,” International Journal of Information Management, vol. 50, pp. 432–451, 2020. [Google Scholar]
37. S. Pyo, J. Lee, M. Cha and H. Jang, “Predictability of machine learning techniques to forecast the trends of market index prices: Hypothesis testing for the Korean stock markets,” PLoS One, vol. 12, no. 11, pp. e0188107, 2017. [Google Scholar]
38. C. Narendra Babu and B. Eswara Reddy, “Prediction of selected Indian stock using a partitioning–interpolation based ARIMA–GARCH model,” Applied Computing and Informatics, vol. 11, no. 2, pp. 130–143, 2015. [Google Scholar]
39. M. Agrawal, A. U. Khan and P. K. Shukla, “Stock price prediction using technical indicators: A predictive model using optimal deep learning,” International Journal of Recent Technology and Engineering, vol. 8, no. 2, pp. 2297–2305, 2019. [Google Scholar]
40. A. Yoshihara, K. Seki and K. Uehara, “Leveraging temporal properties of news events for stock market prediction,” Artificial Intelligence Research, vol. 5, pp. 103–110, 2015. [Google Scholar]
41. M. Zhang, X. Jiang, Z. Fang, Y. Zeng and K. Xu, “High-order hidden markov model for trend prediction in financial time series,” Physica A: Statistical Mechanics and Its Applications, vol. 517, pp. 1–12, 2019. [Google Scholar]
42. M. Agrawal, A. U. Khan and P. K. Shukla, “Stock indices price prediction based on technical indicators using deep learning model,” International Journal on Emerging Technologies, vol. 10, no. 2, pp. 186–194, 2019. [Google Scholar]
43. Y. Lv, Y. Duan, W. Kang, Z. Li and F. Y. Wang, “Traffic flow prediction with Big data: A deep learning approach,” IEEE Intelligent Transportation Systems Society, vol. 16, no. 2, pp. 865–873, 2015. [Google Scholar]
44. G. Van Houdt, C. Mosquera and G. Nápoles, “A review on the long short-term memory model,” Artificial Intelligence Research, vol. 53, pp. 5929–5955, 2020. [Google Scholar]
45. X. Yan and J. Zhao, “Application of improved convolution neural network in financial forecasting,” in IEEE 4th Int. Conf. on Cloud Computing and Big Data Analysis, China, pp. 321–326, 2019. [Google Scholar]
 | This work is licensed under a Creative Commons Attribution 4.0 International License, which permits unrestricted use, distribution, and reproduction in any medium, provided the original work is properly cited. |