DOI:10.32604/cmc.2022.017001
| Computers, Materials & Continua DOI:10.32604/cmc.2022.017001 | |
| Article |
An Efficient Breast Cancer Detection Framework for Medical Diagnosis Applications
1Department of Information Technology, College of Computer and Information Sciences, Princess Nourah Bint Abdulrahman University, Riyadh, 84428, Saudi Arabia
2Department of Electronics and Communications, Faculty of Engineering, Zagazig University, Zagazig, 44519, Egypt
3International Academy for Engineering and Media Science, October City, Egypt
4Department of Electronics and Electrical Communications, Faculty of Electronic Engineering, Menoufia University, Menouf, 32952, Egypt
*Corresponding Author: Abeer D. Algarni. Email: adalqarni@pnu.edu.sa
Received: 18 January 2021; Accepted: 12 May 2021
Abstract: Breast cancer is the most common type of cancer, and it is the reason for cancer death toll in women in recent years. Early diagnosis is essential to handle breast cancer patients for treatment at the right time. Screening with mammography is the preferred examination for breast cancer, as it is available worldwide and inexpensive. Computer-Aided Detection (CAD) systems are used to analyze medical images to detect breast cancer, early. The death rate of cancer patients has decreased by detecting tumors early and having appropriate treatment after operations. Processing of mammogram images has four main steps: pre-processing, segmentation of the region of interest, feature extraction and classification of the images into normal or abnormal classes. This paper presents an efficient framework for processing of mammogram images and introduces an algorithm for segmentation of the images to detect masses. The pre-processing step of mammogram images includes removal of digitization noise using a 2D median filter, removal of artifacts using morphological operations, and contrast enhancement using a fuzzy enhancement technique. The proposed fuzzy image enhancement technique is analyzed and compared with conventional techniques based on an Enhancement Measure (EME) and local contrast metrics. The comparison shows an outstanding performance of the proposed technique from the visual and numerical perspectives. The segmentation process is performed using Otsu's multiple thresholding method. This method segments the image regions into five classes with variable intensities using four thresholds. Its effectiveness is measured based on visual quality of the segmentation output, as it gives details about the image and positions of masses. The performance of the proposed framework is measured using Dice coefficient, Hausdorff, and Peak Signal-to-Noise Ratio (PSNR) metrics. The segmented tumor region with the proposed segmentation method is 81% of the ground truth region provided by an expert. Hence, the proposed framework achieves promising results for aiding radiologists in screening of mammograms, accurately.
Keywords: Breast cancer; mammogram images; CAD; contrast enhancement; fuzzy logic; segmentation
Breast cancer of women is the most famous type of cancer in developing and developed countries, worldwide [1]. Several studies in Arab countries discussed the spread of breast cancer among Arab women. At an oncology center in Egypt, about 40% of breast cancer patients reported poor life quality. In resource-limited countries, several women have breast cancer diagnosed in the late stages, as there is a rareness of early detection programs. So, the survival rate for more than five years is very low, with a range of 10–40%, because the health system ability is very limited. However, if the disease is detected early and the patients get appropriate treatment, their chance to live more than five years exceeds 80% [2].
Detection of breast cancer and its diagnosis at early stages result in success of treatment and complete patient recovery. Mammography screening is the most efficient technique for detecting tumors before appearance of symptoms. It is utilized to see what is inside breast tissues through X-ray imaging with a low dose of ionizing radiation [3]. Because of the limited quality of the obtained images, tumors are not efficiently distinguished from images with eyes. Differentiating between benign and malignant tumors is also a tough task as the anomalous areas are complex, and therefore mammogram interpretation is a challenging job for radiologists [4].
In the field of medical imaging, CAD systems are used to analyze images. These systems are required to understand and interpret mammogram images [4]. A CAD software is applied to help radiologists by validating their findings during mammography screening [5]. The CAD system assessment begins with reading the mammogram by the radiologist to look for suspicious patterns, and then the CAD system scans that mammogram for detecting suspicious areas. Finally, the radiologist analyzes the CAD system outputs [6].
The two main signs of malignancy are masses and microcalcifications. Microcalcifications can be described by their size, density, shape, distribution, and number. It is challenging to detect microcalcifications in dense breasts because of the low contrast between the microcalcifications and the surrounding tissues. On the other hand, masses are circumscribed lumps in the breast and they are categorized as being benign or malignant. They can be described by shape, margin, size, location, and contrast. The shape of a mass can be classified as being round, lobular, oval, or irregular. Margin is also classified as being obscured, indistinct, or speculated. Masses are more complicated to detect by radiologists than microcalcifications because of their similarity to the normal tissues [7].
A CAD system for processing of mammogram images includes four main steps: pre-processing, segmentation of the region of interest, feature extraction, and classification. Pre-processing of mammogram images includes noise removal, suppression of artifacts, and contrast enhancement. Image segmentation means dividing the image into categories or sub-regions that are related to different objects. Each pixel in the image corresponds to one of these categories. The feature extraction step presents high-level features that are needed to perform the classification of objects and the detection of anomalies. They can also distinguish between normal and abnormal lesions. The classification process can be performed using a linear or nonlinear combination of features in the supervision or no supervision modes. The classification step means labelling of the images into one of the predefined categories based on a training set of data. Classification predicts the type of mass based on the extracted set of features [6–7]. Fig. 1 shows the block diagram of the proposed CAD system for breast cancer detection.
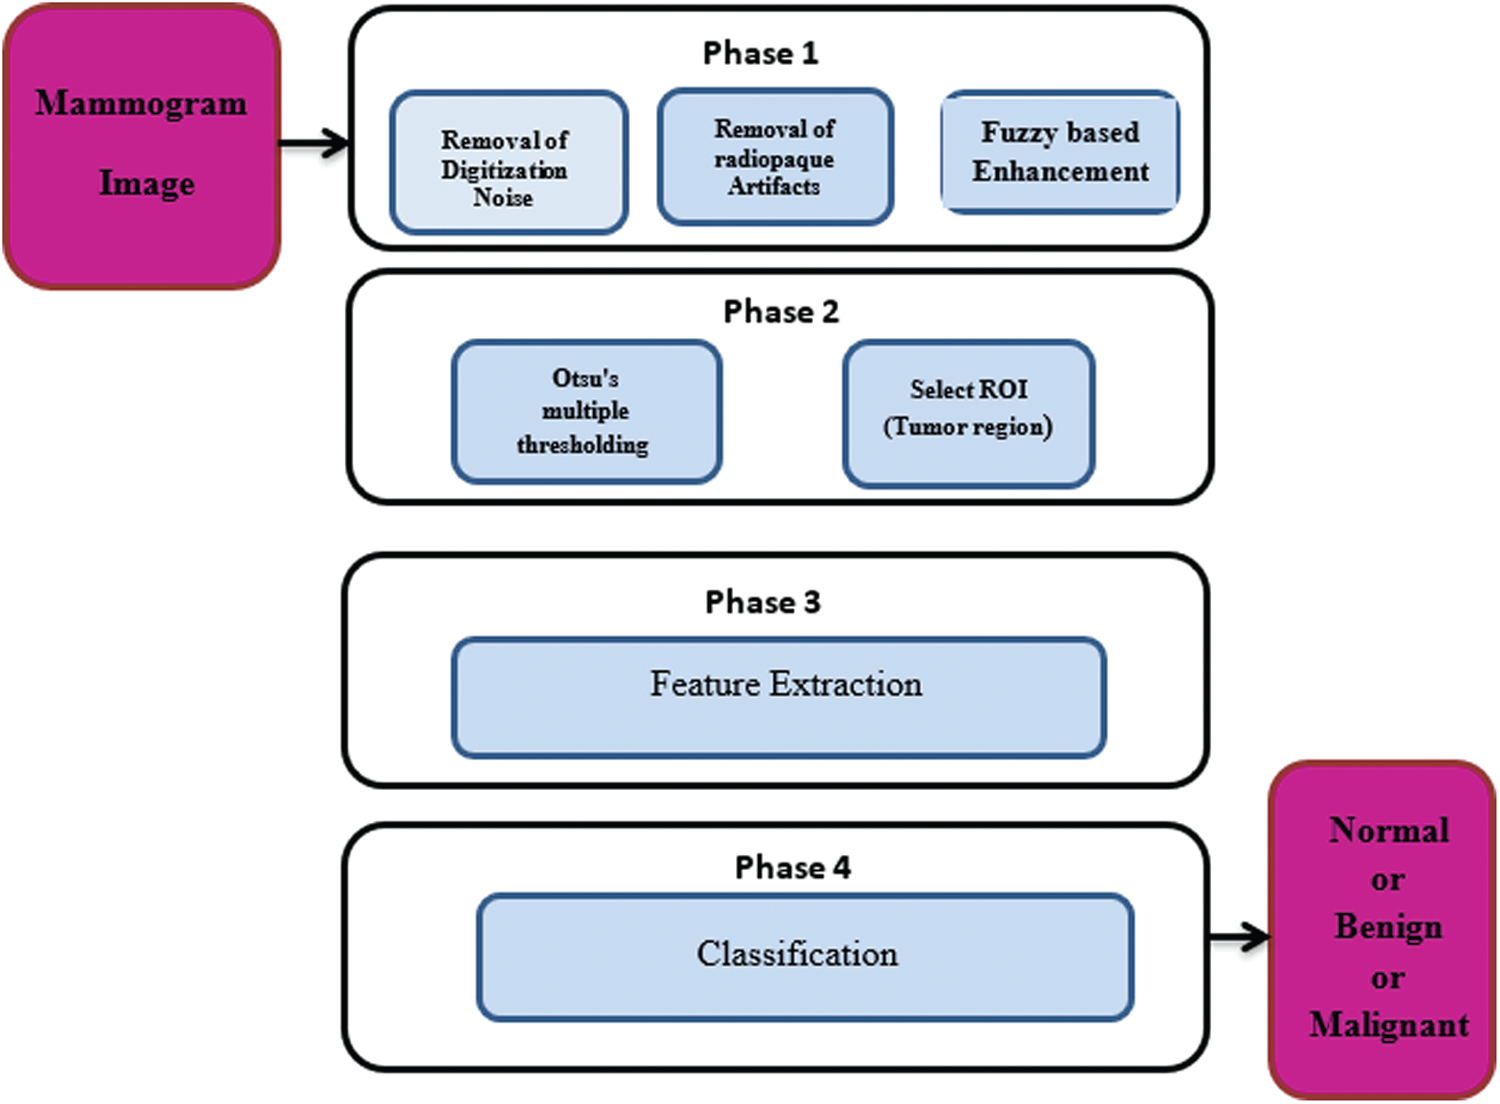
Figure 1: Different phases of a CAD system for breast cancer diagnosis
Due to the importance of the early diagnosis process of breast cancer, we present an efficient framework for processing of mammogram images and introduce a method for the segmentation of images to detect the locations of masses. Firstly, the pre-processing step of mammogram images includes removal of digitization noise using a 2D median filter, removal of artifacts using morphological operations, and contrast enhancement using the fuzzy enhancement technique. Performance of the proposed fuzzy enhancement technique is analyzed and compared with those of conventional techniques based on EME and local contrast metrics. The comparison results show that the proposed technique achieves the best visual and numerical quality levels. After that, the segmentation process is performed using Otsu's multiple thresholding method. This method segments the images into five classes with different intensities using four thresholds. The effectiveness of this technique is evaluated based on the visual quality of the segmented output. It gives more details about the image, and the positions of masses are accurately determined. In addition, numerical assessment is performed using Dice coefficient, Hausdorff, and Peak Signal-to-Noise Ratio (PSNR) metrics. These metric values are calculated between the segmented image using the proposed method and the ground truth image provided by an expert. The proposed framework achieves promising results for aiding radiologists in reading and screening of mammograms, accurately.
This paper is organized as follows. Section 2 presents the related work. Section 3 introduces the materials and methods. Section 4 gives a discussion of the performance evaluation metrics. Section 5 offers the results and the discussion. Finally, Section 6 gives the concluding remarks.
Several research works have been presented to solve the problem of interpretation of mammogram images and help the radiologists make the correct decisions in reading these images to reduce the number of false positives that cause undesired biopsies. Punitha et al. [8] proposed a method that automatically detects breast masses using a region growing technique, where a swarm technique for optimization is used to generate thresholds and initial seed points, optimally. Rakoth et al. [9] proposed an approach for segmentation based on dragonfly optimization for multi-level thresholding. This approach has been tested on medical images, and it proved efficiency in the optimization of the threshold values.
Pereira et al. [10] presented a system that detects masses of the breast. It begins with an artifact removal algorithm, noise removal, and a gray-scale enhancement method using Wiener filter and wavelet transform. Finally, multiple thresholding, wavelet transform, and genetic algorithms are used to detect and segmented masses. Hassan et al. [11] proposed an algorithm that uses a region growing technique with a novel method to estimate an automatic threshold that can be used to detect and segment breast lesions. This algorithm works on a single view of the breast to detect masses.
Singh et al. [12] proposed a simple method to detect masses in mammogram images using simple image processing techniques like mean estimation and thresholding. Beheshti et al. [13] proposed a method to detect anomalies in mammogram images. Firstly, enhancement of the images is performed using wavelet transform and piecewise linear coefficient mapping. After that, fractal methods are applied to extract asymmetric information from lesions to detect abnormal lesions. Tripathy et al. [14] used the Contrast Limited Adaptive Histogram Equalization (CLAHE) for contrast enhancement and thresholding methods to detect the boundaries of breast tumors from the digital mammogram.
Talha et al. [15] proposed an adaptive weighted frost filter for eliminating noise from mammogram images. Albalawi et al. [16] presented a Convolutional Neural Network (CNN) classifier to diagnose breast cancer. The CNN is a deep learning system that automatically extracts the features from an image and uses those features to classify images.
This paper introduces a framework that includes the first two phases of the CAD system for breast cancer detection. The first phase is pre-processing, which includes removal of digitization noise, removal of the radiopaque artifacts, and contrast enhancement. The second phase is the segmentation of mammogram images using Otsu's multiple thresholding method. The multiple thresholds divide the pixels into multiple distinct regions in which the pixels of similar categories exist. The main objective of segmentation is simply representing the medical images to effectively analyze, detect, and determine the region of interest. It distinguishes between tissues, lesions, and structures.
The images used in this analysis correspond to real cases obtained from the department of radiodiagnosis in the Faculty of Medicine at Zagazig University, from the National Cancer Institute, and the MIAS database (Mammogram Image Analysis Society database (UK)) [17]. The size of each mammogram image in the MIAS database is 1024 × 1024 pixels with 200-micron resolution. The MIAS database contains a total of 322 mammograms of left and right breasts for 161 patients. There are 208 normal, 63 benign, and 51 abnormal images.
3.2 Pre-Processing of Mammogram Images
Pre-processing is an essential step for images as it improves the quality of these images. The artifacts found in the images are the main problem that prevents accurate segmentation of the breast region. Pre-processing helps in knowing the image orientation, removal of noise, suppression of artifacts, and contrast enhancement [18].
3.2.1 Removal of Digitization Noise
The noise results from digitization as horizontal and vertical lines in mammograms. This noise is removed using a 2D median filter. This filter is a non-linear digital filter. It is applied in a 3 × 3 neighborhood connection [19]. The median filter is used widely due to its efficiency as it removes noise and keeps edges. The median filter window is moved through the image, and each pixel value is replaced with the value of the median of pixels in its neighborhood. Fig. 2 illustrates an example of the removal of digitization line noise.
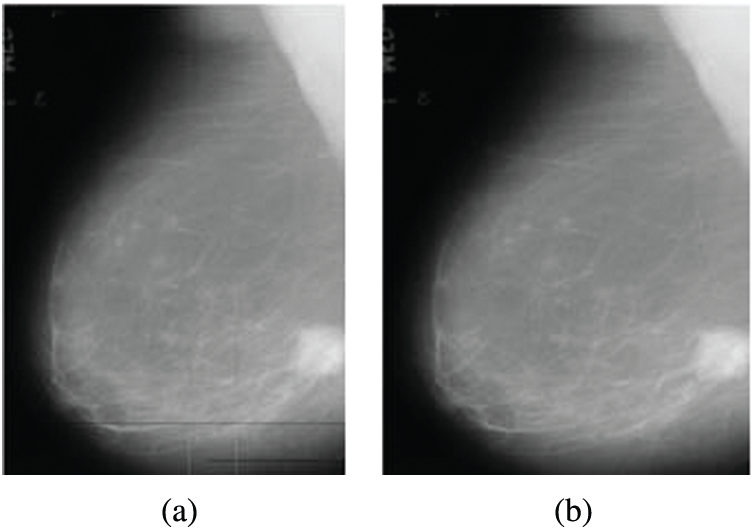
Figure 2: Digitization line noise removal from mammogram images (a) Original image with digitization line noise (b) Image after noise removal
3.2.2 Removal of Radiopaque Artifacts
Artifacts like labels of identification, markers, and wedges are small faults in mammogram films that look like calcifications. The region homogeneity increases by suppressing radiopaque artifacts from the mammogram images. This also results in increasing the robustness and reliability of the breast profile separation.
The algorithm to remove artifacts and labels was introduced in [19]. First, a thresholding technique is applied on the gray-scale image in the range of [0, 255] with a threshold T = 18, and then the result is binarized to be in the range of [0, 1].
After that, some morphological operations are performed on the binary images to suppress radiopaque artifacts. An example of the removal of radiopaque artifacts from mammogram images is indicated in Fig. 3.
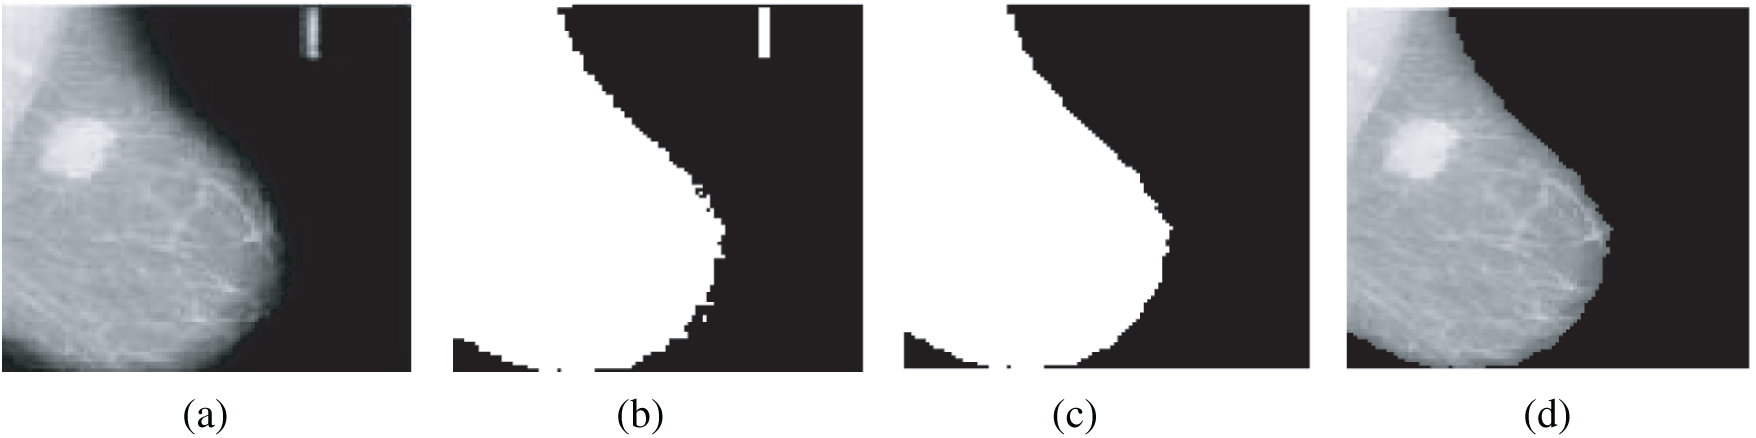
Figure 3: Removal of radiopaque artifacts from mammogram images (a) Original mammogram image (b) Binary image (c) Binary image after selecting the large object (d) Image after removal of artifacts
3.2.3 Enhancement of Mammogram Images
The image quality is necessary for its interpretation. Several images suffer from noise and poor contrast, due to the acquisition conditions. So, contrast enhancement and noise removal are required for enhancing the image quality. Contrast enhancement is very essential to distinguish between the region of interest and the background. Several techniques have been presented for contrast enhancement [20,21]. Histogram Equalization (HE) is the most popular one. In the following subsections, we present the techniques used for image enhancement.
A. Histogram Equalization (HE)
The HE distributes the intensities of gray levels uniformly in the histogram, which causes the enhancement of the image local contrast. If we have a gray-scale image with levels [0, L−1], its histogram is a discrete function defined as [22,23]:
where
where p(rk) is the probability of gray level
The Cumulative Distribution Function (CDF) is estimated from the PDF to obtain the histogram equalization function as follows [23]:
where T(rk) is the discrete transformation function. The enhanced image should have an equally-distributed density function over the entire dynamic range.
B. Band-Limited Histogram Equalization (BLHE)
The BLHE is based on HE [24]. The implementation of HE is easy, but it is not efficient enough with mammogram images. The tissue of the breast is over-enhanced, and the background noise is also enhanced. The BLHE enhances only the band of interest of the histogram. It is noticed that the abnormal tissues in mammogram images have higher intensities than those of the normal ones. Hence, in BLHE, histogram equalization is performed for a particular intensity band between lower limit b and upper limit c. The values of b and c differ from one image to another. After several tests, the radiologists have fixed the value of c to be 240 to avoid over enhancement. In addition, the best value of b is selected to be 180 [24].
C. Proposed Fuzzy Image Enhancement Technique
The HE may amplify the existing noise, and hence there is a need for more efficient techniques that avoid noise amplification. Therefore, the fuzzy sets theory is recommended to solve this problem by modifying the image features without changing their characteristics to give better enhancement results [25]. The proposed technique for contrast enhancement based on fuzzy processing consists of fuzzification, modification of the membership function, and defuzzification. First, the transformation of gray-scale values into fuzzy values is performed using a membership function. Then, the fuzzy values are modified using an intensification (INT) operator that modifies the membership function to achieve the enhancement of low-contrast images. Finally, the new gray-scale values are transformed from the modified fuzzy values back to the gray-scale domain by employing membership values to know the degree of brightness or darkness of pixels in the image [26]. The proposed technique aims to make the contrast enhancement process more effective and more adaptive and avoid over-enhancement. The block diagram of the fuzzy enhancement of mammogram images is demonstrated in Fig. 4. The implementation of the proposed fuzzy enhancement technique is explained in the following three steps:
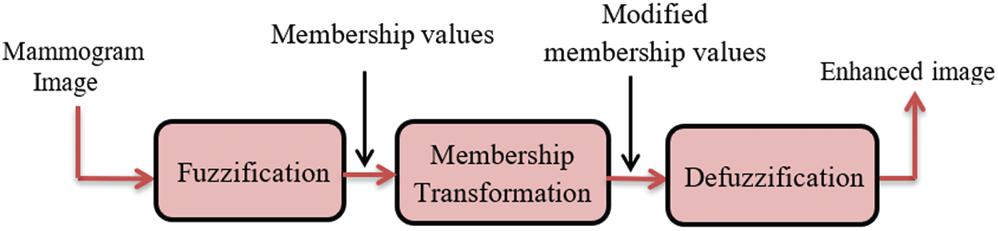
Figure 4: Block diagram of the fuzzy enhancement of mammogram images
1)Fuzzification of Mammogram Images
The fuzzification process means converting the gray-scale values to fuzzy values. It is some sort of coding of the input data. For image representation in the fuzzy set domain, let the size of the image x be m × n and let the image have l gray levels.
In the fuzzy set notation, μij is the brightness weight of the gray level intensity
where xmin is the minimum intensity of gray levels and xmax is the maximum intensity of gray levels.
2)Modification of Membership Function
The membership values resulting from the previous stage are modified using an appropriate fuzzy system, which generates new membership values. For contrast enhancement, the dark pixels will be darker, and the bright pixel will be brighter, but the pixels with moderate intensity values are not converted. So, for adaptive fuzzy contrast enhancement, after calculating the weights of the original image, the modified membership degree of the gray-level intensity μ’ij can be computed from μij by using the INT operator as follows [26]:
The values of membership that are above the default value (μc = 0.5) are converted to higher values, and the lower values than the default are converted to much lower values in a nonlinear manner to get the enhanced image.
3)Defuzzification of Mammogram Images
The inverse transformation T−1 leads to the generation of new gray levels x'ij based on the defuzzification process according to the following equations [26]:
Hence, x’ is the final enhanced image obtained by the defuzzification process.
3.3 Proposed Otsu's Multiple Thresholding Segmenttion
After the pre-processing of mammogram images, the segmentation step is performed. Image segmentation means partitioning of the image into categories or sub-regions that are related to different objects. Each pixel in the image corresponds to one of these categories. Nobuyuki Otsu proposed a thresholding method that depends on the optimal global thresholding [27]. It segments the image into two classes based on finding the threshold that maximizes the between-class variance. Otsu's method is simple and effective. In addition, the optimal threshold selection is automatic and stable. The proposed segmentation method depends on Otsu's multiple thresholding approach. It uses four thresholds to segment the image into five classes with different intensities. The block diagram of the proposed Otsu's multiple thresholding method is given in Fig. 5.
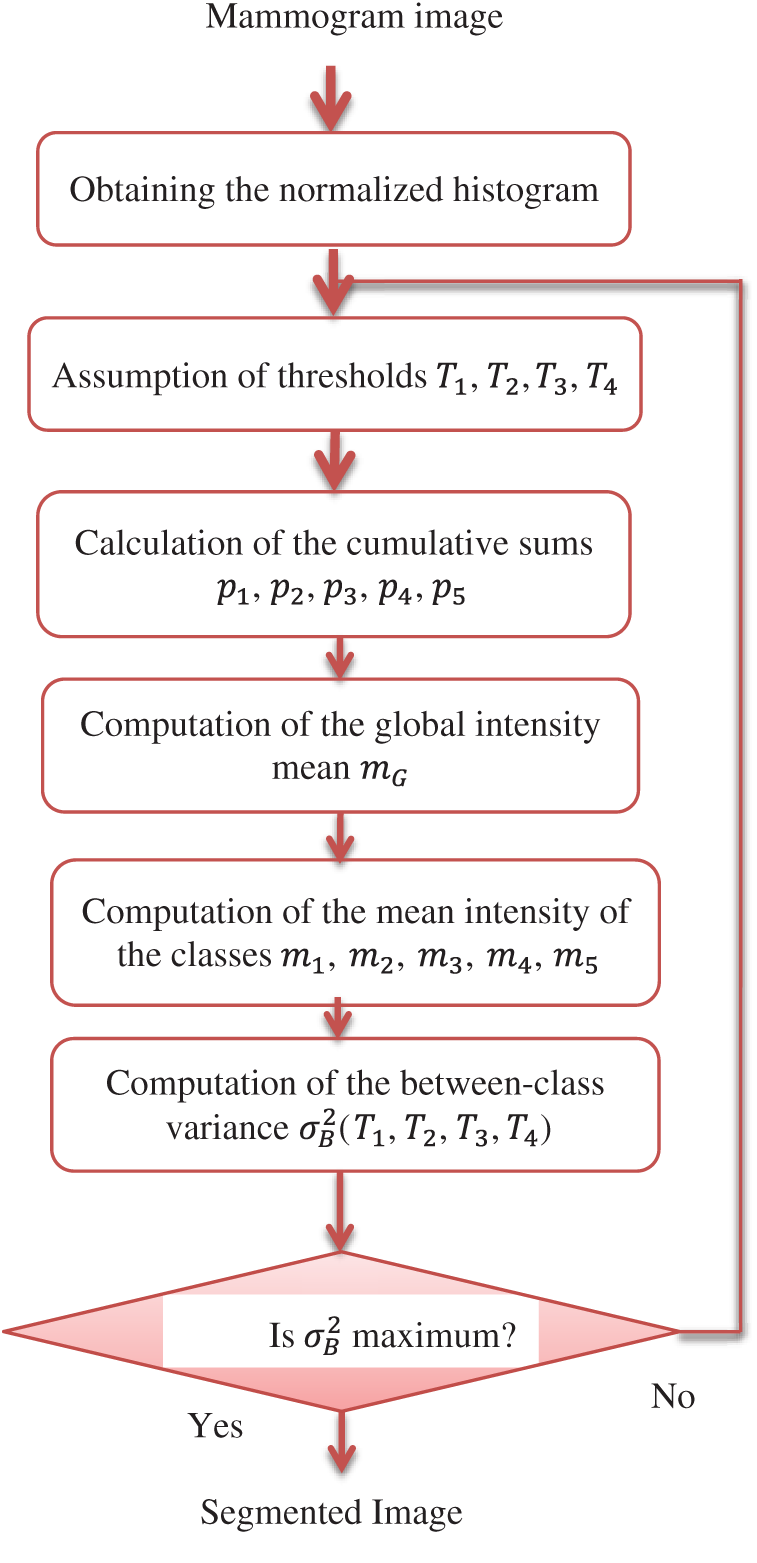
Figure 5: Block diagram of the proposed Otsu's multiple thresholding method
The steps of this method are summarized as follows:
1)The normalized histogram of the input image is calculated. The histogram bins are denoted by pi, where i = 0, 1, 2, 3,…, l − 1.
2)Thresholds T1, T2, T3, T4 that segment the image into five classes c1, c2, c3, c4, c5 are assumed.
3)The cumulative sums p1, p2, p3, p4, p5 are calculated as follows:
The global intensity mean mG is computed according to the following relation:
The mean intensities of classes are computed using the following equations:
The between-class variance σB2(T1, T2, T3, T4) is computed based on:
using the following relation
The values of thresholds are optimum, if they achieve the maximum between-class variance, i.e.,
where 0 < T1 < T2 < T3 < T4
3.4 Segmentation of Lesions in Mammogram Images
Segmentation of lesions in mammogram images is not an easy task. It is necessary to segment the region of interest to detect tumors easier and more accurately. The shape of the mass and the speculation determine the degree of malignancy. So, the segmentation of lesions assists radiologists in diagnosing breast cancer disease. Fig. 6 shows the block diagram of the proposed algorithm for the segmentation of breast cancer lesions.
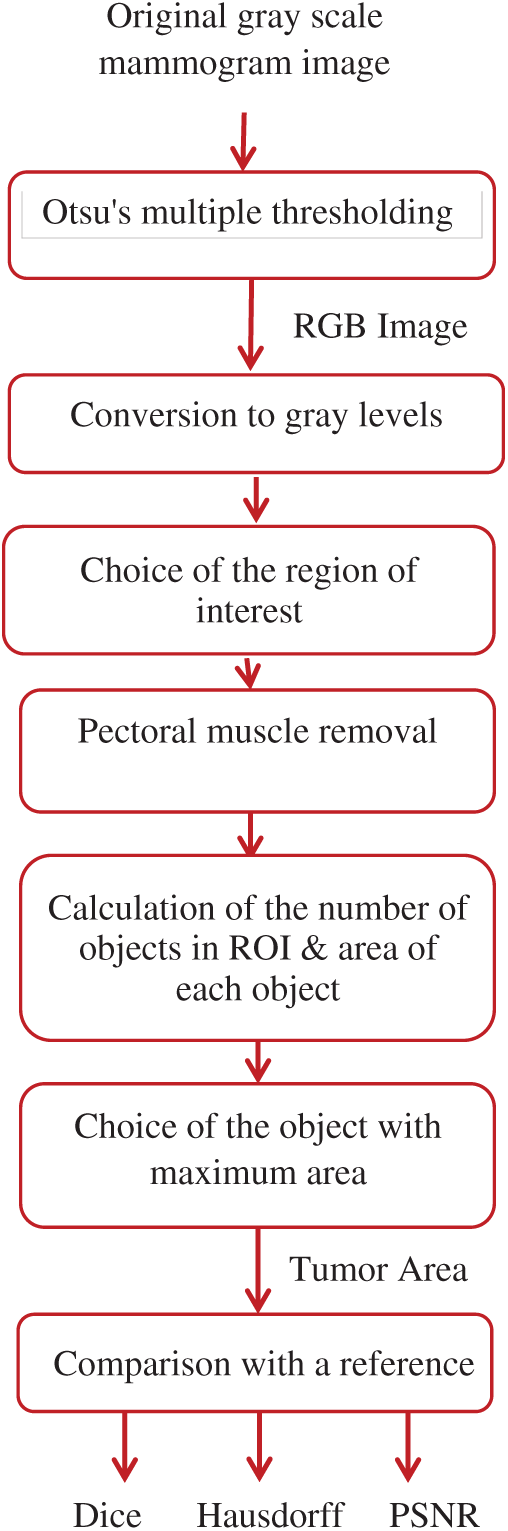
Figure 6: Block diagram of the proposed algorithm
The proposed segmentation algorithm of breast cancer lesions consists of the following steps:
1)Segmentation of the original mammogram image using Otsu's multiple thresholding method with four thresholds into five classes.
2)Conversion of the obtained RGB images to gray-scale images.
3)Selection of pixels whose intensity values fall within the range from 120 to 160, which was selected empirically to accurately segment the regions of interest (ROIs).
4)Removal of the muscle region by scanning the top quarter of the image, which contains the muscle region, and converting it to zeros as the pectoral muscle has the same properties as the tumor region.
5)Calculation of the area of the remaining objects in the image and selection of the object with the maximum area, which represents the tumor region.
6)Comparison of the resulting tumor region with a reference image determined by an expert.
7)Calculation of the Dice, Hausdorff, and PSNR values.
4 Performance Evaluation Metrics
4.1 Performance Evaluation Metrics for Image Enhancement
The quality metrics of images are often used to evaluate the process of image enhancement. Enhancement Measure (EME) and local contrast (Clocal) are the parameters used.
4.1.1 The Enhancement Measure (EME)
The EME is used for measuring the contrast enhancement of the image. It can be calculated as [28]:
where k1 is the number of horizontal blocks, k2 is the number of vertical blocks in the image, Imax(k, l) is the maximum pixel value and Imin(k, l) is the minimum pixel value in a given block, and c is a constant that is equal to 0.0001 to avoid dividing by 0. The block is selected to be of size 32 × 32.
Local contrast is essential for recognition of objects, detection of targets, and tracking, and it can be defined as [29]:
where μtarget and μbackground are the target and the background means in a local region.
4.2 Performance Evaluation Metrics for the Lesion Segmentation Process
Performance of the segmentation algorithm can be evaluated either visually or using metrics such as Dice coefficient, Hausdorff, and Peak Signal-to-Noise Ratio (PSNR) between the result of segmentation and the reference ground truth image provided by an expert.
The values of Dice, Hausdorff, and PSNR are determined using the following equations as in [11]:
The Dice criterion can be calculated using the following formula:
where A is the mask of the reference and B is the mask of an algorithm result.
The Hausdorff distance can be calculated using the following formula:
where A is the contour of the reference and B is the resulting contour of the algorithm.
4.2.3 Peak Signal-to-Noise Ratio (PSNR)
The PSNR can be calculated using the following formula:
where d is the maximum value in the image, MSE(A, B) is the mean square error between A and B such that:
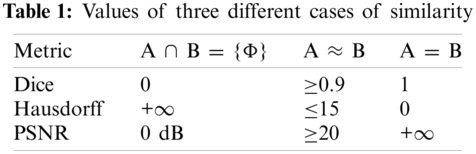
To compute the Dice criterion and PSNR, both the result and the reference are binarized (i.e., 1 = inside, 0 = outside). Hence, d = 1. The similarity cases are illustrated in Fig. 7. The values of Dice, Hausdorff, and PSNR metrics for these situations are illustrated in Tab. 1.
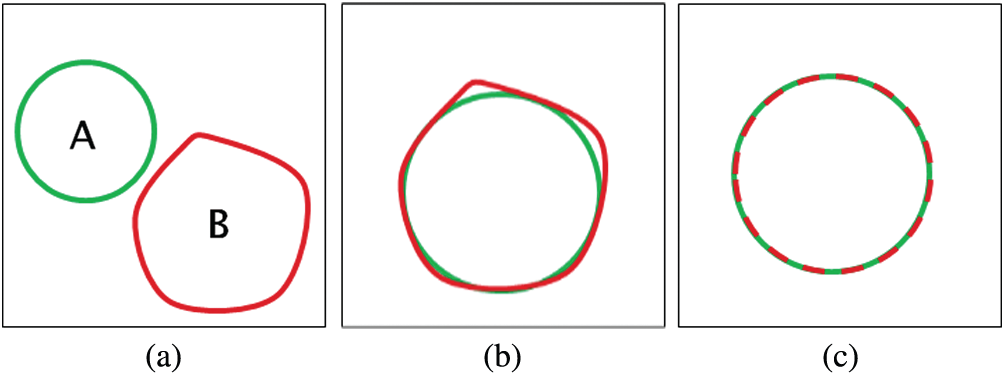
Figure 7: The similarity cases (a) A ∩ B = {Φ} (b) A ≈ B (c) A = B
This section presents the results and the performance analysis of the proposed techniques compared to previous ones. First, it introduces the contrast enhancement results using the HE, BLHE, and the proposed fuzzy enhancement technique. Then, the results of the breast region segmentation process using Otsu's multiple thresholding method are presented. After that, segmentation of lesions from the breast region is performed using the proposed algorithm. The algorithms presented in the paper are implemented with MATLAB (R2017a).
5.1 Results of Contrast Enhancement Techniques
The contrast enhancement results of mammogram images using HE, BLHE, and the proposed fuzzy enhancement technique are given in Fig. 8. A comparison is presented between the values of quality assessment metrics for HE, BLHE, and the proposed fuzzy enhancement technique on mammogram images. The EME values are given in Fig. 9 and the local contrast results are illustrated in Fig. 10.
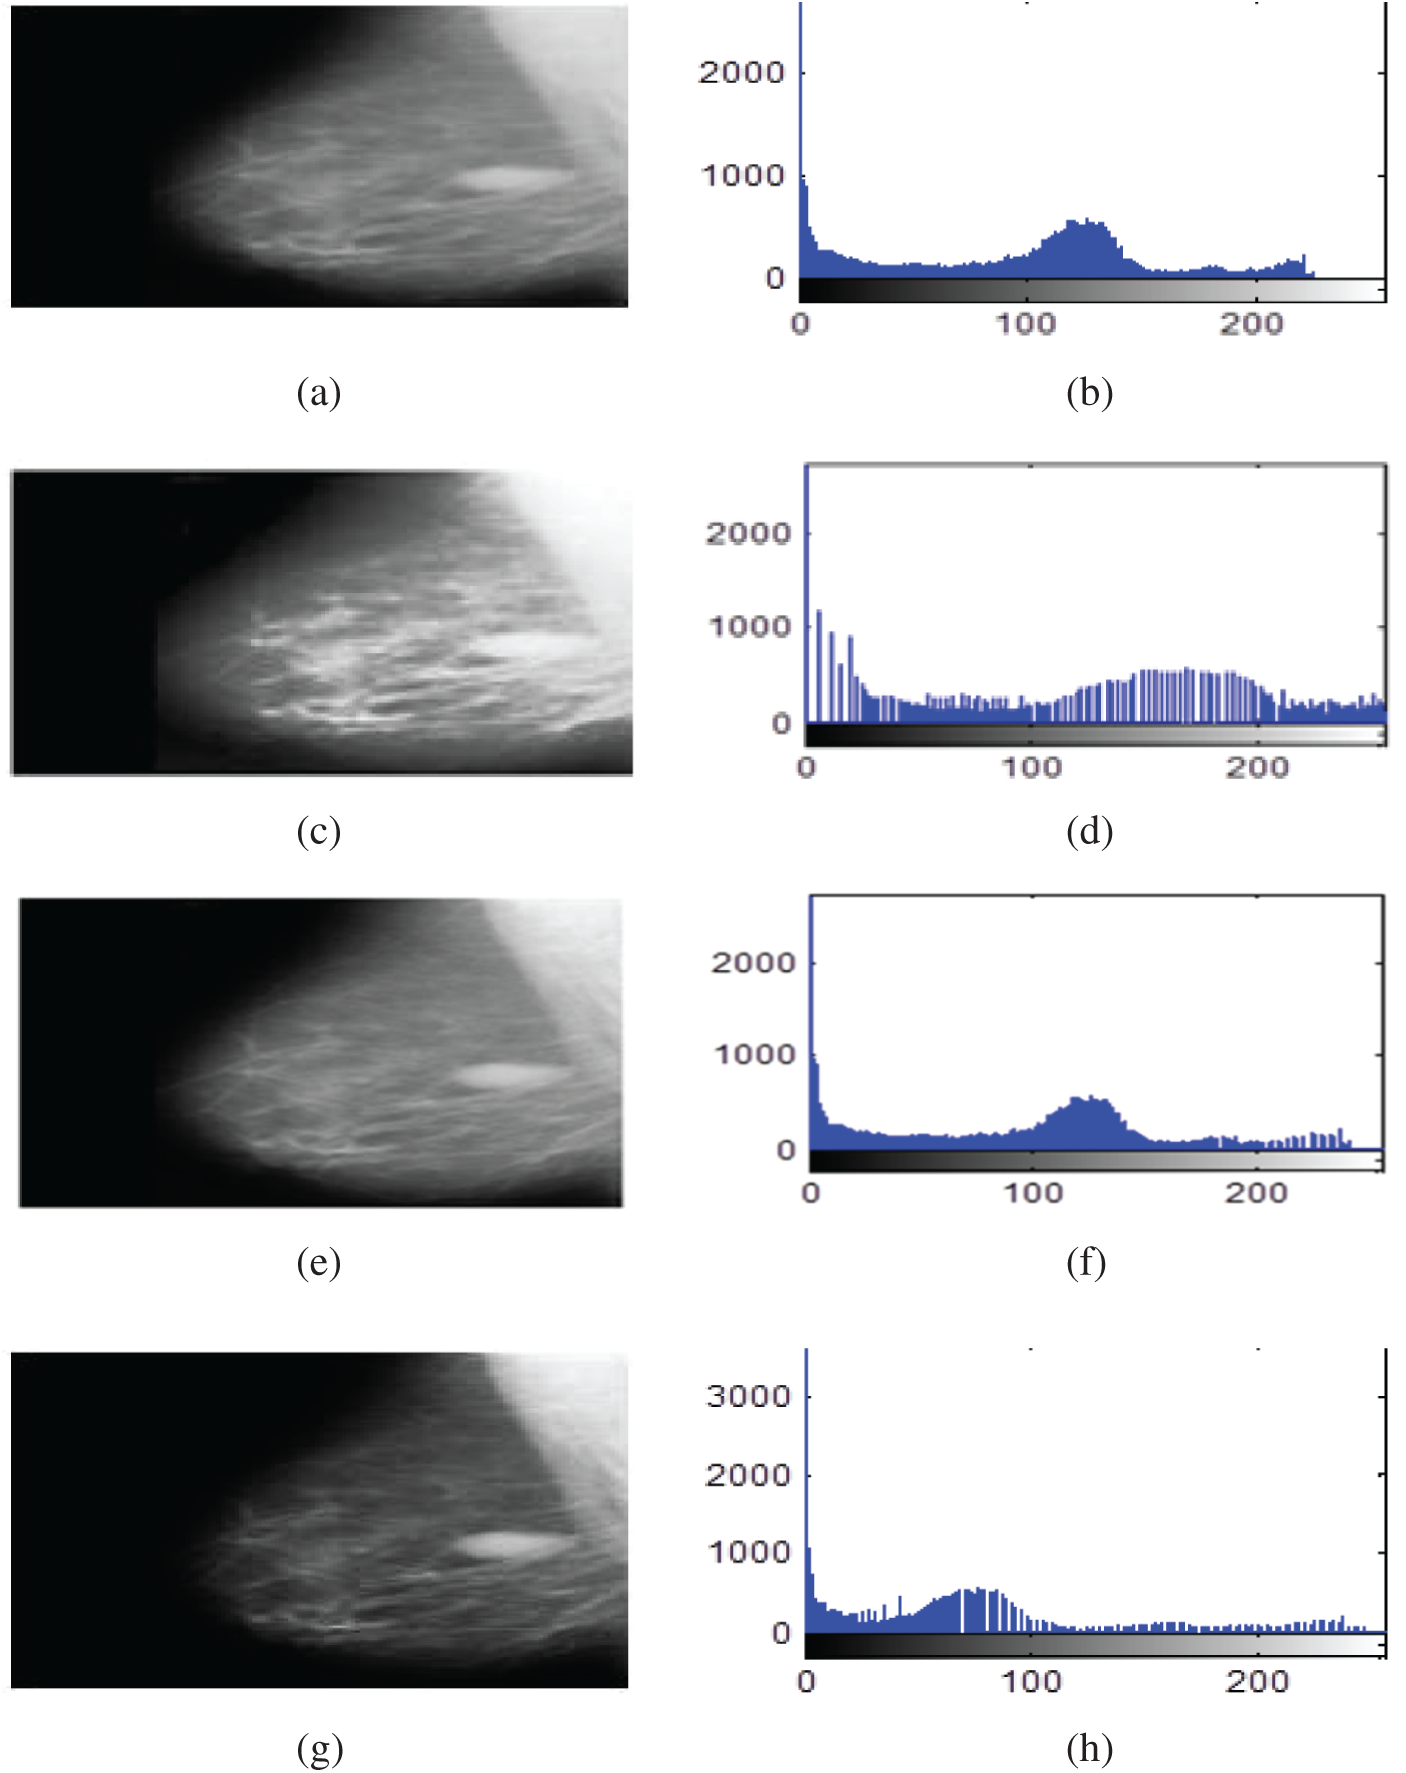
Figure 8: Contrast enhancement results of mammogram images using HE, BLHE, and the proposed fuzzy enhancement technique (a) Original image (b) Histogram of the original image (c) Enhanced image using HE (d) Histogram of enhanced image using HE (e) Enhanced image using BLHE (f) Histogram of enhanced image using BLHE (g) Enhanced image using the proposed fuzzy enhancement technique (h) Histogram of enhanced image using the proposed fuzzy enhancement technique
The contrast enhancement results using the conventional HE show that the intensities of gray levels have been distributed equally on the histogram. Hence, the HE enhances the low local contrast leading to higher local contrast. It is also noticed in some of the enhanced images that the background noise is enhanced, and there is an over contrast enhancement. So, the HE algorithm is not recommended.
It is noticed that the BLHE algorithm enhances only the band of interest. The obtained results in Figs. 8–10 reveal that the fuzzy enhancement technique achieves the best visual and numerical quality levels. This is attributed to the probabilistic nature of the algorithm. The image histogram is treated as a probability distribution, and based on this distribution, the fuzzy enhancement works. The fuzzy enhancement is adaptive from block to block and from image to image. That is why it gives the best contrast enhancement of mammogram images.
5.2 Segmentation Results of Mammogram Images
The first experiment of segmentation is performed to evaluate the performance of the basic Otsu's method that depends on finding the thresholds that give the maximum between-class variance. The image is segmented into two classes using an optimum threshold. Fig. 11 shows the segmentation results of five mammogram image samples using Otsu's thresholding method. It is observed that the images are segmented into two classes, such that the breast profile and the background are demonstrated. It is noticed that this is not sufficient for segmentation of the mammogram images, as the tumor position is not clear. So, we modified Otsu's method by using multiple thresholds.
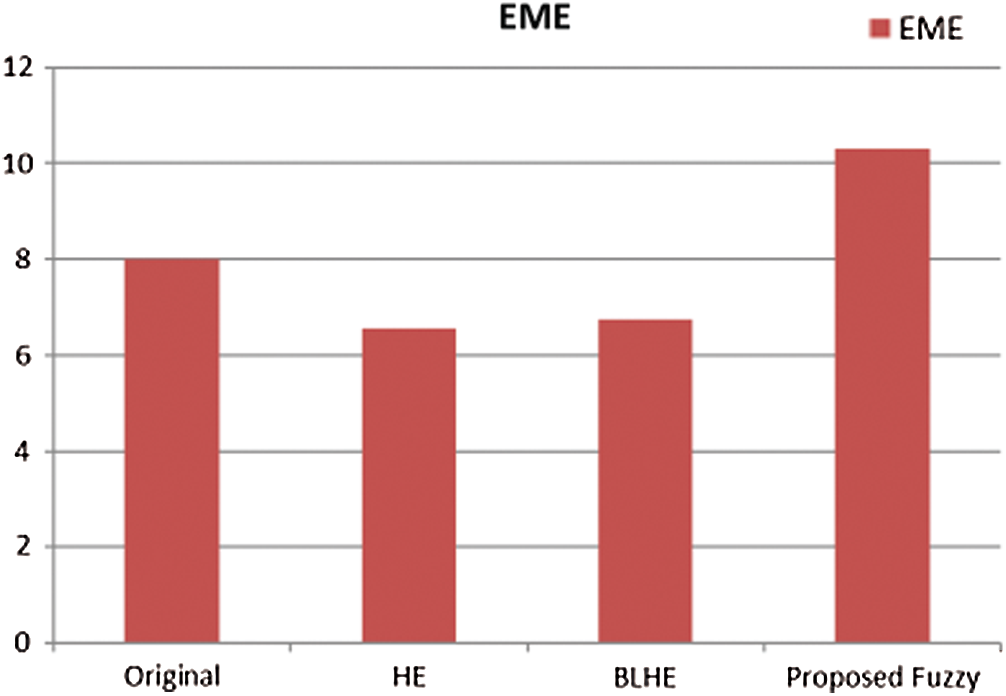
Figure 9: Comparison of EME values
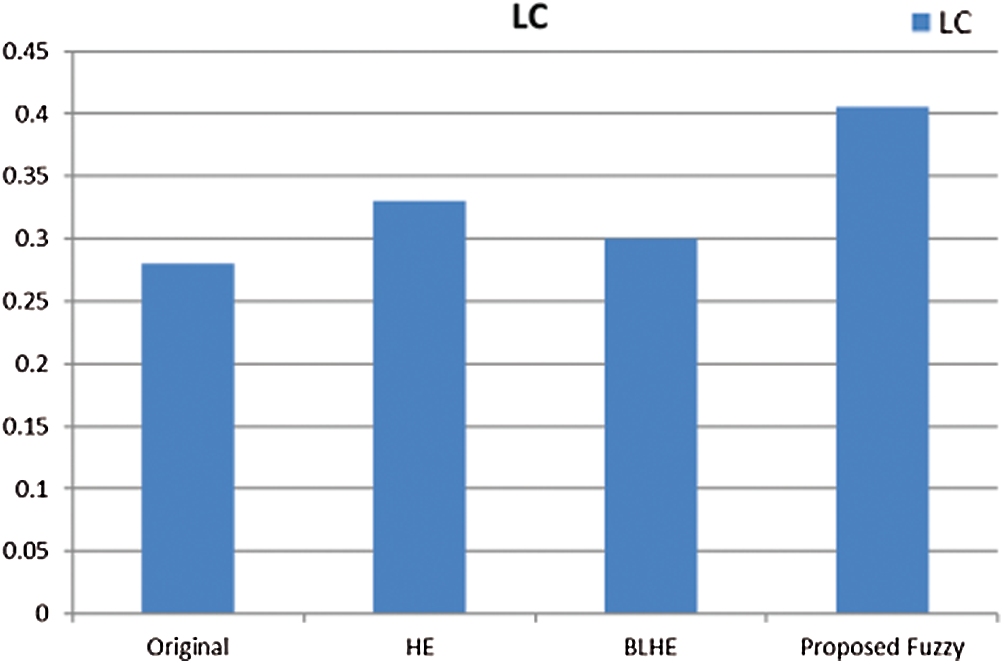
Figure 10: Comparison of local contrast values
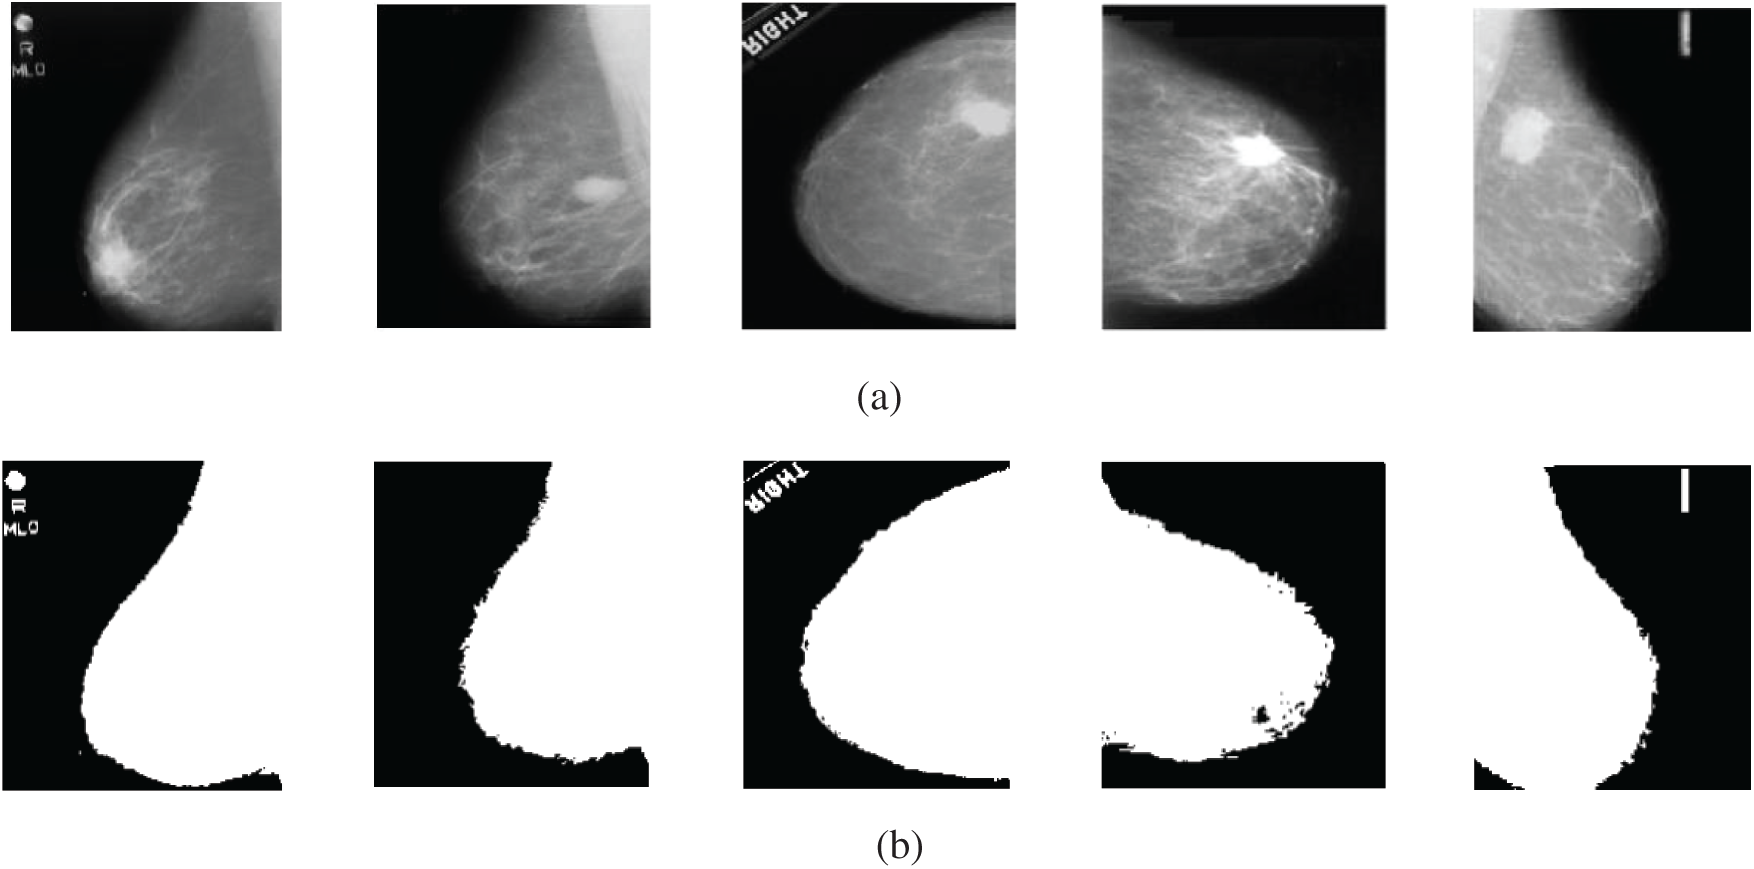
Figure 11: Original mammogram images and their segmented versions using Otsu's thresholding method (a) original images (b) segmented images
The second experiment is conducted to modify Otsu's method to segment the mammogram images with four thresholds into five classes with variable intensities. In order to achieve better visual interpretation, the images have been scaled to full color and displayed. The segmentation of five samples of mammogram images using the proposed method is illustrated in Fig. 12. The obtained results show that the proposed method segments the region of interest into five classes. Each class has a special color, and the position of the tumor appears well. In the CC view images, the tumors appear well, but in the MLO view images, the pectoral muscles and the tumors appear with the same color. So, the pectoral muscle has to be removed in order to determine the tumor well. These results are satisfactory and can be used for further processing of images. This work is the initial part of the CAD system to classify the digital mammograms as being normal, benign, or malignant.
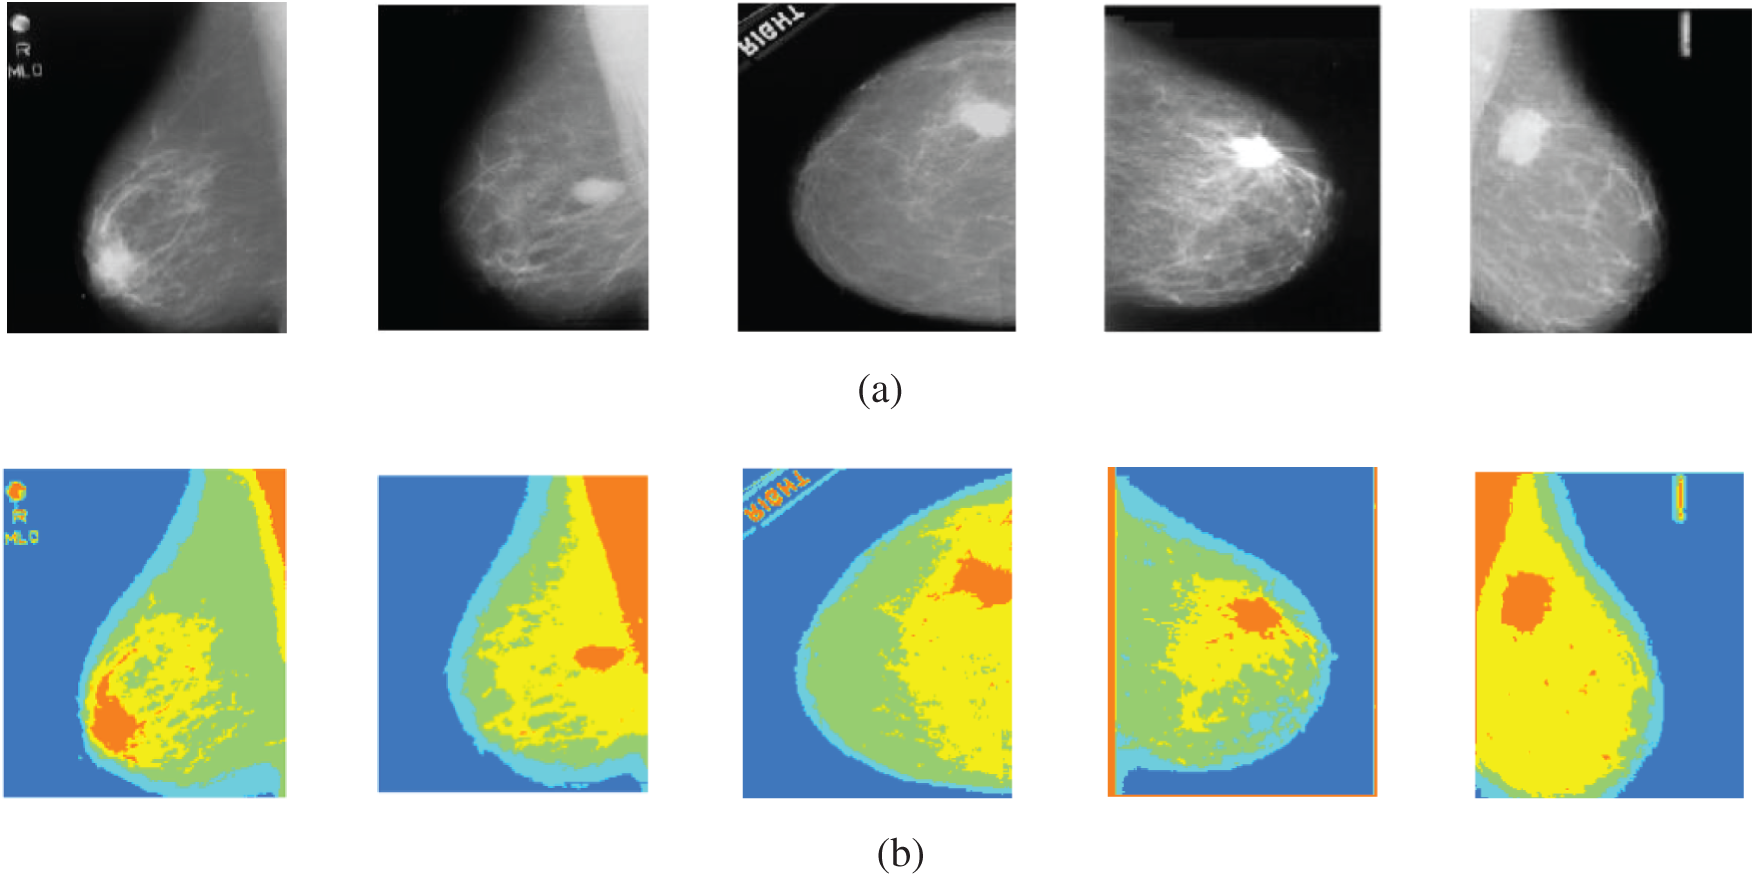
Figure 12: Original mammogram images and their segmented versions using the proposed method (a) original images (b) segmented images
Finally, the third experiment is performed to evaluate the proposed segmentation algorithm of breast cancer lesions. The results on MLO and CC images are shown in Figs. 13 and 14, respectively.
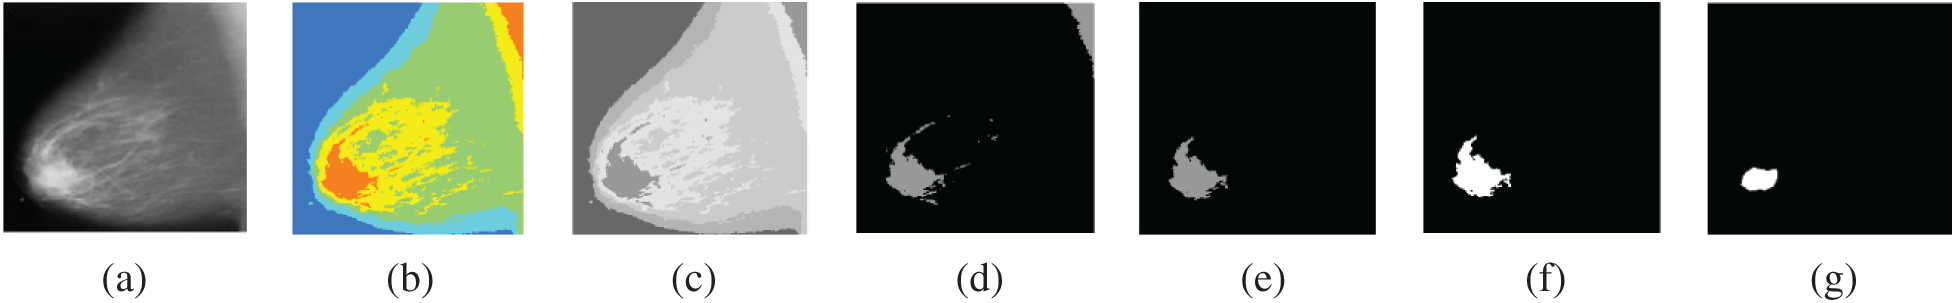
Figure 13: Segmentation of breast cancer lesions in an MLO image (a) Original image (b) RGB image (c) Gray-scale image (d) Segmented image (e) ROI image (f) Tumor image (g) Reference image
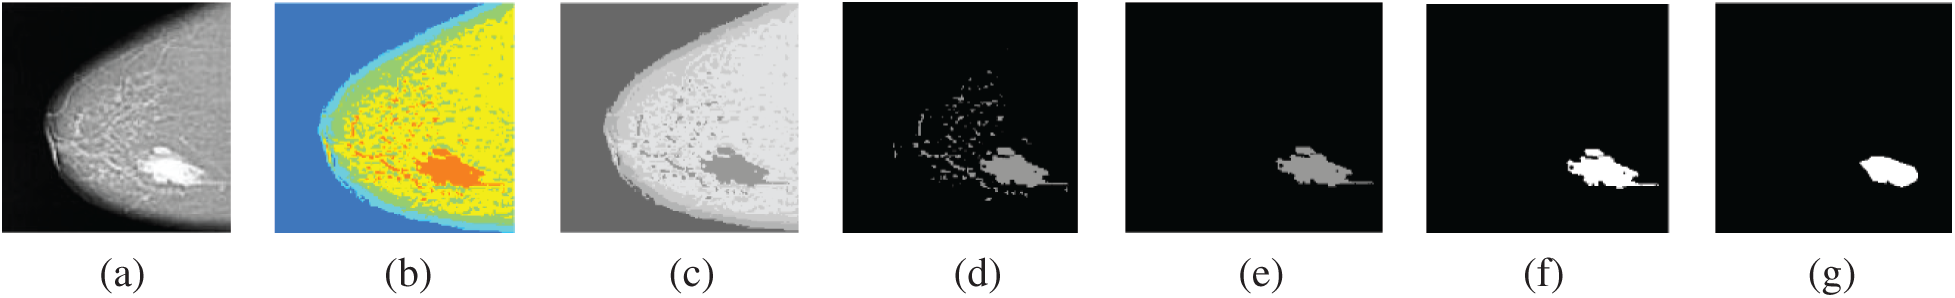
Figure 14: Segmentation of breast cancer lesions in a CC image (a) Original image (b) RGB image (c) Gray-scale image (d) Segmented image (e) ROI image (f) Tumor image (g) Reference image
5.3 Comparison with Previous Methods
The proposed segmentation algorithm of breast cancer lesions is compared with the Caselles method [30]. This method is a level-set segmentation method. It is selected from the CREASEG program [31], and it is suitable for mammogram images. Level-set methods are used intensively for segmenting medical images. They are used for denoting active contours. An active contour or a snake is an energy minimizing, deformable spline. It is often used to analyze images in computer vision applications to detect boundaries of objects and describe their shapes. The main idea is to move the curve within an image towards the features of interest such as lines and edges [32]. The values of the Dice coefficient, Hausdorff coefficient, and PSNR for the proposed algorithm and the Caselles method are shown in Fig. 15.
It is noticed from Tab. 1 that the performance of the segmentation process gets better if the values of the Dice coefficient are close to 1, the values of the Hausdorff coefficient are close to 0, and the values of PSNR are high. So, the results obtained in Fig. 15 show that the proposed algorithm has a better performance compared to that of the algorithm presented by Caselles et al. [30]. The values of Dice, Hausdorff, and PSNR for the proposed algorithm are better than those of the Caselles method. Caselles method is based on level-set segmentation. So, a manual initial contour is required to start with. The final contour depends on the initial contour size and location compared to the object to be segmented. So, it is not accurate in the segmentation of masses. On the other hand, the proposed algorithm for segmenting breast cancer lesions does not need initialization. Hence, it is more efficient.
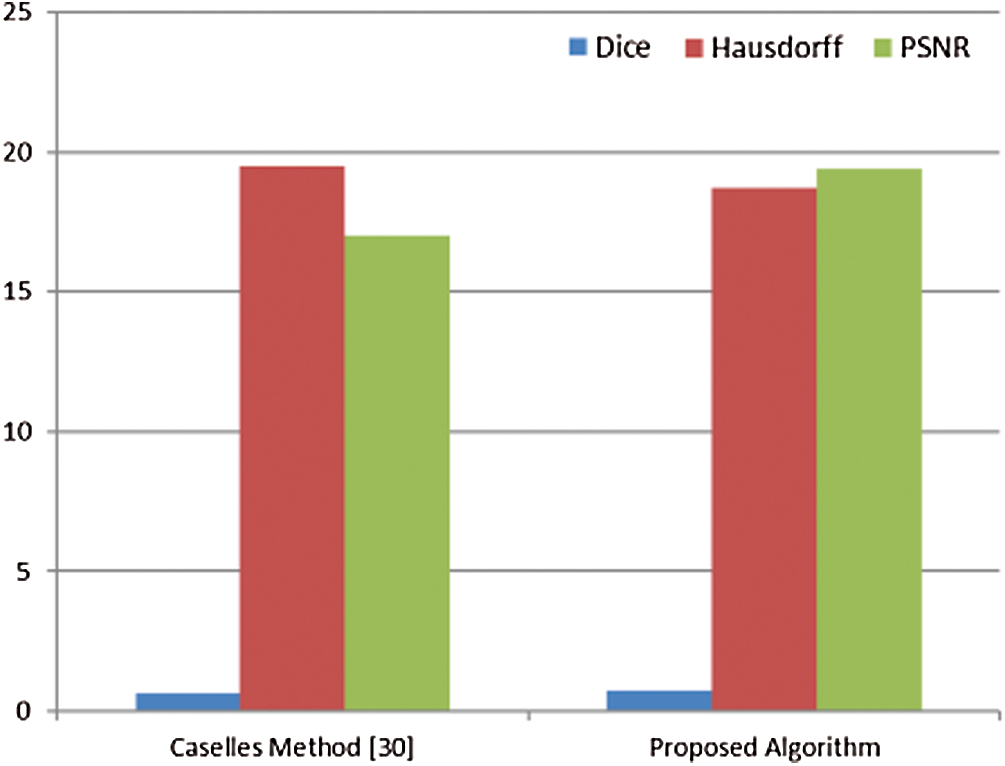
Figure 15: Dice coefficient, Hausdorff coefficient, and PSNR values for the Caselles method and the proposed algorithm
This paper dealt with a vital issue in medical image processing, which is detecting breast cancer. It introduced a framework for processing of mammogram images. This framework begins with the pre-processing of images by removal of digitization noise using a 2D median filter, suppression of artifacts using some morphological operations, and contrast enhancement of images using a proposed fuzzy image enhancement technique to improve the visual appearance. After that, a segmentation step is implemented to detect tumors. The Otsu's multiple thresholding method with four thresholds is used for mammogram segmentation. It segments the image into five classes with different intensities. This method has achieved better results of segmentation than those obtained with thresholding using one, two, or three thresholds. Segmentation of breast cancer lesions has been performed through isolation of the region of interest from the breast region, and then tumor localization. In the future work, we can incorporate deep learning algorithms for classification of images into normal and abnormal classes. We intend to investigate the hardware implementation of the proposed software in real-time systems.
Acknowledgement: The authors would like to thank the support of the Deanship of Scientific Research at Princess Nourah bint Abdulrahman University.
Funding Statement: This research was funded by the Deanship of Scientific Research at Princess Nourah Bint Abdulrahman University through the Fast-track Research Funding Program.
Conflicts of Interest: The authors declare that they have no conflicts of interest to report regarding the present study.
1. F. Bray, J. Ferlay, I. Soerjomataram, R. L. Siegel, L. A. Torre et al., “Global cancer statistics 2018: GLOBOCAN estimates of incidence and mortality worldwide for 36 cancers in 185 countries,” Cancer Journal for Clinicians, vol. 68, no. 6, pp. 394–424, 2018. [Google Scholar]
2. M. J. Hashim, F. A. Al-Shamsi, N. A. Al-Marzooqi, S. S. Al-Qasemi, A. H. Mokdad et al., “Burden of breast cancer in the arab world: Findings from global burden of disease, 2016,” Journal of Epidemiology and Global Health, vol. 8, no. 1–2, pp. 54–58, 2018. [Google Scholar]
3. J. M. Seely and T. Alhassan, “Screening for breast cancer in 2018—What should we be doing today?,” Current Oncology, vol. 25, no. 1, pp. 115–124, 2018. [Google Scholar]
4. R. Masud R, M. Al-Rei M and C. Lokker, “Computer-aided detection for breast cancer screening in clinical settings: Scoping review,” JMIR Medical Informatics, vol. 7, no. 3, pp. 1–10, 2019. [Google Scholar]
5. M. Loberg Mette, L. Lousdal, M. Bretthauer and M. Kalager, “Benefits and harms of mammography screening,” Breast Cancer Research, vol. 17, no. 63, pp. 1–12, 2015. [Google Scholar]
6. N. Safdarian and M. Hediyehzadeh, “Detection and classification of breast cancer in mammography images using pattern recognition methods,” Multidisciplinary Cancer Investigation, vol. 3, no. 4, pp. 13–24, 2019. [Google Scholar]
7. S. Z. Ramadan, “Methods used in computer-aided diagnosis for breast cancer detection using mammograms: A review,” Journal of Healthcare Engineering, vol. 2020, pp. 1–21, 2020. [Google Scholar]
8. S. Punitha, A. Amuthan and K. Joseph, “Benign and malignant breast cancer segmentation using optimized region growing technique,” Future Computing and Informatics Journal, vol. 3, no. 2, pp. 348–358, 2018. [Google Scholar]
9. K. Rakoth and J. Sasikala, “Self-adaptive drag-on fly based optimal thresholding for multilevel segmentation of digital images,” Journal of King Saud University-Computer and Information Sciences, vol. 30, no. 4, pp. 449–461, 2018. [Google Scholar]
10. D. Pereira, R. Ramos and M. Nascimento, “Segmentation and detection of breast cancer in mammograms combining wavelet analysis and genetic algorithm,” Computer Methods and Programs in Biomedicine, vol. 114, no. 1, pp. 88–101, 2014. [Google Scholar]
11. S. A. Hassan, M. S. Sayed and F. Farag, “Segmentation of breast cancer lesion in digitized mammogram images,” in Proc. IEEE 7th Cairo Int. Biomedical Engineering Conf., Cairo, Egypt, pp. 11–13, 2014. [Google Scholar]
12. A. K. Singh and B. Gupta, “A novel approach for breast cancer detection and segmentation in a mammogram,” in Proc. IEEE 11th Int. Multi-Conf. on Information Processing, vol. 54, pp. 676–682, Jabalpur, India, 2015. [Google Scholar]
13. S. M. Beheshti, H. A. Noubari, E. Fatemizadeh and M. Khalili, “Classification of abnormalities in mammograms by new asymmetric fractal features,” Biocybernetics and Biomedical Engineering, vol. 36, no. 1, pp. 56–65, 2016. [Google Scholar]
14. S. Tripathy and T. Swarnkar, “Unified Pre-processingpre-processing and enhancement technique for mammogram images,” Proc. Computer Science, vol. 167, pp. 285–292, 2020. [Google Scholar]
15. M. Talha, G. B. Sulong and A. Jaffar, “Pre-processing digital breast mammograms using adaptive weighted frost filter,” Biomedical Research, vol. 27, no. 4, pp. 1407–14012, 2016. [Google Scholar]
16. U. Albalawi, S. Manimurugan and R. Varatharajan, “Classification of breast cancer mammogram images using convolution neural network,” Concurrency and Computation Practice and Experience, vol. 3, pp. 1–12, 2020. [Google Scholar]
17. J. Suckling and J. Parker, “The mammographic images analysis society digital mammogram database,” Exerpta Medica IntCongress Series, vol. 1069, pp. 375–378, 1994. [Google Scholar]
18. D. Vijayalakshmi, M. K. Nath and O. P. Acharya, “A comprehensive survey on image contrast enhancement techniques in spatial domain,” Sensing and Imaging, vol. 21, no. 1, pp. 1–40, 2020. [Google Scholar]
19. N. Ibrahim, N. Soliman, M. Abdallah and F. Abd El-Samie, “An algorithm for pre-processing and segmentation of mammogram images,” in Proc. IEEE 11th Int. Conf. on Computer Engineering & Systems, Cairo, Egypt, pp. 187–190, 2016. [Google Scholar]
20. A. Papadopoulos, D. I. Fotiadis and L. Costaridou, “Improvement of microcalcification cluster detection in mammography utilizing image enhancement techniques,” Computers in Biology and Medicine, vol. 38, no. 10, pp. 1045–1055, 2020. [Google Scholar]
21. H. Ackar, A. Abd Almisreb and M. Saleh, “A review of image enhancement techniques,” Southeast Europe Journal of Soft Computing, vol. 8, no. 1, pp. 42–48, 2019. [Google Scholar]
22. B. Subramani and M. Veluchamy, “Fuzzy gray level difference histogram equalization for medical image enhancement,” Journal of Medical Systems, vol. 44, no, no. 6, pp. 1–10, 2020. [Google Scholar]
23. R. Pal Singh and M. Dixit, “A novel approach for image enhancement using PSO,” Global Journal of Engineering Science and Researches, vol. 2, no. 6, pp. 136–144, 2015. [Google Scholar]
24. A. A. Mahmoud, W. El-Shafai, T. E. Taha, E. S. M. El-Rabaie, O. Zahran et al., “A statistical framework for breast tumor classification from ultrasonic images,” Multimedia Tools and Applications, vol. 80, pp. 1–20, 2020. [Google Scholar]
25. S. Punitha, S. Ravi and M. A. Devi, “Breast cancer detection in digital mammograms using segmentation techniques,” IJCTA, vol. 9, no. 3, pp. 167–182, 2016. [Google Scholar]
26. N. El-Hag, W. El-Shafai, G. El-banby, E. El-Rabaie, A. El-Fishawy et al., “An efficient framework for macula exudates detection in fundus eye medical images,” in Proc. 1st Int. Conf. on Electronic Engineering, Cairo, Egypt, pp. 78–83, 2019. [Google Scholar]
27. N. Otsu, “A threshold selection method from gray-level histograms,” IEEE transactions on systems,” Man &Cybernetics, vol. 9, no. 1, pp. 62–66, 1979. [Google Scholar]
28. K. Akilaa, L. Jayashreeb and A.Vasuki, “Mammographic image enhancement using indirect contrast enhancement techniques—A comparative study,” Proc. Computer Science, vol. 47, pp. 255–261, 2015. [Google Scholar]
29. R. F. Soliman, M. Amin and F. E. Abd El-Samie, “C22. enhanced fusion for infrared and visible images,” in Proc. IEEE 29th National Radio Science Conf., Cairo, Egypt, pp. 10–15, 2012. [Google Scholar]
30. V. Caselles, R. Kimmel and G. Sapiro, “Geodesic active contours,” International Journal of Computer Vision, vol. 22, no. l, pp. 6 1–79, 1997. [Google Scholar]
31. T. Dietenbeck, M. Alessandrini, D. Friboulet and O. Bernard, “CREASEG: A free software for the evaluation of image segmentation algorithms based on level-set,” in Proc. IEEE Int. Conf. on Image Processing, Hong Kong, China, pp. 665–668, 2010. [Google Scholar]
32. X. Jiang, R. Zhang and N. Shengdong, “Image segmentation based on level set method,” in Proc. IEEE Int. Conf. on Medical Physics and Biomedical Engineering, vol. 33, Barcelona, Spain, pp. 840–845, 2012. [Google Scholar]
 | This work is licensed under a Creative Commons Attribution 4.0 International License, which permits unrestricted use, distribution, and reproduction in any medium, provided the original work is properly cited. |