DOI:10.32604/cmc.2022.017069
| Computers, Materials & Continua DOI:10.32604/cmc.2022.017069 | |
| Article |
Stock Market Trading Based on Market Sentiments and Reinforcement Learning
1Department of Computer Science & Engineering, NSS College of Engineering, Palakkad, 678008, Kerala, India
2Department of Electronics and Communication Engineering, NSS College of Engineering, Palakkad, 678008, Kerala, India
3Unité de Recherche de Matière Condensée, D'Electronique et de Traitement du Signal (URAMACETS), Department of Physics, University of Dschang, P. O. Box 67, Dschang, Cameroon
4Department of Information Technology, College of Computer and Information Sciences, Princess Nourah Bint Abdulrahman University, Riyadh, 84428, Saudi Arabia
5Department Electronics and Electrical Communications, Faculty of Electronic Engineering, Menoufia University, Menouf, 32952, Egypt
*Corresponding Author: Naglaa F. Soliman. Email: nfsoliman@pnu.edu.sa
Received: 20 January 2021; Accepted: 16 May 2021
Abstract: Stock market is a place, where shares of different companies are traded. It is a collection of buyers’ and sellers’ stocks. In this digital era, analysis and prediction in the stock market have gained an essential role in shaping today's economy. Stock market analysis can be either fundamental or technical. Technical analysis can be performed either with technical indicators or through machine learning techniques. In this paper, we report a system that uses a Reinforcement Learning (RL) network and market sentiments to make decisions about stock market trading. The system uses sentiment analysis on daily market news to spot trends in stock prices. The sentiment analysis module generates a unified score as a measure of the daily news about sentiments. This score is then fed into the RL module as one of its inputs. The RL section gives decisions in the form of three actions: buy, sell, or hold. The objective is to maximize long-term future profits. We have used stock data of Apple from 2006 to 2016 to interpret how sentiments affect trading. The stock price of any company rises, when significant positive news become available in the public domain. Our results reveal the influence of market sentiments on forecasting of stock prices.
Keywords: Deep learning; machine learning; daily market news; reinforcement learning; stock market
The stock market is a platform consisting of sellers and buyers of stocks. Some shares of public companies are available for public trading. Stock markets are in electronic form, where people can access stock exchanges through their computers to conduct transactions, mainly selling and buying of stocks [1]. Participants can buy or sell at their convenience. Stock exchanges facilitate trading. They provide a real-time interface between buyers and sellers, allowing a systemized matching process between willing buyers, and sellers [2].
Investments in stocks that are present in the stock market can lead to financial gains. The choice to buy, sell or hold a stock is of great importance, and hence there is a need for analysis of stocks. This analysis leads to forecasting future stock prices, which helps in decision making. Efficient and accurate stock price prediction may lead to enormous profits.
The stock market is often referred to as a peak investment outlet, due to trading of large amounts of shares through it. Studying the behavior of financial markets is a great challenge. According to the Efficient Market Hypothesis (EMH) [3], there is no space for predicting the stock market. One of the factors that aid for stock market analysis is to develop well-researched and accurate perspectives, which include both directional view and information such as price of stocks, expected risk, and expected reward.
The fundamental analysis, as well as the technical analysis [3], helps in developing a good view of the market. In fundamental analysis, few companies are researched, and based on their performance, future predictions are made, and decisions are taken, accordingly. On the other hand, in technical analysis, the current market trends are considered, and hence the market is scanned for opportunities. Technical indicators can be used for this analysis.
One must correctly understand the difference between the two types of analysis to succeed in the stock market. Fundamental analysis is preferred in long-term investments, and technical analysis is chosen for short-term investments. An investor can earn a small yet consistent profit, frequently, in a short term by choosing trading decisions with technical analysis. The application domains of both methods of analysis also differ. Technical analysis can be applied to all asset classes like equities, commodities, income, etc. In contrary, fundamental analysis is specific for each asset class. For example, when dealing with agricultural commodities, the fundamental analysis includes rainfall, harvest, and inventory analysis. On the other hand, for metal commodities, different factors are considered. In technical analysis, regardless of the asset, the same technical indicators such as Moving Average (MA), Moving Average Convergence Divergence (MACD), and Relative Strength Index (RSI) can be used.
To find stock chart patterns for technical analysis, predict market price and make decisions, machine learning methods are widely used. Deep learning can be used to find hidden patterns in stock data. Deep learning technology is used to train the models on the data for making predictions. Here, there are different layers of abstraction [4] through which the learned features of data are passed. An appropriate model for the multivariate time series analysis [5] is the Deep Learning Neural Network (DLNN), due to its built-in properties. This model is robust to noise in input data. It can support learning and predictions even with missing values. It can learn both linear and non-linear relationships in data.
Even if we can predict the prices by certain patterns and make the decisions by using the above-mentioned methods, there is no way to learn from the decisions made, and to make better decisions in the future through learning from past actions. That is why RL comes into the picture of stock market trading systems. A machine learning technique in which the system learns from the environment and tries to maximize the rewards is known as an RL technique [6].
The main contributions of this work are:
(1) The inclusion of market sentiments in an RL-based system that is used for stock market trading.
(2) The performance comparison of an RL network with sentiments and an RL network without sentiments.
(3) The investigation of the influence of market news on deciding stock prices.
The remainder of this paper is organized as follows. In Section 2, a review of the related work is provided. Section 3 gives an overview of sentiment analysis and RL. Section 4 gives an explanation of the suggested system, and Section 5 gives the investigation outcomes. The conclusion is provided in Section 6.
This section provides an overview of the different existing stock market forecasting methods. One of the classic stock price forecasting methods is the Autoregressive Integrated Moving Average (ARIMA) explained by Ariyuo et al. [7]. The combination of past errors and past values is considered in ARIMA to form the future value. This model depends on the close price, high price, low price, and open price to predict future values. Even though the ARIMA model is efficient in forecasting time series data, it cannot be used if the data contains a seasonal component. The time-series data is said to have a seasonal component if it contains repetitive cycles. For modelling of such data, an advanced ARIMA model known as SARIMA was proposed by Lee et al. [8], and Chong et al. [9]. The SARIMA model is effective in financial forecasting, specifically for the short and medium ranges.
The traditional models such as ARIMA and SARIMA can be used effectively only on stationary time series data. In a live trading scenario, implementing these models is a great challenge, because the new coming data may not always be stationary time series data. To overcome this limitation, novel techniques in deep learning can be used. A system that comprises technical analysis, Artificial Neural Network (ANN), and sentiment analysis has been used to make decisions as explained by Bhat et al. [10]. Technical indicators such as Exponential Moving Average (EMA), Moving Average Convergence and Divergence (MACD), and Relative Strength Index (RSI) have been used for technical analysis. The combination of ARIMA and Artificial Neural Network (ANN) has been discussed by Zhang [11]. This model is capable of capturing more parameters than those of the individual models. Both linear and non-linear patterns of the input data can be studied using this model. Unfortunately, it cannot be effectively applied in all scenarios. To overcome this problem, another hybrid structure of ARIMA model and Support Vector Machine (SVM) was presented by Chen et al. [12]. Unlike other neural networks, the SVM depends on the Structured Risk Minimization (SRM) principle to minimize a generalized error instead of an empirical error. An ARIMA model, which makes use of the Generalized Autoregressive Conditional Heteroscedasticity (GARCH), was presented by Guresen et al. [13] & Wang et al. [14]. Past error terms are considered in calculating the variance of current error terms. The square of the previous error is considered in this model.
A combination of machine learning models has also been used for stock price forecasting. A model has been built by combining deep learning for feature extraction and financial time series data analysis to predict price movements. It is known as the Multi-Filter Neural Network (MFNN), and it was proposed by Long et al. [15]. This model is a combination of a CNN and an RNN, and it has a structure of multiple filters. Nayak et al. [16] explained a model based on supervised machine learning, logistic regression, boosted decision tree and SVM for predicting daily stock prices and monthly stock prices. This model depends on company sentiments and historical data for predicting the daily stock prices, and the historical data for predicting the monthly stock prices. A combination of ANN and Random Forest (RF) classifier was discussed by Vijh et al. [17] for predicting the daily stock prices for five sector companies. This method introduced new variables to improve the prediction. A hybrid model containing RNN and Long Short-Term Memory (LSTM) was presented by Hiransha et al. [18]. The day-wise closing price of two types of stocks in the company is considered to predict the future stock price.
A hybrid structure of SVM and KNN was presented by Chen et al. [19]. A feature-weighted SVM and a KNN were used. The relative importance of each feature was considered. Stock market prediction based on social media data and news about stocks using various machine learning classifiers was discussed by Khan et al. [20]. Gaussian naive Bayes, multinomial naive Bayes, SVM, KNN, logistic regression, RF, regression tree, AdaBoost, extra tree, gradient boosting and linear discriminant analysis classifiers were considered. A multi-layer perceptron was also used to improve the prediction results. Jena et al. [21] presented a distributed architecture that can be utilized to forecast stock prices using real-time streaming of stock data. Machine learning models such as decision tree, polynomial linear regression, support vector regression, and RF were built using historical data to predict stock price from the continuous flow of stock data. The CNN for stock market prediction was discussed by Chen et al. [22]. The stock price movement is the output of the model represented as zero or one. Zero denotes that the stock is down, and one denotes that the stock is up.
Various research works have been conducted to assess the fluctuating financial market behavior within a deep learning framework with a prime focus on predicting the stock price and thereby minimizing the losses of stockholders [23]. The authors of [24] combined both stock data and news headline sentiments to devise a better trading system. In [25], the authors used a hybrid deep neural network architecture to forecast stock price to enhance prediction accuracy. In a very recent study [26], the authors used return prediction to optimize portfolio formation. In [27], a multi-layer and multi-ensemble stock trader was discussed, and the authors validated their approach in a real-world trading context.
A technique based on CNN, called CNNPred, was introduced by Hoseinzade et al. [28] for stock market price prediction. It depends on an advanced CNN model that can be applied in various market conditions, as it supports heterogeneous data. Unsupervised learning methods such as Principal Component Analysis (PCA), Auto Encoder (AE), and Restricted Boltzmann Machine (RBM) have been applied to high-frequency intra-day stocks to predict the future market scenarios as proposed by Chong et al. [9]. Besides, information about past stock returns is considered.
The RL is an efficient tool for stock market modeling, representing and learning of future rewards and immediate rewards. Moody and Saffella proposed a direct RL algorithm that can be applied for stock market trading. This algorithm allows a sort of Direct Reinforcement Trading (DRT). It considers the decision at the last time to give the current time decision with a single-layer Recurrent Neural Network (RNN). The problem with this algorithm is the lack of feature learning of input data. Deng et al. [29] presented a deep neural network with an AE to learn the input vector deep representation. This algorithm depends on a fuzzy network to work in uncertain market conditions. A combination of a Genetic Network Programming (GNP) model with RL and an MLP was presented by Ramezanian et al. [30].
The classification of data and its time series modelling are performed to forecast the stock state. Various technical indicators using GNP programming and MLP are aggregated to forecast the daily stock return. A classic RL algorithm, called Q-learning, was presented to optimize policies by Du et al. [31]. Value functions including interval profit, sharp ratio, and sharp derivative ratio were maximized, and the model performance was analyzed. Jeong et al. [32] proposed a deep Q-learning network to determine the number of shares used in prediction. Q values for all actions are calculated at each time step, and the action with the highest Q value is selected. Instead of using a single agent in the decision-making, a multi-agent Q-learning approach was presented by Lee et al. [33]. Four agents are used including Buy Signal agent, Sell Signal agent, Buy Order agent, and Sell Order agent.
The above-mentioned methods that use RL for decision-making depend only on market statistics. The stock market is a highly volatile environment that does not always depend only on previous statistics. It depends also on several other factors including market sentiment obtained from stock market news or rumors. Stock market news is an essential tool in forming market sentiment. The news can have an abrupt impact on stock prices, irrespective of how the stock performed, previously. The proposed system uses stock market news and market statistics for decision making based on RL. The system advantage is the ability to have an agent that makes better decisions in stock market trading and considers volatility of the market due to market sentiments.
Sentiment analysis is the procedure of computationally distinguishing and classifying opinions conveyed in a piece of text, particularly to find out whether the writer's attitude towards a specific topic, or product is positive, negative, or neutral. It implies to the use of text analysis, natural language processing, biometrics, and computational linguistics to systematically identify, quantify, extract, and study effective states and subjective information. Open-source software tools and a range of paid and free sentiment analysis tools employ statistics, natural language processing, and machine learning techniques to automate sentiment analysis on large collections of text. An open-source sentiment analysis tool known as VADER (Valence Aware Dictionary and sentiment Reasoner) is used in this system. It is a rule-based and lexicon sentiment analysis tool that is precisely attuned to sentiments expressed in social media, and it works well on text from other domains. The VADER determines the sentiment score, whether positive or negative. The VADER system input is a piece of text, and the output is a positive score, a negative score, and a compound score. The positive score tells how much positive a piece of text is. Its value ranges from 0 to 1. The negative score tells how much negative a piece of text is. Its value ranges from 0 to 1. The compound score is a normalized score that ranges from −1 (too negative) to +1 (too positive).
Stock market news is a large amount of text from multiple sources, which has an unpredictable velocity on the Internet. Hence, it is required to have a sentiment analysis system that can analyze the text faster, as the timing for a decision is an essential aspect in stock market trading. The reason for choosing the VADER system for sentiment analysis in stock market news is its advantages [34], which are given below:
(1) It does not require any training data, but it is constructed from a generalizable, valence-based, human-curated gold standard sentiment lexicon.
(2) It works exceedingly well on the social media text, yet it readily generalizes to multiple domains. It does not severely suffer from a speed-performance trade-off.
(3) It is fast enough to be used online with streaming data.
3.2 Reinforcement Learning (RL)
The RL is an area of machine learning. It aims to take suitable actions to maximize reward in a particular situation. The components of an RL network are environment, agent, reward, and policy. The policy is the solution for the RL problem. Policy maps each state of the environment to a specific action.
Fig. 1 gives an overview of the RL technique. An RL agent cooperates with its environment in discrete periods. The agent obtains an observation (St) at every time (t), which predictably involves the reward (Rt). It subsequently selects an action from a set of existing actions, which is consequently forwarded to the environment that shifts to S(t+1), which is a new state. The reward R(t+1) related to the shift (At, St, S(t+1)) is defined. The purpose of an RL agent is to accumulate as much incentive as conceivable.
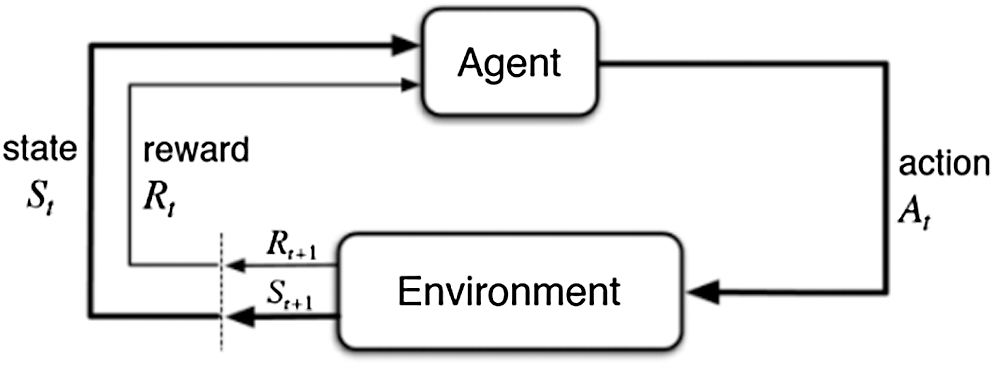
Figure 1: Reinforcement learning
The mathematical formulation of RL problems is called the Markov Decision Process (MDP), where the current state depends only on the previous state. The solution for an MDP is defined using policies. The policy is a set of actions that the agent takes to reach a goal [35]. It is denoted as
In Q-learning, we define a function,
Eq. (1) gives the Q-value function, and it represents the quality of a certain action in a given state, i.e., the best possible reward at the end of the game after performing action a on state s at time t, by following a policy
This equation is defined by the maximum future reward for this state (s). Action (a) is the immediate reward (r) plus a maximum future reward for the following state (s′).
The basic Q-learning algorithm is given below:
• Initialize Q (numstates, numactions) arbitrarily.
• Observe initial state s.
• Repeat.
• Select and carry out an action a.
• Observe reward r and new state
The Q-values of states and actions are initially random, and they converge after several iterations. The Q-value is updated accurately in each iteration. We use the concept of Q-learning by using a deep neural network and the experience replay algorithm, which uses an agent experience to update the Q-values. The training of the agents using this algorithm is explained in the next section.
4 Proposed System of RL with Sentiment Analysis
The proposed system trains an agent to decide to buy, sell or hold a stock, when given a state as input. Along with the statistical dimensions, the input vector also has a trend dimension, which results from the sentiment analysis of news regarding that specific stock on the corresponding date. The block diagram of the proposed system is shown in Fig. 2.
The proposed system contains two essential modules:
(a) Sentiment analysis module. This module takes the news of the stock for each day and converts them to a sentiment score.
(b) RL module. This module decides whether to buy, sell, or hold (do nothing) a stock given a state as input.
Stock data of a company from a stock API and news about stocks of that company constitute the system input.
The company stock data consists of fields: Open, Close, High, Low, and Volume of the stock. “High” refers to the highest price in the considered period. “Low” refers to the lowest price in the period considered. “Volume” refers to the number of shares traded in a given period. “Open” refers to the opening price in the period considered. “Close” refers to the closing price in the considered period. Here, the considered period is one day. Daily stock data of a company for 10 years is used as input. The stock data is pre-processed to find the missing values and to find moving averages.
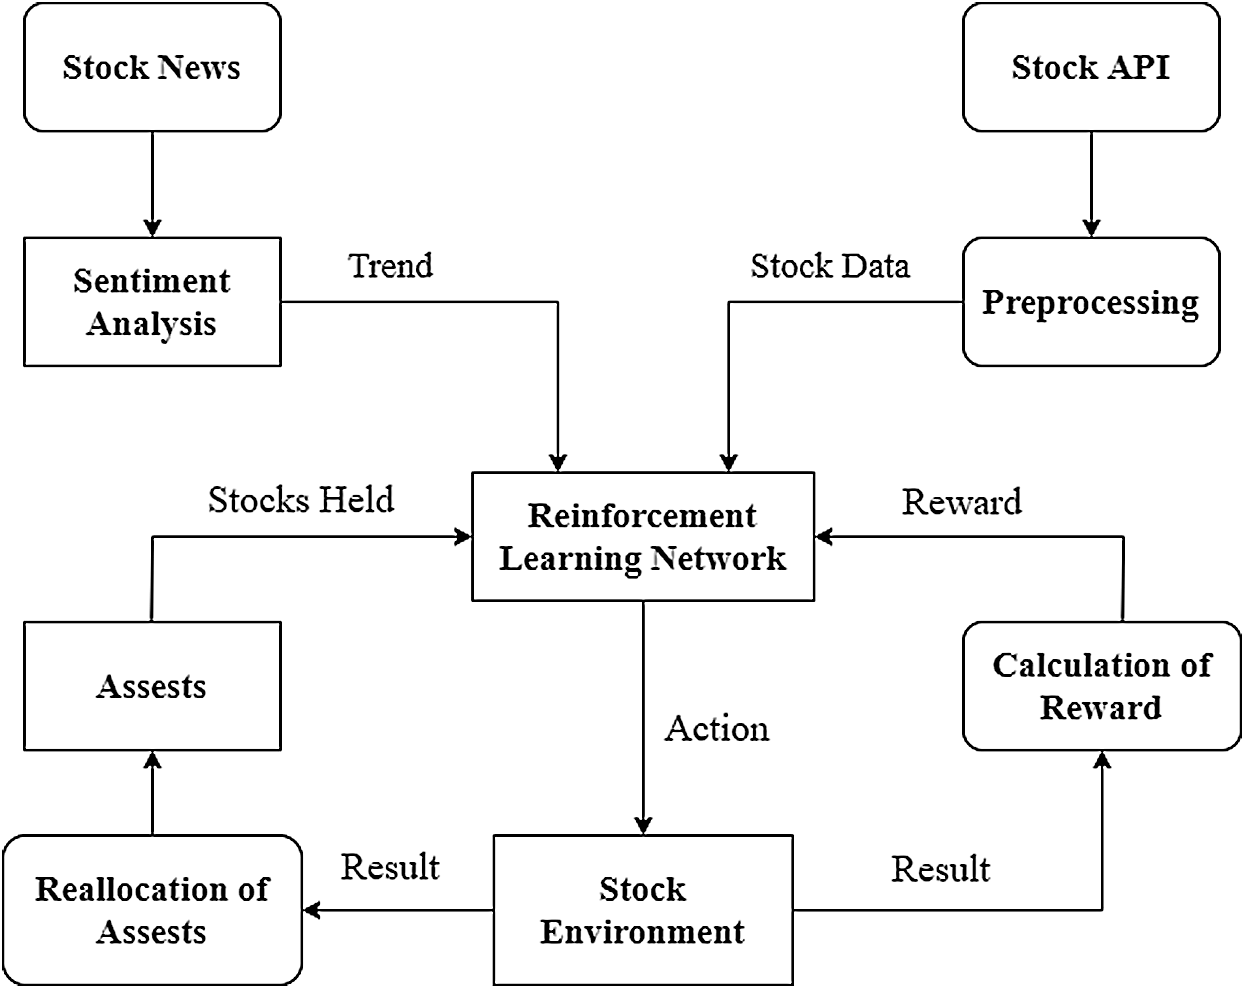
Figure 2: Proposed system
Stock news for a company is taken from a stock news API. The stock news is used to predict the trend of the stock movement for that company. A sentiment analysis model is used to model the impact of daily news on the stock market.
The input to the sentiment analysis module is the stock news. It can be either company-specific stock news or market-specific stock news. News undergoes initial pre-processing, where tokenization, removal of unnecessary symbols and lowercasing processes are performed. The processed input is passed to the VADER sentiment analysis tool. The VADER output is in the form of polarity score values that are positive score, negative score, and compound score. A positive score indicates how positive the piece of text is. A negative score indicates how negative the piece of text is. The compound score is a normalized score between −1 (too negative) and +1 (too positive). The compound score is used as an input to the RL module. The VADER implementation in the sentiment analysis module of the proposed system is shown in Fig. 3.
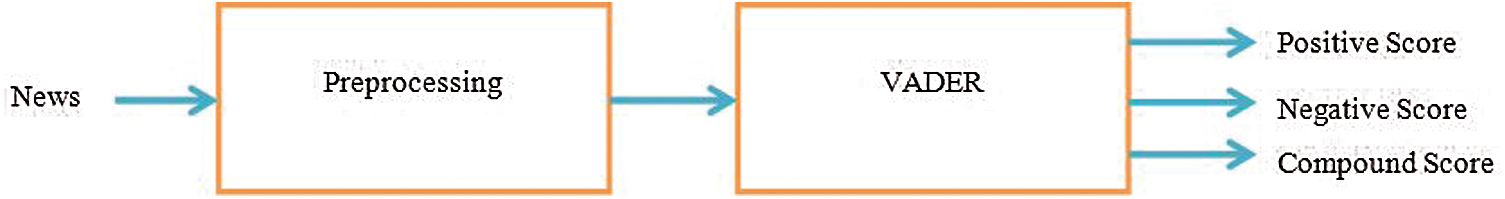
Figure 3: Sentiment analysis module
To formulate stock trading as an MDP and tackle it with RL, an RN network is constructed, consisting of:
(a) Environment: Stock data of a company.
(b) State: Stock information at a day, along with the sentiment score of the news on that corresponding day.
(c) Actions: Sell, Buy or Hold.
(d) Rewards: Rewards are feedback signals given back to an agent, when that agent takes an action. For each action, a positive reward is given when profit is made, and a negative reward is given when an agent action leads to loss.
A vital part of this module is a deep neural network containing an input layer, three fully-connected hidden layers, and an output layer. The input layer has a size corresponding to the size of the state. The output layer has 3 neurons corresponding to the actions Buy, Sell and Hold (Nothing). The Rectified Linear Unit (ReLU) is used as an activation function for hidden layers, and a linear activation function is used in the output layer.
The problem comes down to finding the optimal actions at each state of the environment to increase future rewards. We use a deep neural network and an experience replay algorithm to find the optimal action at each state.
The methodology for training of a stock market trading agent is given below. The agent starts with initial open cash and several stocks. Batch size is defined. A batch is the set of tuples, which contains State, Action, Reward, and Next Size. It is used in the experience replay function for updating the network. Discount factor
For each day in the dataset,
(1) The state is defined with stock opening price, 5-day moving average price of the stock, stocks held, cash held, and sentiment score of the previous day.
(2) Action is taken, giving the state as an input to the deep neural network.
(3) The reward is calculated according to the action taken using the price change percentage given by Eq. (3).
(4) Portfolio value is the net worth of the investor. It is calculated by Eq. (4).
(5) Assets (cash held and stocks held) are recalculated according to the action taken, and then the next state is defined.
(6) Tuple (State, Action, Reward, Next state) is added to the agent memory.
(7) If the agent memory is greater than the defined batch size, the experience replay function is called with the agent memory as input to update the deep neural network. The experience replay algorithm is given below.
4.6 Experience Replay Algorithm
This algorithm is used for updating the weights and biases of the deep neural network to optimize the Q-values of states and actions. Input to the algorithm is the agent memory that consists of the tuples, where each tuple consists of State, Action Taken, Reward, and Next State. A batch of tuples is selected from the agent memory.
For each tuple (State (s), Action (a), Reward (r), and Next State (s′)) in the batch:
(1) The Q-value of the action (a) for the current state is calculated using the Bellman equation.
(2) The Q-value of an Action (a) for State (s) is updated in the deep neural network.
(3) The above procedures (Steps 1 to 7) are continued for several episodes (iterations) to allow the Q-values of states and actions to converge. The neural model at the end of training is saved and used for testing. An overview of the RL module is shown in Fig. 4.
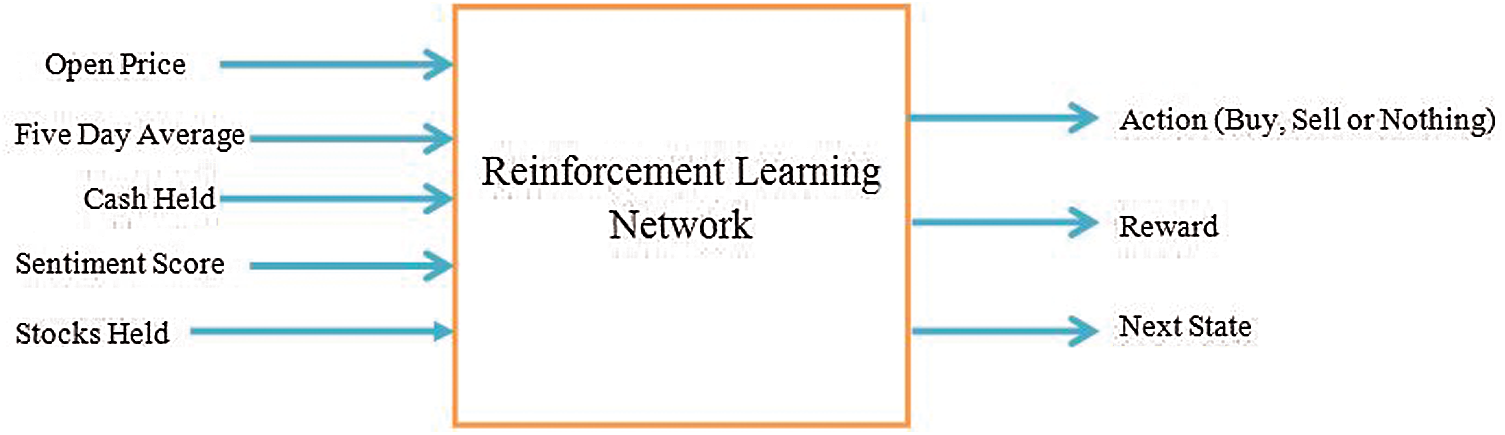
Figure 4: Reinforcement learning module
The input given to the RL module includes open price, five-day moving average, cash held, sentiment score, and stocks held. The outputs obtained from the module are Action, Reward, and Next State. The Action can be Buy, Sell or Hold (to do nothing). These outputs are used to update the deep neural network weights and biases to take optimal actions for states.
The initial dataset contains the stock information on each market day for Apple from 2006 to 2016 [36]. Each day stock information contains Date, Open Price (price of stock at the start of that day), Close Price (price of stock at the end of that day), High Price (highest price of stock in that day), Low Price (Lowest price of stock on that day), Adjusted Close Price, Volume (Number of stocks traded on that day), News (News about Apple and stock market news on that day).
The open price of Apple stock plotted against each market day is shown in Fig. 5. The X-axis represents the year, and the Y-axis represents the price in dollars. It is seen that there are rise and fall in stock prices across the years.
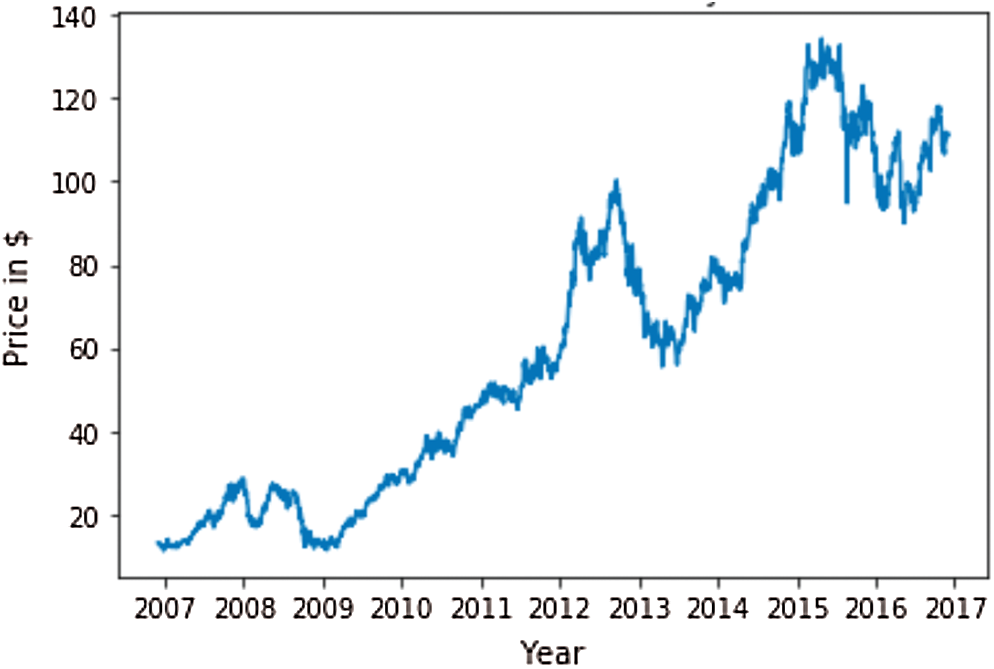
Figure 5: Price chart of Apple stock
This step aims to find the sentiment of news for each day. News for each day is pre-processed. Pre-processing step contains conversion of news to lowercase, and removal of stop words, lemmatization and unnecessary symbols.
Each day pre-processed news is converted into sentiment scores that have values ranging from −1 to + 1. VADER tool of Natural Language Toolkit (NLTK) is used for sentiment analysis. Input to the VADER tool is a piece of text news, and output is in the form of polarity scores that are positive, negative and compound scores. The positive score indicates how positive the piece of text is. The negative score indicates how negative the piece of text is. The compound score indicates the normalized score between −1 (too negative) and +1 (too positive). The compound score is used as an input to the RL module. News for each day in the initial dataset is replaced with a corresponding sentiment score.
5.3 Reinforcement Learning (RL)
The dataset after sentiment analysis is given as input to the RL module. The dataset is split into training and testing sets. The training dataset consists of 1500 rows and the testing dataset consists of 1000 rows. Three scenarios are considered for comparison with the proposed system.
(1) Benchmark model (emulation of manual trading).
(2) RL without sentiment input.
(3) RL with sentiment input.
These scenarios are compared in performance with the proposed system using a portfolio value at each time. The portfolio value is the investor net value of assets, which is given by adding cash and market value of stocks held by the investor.
5.4 Benchmark Model on Testing Dataset
This model is used for the emulation of manual trading. The model starts with an initial investment and buys a fixed number of stocks using that cash. The initial cash is $10000, the number of stocks brought is 33. The remaining cash after buying the stocks on the starting day is $7500. The model sells 10% of initial stocks held at fixed intervals. Portfolio values at each interval are calculated.
5.4.1 Training with RL Without Sentiment Input
The parameters used for training are:
(a) No. of episodes = 50.
(b) Batch size (for updating the model parameters) = 50.
(c) State size = 5.
(d) State = (open price, five-day moving average price, portfolio value, cash held, stocks held).
(e) Discount Factor = 0.995.
Training is performed on a training dataset with the given training parameters. All rows in the dataset are iterated for training for 50 episodes. Batch size is the number of tuples containing the State, Action, Reward, and Next State used for updating weights and biases of the model. The model is saved after training for the testing purpose.
5.4.2 Testing with RL Without Sentiment Input
The model generated from the training phase is used in the testing phase. The model starts with initial cash and buys a fixed number of stocks using that cash as in the benchmark model testing. The initial cash is $10000, and the number of stocks brought initially is 33. The remaining cash after buying the stocks on the starting day is $7500. The graph for the portfolio values is plotted and compared against that of the benchmark model.
The comparison graph of trading with the RL model and the benchmark model is illustrated in Fig. 6. The X-axis of the graph represents the days, and the Y-axis represents the portfolio value in dollars.
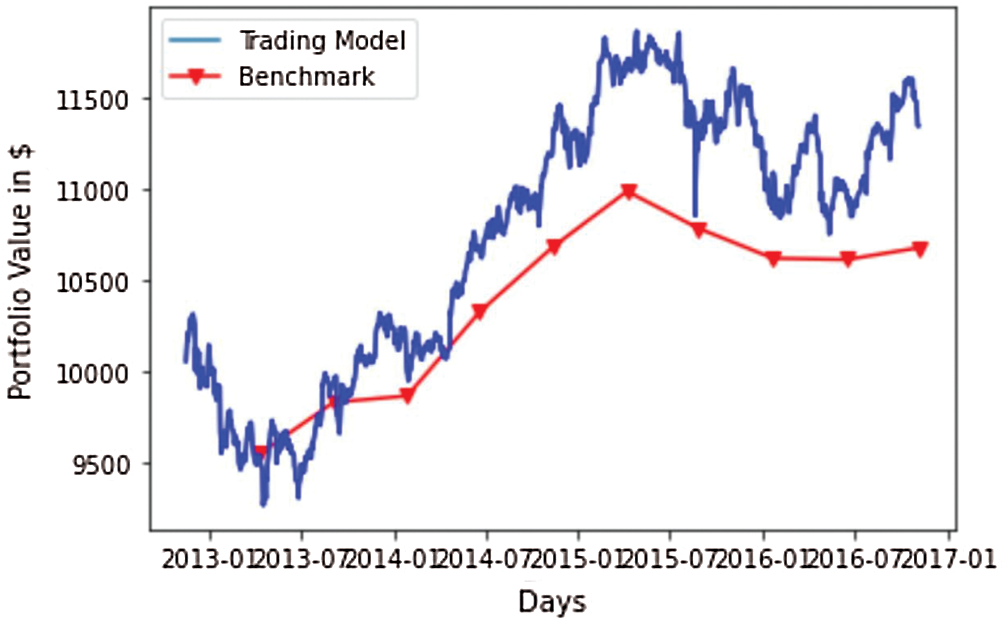
Figure 6: RL model vs. benchmark model
5.4.3 Training with RL with Sentiment Input
The parameters used for training are:
(a) No. of episodes = 50.
(b) Batch size (for updating the model parameters) = 50.
(c) State size = 6.
(d) State = (open price, five-day moving average price, portfolio value, cash held, stocks held, sentiment score).
(e) Discount factor = 0.995.
Training is performed on a training dataset with the given training parameters. All rows in the dataset are iterated for training for 50 episodes. Batch size is the number of tuples containing State, Action, Reward, and Next State used for updating weights and biases of the model. The model is saved after training for testing purposes.
5.4.4 Testing with RL with Sentiment Input
The model generated from the training phase is used in the testing phase. The model starts with an initial cash and a fixed number of stocks like the benchmark model. The portfolio value on each day is calculated. A graph for portfolio values is plotted and compared with that of the benchmark model. The comparison of trading with the benchmark model, the RL model without sentiment, and the RL model with sentiment is illustrated in Fig. 7. The X-axis of the graph represents the days and the Y-axis represents the portfolio value in dollars.
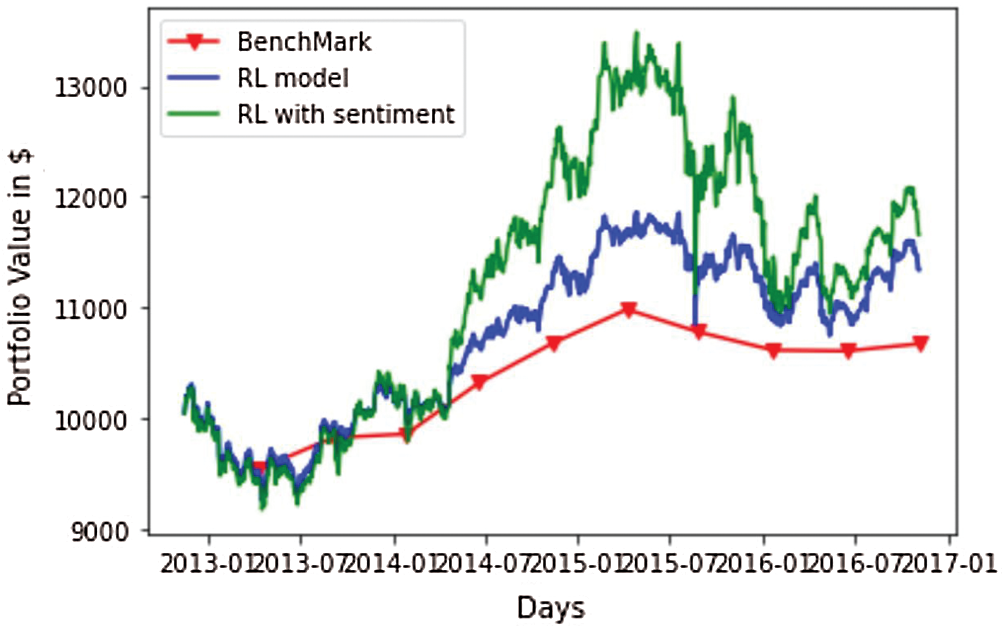
Figure 7: RL model with sentiment vs. RL model without sentiment and benchmark model
The three models start with a fixed amount of initial cash and a fixed number of trading stocks. From the plot of portfolio values generated for the three scenarios: benchmark, RL without sentiment input, and RL with sentiment input in Fig. 7, it can be seen that RL without sentiment generates more portfolio values than those of the benchmark model. It can also be seen that RL with sentiment as input generates more portfolio values than those of RL without sentiment. It can be inferred that the agent on stock market trading makes better decisions and makes more profits with the sentiment as input along with statistics n.
6 Conclusions and Future Works
Forecasting the stock market conditions as well as predicting the stock price has always been a challenging task. Different techniques can be used to predict stock prices and make appropriate decisions. Naive approaches, deep learning techniques, and RL techniques have been studied for stock market forecasting. The RL is an efficient technique for making automated decisions in stock market, but it needs high-end processors for efficient real-time performance. The proposed system depends on RL along with market sentiment for decision making. The results show that the inclusion of the sentiment helps in making better decisions than those of trading based on statistics only.
The proposed system works for a single stock (company). In the future work, the proposed system could be extended to in the case of multiple stocks. Segregation of news for different stocks should be performed, and sentiment analysis should be implemented in a distributed manner. A serious challenge is the detection of fake news for more efficient performance. The proposed system can be extended to intra-day trading with real-time sentiment analysis of news.
Acknowledgement: The authors would like to thank the support of the Deanship of Scientific Research at Princess Nourah Bint Abdulrahman University.
Funding Statement: This research was funded by the Deanship of Scientific Research at Princess Nourah Bint Abdulrahman University through the Fast-track Research Funding Program.
Conflicts of Interest: The authors declare that they have no conflicts of interest to report regarding the present study.
1. I. E. Diakoulakis, D. E. Koulouriotis and D. M. Emiris, “A review of stock market prediction using computational methods,” in Computational Methods in Decision-Making, Economics and Finance, Springer, Boston, MA, pp. 379–403, 2002. [Google Scholar]
2. “The stock markets,” 2014. [Online]. Available: https://zerodha.com/varsity/chapter/the-stock-markets/. [Google Scholar]
3. N. Naik and B. R. Mohan, “Optimal feature selection of technical indicator and stock prediction using machine learning technique,” in Proc. Int. Conf. on Emerging Technologies in Computer Engineering, Springer, Singapore, pp. 261–268, 2019. [Google Scholar]
4. J. B. Heaton, N. G. Polson and J. H. Witte, “Deep learning for finance: Deep portfolios,” Applied Stochastic Models in Business and Industry, vol. 33, no. 1, pp. 3–12, 2017. [Google Scholar]
5. R. Gonçalves, V. M. Ribeiro, F. L. Pereira and A. P. Rocha, “Deep learning in exchange markets,” Information Economics and Policy, vol. 47, pp. 38–51, 2019. [Google Scholar]
6. V. Mnih, K. Kavukcuoglu, D. Silver, A. A. Rusu, J. Veness et al., “Human-level control through deep reinforcement learning,” Nature, vol. 518, no. 7540, pp. 529–533, 2015. [Google Scholar]
7. A. A. Ariyo, A. O. Adewumi and C. K. Ayo, “Stock price prediction using the ARIMA model,” in Proc. IEEE UKSim-AMSS 16th Int. Conf. on Computer Modelling and Simulation, Cambridge, UK, pp. 106–112, 2014. [Google Scholar]
8. K. J. Lee, A. Y. Chi, S. Yoo and J. J. Jin, “Forecasting Korean stock price index (kospi) using back propagation neural network model, Bayesian chiao's model, and sarima model,” Journal of Management Information and Decision Sciences, vol. 11, no. 2, pp. 1–10, 2008. [Google Scholar]
9. E. Chong, C. Han and F. C. Park, “Deep learning networks for stock market analysis and prediction: Methodology, data representations, and case studies,” Expert Systems with Applications, vol. 83, pp. 187–205, 2017. [Google Scholar]
10. A. A. Bhat and S. S. Kamath, “Automated stock price prediction and trading framework for nifty intraday trading,” in Proc. IEEE Fourth Int. Conf. on Computing, Communications and Networking Technologies, Tiruchengode, India, pp. 1–6, 2013. [Google Scholar]
11. G. P. Zhang, “Time series forecasting using a hybrid ARIMA and neural network model,” Neurocomputing, vol. 50, pp. 159–175, 2003. [Google Scholar]
12. S. Chen and H. He, “Stock prediction using convolutional neural network,” IOP Conf. Series: Materials Science and Engineering, vol. 435, no. 1, pp. 12026, 2018. [Google Scholar]
13. E. Guresen, G. Kayakutlu and T. U. Daim, “Using artificial neural network models in stock market index prediction,” Expert Systems with Applications, vol. 38, no. 8, pp. 10389–10397, 2011. [Google Scholar]
14. W. Wang, D. Okunbor and F. C. Lin, “Future trend of the shanghai stock market,” in Proc. IEEE 9th Int. Conf. on Neural Information Processing, Singapore, pp. 2320–2324, 2002. [Google Scholar]
15. W. Long, Z. Lu and L. Cui, “Deep learning-based feature engineering for stock price movement prediction,” Knowledge-Based Systems, vol. 164, pp. 163–173, 2019. [Google Scholar]
16. A. Nayak, M. M. Pai and R. M. Pai, “Prediction models for Indian stock market,” Proc. Computer Science, vol. 89, pp. 441–449, 2016. [Google Scholar]
17. M. Vijh, D. Chandola, V. A. Tikkiwal and A. Kumar, “Stock closing price prediction using machine learning techniques,” Proc. Computer Science, vol. 167, pp. 599–606, 2020. [Google Scholar]
18. M. Hiransha, E. A. Gopalakrishnan, V. K. Menon andK. P. Soman, “NSE stock market prediction using deep-learning models,” Proc. Computer Science, vol. 132, pp. 1351–1362, 2018. [Google Scholar]
19. Y. Chen and Y. Hao, “A feature weighted support vector machine and K-nearest neighbor algorithm for stock market indices prediction,” Expert Systems with Applications, vol. 80, pp. 340–355, 2017. [Google Scholar]
20. W. Khan, M. A. Ghazanfar, M. A. Azam, A. Karami, K. H. Alyoubi et al., “Stock market prediction using machine learning classifiers and social media, news,” Journal of Ambient Intelligence and Humanized Computing, vol. 5, pp. 1–24, 2020. [Google Scholar]
21. M. Jena, R. K. Behera and S. K. Rath, “Machine learning models for stock prediction using real-time streaming data,” in Proc. Int. Conf. on Biologically Inspired Techniques in Many-Criteria Decision Making, Springer, Cham, pp. 101–108, 2019. [Google Scholar]
22. S. Chen and H. He, “Stock prediction using convolutional neural network,” in Proc. IOP Conf. Series: Materials Science and Engineering,” vol. 435, no. 1, pp. 12026, 2018. [Google Scholar]
23. D. K. Mohanty, A. K. Parida and S. S. Khuntia, “Financial market prediction under deep learning framework using auto encoder and kernel extreme learning machine,” Applied Soft Computing, vol. 99, pp. 1–14, 2020. [Google Scholar]
24. A. Nan, A. Perumal and O. R. Zaiane, “Sentiment and knowledge based algorithmic trading with deep reinforcement learning,” ArXiv e-Prints, pp. 1–13, 2020. [Google Scholar]
25. I. K. Nti, A. F. Adekoya and B. A. Weyori, “A novel multi-source information-fusion predictive framework based on deep neural networks for accuracy enhancement in stock market prediction,” Journal of Big Data, vol. 8, no. 17, pp. 1–28, 2021. [Google Scholar]
26. Y. Ma, R. Han and W. Wang, “Portfolio optimization with return prediction using deep learning and machine learning,” Expert Systems with Applications, vol. 165, pp. 1–15, 2021. [Google Scholar]
27. S. Carta, A. Corriga, A. Ferreira, A. S. Podda and D. R. Recupero, “A multi-layer and multi-ensemble stock trader using deep learning and deep reinforcement learning,” Applied Intelligence, vol. 51, no. 2, pp. 889–905, 2021. [Google Scholar]
28. E. Hoseinzade and S. Haratizadeh, “CNNpred: CNN-based stock market prediction using a diverse set of variables,” Expert Systems with Applications, vol. 129, pp. 273–285, 2019. [Google Scholar]
29. Y. Deng, F. Bao, Y. Kong, Z. Ren and Q. Dai, “Deep direct reinforcement learning for financial signal representation and trading,” IEEE Transactions on Neural Networks and Learning Systems, vol. 28, no. 3, pp. 653–664, 2016. [Google Scholar]
30. R. Ramezanian, A. Peymanfar and S. B. Ebrahimi, “An integrated framework of genetic network programming and multi-layer perceptron neural network for prediction of daily stock return: An application in Tehran stock exchange market,” Applied Soft Computing, vol. 82, pp. 105551, 2019. [Google Scholar]
31. X. Du, J. Zhai and K. Lv, “Algorithm trading using q-learning and recurrent reinforcement learning,” Positions, vol. 1, pp. 1–7, 2016. [Google Scholar]
32. G. Jeong and H. Y. Kim, “Improving financial trading decisions using deep Q-learning: Predicting the number of shares, action strategies, and transfer learning,” Expert Systems with Applications, vol. 117, pp. 125–138, 2019. [Google Scholar]
33. J. W. Lee, J. Park, O. Jangmin, J. Lee and E. Hong, “A multiagent approach to Q-learning for daily stock trading,” IEEE Transactions on Systems, Man, and Cybernetics-Part a: Systems and Humans, vol. 37, no. 6, pp. 864–877, 2007. [Google Scholar]
34. C. J. Hutto and E. Gilbert, “Vader: aparsimonious rule-based model for sentiment analysis of social media text,” in Proc. Eighth Int. AAAI Conf. on Weblogs and Social Media, Michigan, USA, pp. 216–225, 2014. [Google Scholar]
35. “Reinforcement learning demystified: Agentle introduction,” 2018. [Online]. Available: https://towardsdatascience.com/reinforcement-learningdemystified-markov-decision-processes-part-1. [Google Scholar]
36. “Impact of news on the share closing value,” 2018. [Online]. Available: https://www.kaggle.com/BidecInnovations/stock-price-and-news-realted-to-it. [Google Scholar]
 | This work is licensed under a Creative Commons Attribution 4.0 International License, which permits unrestricted use, distribution, and reproduction in any medium, provided the original work is properly cited. |