DOI:10.32604/cmc.2022.017178
| Computers, Materials & Continua DOI:10.32604/cmc.2022.017178 | |
| Article |
Optimized Convolutional Neural Network for Automatic Detection of COVID-19
1Department of Information Technology, PSNA College of Engineering and Technology, Dindigul, 624622, Tamilnadu, India
2Department of Computer Science & Engineering, PSNA College of Engineering and Technology, Dindigul, 624622, India
3School of Computing, SASTRA Deemed University, Thanjavur, 613401, India
4Univ. Artois, U. R. 3926, Laboratoire de Génie Informatique et d’Automatique de l’Artois (LGI2A), F-62400, Béthune, France
5Department of Mathematics, Faculty of Science, New Valley University, El-Kharga, 72511, Egypt
*Corresponding Author: Adnen El Amraoui. Email: adnen.elamraoui@univ-artois.fr
Received: 23 January 2021; Accepted: 24 April 2021
Abstract: The outbreak of COVID-19 affected global nations and is posing serious challenges to healthcare systems across the globe. Radiologists use X-Rays or Computed Tomography (CT) images to confirm the presence of COVID-19. So, image processing techniques play an important role in diagnostic procedures and it helps the healthcare professionals during critical times. The current research work introduces Multi-objective Black Widow Optimization (MBWO)-based Convolutional Neural Network i.e., MBWO-CNN technique for diagnosis and classification of COVID-19. MBWO-CNN model involves four steps such as preprocessing, feature extraction, parameter tuning, and classification. In the beginning, the input images undergo preprocessing followed by CNN-based feature extraction. Then, Multi-objective Black Widow Optimization (MBWO) technique is applied to fine tune the hyperparameters of CNN. Finally, Extreme Learning Machine with autoencoder (ELM-AE) is applied as a classifier to confirm the presence of COVID-19 and classify the disease under different class labels. The proposed MBWO-CNN model was validated experimentally and the results obtained were compared with the results achieved by existing techniques. The experimental results ensured the superior results of the ELM-AE model by attaining maximum classification performance with the accuracy of 96.43%. The effectiveness of the technique is proved through promising results and the model can be applied in diagnosis and classification of COVID-19.
Keywords: COVID-19; classification; CNN; hyperparameter tuning; black widow optimization
The outbreak of a novel coronavirus (nCoV) (officially named as ‘SARS-CoV2’) was first identified by the researchers in Wuhan, China by December 2019. Later, this virus was found to be a causative agent of COVID-19, a contagious life-threatening disease. Though its outbreak was first reported in China, it quickly travelled to global nations from January 2020 itself [1]. World Health Organization (WHO) officially named this disease as ‘coronavirus disease’ (COVID-19) in February 2020 and categorized it as ‘pandemic’. Healthcare system in India and many other nations across the globe experienced enormous pressure in treating their patients. Further, the disease also collapsed the economic growth of numerous nations. With 1.58 million positive cases and 34,968 confirmed deaths by the end of July 2020, India is one among the badly-hit countries for this disease. Few common symptoms of COVID-19 are high fever, dry cough, constipation, headache, loss of sense and taste, breathlessness and so on. To reduce the high mortality rate of this disease, it is important to predict or diagnose the disease at very early stages. Further, coronavirus (COVID-19) positive patients have to be quarantined for a certain period of time. This separation or quarantine is highly subjective in developing countries like India due to limited availability of medical facilities that can handle COVID-19 patients. In this scenario, the Chinese government has stated that Real-Time Polymerase Chain Reaction (RT-PCR) can be used to confirm the presence of COVID-19 [2]. RT-PCR is not only a time-consuming procedure, but it also produces severe false-negative rates too at times, which complicates the prognosis.
At few instances, virus-affected individuals produce negative results which mostly ends up in increased fatality rate. Virus-affected individuals spread the virus unknowingly to other people who are healthy and normal, since COVID-19 is an extremely communicable disease. The medical reports of infected people especially chest Computed Tomography (CT) scan images confirm the occurrence of bilateral modification. Thus, chest CT, a highly sensitive technique, is applied as a secondary confirmation in disease prediction and diagnosis of SARS-CoV2. It becomes mandatory for a radiologist to examine these chest CT images obtained from infected individuals. In this scenario, the development of a Deep Learning (DL)-based detection technique becomes inevitable to examine the chest CT scan images without the help of a radiologist.
Artificial Intelligence (AI) is one of the advanced technologies that has been extensively applied in the acceleration of biomedical applications. Under the application of DL frameworks, AI is employed in several domains such as image analysis, data categorization and image segregation and so on. Individuals, infected with COVID-19, suffers from pneumonia since the virus first attacks the respiratory tract and then enters the lungs gradually. Many DL works have been conducted so far with the help of chest X-ray image data model. Previously, a number of studies leveraged pneumonia X-ray images using three diverse DL methodologies like fine-tuned technique, technique with no fine-tuning, and technique trained from scrap. With respect to ResNet approach, the dataset is first classified under several labels such as age, gender, etc., Then, Multi-Layer Perceptron (MLP) is applied as a classifier since it produces the highest accuracy.
A classification model was proposed in the literature [3] which used pneumonia data to segregate the images. The study made use of SVM classifier, InceptionV3 and VGG-16 methodologies as DL frameworks. Backpropagation Neural Network (BPNN) as well as Competitive Neural Network approaches were employed in the literature [4] to classify the pneumonia data. With the application of pneumonia and healthy chest X-ray images, the maximum number of datasets were declared as sample data and the presented model was compared with previous CNNs. Finally, a better classification result was achieved by the proposed method.
A DL approach was introduced in the study conducted earlier [5] to classify pneumonia data collected from scratch and this data was used for training purpose. The proposed model had a convolutional layer, dense block as well as a flatten layer. In this study, the input size was 200 × 200 pixels to determine the probabilities of classification using sigmoid function. The study accomplished the maximum classification rate for pneumonia from X-ray images. In one of the studies conducted earlier [6], DL methods were developed under three categories of image datasets namely, normal, viral pneumonia, and bacterial pneumonia. Initially, the images were pre-processed to remove the noise. Followed by, augmentation scheme was employed for all images and a transfer learning technique was applied to train all the approaches. Finally, optimal accuracy was attained.
In recent times, developers have presented an imaging pattern of chest CT scan to predict COVID-19 [7]. COVID-19 can be diagnosed on the basis of recent travel information and their signs and symptoms. The study [8] reported high sensitivity of chest CT scan in predicting COVID-19 compared to RT-PCR. Berheim et al. [9] investigated chest CT images of 121 patients from four different regions of China and confirmed the presence of disease. In general, DL method is widely employed in the prediction of acute pneumonia. Li et al. [10] deployed a DL approach called ‘COVNet’ to extract visual features from chest CT for predicting COVID-19. This method also used visual features to distinguish community-obtained pneumonia and alternate non-pneumonia based lung infections. Gozes et al. [11] implied an AI-relied CT analysis model to predict and quantify the viral load in COVID-19. The network automatically obtained an opacity portion in the lungs. Consequently, the method achieved the highest sensitivity and specificity values. Further, the system remained efficient over pixel spacing as well as slice thickness.
Shan et al. [12] deployed a DL-dependent network (VB-net) for automated segmentation of lung disease regions under the application of chest CT scan. Xu et al. [13] proposed a detection approach to differentiate COVID-19 pneumonia and influenza, a viral pneumonia, using DL models. In this research, CNN model was applied for prediction. Wang et al. [14] examined the radiological alterations present in the CT images of patients. A DL-relied prediction approach was applied with altered inception transfer learning framework. Few features were filtered from CT images for advanced analysis. Though the accuracy attained was better than Xu’s approach, this is a time-consuming method for disease analysis.
Narin et al. [15] projected an automated CNN transfer learning method to detect COVID-19. The study found that highest accuracy was achieved by ResNet50 model. Sethy et al. [16] proposed a DL approach to predict COVID-19 from X-ray images. The image was first filtered for deep features and then sent to SVM for classification. Maximum accuracy was accomplished in the implemented approach. From an extended review, it can be confirmed that the image processing techniques can be applied upon chest CT scan images prior to the categorization of COVID-19 affected patients.
The current research article proposes a new COVID-19 diagnosis and classification model using multi-objective Black Widow Optimization-based Convolutional Neural Network (MBWO-CNN). The proposed MBWO-CNN model detects and classifies COVID-19 through image processing technique. The technique has four steps such as preprocessing, feature extraction, parameter tuning, and classification. Initially, the input images undergo preprocessing followed by CNN-based feature extraction. Then, multi-objective Black Widow Optimization (MBWO) algorithm is implemented to tune the hyperparameters of CNN. The application of MBWO algorithm helps in improving the performance of CNN. Finally, Extreme Learning Machine with Autoencoder (ELM-AE) is applied as a classifier to detect the presence of COVID-19 and categorize it under different class labels. The proposed MBWO-CNN model was experimentally validated in this study and the results obtained were compared with existing techniques.
Fig. 1 shows the working procedure of MBWO-CNN technique. First, the input image is preprocessed during when the image is resized into a fixed size along with class labeling. Then, feature extraction is executed for the preprocessed image. The hyperparameter tuning process helps in the selection of initial hyperparameters of CNN model. Finally, the feature vectors are classified and the images are categorized into corresponding class labels as either COVID or non-COVID.
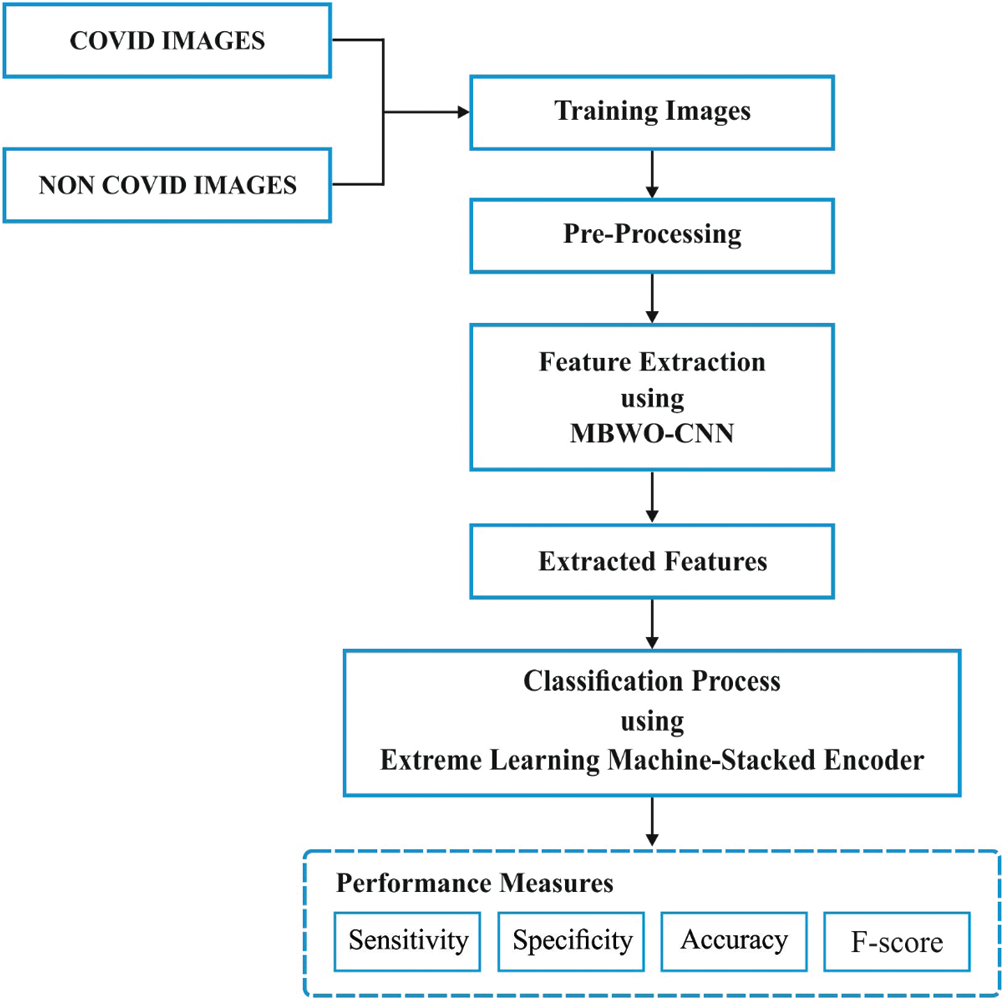
Figure 1: Block diagram of the proposed MBWO-CNN model
Once the input image is preprocessed, feature extraction is carried out using MBWO-CNN model. The application of MBWO algorithm helps in the selection of initial hyperparameters of CNN.
2.1.1 Convolutional Neural Network
CNN is a subfield of DL model which implies the maximum breakthrough from image analysis. CNN is predominantly applied in the examination of visual images during image classification process. Both hierarchical infrastructure as well as effective feature extraction of an image makes CNN, the most preferred and dynamic approach for image categorization. Initially, the layers are arranged in 3D format.
The neurons in the applied layer are not designated as the complete collection of neurons in the secondary layer. In other words, a minimum number of neurons is available in the secondary layer too. Consequently, the result gets degraded as a single vector of possible values, which are incorporated together in the dimension of depth. Fig. 2 shows both training and testing approaches of DCNN in the classification of COVID-19. The figure shows that CNN classification model applies diverse layers to develop a method and tests its function. To categorize the patients as either infected with COVID-19 or not, the properties of chest CT images are tested in an accurate manner. COVID-19 disease categorization, based on chest CT image, is performed to identify the duplicate classifications and process the images. To classify COVID-19 affected patients with the help of CNN approach, the steps given herewith are followed.
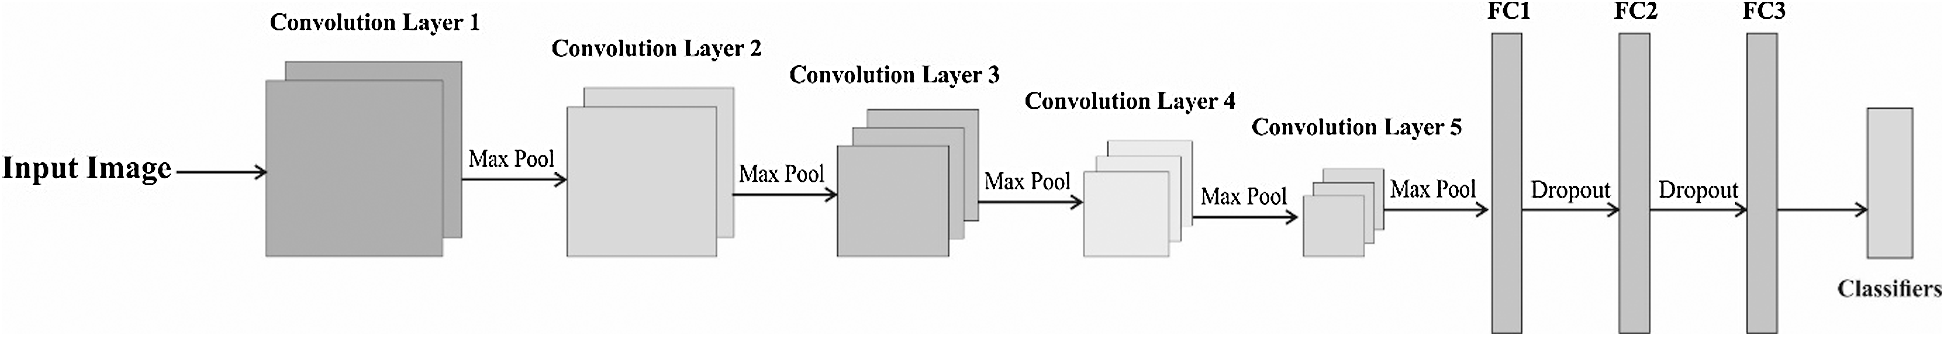
Figure 2: Structure of CNN
CNNs are composed of input, output, and hidden layers. Usually, the hidden layers are comprised of convolution, ReLU, pooling, as well as Fully Connected (FC) layers.
• Convolution layer uses convolution task for input. It sends the data to consecutive layer
• Pooling layer concatenates the results of clusters with a neuron present in subsequent layer
• FC layers link all the neurons as a single layer, with other neurons present in the subsequent layer. In case of FC layer, the neurons obtain the input from all the elements of existing layer
CNN functions on the basis of obtaining features from the images. There is no need to perform manual feature extraction. Hence, the features remain unequipped and it gains knowledge at the time of network training with a collection of images. Training process makes the DL model highly effective in computer vision operations. CNNs perform feature prediction with the help of massive number of hidden layers. The layer enhances the difficulty of learned features [17,18].
2.1.2 Multi-Objective Fitness Function
According to the literature, CNN gains experience from hyperparameter tuning problems. The hyperparameters are kernel size, padding, kernel type, hidden layer, stride, activation functions, learning value, momentum, epoch count, and batch size. These variables should be tuned. Here, multi-objective Fitness Function (FF) is expressed as follows.
where,
Here,
Here,
Fig. 3 shows the flowchart of BWO algorithm. Evolutionary Algorithm (EA) performs alike the projected approach based on the initial location of spiders. In that method, all the spiders arrive at a capable solution. The initial spiders make an attempt to produce a new generation. Female black widow consumes the male, once the mating is over. When the eggs are laid, spiderlings come out of the egg sacs [20]. It cohabits on maternal web for few days, sometimes a week too. During this period, sibling cannibalism is observed.
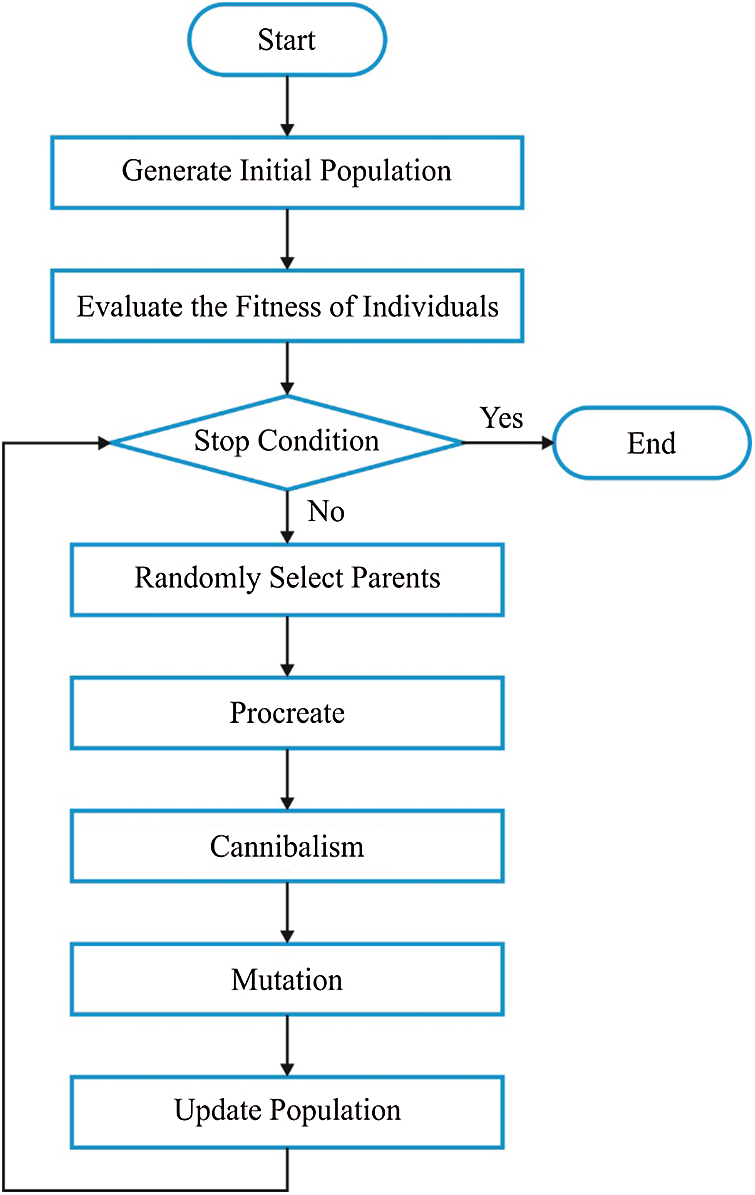
Figure 3: Flowchart of BMO algorithm
(i) Initial Population
Optimization issue can be resolved using the measures of problem scores, which develop a proper architecture for the solution developed from a recent problem. In GA and PSO methodologies, the structure is termed as ‘Chromosome’ and ‘Particle position’ correspondingly. However, in BWO, it is termed as ‘widow’. At this point, a capable solution is assumed for all the problems in the form of a black widow spider. These black widow spiders depict the measures of problem variables. Further, to resolve the standard functions, the infrastructure is demonstrated as an array.
For
The variable measures
In order to invoke the optimization method, a candidate widow matrix of size
(ii) Procreate
As pairs are autonomous in nature, it begins to mate and gives birth to next generation. Mating process occurs in the web. An approximate of 1,000 eggs is laid during every mating. Some of the spiderlings die due to different reasons, while the healthy one stays alive. For reproduction, an array named ‘alpha’ is developed. This is to ensure that the widow array is generated using arbitrary values of the offsprings, under the application of
It is followed for
(iii) Cannibalism
There are three types of cannibalism reported so far. Sexual cannibalism, where a female BW consumes the male after mating. Here, both female and male are examined via fitness measures. Secondly, sibling cannibalism occurs during when a healthy spiderling eats the vulnerable ones. Here, Cannibalism Rating (CR) is fixed according to the number of survivors. In third type, the baby spiders prey on the mother. The fitness measures are applied to identify weak and strong spider lings.
(iv) Mutation
In this process, the mutation value of the individuals are randomly selected to develop a population. The selected solutions are randomly interchanged in the array. It is estimated using a mutation rate.
(v) Convergence
Similar to EAs, the author assume three termination criteria such as predetermined values of iterations, observance of modifications in fitness measures of an optimal widow during different iterations and accomplishment of accuracy up to certain level.
(vi) Parameter Setting
The deployed BWO model is composed of few attributes such as Procreating Rate (PP), CR, and Mutation Rate (PM) to attain the best outcomes. The variable has to be modified to enhance the efficiency of this method and eventually, supreme solutions can be attained. At the time of fine tuning the parameters, the chances are high for moving from local optima to higher ability and finding the searching area globally. Therefore, the exact number of attributes assure that the management is effective between exploitation and exploration phases. The developed approach is composed of three significant controlling attributes such as PP, CR, and PM. Here, PP denotes the procreating ratio that calculates the number of individuals to be involved in procreation [19]. PP is controlled through the production of diverse offspring with additional diversification. The maximum number of chances is offered to find the search space accurately. CR is defined as a controlling attribute of cannibalism that eliminates improper individuals from the population. When appropriate measures of this parameter are changed, it assures the maximum function for exploitation process, by transmitting the search agents from local to global level. PM denotes the percentage of individuals that participate in mutation. The right value for this attribute lies between exploitation and exploration phases. It has the potential to effectively manage the transformation of search agents from global stage to local ones and boost them to attain the optimal solutions.
2.2 ELM-SA Based Classification
The current research article considered ELM-SA for classification. It applies the obtained features and estimates the possibility of objects present in an image. Both activation function as well as dropout layer are employed in the establishment of non-linearity and reduction of over-fitting issues correspondingly [21]. ELM is defined as a Single hidden Layer Feed-forward Neural network (SLFN) in which the hidden layer is non-linear, since non-linear activation function is present in it. In other terms, the output layer is linear with no activation function. It is composed of three layers namely, input layer, hidden layer, and output layer. Assume that
where
where
where
where
Followed by,
where
ELM is upgraded as Kernel-based ELM (KELM) through kernel trick. Suppose
Where
Here,
where
Fig. 4 shows a brief architecture of ELM-AE technique. It showcases the features according to singular measures. MELM is defined as a Multilayer Neural Network (MNN) in which various ELM-AEs are stacked together.
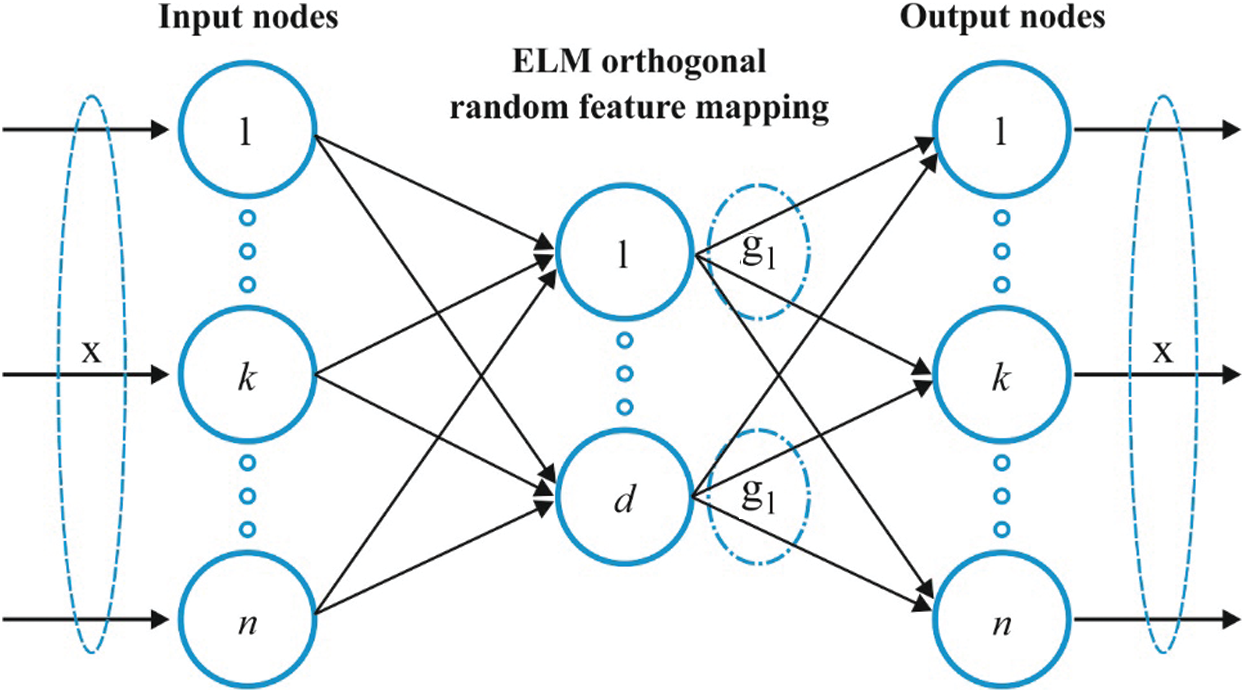
Figure 4: Structure of ELM-AE model
Assume
where
Besides,
where
This section discusses the classifier results achieved by MBWO-CNN model in the classification of chest X-Ray image [22] dataset. The dataset comprises of a number of chest X-ray images from both COVID-19 patients and Non-COVID patients. The number of images under COVID-19 is 220 and the number of images under normal class is 27. Fig. 5 shows some of the test images used in the study.
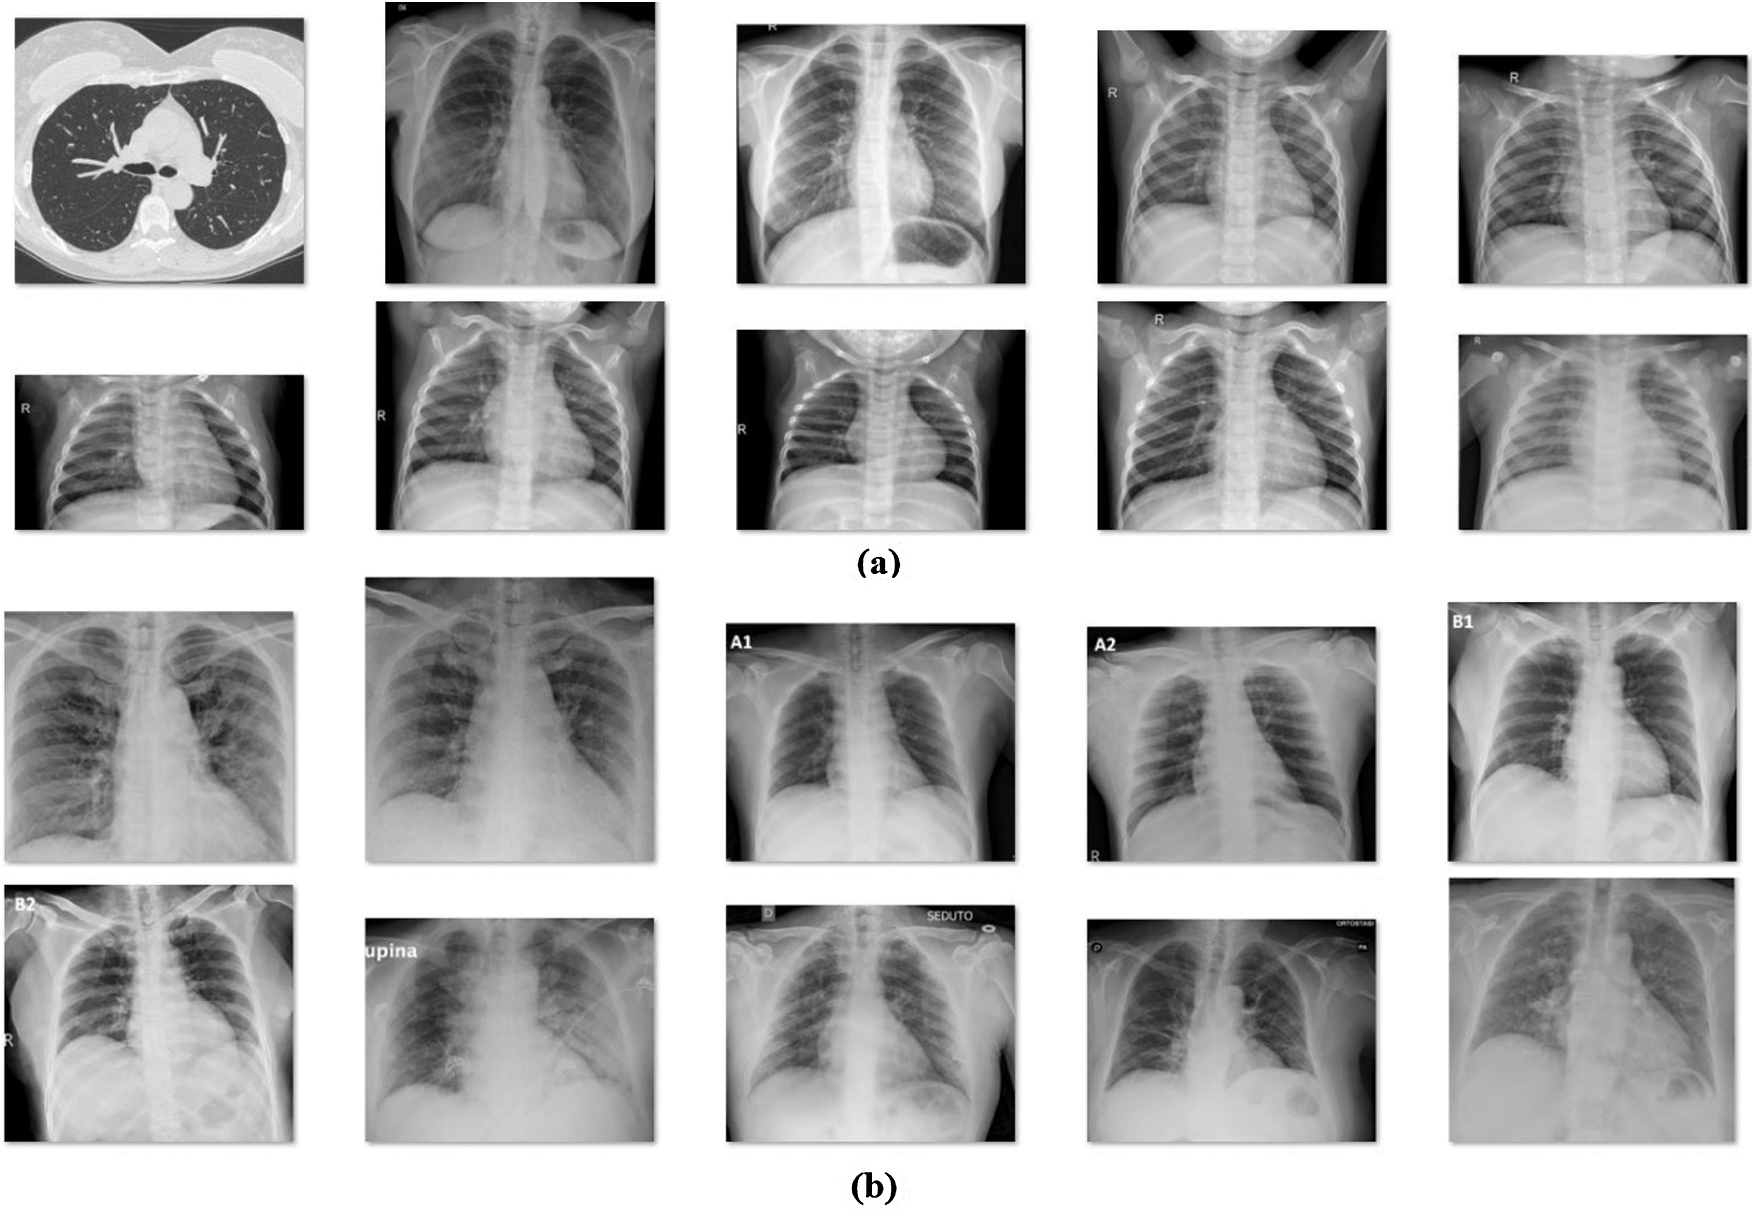
Figure 5: (a) Normal (b) COVID-19
Tab. 1 and Figs. 6–7 show the results of classifier analysis attained by MBWO-CNN model in terms of different measures and different number of runs. Under execution run 1, the MBWO-CNN model attained the maximum sensitivity of 95.10%, specificity of 94.68%, accuracy of 96.78% and F-score of 95.90%. Similarly, upon execution of run 2, the MBWO-CNN model achieved the maximum sensitivity of 95.16%, specificity of 97.12%, accuracy of 96.22%, and F-score of 95.65%. In line with this, when executing run 3, the MBWO-CNN model demonstrated the maximum sensitivity of 95.18%, specificity of 96.87%, accuracy of 96.90% and F-score of 96.32%. At the same time, upon execution of run 4, the MBWO-CNN model exhibited the maximum sensitivity of 96.20%, specificity of 95.90%, accuracy of 96.43%, and F-score of 97.45%.
On the other hand, when executing run 5, the MBWO-CNN model reported the maximum sensitivity of 95.47%, specificity of 95.80%, accuracy of 95.76%, and F-score of 96.10%. Likewise, under execution run 6, the MBWO-CNN model attained the maximum sensitivity of 97.32%, specificity of 96.43%, accuracy of 95.98% and F-score of 97.89%. The proposed MBWO-CNN model accomplished the maximum sensitivity of 95.32%, specificity of 96.21%, accuracy of 96.44%, and F-score of 96.55% under the execution of run 7. For execution of run 8, the MBWO-CNN model offered the maximum sensitivity of 96.32%, specificity of 95.93%, accuracy of 96.09%, and F-score of 97.30%. The maximum sensitivity of 95.78%, specificity of 96.90%, accuracy of 97.29% and F-score of 96.51% were achieved by the proposed model during the execution of run 9. Simultaneously, on the execution run of 10, the MBWO-CNN model yielded the maximum sensitivity of 95.84%, specificity of 95.66%, accuracy of 96.43%, and F-score of 97.10%.
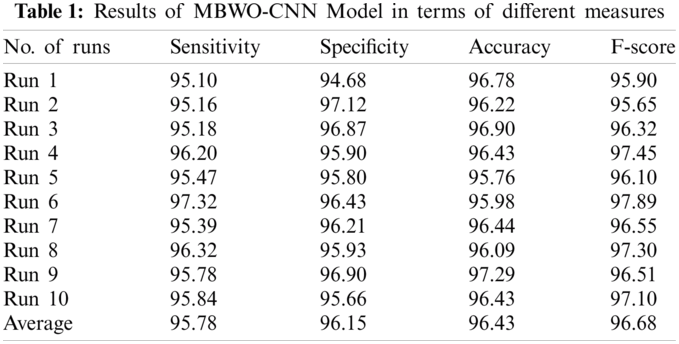
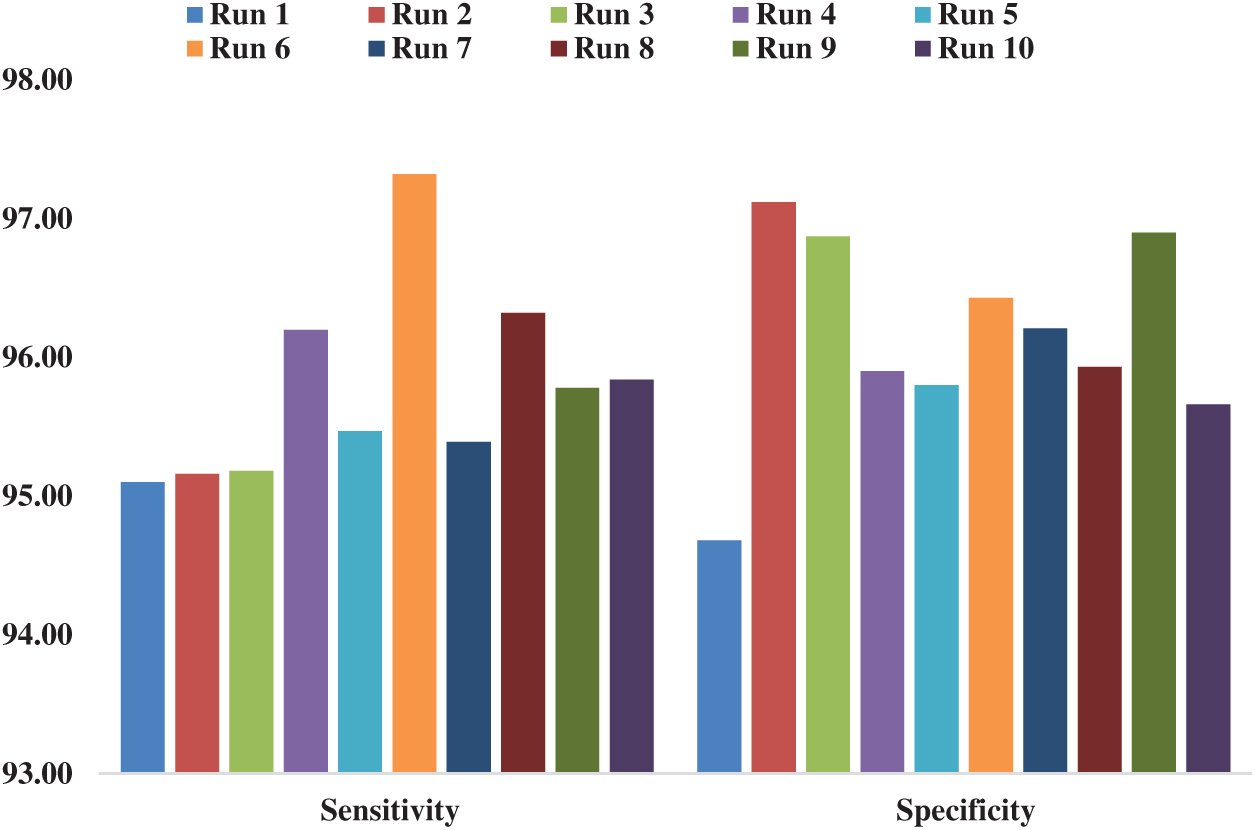
Figure 6: Sensitivity and specificity analyses of MBWO-CNN model
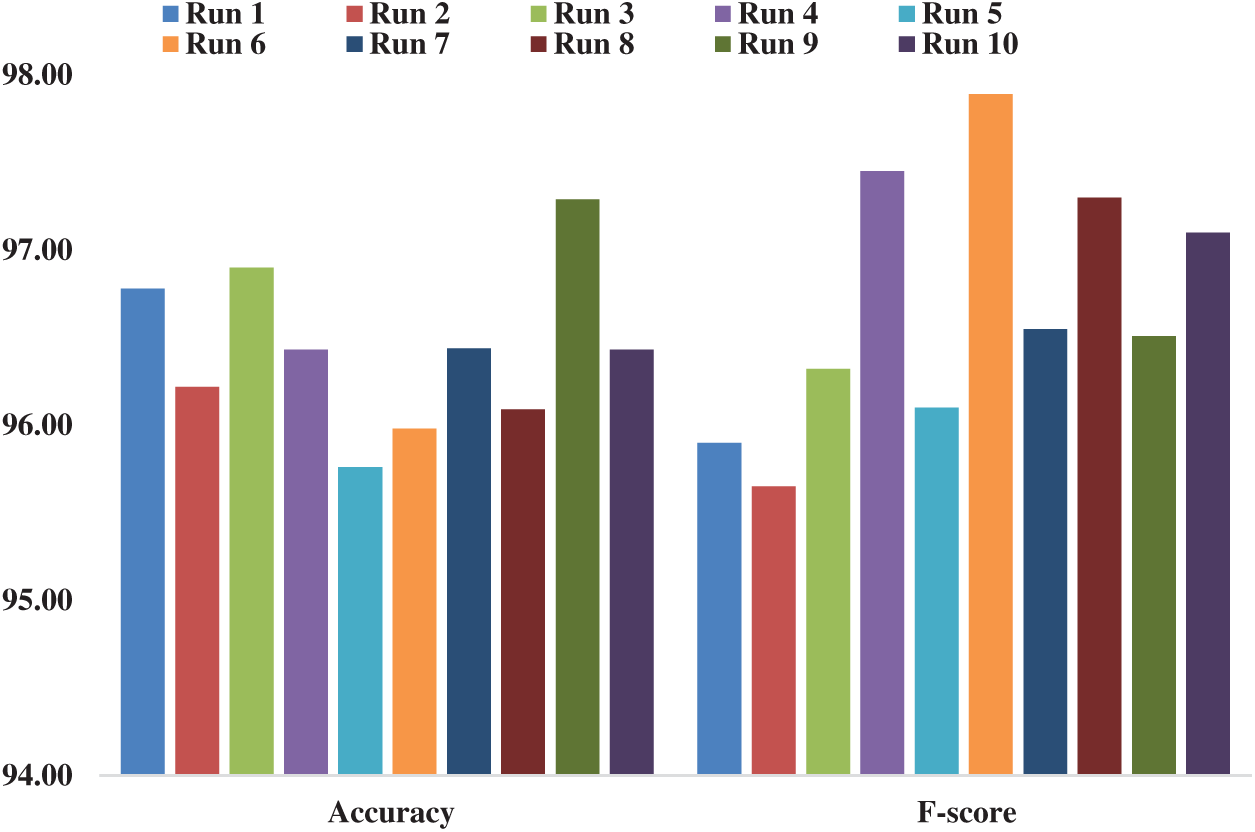
Figure 7: Accuracy and F-score analyses of MBWO-CNN model
Fig. 8 shows the results of average analysis attained by MBWO-CNN model in terms of distinct metrics. The figure portrays that the MBWO-CNN model accomplished the highest sensitivity of 95.78%, specificity of 96.15%, accuracy of 96.43%, and F-score of 96.68%.
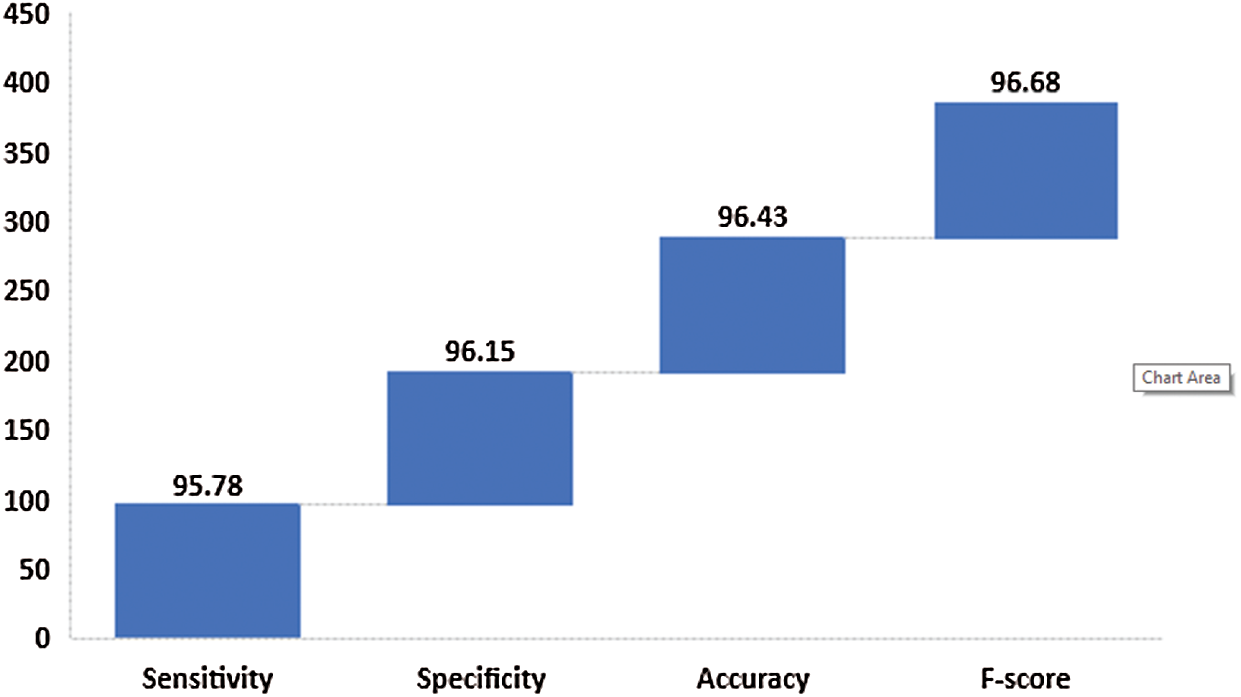
Figure 8: Average analysis of MBWO-CNN model
Fig. 9 depicts the results attained from the comparison of MBWO-CNN model against other models in terms of sensitivity and specificity. The figure showcases that the CNN model achieved minimal classifier outcome with a sensitivity of 87.73% and specificity of 86.97%. The MLP model seemed to be a slightly better classifier which attained a sensitivity of 87.73% and a specificity of 86.97%. Additionally, the ANFIS model resulted in somewhat better classification with a sensitivity of 88.48% and a specificity of 87.74%. Besides, the DT model attempted to showcase moderate outcome with a sensitivity of 87% and a specificity of 88.93%. Here, the LR model accomplished manageable results with a sensitivity of 93% and a specificity of 90.34%. Further, the XGBoost model attained an acceptable sensitivity of 87.73% and a specificity of 86.97%. In line with this, the KNN model achieved a moderate sensitivity of 89% and a specificity of 90.65%. Furthermore, the RNN model yielded a sensitivity of 92.04% and a specificity of 90.87%. Likewise, the ANN model offered better outcomes over other methods by achieving a sensitivity of 93.78% and a specificity of 91.76%. Followed by, the CNNLSTM model managed to produce a moderate outcome with 92.14% sensitivity and 91.98% specificity. Though DTL model reached a moderate sensitivity of 89.61% and a specificity of 92.03%, the Coronet model exceeded all the previous models in terms of sensitivity (90%) and specificity (92.14%). In line with the above models, the LSTM model produced excellent results i.e., sensitivity (93.42%) and specificity (92.64%). Furthermore, the CNNRNN model produced competitive results with a sensitivity of 94.23% and a specificity of 92.67%. The presented MBWO-CNN model outperformed all the compared methods and the model achieved 95.78% sensitivity and 96.15% specificity.
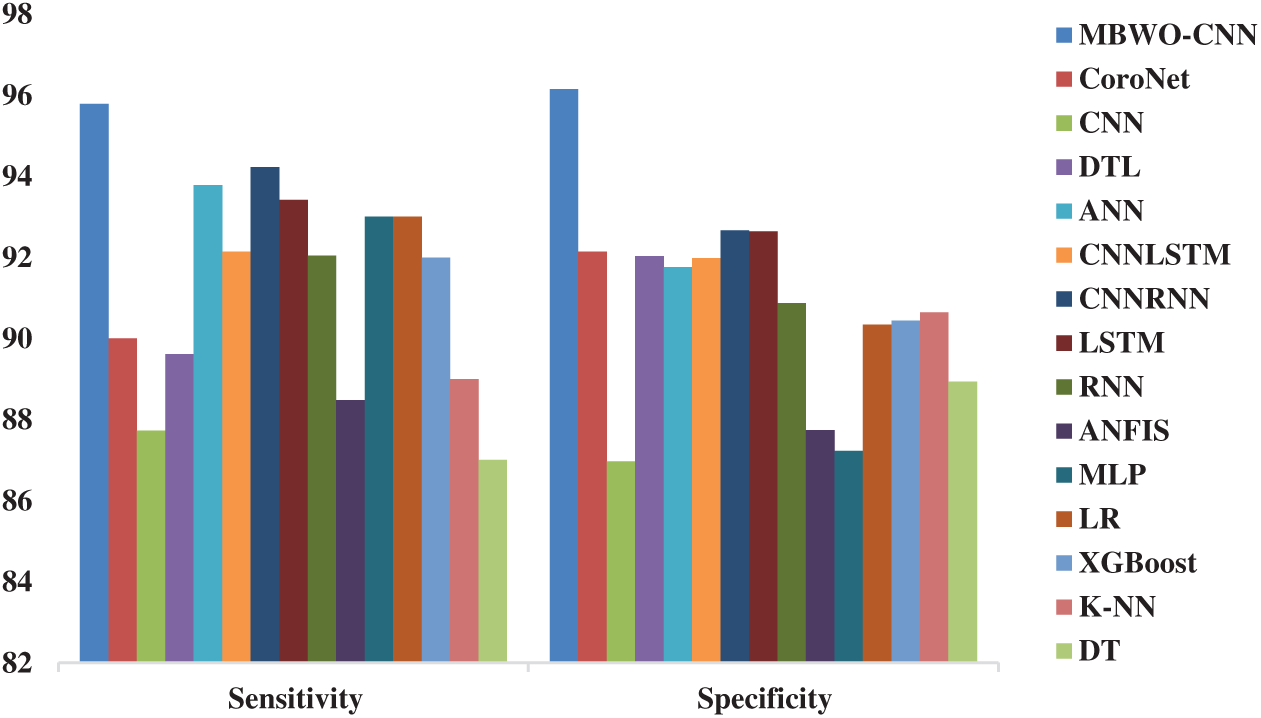
Figure 9: Comparative analysis of MBWO-CNN model against other models in terms of sensitivity and specificity
Fig. 10 illustrates the results of comparative analysis of MBWO-CNN model against other models in terms of accuracy and F-score. The figure showcases that the CNNLSTM method achieved the worst classifier outcome with an accuracy of 84.16% and F-score of 90.01%. The RNN model achieved somewhat better classifier results with an accuracy of 84.16% and F-score of 90.61%. The CNNRNN model demonstrated slightly optimal classification outcome with an accuracy of 85.66% and F-score of 91.20%. Also, the ANN model yielded moderate result with an accuracy of 86% and F-score of 91.34%. In addition, the LSTM method attained a manageable result with an accuracy of 86.66% and F-score of 91.89%. Likewise, the DT model achieved an acceptable accuracy of 86.71% and F-score of 87%. In line with this, the CNN model accomplished a moderate accuracy of 87.36% and F-score of 89.65%. Furthermore, the ANFIS model yielded an accuracy of 88.11% and F-score of 89.04%. Besides, the KNN model offered better result compared to earlier models with its accuracy being 88.91% and F-score being 89%. Followed by, the CoroNet model managed to illustrate a moderate outcome with an accuracy of 90.21% and F-score of 91%. Though DTL approach reached a moderate accuracy of 90.75% and F-score of 90.43%, the XGBoost method exceeded all the previous models in terms of accuracy (91.57%) and F-score (92%). Simultaneously, the LR model achieved an accuracy of 92.12% and F-score of 92%. Here, the MLP model registered a competitive outcome with an accuracy of 93.13% and F-score of 93%. But, the proposed MBWO-CNN model outperformed all the existing models and achieved the highest accuracy of 96.43% and F-score of 96.68%. The results of the analyses discussed above emphasize that the presented MBWO-CNN model is a proficient tool in diagnosis and classification of COVID-19.
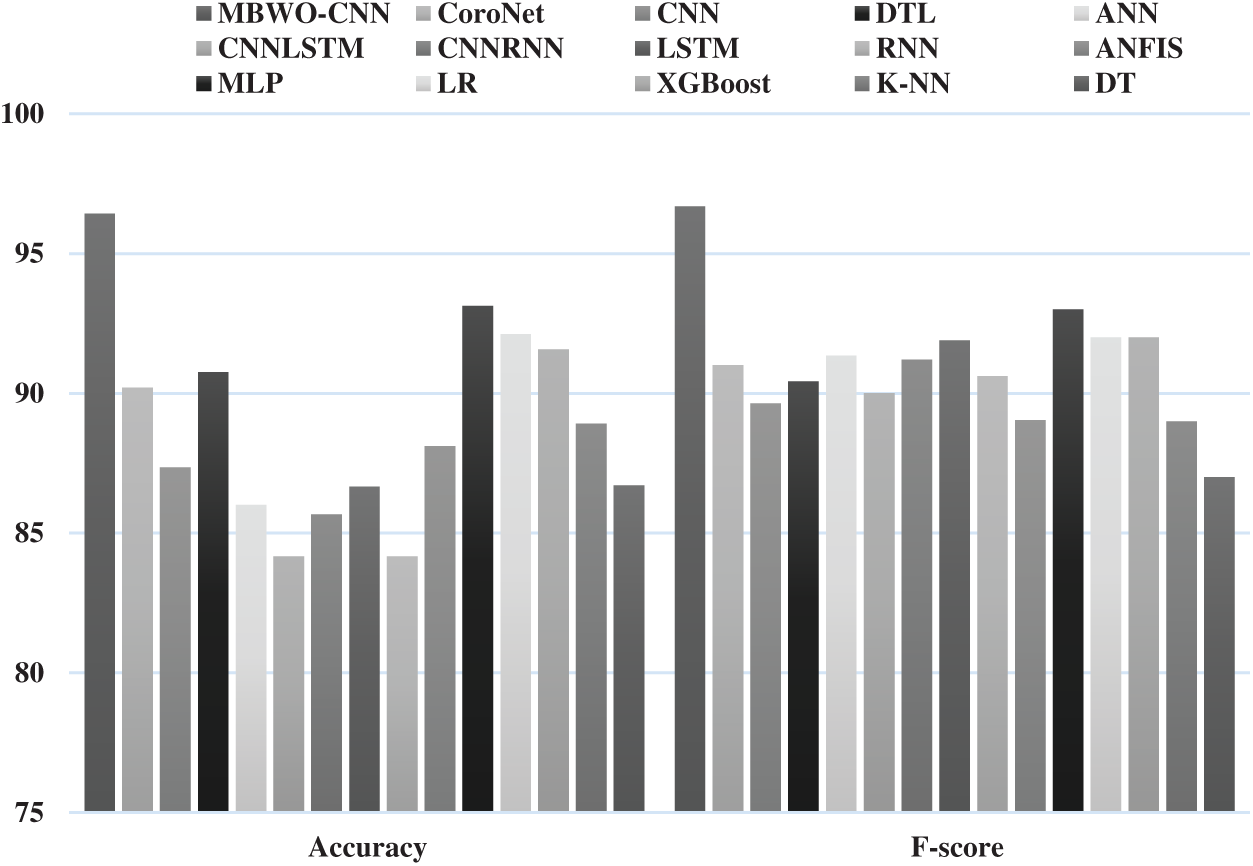
Figure 10: Comparative analysis of MBWO-CNN model with other models in terms of accuracy and F-score
The current research work developed an effective MBWO-CNN model for diagnosis and classification of COVID-19. The input image was first preprocessed in which the image was adjusted to a fixed size. Then, feature extraction was performed for the preprocessed image. Hyperparameter tuning process helped in the selection of initial hyperparameters of CNN model. Finally, the feature vectors were classified and the images were categorized into corresponding class labels, i.e. either COVID-19 or Non-COVID. A detailed comparative analysis was conducted to validate the effectiveness of the proposed MBWO-CNN model in terms of detection performance. The results were investigated under several aspects. The proposed MBWO-CNN model accomplished the highest sensitivity of 95.78%, specificity of 96.15%, and accuracy of 96.43% in the experimental investigations. Therefore, the study established the effectiveness of MBWO-CNN model. It can be considered as an effective model for diagnosis and classification of COVID-19. In future, MBWO-CNN model can be deployed in IoT and cloud-enabled diagnostic tools to assist remote patients.
Funding Statement: The authors received no specific funding for this study.
Conflicts of Interest: The authors declare that they have no conflicts of interest to report regarding the present study.
1. World Health Organization, “Novel Coronavirus (2019-nCoV) Situation Report-11,” 2020. [Online]. Available: https://www.who.int/docs/defaultsource/coronaviruse/situationreports/20200131-sitrep-11-ncov.pdf?sfvrsn=de7c0f7_4 (Accessed 24 March 2020). [Google Scholar]
2. T. Ai, Z. Yang, H. Hou, C. Zhan, C. Chen et al., “Correlation of chest CT and RT-PCR testing for coronavirus disease 2019 (COVID-19) in china: A report of 1014 cases,” Radiology, vol. 296, no. 2, pp. 32–40, 2020. [Google Scholar]
3. S. S. Yadav and S. M. Jadhav, “Deep convolutional neural network based medical image classification for disease diagnosis,” Journal of Big Data, vol. 6, pp. 1–18, 2019. [Google Scholar]
4. R. H. Abiyev and M. K. S. Ma’aitah, “Deep convolutional neural networks for chest diseases detection,” Journal of Healthcare Engineering, vol. 2018, pp. 1–11, 2018. [Google Scholar]
5. O. Stephen, M. Sain, U. J. Maduh and D.-U. Jeong, “An efficient deep learning approach to pneumonia classification in healthcare,” Journal of Healthcare Engineering, vol. 2018, pp. 1–7, 2018. [Google Scholar]
6. V. Chouhan, S. K. Singh, A. Khamparia, D. Gupta, P. Tiwari et al., “A novel transfer learning based approach for pneumonia detection in chest X-ray images,” Applied Sciences, vol. 10, no. 2, pp. 1–17, 2020. [Google Scholar]
7. Y. Fang, H. Zhang, Y. Xu, J. Xie, P. Pang et al., “CT manifestations of two cases of 2019 novel coronavirus (2019-nCoV) pneumonia,” Radiology, vol. 295, no. 1, pp. 208–209, 2020. [Google Scholar]
8. D. N. Le, V. S. Parvathy, D. Gupta, A. Khanna, J. J. P. C. Rodrigues et al., “IoT enabled depthwise separable convolution neural network with deep support vector machine for COVID-19 diagnosis and classification,” International Journal of Machine Learning and Cybernetics, pp. 1–14, 2021. [Google Scholar]
9. A. Bernheim, X. Mei, M. Huang, Y. Yang, Z. A. Fayad et al., “Chest CT findings in coronavirus disease-19 (COVID-19Relationship to duration of infection,” Radiology, vol. 295, no. 3, pp. 685–691, 2020. [Google Scholar]
10. L. Li, L. Qin, Z. Xu, Y. Yin and X. Wang, “Using artificial intelligence to detect COVID-19 and community-acquired pneumonia based on pulmonary CT: Evaluation of the diagnostic accuracy,” Radiology, vol. 296, no. 2, pp. 65–72, 2020. [Google Scholar]
11. O. Gozes, M. Frid-Adar, H. Greenspan, P. D. Browning, H. Zhang et al., “Rapid AI development cycle for the coronavirus (COVID-19) pandemic: Initial results for automated detection & patient monitoring using deep learning CT image analysis,” Image and Video Processing, pp. 1–19, 2020. [Google Scholar]
12. F. Shan, Y. Gao, J. Wang, W. Shi, N. Shi et al., “Lung infection quantification of COVID-19 in CT images with deep learning,” Computer Vision and Pattern Recognition, pp. 1–19, 2020. [Google Scholar]
13. X. Xu, X. Jiang, C. Ma, X. Li, P. Du et al., “A deep learning system to screen novel coronavirus disease 2019 pneumonia,” Engineering, vol. 6, no. 10, pp. 1122–1129, 2020. [Google Scholar]
14. S. Wang, B. Kang, J. Ma, X. Zeng, M. Xiao et al., “A deep learning algorithm using CT images to screen for corona virus disease (COVID-19),” European Radiology, pp. 1–26, 2020. https://doi.org/10.1101/2020.02.14.20023028. [Google Scholar]
15. A. Narin, C. Kaya and Z. Pamuk, “Automatic detection of coronavirus disease (COVID-19) using X-ray images and deep convolutional neural network,” Image and Video Processing, pp. 1–35, 2020. [Google Scholar]
16. P. K. Sethy and S. K. Behera, “Detection of coronavirus disease (COVID19) based on deep features,” Electrical & Electronic Engineering, pp. 1–9, 2020. https://doi.org/10.20944/preprints202003.0300.v1 [Google Scholar]
17. D. A. Pustokhin, I. V. Pustokhina, P. N. Dinh, S. V. Phan, G. N. Nguyen et al., “An effective deep residual network based class attention layer with bidirectional LSTM for diagnosis and classification of COVID-19,” Journal of Applied Statistics, vol. 2020, pp. 1–18, 2020. [Google Scholar]
18. K. Shankar and E. Perumal, “A novel hand-crafted with deep learning features based fusion model for COVID-19 diagnosis and classification using chest X-ray images,” Complex & Intelligent Systems, vol. 2020, pp. 1–14, 2020. [Google Scholar]
19. D. Singh, V. Kumar, Vaishali and M. Kaur, “Classification of COVID-19 patients from chest CT images using multi-objective differential evolution-based convolutional neural networks,” European Journal of Clinical Microbiology & Infectious Diseases, vol. 39, pp. 1379–1389, 2020. [Google Scholar]
20. V. Hayyolalam and A. A. P. Kazem, “Black widow optimization algorithm: A novel meta-heuristic approach for solving engineering optimization problems,” Engineering Applications of Artificial Intelligence, vol. 87, pp. 1–28, 2020. [Google Scholar]
21. J. Li, B. Xi, Q. Du, R. Song, Y. Li et al., “Deep kernel extreme-learning machine for the spectral-spatial classification of hyperspectral imagery,” Remote Sensing, vol. 10, no. 12, pp. 2036:1–2036:22, 2018. [Google Scholar]
22. J. P. Cohen, P. Morrison, L. Dao, K. Roth, T. Q. Duong et al., “Dataset,” 2020. [Online]. Available: https://github.com/ieee8023/covid-chestxray-dataset. [Google Scholar]
 | This work is licensed under a Creative Commons Attribution 4.0 International License, which permits unrestricted use, distribution, and reproduction in any medium, provided the original work is properly cited. |