DOI:10.32604/cmc.2022.018946
| Computers, Materials & Continua DOI:10.32604/cmc.2022.018946 | |
| Articlep |
Malaria Blood Smear Classification Using Deep Learning and Best Features Selection
1Department of Computer Science, COMSATS University Islamabad, Wah Campus, Wah Cantt, Pakistan
2Department of Computer Science, HITEC University Taxila, Taxila, Pakistan
3College of Computer Engineering and Sciences, Prince Sattam Bin Abdulaziz University, Al-Khraj, Saudi Arabia
4Department of Informatics, University of Leicester, Leicester, UK
5Department of ICT Convergence, Soonchunhyang University, Asan, Korea
*Corresponding Author: Yunyoung Nam. Email: ynam@sch.ac.kr
Received: 27 March 2021; Accepted: 18 May 2021
Abstract: Malaria is a critical health condition that affects both sultry and frigid region worldwide, giving rise to millions of cases of disease and thousands of deaths over the years. Malaria is caused by parasites that enter the human red blood cells, grow there, and damage them over time. Therefore, it is diagnosed by a detailed examination of blood cells under the microscope. This is the most extensively used malaria diagnosis technique, but it yields limited and unreliable results due to the manual human involvement. In this work, an automated malaria blood smear classification model is proposed, which takes images of both infected and healthy cells and preprocesses them in the L*a*b* color space by employing several contrast enhancement methods. Feature extraction is performed using two pretrained deep convolutional neural networks, DarkNet-53 and DenseNet-201. The features are subsequently agglutinated to be optimized through a nature-based feature reduction method called the whale optimization algorithm. Several classifiers are effectuated on the reduced features, and the achieved results excel in both accuracy and time compared to previously proposed methods.
Keywords: Malaria; preprocessing; deep learning; features optimization; classification
Malaria is a critical and intimidating disease, which has been of great concern for humans over a long period of time [1]. Malaria is the prime cause of thousands of deaths in both warm and cold regions worldwide, and it has reached over 228 million cases and 400 thousand deaths. Although it is a serious disease for both children and adults, children are the most likely affected, and almost 67% of children had fallen victim to it by 2019 [2]. The sporozoa bacillus of the genus Plasmodium is the root cause of malaria within the human body cells. It comprises six mainspring species, two of which, P. falciparum and P. vivax, are the most minacious. Apart from these, others including P. Curtisi, P. Wallikeri, P. Malariae, and the recently emerged P. knowlesi are also malaria-causing parasite species, but are significantly less crucial than the former [3].
Plasmodium sporozoites are transmitted inside the human body through the bite of their carrier mosquito, known as the Anopheles. More than 350 breeds of this mosquito exist worldwide, of which 30 are malaria vectors. Adult mosquitoes of these breeds look dull in color, naturally hued to dark environments, and contain three body parts, including the head, chest, and middle body regions [4]. They lay their eggs in fresh flowing water, which develop to hatchlings, finally creating bigger and nourished mosquitoes. The females search for blood as a help in their egg nourishment process and slurp it from the human body, which sometimes contains Plasmodium microbes from an older infection. These microbes re-grow and are nourished inside the mosquito's body and are transmitted to a new host when a bite is made, thus initiating a new contagion cycle [5]. A diagram of this microbe to mosquito transmission cycle is shown in Fig. 1.

Figure 1: Cycle of microbe to mosquito transmission
The bite of the Anopheles mosquito injects these harmful malaria-causing sporozoites inside the human bloodstream, which carries them to the liver with the normal blood flow process. Once inside the liver, these sporozoites conquer and seize the innate immunity-upheaving parenchymal cells called hepatocytes and stay there for some time to mature by feeding on the blood proteins. No clear indication or symptom is felt by the host body until this point [6]. After invading the hepatocytes, they start replicating themselves, and this process continues for 1–2 weeks, resulting in the development of thousands of nourished erythrocytes, known as merozoites, within the invaded liver cells. The development of such large number of merozoites causes the hepatocytes to rupture and release these merozoites into the bloodstream, and therefore, into blood cells. The pathogens that find their way into the red blood cells start feeding upon them and again perform asexual multiplication, producing 10–15 more merozoites. This massive batch of merozoites attacks the red blood cells and damages them, causing malaria symptoms within the host body [7].
Malaria is manually diagnosed using microscope analyses along with rapid diagnostic blood tests (RDTs). The patient's blood is drawn from the body, spattered with Giemsa staining material, placed on a glass slide, and prepared to make a blood smear. Once the smear is ready, an analyst utilizes the available light, compound, stereo, or electron microscope to examine the prepared smear for any trace of parasitic presence [8]. This method requires constant involvement of an operator or technician, which makes it prone to several errors and restricts the accuracy of the prognosis outcomes. It is also cost-intensive because performing a manual microscope-based test requires certain equipment such as glass slides, measuring cylinders, pipettes, dryers, buffer solution, stain material, methanol, and immersion oil, which are not easy to afford unless the tests are being carried out in a well-established hospital laboratory. These limitations require the formulation of a compact automated system for the detection and diagnosis of malaria in a blood smear, and for the classification of healthy and infected blood cells. The ever-growing research in the fields of image processing [9], deep learning [10,11], and machine learning [12,13] has provided us with the modules and techniques to develop such automated systems, which are being used extensively in medical imaging [14,15].
Several studies have been proposed for malaria blood smear detection, segmentation, and classification [16,17]. Quan et al. [18] utilized 27,558 malaria blood smear images from the National Institute of Health (NIH) and expanded wielding rotation, zooming, and flipping. An attention dense circular net (ADCN) was proposed for infected red blood cell classification. It was inspired by the state-of-the-art convolutional neural network (CNN) models ResNet and DenseNet, which operate on the basis of remnant connections. The attention mechanism was also integrated in the ADCN model, which helps it to cornerstone at critical focal points within the input images. The formulated model delivered 97.47% accuracy with five-fold cross-validation, and the results were evaluated on the basis of the performance measures of sensitivity, specificity, and F1 score. Molina et al. [19] identified malaria infection on 15,660 peripheral field-stained blood cell images obtained from 87 smears. Several preprocessing steps, including contrast enhancement, histogram equalization, image smoothing, and noise removal, were applied to the input images to refine them for better understanding. Segmentation was performed using the Otsu's thresholding and watershed method to separate and highlight the region of interest. The shape, textural, and color features were obtained using the open-source tool PyRadiomics. Support vector machine (SVM), K-nearest neighbors (KNN), and linear discriminant analysis (LDA) were among the models used for training the prepared data, where LDA achieved the best performance as compared to KNN, which showed lower accuracies. The proposed model achieved an overall accuracy of 97%. Pattanaik et al. [20] proposed a multi-magnification deep residual network (MM-ResNet) to classify malaria blood smears of various scales and magnifications obtained using an Android smartphone. This study used a publicly available dataset of 1182 field-stained images at three magnification variations, namely, 200, 400, and 1000x. MM-ResNet is based on convolutional, batch normalization, and ReLU layers trained on a single passage to avoid an excessive need of data. It addresses the low quality, varying luminance, and noise factor of the input smartphone images quite well with the help of residual connections composed of abundant filters. The proposed MM-ResNet achieved an accuracy of 98.08% over five-fold validation. Masud et al. [21] amalgamated a custom CNN containing two dense layers that are entirely affixed, a ReLU layer, and multiple max pooling, normalization, and dropout layers within four convolutional blocks with a random acclivity-based stochastic gradient descent (SGD) algorithm functioning in cyclic mode with automatic learning rate deduction in order to classify malarial and non-malarial blood cell images. The dataset used for the work comprised 27,558 Giemsa-stained cell images obtained from the NIH, which were normalized and resized before processing. Upon validation with manifold assessment measures comprising the Matthew's correlation coefficient (MCC), area under the curve (AUC), sensitivity rate, and specificity rate, the proposed CNN achieved 97.30% classification accuracy.
In this work, malaria blood smear classification was performed on RGB image data containing 27,558 images divided into two equal classes. The images were preprocessed using contrast enhancement by transforming them into L*a*b* color space and resized to establish scale uniformity. Feature extraction was achieved using two pretrained CNN models: DarkNet-53 (DK-53) and DenseNet-201 (DN-201). The transfer learning approach was utilized to concatenate the features obtained from both frameworks. A nature-based whale optimization algorithm (WOA) was contrived to narrow the attribute dimensionality. The reduced features were then subjected to the classifiers, and various experiments were conducted. The optimized model achieved an accuracy of 97.75% and stood out in terms of classification time. The major contributions are discussed below:
• Preprocessing steps such as intensity adjustment, histogram equalization, and adaptive histogram leveling are performed on raw images by converting them into L*a*b* color space, which modifies the image visualization and makes infected regions stand out compared to the rest of the image.
• Deep features are extracted with the help of two state-of-the-art pretrained CNN models, DN-201 and DK-53.
• A transfer learning strategy is adopted to incorporate the depth attribute details learned by the employed deep models and to create a compact feature vector set.
• An advanced nature-based feature optimization framework, WOA, is implemented, which searches and selects the most relevant features from the vector set and discards less concerned ones.
• Classification is performed using four sophisticated classifier classes together with their distinctive kernels, which leads to better results.
The manuscript is divided into four sections: Introduction, Proposed work, Results and discussion, and Conclusion. Section 1 introduces the causes of malaria, the mosquitoes and parasites that cause malaria, manual malaria detection methods, and automated systems for its detection and classification. Section 2 describes the proposed methodology for computerized malaria classification. First, we describe the utilized preprocessing techniques followed by deep feature extraction and feature amalgamation through transfer learning. Later, the feature selection phase is elaborated, and the section concludes with classification. Section 3 presents the experimental setup and results analysis with the help of tables, diagrams, and graphs. Finally, the conclusions are presented in Section 4.
An automated system is proposed for malaria blood smear classification based on the fusion of deep features from two CNN models and a feature optimization method. The proposed method is carried out in several steps: data acquisition, preprocessing of original images, implementation of the pretrained CNN models DK-53 and DN-201 in order to perform feature extraction and learning from the input images, blending of the features obtained from both models, feature vector optimization and reduction by exploiting the WOA, a nature-based selection method, and finally categorization of the selected features using various state-of-the-art classification methods. Fig. 2 shows a flow diagram of the proposed model.
The dataset used in this work comprises Giemsa blotched microscopic slide images of 150 malaria-contaminated patients and 50 patients with good health. The data, which are publicly available, were originally prepared by the Chittagong Medical College Hospital [22] and offered by the NIH (https://lhncbc.nlm.nih.gov/LHC-downloads/downloads.html#project-a225). The data compilation categorizes a total of 27,558 blood cells microscopic images equally fractionated with a ratio of 13,779:13,779 into two classes: parasitized and uninfected, with images tainted by Plasmodium species and from healthy persons, respectively, as shown in Fig. 3.

Figure 2: Proposed model for malaria classification

Figure 3: Dataset visualization
In computer vision (CV), preprocessing can help refine the image content to be better translated by the descriptors that operate on it [23,24]. Various preprocessing techniques have been employed by a number of works in several image processing domains over the years [25,26]. The L*a*b* color space is based on components L*, a*, and b*, where luminosity (L*) is used as a threshold for the amount of brightness and darkness. The a* and b* values determine the green to red and blue to yellow shades in the concerned images, varying on a scale of 0–100 [27]. The general range interval values of these color channels are given in Eqs. (1) and (2), respectively:
Converting an RGB image to L*a*b* color space first involves the conversion to a temporary third space ‘x’ using a transformed matrix as shown in Eq. (3).
where T is the transformed matrix. In the next step, the final conversion is achieved where “x” is transformed to the final desired space, as expressed in Eqs. (4)–(6):
where (
2.3 Deep Learning Based Feature Extraction
After performing suitable preprocessing on raw images and modifying them, the next phase is to apply feature extraction techniques to the modified images. CNNs are widely used for deep feature extraction because of their complexity. A standard CNN is based on multiple convolutional, pooling, normalization, fully connected, and classification layers [29]. Using this compounded structure, CNNs have the capability to draw out depth information from the input data, which in turn improves the results. This effectiveness of CNNs has made them an indispensable component of modern-day image analysis and computer vision problems including liver segmentation from CT images, skin cancer spot detection and classification, and brain tumor classification [30,31].
In this work, two pretrained CNN models, DK-53 and DN-201, were employed to extricate the cavernous features. A transfer learning strategy is used to derive these extracted features from the last pooling layer of DK-53 and the last fully connected layer of DN-201, which are coalesced in a single matrix for use in the subsequent steps. The purpose of this pre-classification feature extension from both networks and coalescence is to create a compact feature vector set that contains the depth details learned by both models so that better classification results can be obtained. The architecture and procedural details of both deep models are discussed in the following sections.

Figure 4: Process of preprocessing the dataset
It is a 53-layer deep CNN model composed of a predominant progression of convolutional layers with dimensions of 1 × 1 and 3 × 3, mainly used at the core of you-only-look-once (YOLO) frameworks for object perception purposes [32]. Each set of convolutional layers is accompanied by a batch normalization layer and multiple residual layers attained from ResNet, which are added to address the activity vanishing and descent issues that may occur within the network in the training phase. The preprocessed images are given as an input to the model, which uses its intricacy kernels and filters to process them iteratively, and the processed feature maps are passed from each layer block to the next one. DK-53 is more remarkable, versatile, and systematic than DarkNet-19, ResNet-101, and ResNet-50. In this work, a total of 27,558 images were passed on to the DK-53, which extracted 1024 features with dimension (27558 × 1024) and in data type double. The architectural flow of this model is illustrated in Fig. 5.
DenseNet-201 (DN-201) [33] is a 201-layer CNN model also utilized in this work for feature learning and derivation, which embodies dense blocks “d” having certain growth rates “r” that amplify with the weightage of 32 for every block. Various adjustment layers are present between every condense block, which includes convolutional and max-pooling layers. The layer structure and functionality of DN-201 provide an edge over other CNN models in terms of computational and time competence, as each layer receives a constant input of composite apprehension from all the preceding layers because all the layers have their input and output channels sequenced together in every regard. There also exists a global average pooling layer to maintain and accommodate the feature vector dimensionality prior to the prediction phase, which is achieved by the integration of the SoftMax activation function with the FC layer. The overfitting problem that occurs in DN-201 mainly because of the massive overflow of information and layer complexity is over-cornered by providing each layer with direct access to the loss function operating on the basis of the gradient. In this work, a total of 27,558 images were passed on to DN-53, which extracted 1000 features with dimension (27558 × 1000) and in data type double. The basic structure of DN-201 is shown in Fig. 6.

Figure 5: DN-53 architecture [30]

Figure 6: DN-201 architecture [33]
2.4 Transfer Learning for Feature Extraction
The concept of transfer learning is to utilize the already trained layers of CNN models to extract features from the given data input and acquire them directly while freezing other unnecessary layers. This provides efficient and better features because the training of pretrained model layers is usually performed on a large-scale dataset and in optimal environments [34]. In this work, the idea of transfer learning is also implemented by making the top layers of both models to learn depth information and later to derive 1024 deep features from the last global average pooling layer of DK-53, namely “avg1,” and 1000 deep features from the last fully connected layer of DN-201, namely “fc1000.” The purpose of drawing out features from these mentioned layers is that both “avg1” and “fc1000” are the final depth layers of their respective models, which are followed by the SoftMax classification layers. Therefore, these layers contain the maximum details learned from the input data, and the performance of the proposed model depends on the number and quality of the features. These extracted features are then concatenated together using the serial fusion method to compose a compact attribute model consisting of 2024 features with dimension (27558 × 2024), can be seen in Fig. 7.

Figure 7: Transfer learning on deep networks
In this work, the WOA is exploited for feature proportionality depletion and intricacy compression. It is a multi-objective computational model inspired in the natural life and survival tactics of humpback whales and proposed for the first time by Mirjalili et al. [35]. It embeds the mathematical modeling of humpback whale's unique hunting manner designated as the bubble-net feeding method. This whale creates spiral, circular, or sometimes “9” shaped bubbles to attract small fish species snorkeling close to the water surface after circumscribing them based on an initial location approximation. With the passage of time, the dimensions of these twisted bubbles continue to narrow as the whale gets closer to its target.
Based on this whale strategy, the WOA first tries to encompass the desired best solution by declaring some search envoys and initially predicts a location; thus, it allocates the task to find the best solution in the entire search space. All the envoys keep updating their localities following the best search agent, which is represented in Eq. (7).
where
Here,
where
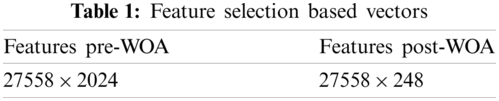
In this work, the features from both deep networks are concatenated together after employing a transfer learning strategy that lays out a final vector comprising 2025 features from a set of 27,558 images. At this stage, the WOA is administered over the finalized feature vector. The number of whales for optimal solution exploration is 30, and the total number of iterations is declared to be 50. The vector is reduced to almost 80% as the feature selector selects only 248 features, as presented in Tab. 1, and in the next step it is given to the classifiers for validation of the results. In this work, supervised classification is conducted, and the results are quantified using five independent classifiers together with their discrete kernels, which results in a combination of 10 classifiers..
The proposed model uses a publicly available malaria cell image dataset holding 27,558 RGB images divided into two equal classes, each one with 13,779 images, named parasitized and uninfected. All the experiments were conducted on an Intel Core i5 4th generation CPU with 8 GB of RAM and a 223 GB SSD, upon which MATLAB 2020a was installed. Several experiments were performed with varying model settings and a learning rate of 0.0001. Experiments 1 and 2 depict the implementation of the standalone modified CNN models DK-53 and DN-201, respectively. The results of the feature fusion and optimization are discussed in Experiment 3. All the experiments were conducted with a five-fold cross validation. The results were gathered for a total of 10 best classifiers: fine tree (F-tree), medium tree (M-tree), linear discriminant (LD), logistic regression (LR), linear SVM (L-SVM), cubic SVM (CB-SVM), coarse Gaussian SVM (CG-SVM), fine KNN (F-KNN), coarse KNN (CR-KNN), and weighted KNN (W-KNN). Performance evaluation measures including accuracy, precision, specificity, sensitivity, F1 score, and MCC were also employed.
Experiment 1 was performed using the pretrained DK-53. A total of 25,778 preprocessed images were put forward to the model, which extracted 1024 features upon performing operations within its deep layers. These features were then classified using the 10 best classifiers, and different results were achieved, which are listed with the different performance evaluation measures in Tab. 2. The CB-SVM classifier stood out with an accuracy of 98.80%. The confusion matrix is also illustrated in Fig. 8 to confirm the accuracy of the CB-SVM for Experiment 1.
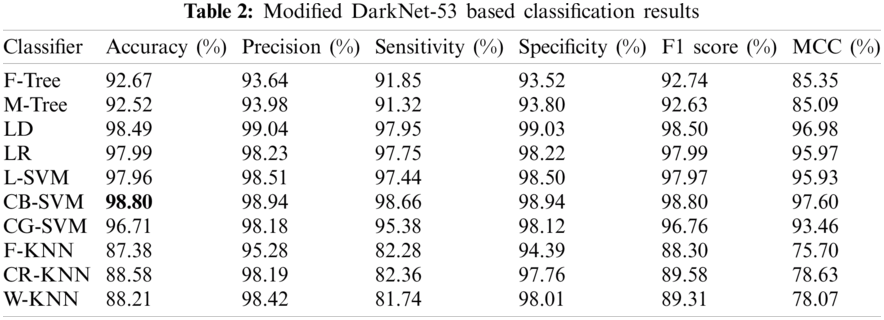

Figure 8: Confusion matrix of CB-SVM for experiment 1
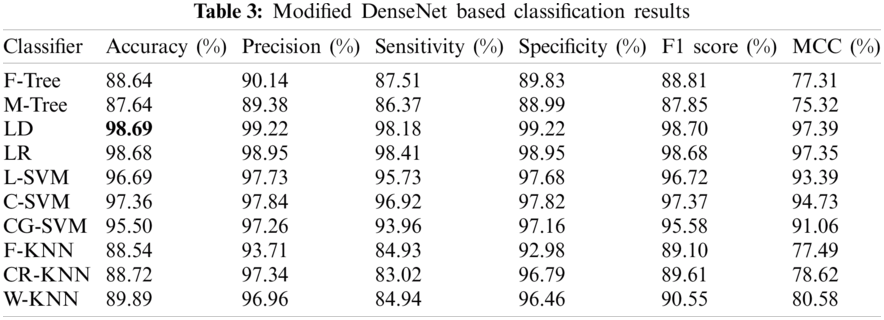
Experiment 2 involved the pre-trained version of DN-201, which extracted 1000 features upon implementation on 27,558 processed images. The classification results considering the performance evaluation matrices are presented in Tab. 3. The LD classifier provides the best accuracy of 98.69% and is superior to the other classifiers. The sensitivity rate of LD is 99.22%, as confirmed by the confusion matrix given in Fig. 9. From this table, it is noted that the performance of the modified DarkNet model is better, but the target accuracy is above 99%. Therefore, it is essential to improve these features.
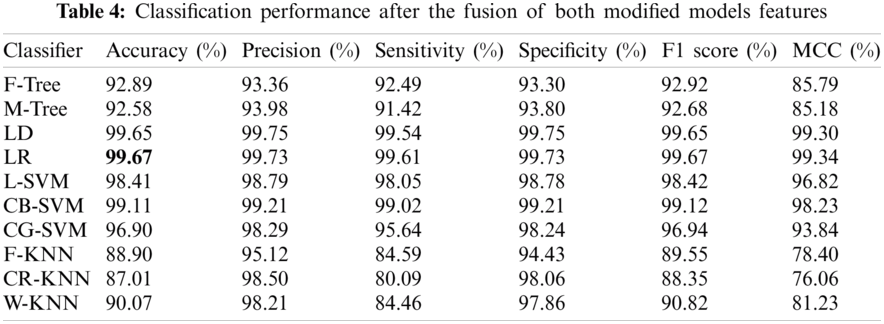
In this experiment, the features of both modified models were fused in one matrix using a serial-based approach. Subsequently, the WOA was applied to further increase the classification performance and minimize the computational time. The results are presented in Tab. 4. In this table, it is noted that the classification accuracy increases and reaches 99.67%. This accuracy is better than those of Experiments 1 and 2. In addition, this process reduced the time to almost 50%. The other calculated measures of the LR classifier, such as the sensitivity rate of 99.73%, can be confirmed by the confusion matrix illustrated in Fig. 10. In this figure, it is noted that the correct classification rate is much higher and shows the significance of the proposed approach.

Figure 9: Confusion matrix of LD for experiment 2
Because the proposed model uses an optimization module, an immense difference is noted in the classifier training time before and after the implementation of the WOA. Fig. 11 presents the time plot. This plot shows that there is a significant time difference between pre-WOA and post-WOA.
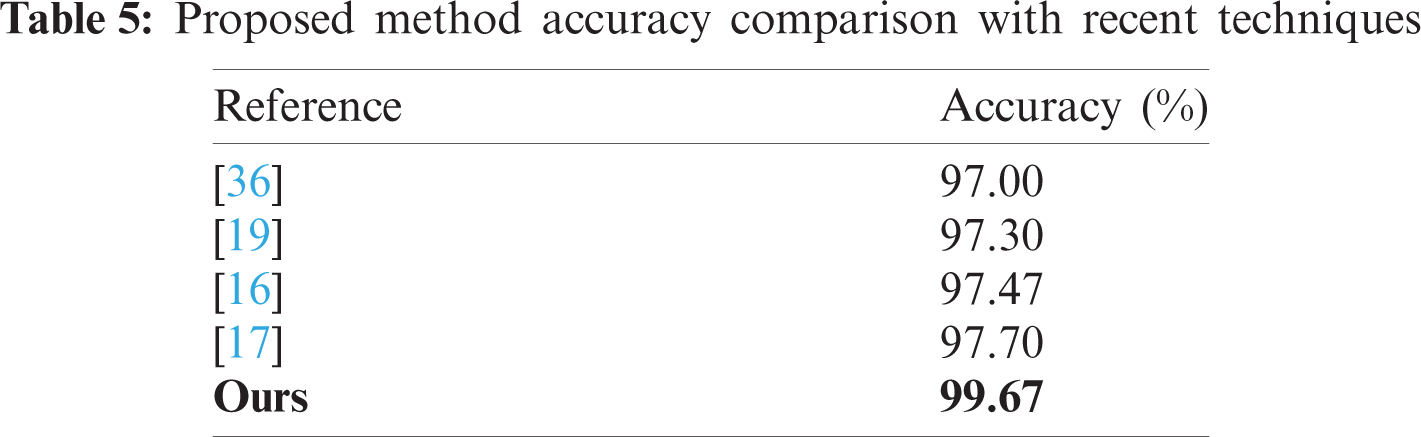
Fig. 12 shows the comparison of prediction speed of the proposed model before and after optimization. It is evident that the model excels in terms of speed after employing the WOA-based feature selection. This increased prediction speed is also the reason why the model provides significantly less training time, as shown in Fig. 11. The proposed method was also compared with recent techniques, as shown in Tab. 5. From this table, it is demonstrated that the proposed method outperforms the existing techniques in terms of accuracy, training time, and prediction speed.

Figure 10: Confusion matrix of LR for proposed framework

Figure 11: Classifier training time comparison pre-& post WOA optimization

Figure 12: Classifier prediction speed comparison before and after optimization
In this paper, a deep model fusion-based framework is proposed for red blood cell classification of healthy and infected malaria blood smear microscopic images. The original data are preprocessed through various contrast enhancement operations to make the parasite-vitiated regions stand out from the normal ones. The features extracted by DK-53 and DN-201 were removed from the last fully connected layer and amalgamated. To reduce the computational complexity and time consumption, the nature-inspired WOA algorithm was employed. Finally, classification was performed using various classifiers. The proposed model provided remarkable accuracy while maintaining an exceptional time consumption rate.
Funding Statement: This research was supported by the MSIT (Ministry of Science and ICT), Korea, under the ICAN (ICT Challenge and Advanced Network of HRD) program (IITP-2021-2020-0-01832) supervised by the IITP (Institute of Information & Communications Technology Planning & Evaluation) and the Soonchunhyang University Research Fund.
Conflicts of Interest: The authors declare that they have no conflicts of interest to report regarding the present study.
1. D. D. Laishram, P. L. Sutton, N. Nanda, V. L. Sharma, J. M. Carlton et al., “The complexities of malaria disease manifestations with a focus on asymptomatic malaria,” Malaria Journal, vol. 11, pp. 1–15, 2012. [Google Scholar]
2. F. H. Nosten and A. P. Phyo, “New malaria maps,” The Lancet, vol. 394, pp. 278–279, 2019. [Google Scholar]
3. A. F. Cowman, J. Healer, D. Marapana and K. Marsh, “Malaria: Biology and disease,” Cell, vol. 167, pp. 610–624, 2016. [Google Scholar]
4. L. M. Beck-Johnson, W. A. Nelson, K. P. Paaijmans, A. F. Read, M. B. Thomas et al., “The effect of temperature on anopheles mosquito population dynamics and the potential for malaria transmission,” PLOS One, vol. 8, no. 11, pp. e79276, 2013. [Google Scholar]
5. J. Gatc, F. Maspiyanti, D. Sarwinda, and A. M. Arymurthy, “Plasmodium parasite detection on red blood cell image for the diagnosis of malaria using double thresholding,” in 2013 Int. Conf. on Advanced Computer Science and Information Systems (ICACSISpp. 381–385, Sanur Bali, Indonesia, IEEE, 2013. [Google Scholar]
6. M. M. Stevenson and E. M. Riley, “Innate immunity to malaria,” Nature Reviews Immunology, vol. 4, pp. 169–180, 2004. [Google Scholar]
7. L. Malaguarnera and S. Musumeci, “The immune response to plasmodium falciparum malaria,” The Lancet Infectious Diseases, vol. 2, pp. 472–478, 2002. [Google Scholar]
8. C. Wongsrichanalai, M. J. Barcus, S. Muth, A. Sutamihardja and W. H. Wernsdorfer, “A review of malaria diagnostic tools: Microscopy and rapid diagnostic test,” The American Journal of Tropical Medicine and Hygiene, vol. 77, pp. 119–127, 2007. [Google Scholar]
9. F. Afza, M. Sharif, M. Mittal and D. J. Hemanth, “A hierarchical three-step superpixels and deep learning framework for skin lesion classification,” Methods, vol. 2, pp. 1–21, 2021. [Google Scholar]
10. M. Alhussein, K. Aurangzeb and M. Raza, “A decision support system for multimodal brain tumor classification using deep learning,” Complex & Intelligent Systems, vol. 4, pp. 1–14, 2021. [Google Scholar]
11. T. Akram, Y. -D. Zhang and M. Sharif, “Attributes based skin lesion detection and recognition: A mask RCNN and transfer learning-based deep learning framework,” Pattern Recognition Letters, vol. 143, pp. 58–66, 2021. [Google Scholar]
12. M. A. Khan, M. Sharif and T. Akram, “Pixels to classes: Intelligent learning framework for multiclass skin lesion localization and classification,” Computers & Electrical Engineering, vol. 90, pp. 106956, 2021. [Google Scholar]
13. M. S. Sarfraz, M. Alhaisoni, A. A. Albesher, S. Wang and I. Ashraf, “Stomachnet: Optimal deep learning features fusion for stomach abnormalities classification,” IEEE Access, vol. 8, pp. 197969–197981, 2020. [Google Scholar]
14. T. Akram, S. Gul, A. Shahzad, M. Altaf, S. S. R. Naqvi et al., “A novel framework for rapid diagnosis of COVID-19 on computed tomography scans,” Pattern Analysis and Applications, vol. 7, pp. 1–14, 2021. [Google Scholar]
15. S. Kadry, Y. -D. Zhang, T. Akram, M. Sharif, A. Rehman et al., “Prediction of COVID-19-pneumonia based on selected deep features and one class kernel extreme learning machine,” Computers & Electrical Engineering, vol. 90, pp. 106960, 2021. [Google Scholar]
16. A. Maqsood, M. S. Farid, M. H. Khan and M. Grzegorzek, “Deep malaria parasite detection in thin blood smear microscopic images,” Applied Sciences, vol. 11, pp. 2284, 2021. [Google Scholar]
17. F. Abdurahman, K. A. Fante and M. Aliy, “Malaria parasite detection in thick blood smear microscopic images using modified YOLOV3 and YOLOV4 models,” BMC Bioinformatics, vol. 22, pp. 1–17, 2021. [Google Scholar]
18. Q. Quan, J. Wang and L. Liu, “An effective convolutional neural network for classifying red blood cells in malaria diseases,” Interdisciplinary Sciences: Computational Life Sciences, vol. 12, pp. 217–225, 2020. [Google Scholar]
19. A. Molina, S. Alférez, L. Boldú, A. Acevedo and A. Merino, “Sequential classification system for recognition of malaria infection using peripheral blood cell images,” Journal of Clinical Pathology, vol. 73, pp. 665–670, 2020. [Google Scholar]
20. P. Pattanaik, M. Mittal, M. Z. Khan and S. Panda, “Malaria detection using deep residual networks with mobile microscopy,” Journal of King Saud University-Computer and Information Sciences, vol. 12, pp. 1–20, 2020. [Google Scholar]
21. M. Masud, H. Alhumyani, S. S. Alshamrani, O. Cheikhrouhou, S. Ibrahim et al., “Leveraging deep learning techniques for malaria parasite detection using mobile application,” Wireless Communications and Mobile Computing, vol. 2020, pp. 1–16, 2020. [Google Scholar]
22. I. Ersoy, F. Bunyak, J. M. Higgins and K. Palaniappan, “Coupled edge profile active contours for red blood cell flow analysis,” in 2012 9th IEEE Int. Symposium on Biomedical Imaging (ISBINY, USA, pp. 748–751, 2012. [Google Scholar]
23. N. Hussain, A. Majid, M. Alhaisoni, S. A. C. Bukhari, S. Kadry et al., “Classification of positive COVID-19 CT scans using deep learning,” Computers, Materials and Continua, vol. 66, pp. 1–15, 2021. [Google Scholar]
24. M. A. Khan, M. Qasim, H. M. J. Lodhi, M. Nazir, K. Javed et al., “Automated design for recognition of blood cells diseases from hematopathology using classical features selection and ELM,” Microscopy Research and Technique, vol. 84, pp. 202–216, 2021. [Google Scholar]
25. I. Ashraf, M. Alhaisoni, R. Damaševičius, R. Scherer, A. Rehman et al., “Multimodal brain tumor classification using deep learning and robust feature selection: A machine learning application for radiologists,” Diagnostics, vol. 10, pp. 565, 2020. [Google Scholar]
26. A. Rehman, T. Saba, Z. Mehmood, U. Tariq and N. Ayesha, “Microscopic brain tumor detection and classification using 3D CNN and feature selection architecture,” Microscopy Research and Technique, vol. 84, pp. 133–149, 2021. [Google Scholar]
27. K. Leon, D. Mery, F. Pedreschi and J. Leon, “Color measurement in L∗ a∗ b∗ units from RGB digital images,” Food Research International, vol. 39, pp. 1084–1091, 2006. [Google Scholar]
28. C. Kumah, N. Zhang, R. K. Raji and R. Pan, “Color measurement of segmented printed fabric patterns in lab color space from RGB digital images,” Journal of Textile Science and Technology, vol. 5, pp. 1–18, 2019. [Google Scholar]
29. H. Arshad, M. I. Sharif, M. Yasmin, J. M. R. Tavares, Y. D. Zhang et al., “A multilevel paradigm for deep convolutional neural network features selection with an application to human gait recognition,” Expert Systems, vol. 21, pp. e12541, 2020. [Google Scholar]
30. S. Kadry, M. Alhaisoni, Y. Nam, Y. Zhang, V. Rajinikanth et al., “Computer-aided gastrointestinal diseases analysis from wireless capsule endoscopy: A framework of best features selection,” IEEE Access, vol. 8, pp. 132850–132859, 2020. [Google Scholar]
31. A. Majid, M. Yasmin, A. Rehman, A. Yousafzai and U. Tariq, “Classification of stomach infections: A paradigm of convolutional neural network along with classical features fusion and selection,” Microscopy Research and Technique, vol. 83, pp. 562–576, 2020. [Google Scholar]
32. K. J. Kim, P. K. Kim, Y. S. Chung and D. H. Choi, “Performance enhancement of YOLOv3 by adding prediction layers with spatial pyramid pooling for vehicle detection,” in 2018 15th IEEE Int. Conf. on Advanced Video and Signal Based Surveillance, Las Vegas, USA, pp. 1–6, 2018. [Google Scholar]
33. G. Huang, Z. Liu, L. Van Der Maaten and K. Q. Weinberger, “Densely connected convolutional networks,” in Proc. of the IEEE Conf. on Computer Vision and Pattern Recognition, NY, USA, pp. 4700–4708, 2017. [Google Scholar]
34. S. J. Pan and Q. Yang, “A survey on transfer learning,” IEEE Transactions on Knowledge and Data Engineering, vol. 22, pp. 1345–1359, 2009. [Google Scholar]
35. S. Mirjalili and A. Lewis, “The whale optimization algorithm,” Advances in Engineering Software, vol. 95, pp. 51–67, 2016. [Google Scholar]
36. N. Singla and V. Srivastava, “Deep learning enabled multi-wavelength spatial coherence microscope for the classification of malaria-infected stages with limited labelled data size,” Optics & Laser Technology, vol. 130, pp. 106335, 2020. [Google Scholar]
 | This work is licensed under a Creative Commons Attribution 4.0 International License, which permits unrestricted use, distribution, and reproduction in any medium, provided the original work is properly cited. |