DOI:10.32604/cmc.2022.019122
| Computers, Materials & Continua DOI:10.32604/cmc.2022.019122 | |
| Article |
Type II Fuzzy Logic Based Cluster Head Selection for Wireless Sensor Network
1Department of Computer Science & Engineering, St. Joseph’s College of Engineering, Chennai, 600119, India
2School of Computing Science and Engineering, Galgotias University, Uttar Pradesh, 203201, India
3Department of Electrical and Electronics Engineering, K. Ramakrishnan College of Engineering, Tiruchirappalli, 621112, India
4Department of Computer Science & Engineering, Bharath Institute of Higher Education and Research, Chennai, 600073, India
5Department of Computer Science and Information Technology, Abu Dhabi University, Abu Dhabi, 59911, United Arab Emirates
6College of Computer Information Technology, American University in the Emirates, Dubai, United Arab Emirates
7Faculty of Computers and Information, Mansoura University, Egypt
*Corresponding Author: J. Jean Justus. Email: jeanjraj@gmail.com
Received: 03 April 2021; Accepted: 23 May 2021
Abstract: Wireless Sensor Network (WSN) forms an essential part of IoT. It is embedded in the target environment to observe the physical parameters based on the type of application. Sensor nodes in WSN are constrained by different features such as memory, bandwidth, energy, and its processing capabilities. In WSN, data transmission process consumes the maximum amount of energy than sensing and processing of the sensors. So, diverse clustering and data aggregation techniques are designed to achieve excellent energy efficiency in WSN. In this view, the current research article presents a novel Type II Fuzzy Logic-based Cluster Head selection with Low Complexity Data Aggregation (T2FLCH-LCDA) technique for WSN. The presented model involves a two-stage process such as clustering and data aggregation. Initially, three input parameters such as residual energy, distance to Base Station (BS), and node centrality are used in T2FLCH technique for CH selection and cluster construction. Besides, the LCDA technique which follows Dictionary Based Encoding (DBE) process is used to perform the data aggregation at CHs. Finally, the aggregated data is transmitted to the BS where it achieves energy efficiency. The experimental validation of the T2FLCH-LCDA technique was executed under three different scenarios based on the position of BS. The experimental results revealed that the T2FLCH-LCDA technique achieved maximum energy efficiency, lifetime, Compression Ratio (CR), and power saving than the compared methods.
Keywords: Clustering; data aggregation; energy consumption; cluster head selection; wireless sensor networks
Wireless Sensor Networks (WSN), a kind of wireless network, are composed of several isolated and small sensors placed in a target field. These sensors interact with one another through wireless connections [1]. Sensor is nothing but an inexpensive device termed as mote/node which performs with restricted features based on energy assets and calculation ability. The recent developments in wireless communication technology and microelectronics expanded the application of this technique through several WSN applications. There is a drastic growth experienced in WSN applications in the recent years [2]. WSNs are widely applied in agriculture, industries, environment, defense, healthcare and smart city environment. Some of the instances where WSN is applied include smart grids [3] and health care [4]. The major goal of WSN sensors is to observe few physical parameters in their respective platforms and transmit the values to base station that collects the data for further processing. The last device in WSN is Base Station (BS) sink or gateway.
Base Station (BS) is generally linked to power grid and can perform complex calculations. To be accurate, the power assets in sensors are restricted to WSN due to which it ensures the proper functioning of the network. However, it collects all the necessary data and transmits the same to BS. Thus, the most common problem of WSN is its lifetime. So efforts are taken to raise the lifetime of network to avoid the battery of nodes from getting wasted, while attaining unwanted processes. Clustering is one of the most beneficial methods to increase the lifetime of networks, while conventional routing is a better candidate for huge networks. Among a bunch of nodes, a few of them are selected as Cluster Heads (CH) [5]. CHs collect the information from related nodes which are otherwise cited as ‘contributing nodes’. The nodes that transmit their measurements to CH are generally present nearby the CH. Later, all the CHs aggregate the data from its sets and transmits the data to BS. This method prevents every node from getting exhausted. This is because the transmission does not occurs directly to BS as this process reduces their battery lifetime quickly, due to nonlinear dependency of the power loss with distance.
WSN consumes less energy for calculation than data transmission. Instead of transferring the sensed data to sink node separately every time, the data is initially gathered and combined by aggregate functions like avg( ), sum( ), and so on. Then, it is sent to sink node where several energies can be stored. The efficiency of the transmission between nodes is decided based on data aggregate method. Data aggregation is an essential process to reduce the consumption of energy and store the constrained assets. An efficient data aggregation method can improve energy effectiveness and lifetime of the network [6].
The current research article presents a novel Type-II fuzzy Logic-Based Cluster Head selection with Low Complexity Data Aggregation (T2FLCH-LCDA) technique for WSN. The presented model includes a two-stage process such as clustering and data aggregation. At first, three input parameters namely, Residual Energy (RE), distance to base station (DBS), and node centrality (NC) are used for CH selection and cluster construction in T2FLCH technique. In addition, the LCDA technique encompasses a Dictionary Based Encoding (DBE) process to achieve data aggregation at the CHs. At last, the aggregated data is transmitted to BS where it achieves the energy efficiency. The proposed T2FLCH-LCDA technique was simulated under three dissimilar scenarios based on the position of BS and the results are present in upcoming sections.
Clustering process can be executed through Artificial Intelligence (AI). Mainly, Fuzzy Rule Based Systems (FRBS) emphasize the clustering process as an appropriate method to decide the nodes that may act as the CH. Such system is applied in different fields to find the right candidate, whenever there is a need. For clustering, Moorthi et al. [7] defined a particle optimization method depending on LEACH protocol. Agrawal et al. [8] utilized an FL Type-1 distributed method with two outputs. In this method, the initial outcomes determine the sent radius of the transmitted message whereas the next one decides whether a node would become a CH or not. Cluster head Election using FL (CHEF) is one of the primary centralized techniques which utilizes the expert system [9]. The BS implements a FL Type-1 process to select the node that acts as CH in every event. In Zhang et al. [10], the BS chooses the optimum node depending upon fuzzy type-2 method.
In Heinzelman et al. [11], BS obtains the data about location and energy of the nodes. Later, the base station follows simulated annealing method to decide the node that can organize itself as a CH. Thangaramya et al. [12] defined a centralized technique which followed an extremely complicated method. Particularly, Convolutional Neural Network (CNN) was used to determine the optimum CH. Shivappa et al. [13] introduced a centralized method in which the BS utilizes AI as FCM to define the optimum position center for all the clusters. Merabtine et al. [14] demonstrated a centralized technique in which PSO was utilized for selecting the optimum CH. Abidoye et al. [15] emphasized the importance of IoT in WSN. This energy efficient method was proposed for allowing a service-oriented application in IoT-enabled WSN field under two phases. In initial phase, clustering-based method is utilized to serve the application whereas in the subsequent phase, an energy aware method was implemented. These methods were predominantly better though it remained insufficient for IoT networks. Further, their efficiency was poor in case of static networks. Li et al. [16] presented a comprehensive research on IoT networks in which the researchers introduced Analytical Hierarchy Procedure (AHP) and fuzzy-based energy management system for the organization of industrial tools. In Kasana et al. [17], fuzzy-based vehicular physical methods were investigated upon Internet of Vehicles (IoV) utilizing fuzzy architecture with Markov chain in order to optimize the location-oriented channel access delay.
Hu et al. [18] proposed an additional feature of IoV that allows transmission to occur at the edge using FL. Clustering Head or gateways were selected with the help of few parameters such as antenna height, fuzzy variable velocity, and vehicle neighboring density. Kaiwartya et al. [19] proposed a genetic virtualization method as a technique to overcome the torrent delay and minimize the energy consumption in IoT-allowed sensor networks. Kaiwartya et al. [20] presented a method which was utilized for appropriate placement of nodes to connect and the method was used for agricultural purposes. There are two techniques followed to place the nodes depending on seven metrics which calculate the quality measurement of sensor nodes. Delgado et al. [21] introduced a distributed method to create a dynamic cluster. However, it is rarely supported by the BS. Particularly, the BS sends three messages in network lifetime to reconfigure the skipped value of network.
3 The Proposed T2FLCH-LCDA Technique
The workflow involved in the proposed T2FLCH-LCDA technique is shown in Fig. 1. According to the figure, the nodes are randomly deployed in target region. Then, the initialization of nodes occurs after which CH selection process is executed by following T2FLCH technique. Once the CHs are selected, the nodes nearby the CHs join the CHs and form clusters. Then, the CM transmits the data to CH which then performs data aggregation using LCDA technique. Finally, the aggregated data is transmitted to the BS.

Figure 1: The working process of T2FLCH-LCDA model
Assume a network of N nodes that are randomly deployed in the target area to sense the physical parameters in environment. Here, the clustering process occurs according to T2FLCH technique. Every cluster has only one CH that receives the data from its respective CMs. The nodes are static and homogeneous in nature i.e., possess identical initial energy and are able to sense the region, process the sensed data, and transmit it. The radio links present among the nodes are symmetric in nature. This denotes that the node necessitates an identical amount of energy to transmit data in all the directions [22]. BS is installed at three possible locations in the target field. The sensors are able to modify the transmission power based on the distance between the recipient nodes. Packet size is deemed to be
The energy spent on receiving a packet of
where
3.2 T2FLCH Based Clustering Technique
The presented T2FLCH-based clustering technique involves three input parameters to select the CHs in WSN. Residual Energy (RE), Node Centrality (NC), and DBS are the input variables in the proposed T2FLCH-LCDA model. Residual Energy is an essential feature to signify a node as either CH or not, since CH nodes use further energy to become a member node. CH nodes gather information from the members, collates the gathered information, and transmits it to BS. In Node Centrality (NC), the total number of one-hop neighboring nodes in
In Eq. (3), ND relates to the counting of neighbors in transmission radius
where

Figure 2: The structure of T2FLCH model
The process of fuzzification is to map every individual crisp input value to a fuzzy set. In T2FLCH technique, the fuzzifier element performs the mapping of crisp input vector
and
The proposed T2FLCH technique generates a set of 27 IF-THEN rules. The rules are generally represented as given herewith.
where
3.2.3 Inference and Output Processing
This technique utilizes the Center Of Sets (COS) type-reducer that integrates the task of type-reducing and inference. Particularly, for
The
where
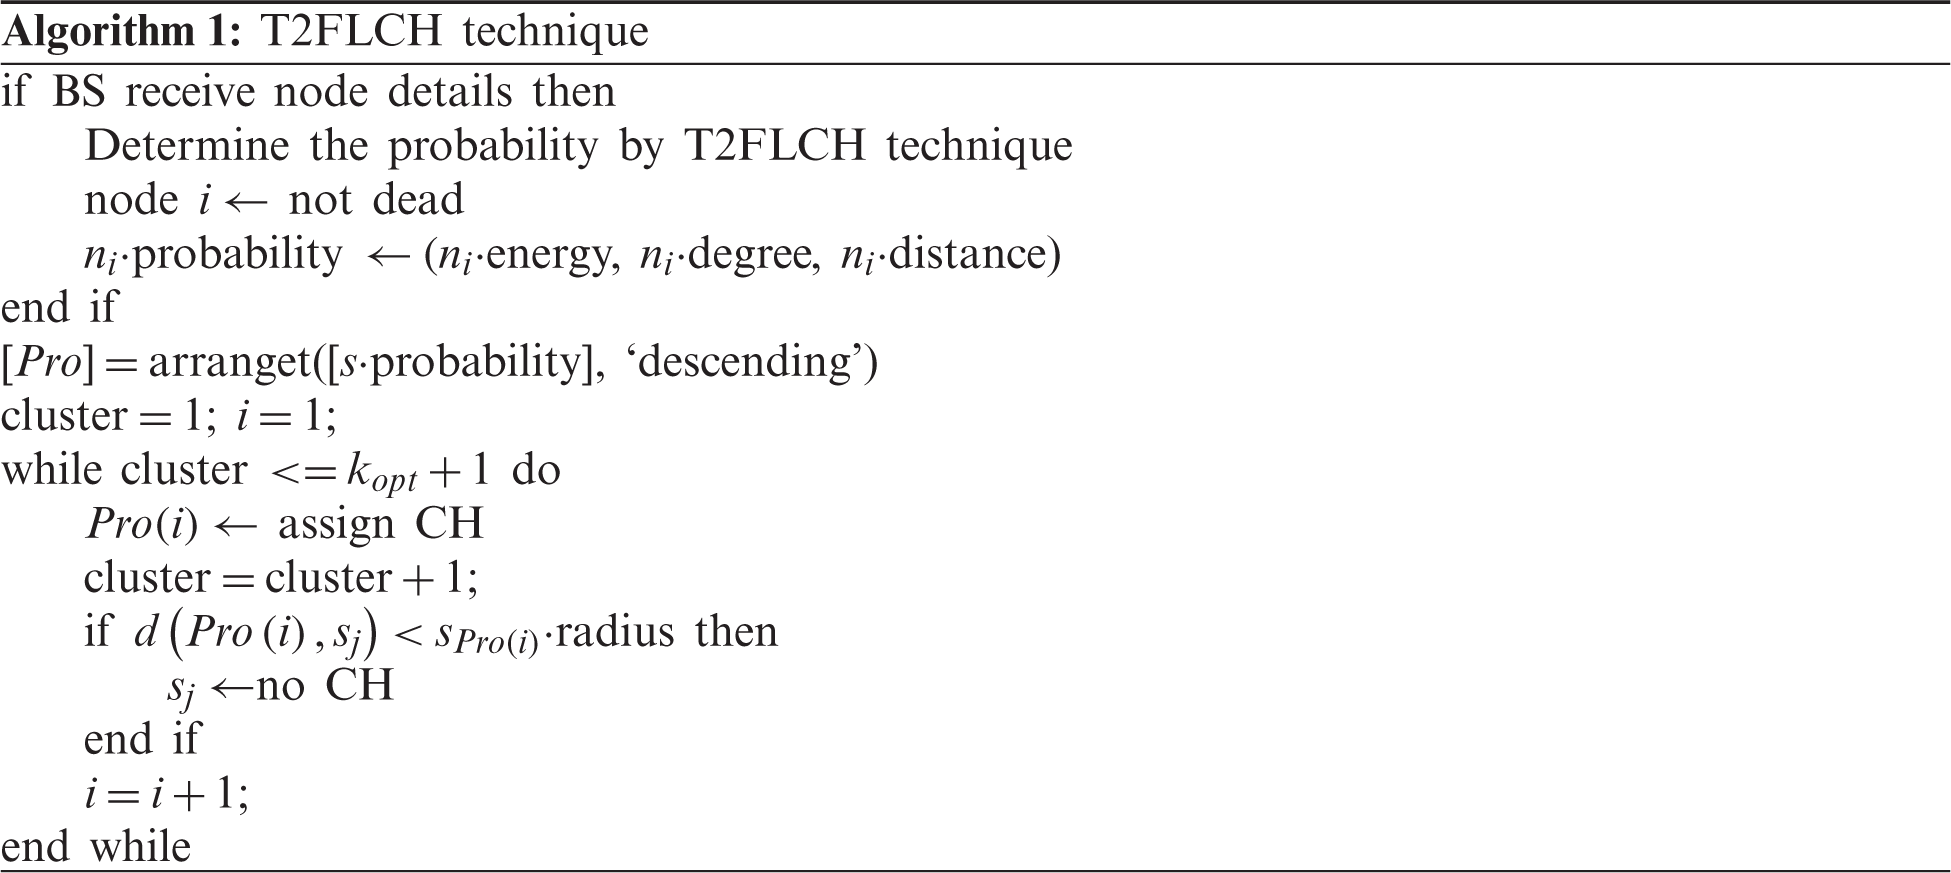
3.2.4 Cluster Head Selection Algorithm
Next to T2FLCH process, all alive nodes have their probability,
where
3.3 DBE Based Data Aggregation Technique
After the clusters are constructed, every CH executes the DBE technique to aggregate the data received from its CMs. The proposed DBE model is a bit-oriented, dictionary-based single character encoding model that utilizes Deterministic Code Allocation Dictionary (DBED) for codeword allocation to the input data. It allocates a predefined length codeword for all the characters in input data using DBED. A peculiar characteristic of DBE model is its utilization of 4-bit codeword to all possible characters that exist in the input data. When considering an input data of length N, the DBE technique desires the lowest number of
where
Primarily, the DBE model keeps DBED which holds a set of codewords for 12 possible characters (0–9 numerals, ‘,’ and ‘*’) that exist in WSN. It significantly assists in the reduction of complexity of the presented technique. Besides, astreik (*) is employed as a delimiting element and is employed in the detection of endpoint of every sample. DBED encompasses a static 4-bit codeword for 12 characters which eliminates the necessity of delimiting elements for characters. DBED is kept at fixed value at both transmitter and receiver sides apriori. Upon receiving the input data, the DBE model utilizes DBED and allots respective codewords. Next to the assignment of codewords, merging process occurs to generate a compressed file. At last, the resulting optimum codewords of the encoded characters undergo concatenation to generate the compressed file which includes only 50% of its actual size. This is also communicated to the receiving end. Fig. 3 illustrates the existing codewords in DBED.

Figure 3: The predefined codewords in DBED
This section validates the efficiency of the proposed T2FLCH-LCDA model against existing methods. The results were examined under three distinct scenarios and on the basis of location of the BS. BS is located at the center of WSN in first scenario whereas it is exterior to WSN in the second scenario, though not very far from the monitored area. In third scenario, the BS is positioned far away from the WSN. In order to detect the aggregation performance of LCDA technique, a set of simulations was performed on benchmark WSN dataset.
4.1 Energy Efficiency Analysis
Fig. 4 depicts the results from energy consumption analysis of the proposed T2FLCH-LCDA model against existing methods under scenario 1. The figure demonstrates that the LEACH model consumed the maximum amount of energy than other methods. Followed by, the EEUC model consumed a slightly low energy over LEACH, but not lower than other methods. Next to that, PEGASIS model accomplished a moderate energy consumption per round which remained uniform over several rounds of execution. Then, CRT1FLACO and CRT2FLACO techniques demonstrated closer and competitive energy consumption outcomes. But the presented T2FLCH-LCDA technique consumed the least amount of energy, compared to existing techniques, over several rounds of execution.

Figure 4: The energy consumption analysis of T2FLCH-LCDA model under scenario 1

Figure 5: The energy consumption analysis of T2FLCH-LCDA model under scenario 2
Fig. 5 illustrates the results attained from energy consumption analysis of T2FLCH-LCDA model against existing methods under scenario 2. The figure showcases that the LEACH model consumed the maximum amount of energy compared to all other methods. Followed by, EEUC model consumed somewhat lesser energy than LEACH, but not lower than other methods. Next to that, PEGASIS model consumed a moderate amount of energy per round which remained uniform over several rounds of execution. Afterward, CRT1FLACO and CRT2FLACO models demonstrated closer and competitive energy consumption outcomes. But the presented T2FLCH-LCDA approach consumed the least amount of energy, compared to existing methods, over several rounds of execution.
Fig. 6 demonstrates the results accomplished from energy consumption analysis of T2FLCH-LCDA technique against existing methods under scenario 3. The figure demonstrates that the LEACH model consumed the maximum amount of energy compared to all other methods. Then, EEUC model reduced its energy consumption over LEACH model, but not less than other methods. Next to that, the PEGASIS method accomplished a uniform and moderate energy consumption across several rounds of execution. Then, CRT1FLACO and CRT2FLACO approaches demonstrated closer and competitive energy consumption outcomes. But the proposed T2FLCH-LCDA technique exhibited the least energy consumption, compared to other models, over several rounds of execution.

Figure 6: The energy consumption analysis of T2FLCH-LCDA model under scenario 3
Tab. 1 shows the network lifetime analysis results for the proposed T2FLCH-LCDA model in terms of FND, HND, and LND.
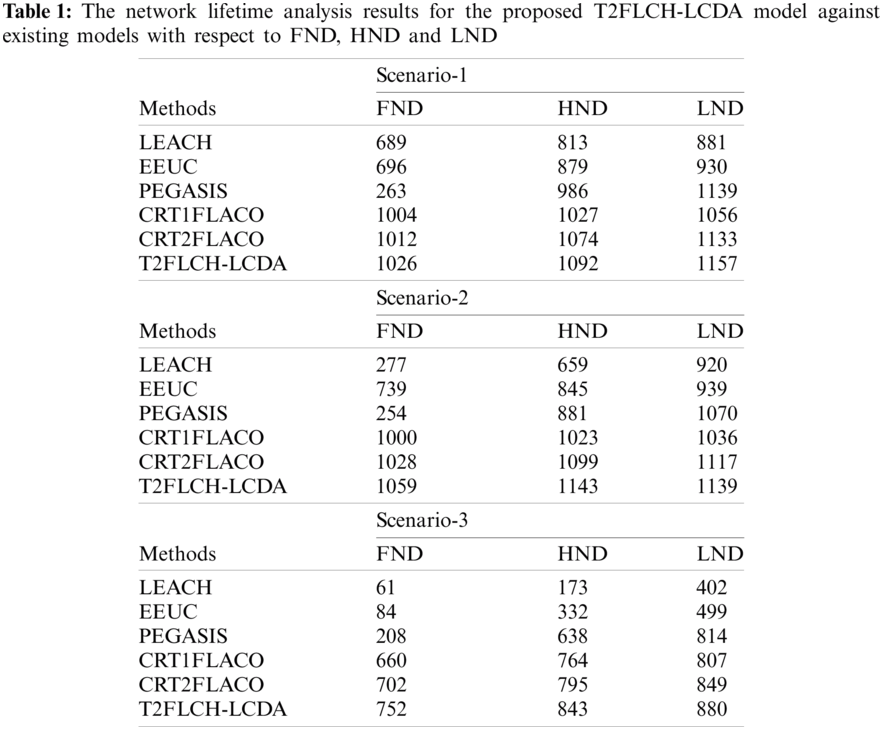
Fig. 7 portrays the results from network lifetime analysis of T2FLCH-LCDA model under scenario 1. From the figure, it can be understood that the LEACH model offered ineffective outcomes with least FND, HND, and LND values from 689, 813, and 881 rounds respectively. Followed by, EEUC technique accomplished a slightly higher outcome with FND, HND, and LND values from 696, 879, and 930 rounds respectively. Next to that, the PEGASIS model showcased a certainly improved lifetime with FND, HND, and LND values from 263, 986, and 1139 rounds respectively. Meanwhile, the CRT1FLACO model accomplished a moderate lifetime with its FND, HND, and LND values from 1004, 1027, and 1056 rounds respectively. Furthermore, the CRT2FLACO model achieve a reasonable lifetime with FND, HND, and LND values from 1012, 1074, and 1133 rounds respectively. However, the T2FLCH-LCDA model accomplished the maximum lifetime with FND, HND, and LND values from 1026, 1092, and 1157 rounds respectively.

Figure 7: The network lifetime analysis of T2FLCH-LCDA model on scenario 1
Fig. 8 examines the network lifetime analysis of the proposed T2FLCH-LCDA model under scenario 2. From the figure, it can be understood that the LEACH method offered ineffective results with minimum FND, HND, and LND values from 277, 659, and 920 rounds respectively. Then, the EEUC technique accomplished a slightly higher outcome with its FND, HND, and LND values from 739, 845, and 939 rounds correspondingly. Then, the PEGASIS model showcased a certainly higher lifetime with FND, HND, and LND values from 254, 881, and 1070 rounds correspondingly. Followed by, CRT1FLACO model accomplished a moderate lifetime with FND, HND, and LND values from 1000, 1023, and 1036 rounds respectively. Furthermore, the CRT2FLACO model attained a reasonable lifetime with FND, HND, and LND values from 1028, 1099, and 1117 rounds respectively. However, the proposed T2FLCH-LCDA approach produced a superior lifetime with FND, HND, and LND values from 1059, 1143, and 1139 rounds correspondingly.

Figure 8: The network lifetime analysis of T2FLCH-LCDA model on scenario 2
Fig. 9 inspects the network lifetime analysis results of the proposed T2FLCH-LCDA model under scenario 3. From the figure, it can be inferred that the LEACH model offered an ineffective outcome with the least FND, HND, and LND values from 61, 173, and 402 rounds respectively. In line with this, EEUC technique somewhat accomplished a higher result with FND, HND, and LND values from 84, 332, and 499 rounds respectively. The PEGASIS model, on the other hand, showcased a certainly improved lifetime with FND, HND, and LND values from 208, 638, and 814 rounds respectively. Meanwhile, the CRT1FLACO technique accomplished a moderate lifetime with FND, HND, and LND values from 660, 764, and 807 rounds correspondingly. Furthermore, the CRT2FLACO model attained a reasonable lifetime with FND, HND, and LND values from 702, 795, and 849 rounds respectively. However, the proposed T2FLCH-LCDA model produced a higher lifetime with FND, HND, and LND values from 752, 843, and 880 rounds correspondingly.

Figure 9: The network lifetime analysis of T2FLCH-LCDA model on scenario 3
4.3 Compression Ratio Analysis
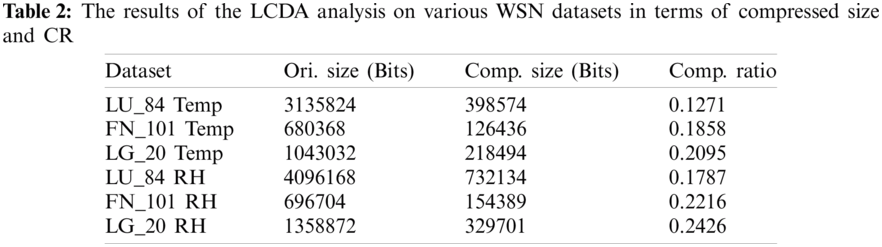
Tab. 2 illustrates the results for compressed size and CR analysis of LCDA model on the applied WSN datasets. From the table, it is apparent that the LCDA model exhibited the optimal performance in terms of compressed size and CR. For instance, for test LU_84 Temp dataset, the LCDA model compressed the file size of 3135824 bits into 398574 bits with a CR of 0.1271. In case of test FN_101 Temp dataset, the LCDA model compressed the file size of 680368 bits into 126436 bits with a CR of 0.1858. In case of test LG_20 Temp dataset, the LCDA method compressed the file size of 1043032 bits into 218494 bits with a CR of 0.2095. In line with this, test LU_84 RH dataset was compressed by LCDA approach from a file size of 4096168 bits into 732134 bits with a CR of 0.1787. Meantime, on the test FN_101 RH dataset, the LCDA approach compressed the file size of 696704 bits into 154389 bits with a CR of 0.2216. At last, test LG_20 RH dataset file size was compressed by LCDA technique from 1358872 bits into 329701 bits with a CR of 0.2426.
The results of the detailed power saving analysis of LCDA model with existing data aggregation techniques are shown in Fig. 10.

Figure 10: The power saving analysis of LCDA model
From the obtained values, it is inferred that the LCDA model showcased superior power saving performance over other methods. For test LU 84 Temp dataset, LCDA technique achieved the maximum power saving of 92.74%, whereas the LCE, S-LZW, ALDC, and FELACS techniques resulted in minimum power saving such as 66.62%, 41.69%, 70.07%, and 70.61% respectively. In case of test FN 101 Temp dataset, a high power saving of 89.38% was accomplished by the proposed LCDA model, whereas the LCE, S-LZW, ALDC, and FELACS techniques saved lesser energy such as 60.41%, 20.38%, 62.55%, and 62.90% correspondingly. Besides, for the test LG 20 Temp dataset, a maximum power saving of 88.03% was attained by the proposed LCDA technique, whereas the LCE, S-LZW, ALDC, and FELACS models achieved lesser power saving such as 47.16%, 10.88%, 50.74%, and 51.30% respectively. Further, for test LU 84 RH dataset, a maximal power saving of 88.08% was accomplished by LCDA technique, whereas the LCE, S-LZW, ALDC, and FELACS methodologies accomplished a minimal power saving of 49.06%, 8.323%, 54.05%, and 54.83% respectively.
Simultaneously, on test FN 101 RH dataset, a maximum power saving of 85.23% was attained by the proposed LCDA technique, whereas the LCE, S-LZW, ALDC, and FELACS techniques saved less power such as 49.46%, 15.04%, 55.11%, and 56.27% correspondingly. For test LG 20 RH dataset, a superior power saving of 83.82% was reached by LCDA approach, whereas the LCE, S-LZW, ALDC, and FELACS techniques accomplished low power saving such as 30.81%, 12.57%, 37.16%, and 38.47% correspondingly. The experimental values inferred that the T2FLCH-LCDA technique achieved maximum energy efficiency, lifetime, CR, and power saving over the compared methods. The proposed model improves energy efficiency than the methods compared due to the inclusion of effective clustering technique and data aggregation approach.
The current research article presented a novel T2FLCH-LCDA technique for WSN. Primarily, the nodes are randomly used in the target region. Then, the initialization of the nodes occurs after which CH selection process is executed using T2FLCH technique. T2FLCH technique has three input parameters namely, RE, DBS, and NC which are used in CH selection and cluster construction processes. Once the CHs are selected, the nearby nodes join the CHs and form clusters. Then, the CM transmits the data to CH which performs the data aggregation process using LCDA technique. This technique is loaded with DBE process to perform data aggregation at CHs. Finally, the aggregated data is passed on to BS. The T2FLCH-LCDA technique was simulated under three dissimilar scenarios based on the position of BS. The experimental values inferred that the T2FLCH-LCDA technique achieved maximum energy efficiency, lifetime, CR, and power saving over the compared methods.
Funding Statement: The authors received no specific funding for this study.
Conflicts of Interest: The authors declare that they have no conflicts of interest to report regarding the present study.
1. S. Arjunan and P. Sujatha, “Lifetime maximization of wireless sensor network using fuzzy based unequal clustering and ACO based routing hybrid protocol,” Applied Intelligence, vol. 48, no. 8, pp. 2229–2246, 2017. [Google Scholar]
2. F. Hajjej, M. Hamdi, R. Ejbali and M. Zaied, “A distributed coverage hole recovery approach based on reinforcement learning for wireless sensor networks,” Ad Hoc Networks, vol. 101, no. 4, pp. 1–41, 2020. [Google Scholar]
3. M. Abujubbeh, F. A. Turjman and M. Fahrioglu, “Software-defined wireless sensor networks in smart grids: An overview,” Sustainable Cities and Society, vol. 51, no. July, pp. 1–18, 2019. [Google Scholar]
4. S. Arjunan and P. Sujatha, “A survey on unequal clustering protocols in wireless sensor networks,” Journal of King Saud University-Computer and Information Sciences, vol. 31, no. 3, pp. 304–317, 2019. [Google Scholar]
5. D. Gupta, A. Khanna, S. K. Lakshmanaprabu, K. Shankar, V. Furtado et al., “Efficient artificial fish swarm based clustering approach on mobility aware energy-efficient for MANET,” Transactions on Emerging Telecommunications Technologies, vol. 30, no. 9, pp. e3524, 2019. [Google Scholar]
6. J. Uthayakumar, T. Vengattaraman and P. Dhavachelvan, “A new lossless neighborhood indexing sequence (NIS) algorithm for data compression in wireless sensor networks,” Ad Hoc Networks, vol. 83, no. 2009, pp. 149–157, 2019. [Google Scholar]
7. M. Moorthi and R. Thiagarajan, “Energy consumption and network connectivity based on novel-LEACH-POS protocol networks,” Computer Communications, vol. 149, no. 1, pp. 90–98, 2020. [Google Scholar]
8. D. Agrawal and S. Pandey, “FUCA: Fuzzy-based unequal clustering algorithm to prolong the lifetime of wireless sensor networks,” International Journal of Communication Systems, vol. 31, no. 2, pp. 1–18, 2017. [Google Scholar]
9. I. Gupta, D. Riordan and Srinivas Sampalli, “Cluster-head election using fuzzy logic for wireless sensor networks,” in 3rd Annual Communication Networks and Services Research Conf., Halifax, NS, Canada, pp. 255–260, 2005. [Google Scholar]
10. F. Zhang, Q. Zhang and Z. Sun, “ICT2TSK: An improved clustering algorithm for WSN using a type-2 Takagi–Sugeno–Kang fuzzy logic system,” in 2013 IEEE Symp. on Wireless Technology & Applications, Kuching, Malaysia, pp. 153–158, 2013. [Google Scholar]
11. W. Heinzelman, A. Chandrakasan and H. Balakrishnan, “An application-specific protocol architecture for wireless microsensor networks,” IEEE Transactions on Wireless Communications, vol. 1, no. 4, pp. 660–670, 2002. [Google Scholar]
12. K. Thangaramya, K. Kulothungan, R. Logambigai, M. Selvi, S. Ganapathy et al., “Energy aware cluster and neuro-fuzzy based routing algorithm for wireless sensor networks in IoT,” Computer Networks, vol. 151, no. 12, pp. 211–223, 2019. [Google Scholar]
13. N. Shivappa and S. Manvi, “Fuzzy-based cluster head selection and cluster formation in wireless sensor networks,” IET Networks, vol. 8, no. 6, pp. 390–397, 2019. [Google Scholar]
14. N. Merabtine, D. Djenouri, D. Zegour, B. Boumessaidia and A. Boutahraoui, “Balanced clustering approach with energy prediction and round-time adaptation in wireless sensor networks,” International Journal of Communication Networks and Distributed Systems, vol. 22, no. 3, pp. 245–274, 2019. [Google Scholar]
15. A. Abidoye and I. Obagbuwa, “Models for integrating wireless sensor networks into the internet of things,” IET Wireless Sensor Systems, vol. 7, no. 3, pp. 65–72, 2017. [Google Scholar]
16. Y. Li, Z. Sun, L. Han and N. Mei, “Fuzzy comprehensive evaluation method for energy management systems based on an internet of things,” IEEE Access, vol. 5, pp. 21312–21322, 2017. [Google Scholar]
17. R. Kasana, S. Kumar, O. Kaiwartya, R. Kharel, J. Lloret et al., “Fuzzy-based channel selection for location oriented services in multichannel VCPS environments,” IEEE Internet of Things Journal, vol. 5, no. 6, pp. 4642–4651, 2018. [Google Scholar]
18. Q. Hu, C. Wu, X. Zhao, X. Chen, Y. Ji et al., “Vehicular multi-access edge computing with licensed sub-6 GHz, IEEE 802.11p and mmwave,” IEEE Access, vol. 6, pp. 1995–2004, 2018. [Google Scholar]
19. O. Kaiwartya, A. H. Abdullah, Y. Cao, J. Lloret, S. Kumar et al., “Virtualization in wireless sensor networks: Fault tolerant embedding for internet of things,” IEEE Internet of Things Journal, vol. 5, no. 2, pp. 571–580, 2018. [Google Scholar]
20. O. Kaiwartya, A. H. Abdullah, Y. Cao, R. S. Raw, S. Kumar et al., “T-MQM: Testbed based multi-metric quality measurement of sensor deployment for precision agriculture-a case study,” IEEE Sensors Journal, vol. 16, no. 23, pp. 8649–8664, 2016. [Google Scholar]
21. A. Y. Delgado, J. C. Martinez and A. T. Cabrera, “A distributed clustering algorithm guided by the base station to extend the lifetime of wireless sensor networks,” Sensors, vol. 20, no. 8, pp. 1–18, 2020. [Google Scholar]
22. P. K. Kashyap, S. Kumar, U. Dohare, V. Kumar and R. Kharel, “Green computing in sensors-enabled internet of things: Neuro fuzzy logic-based load balancing,” Electronics, vol. 8, no. 4, pp. 1–22, 2019. [Google Scholar]
23. B. Balakrishnan and S. Balachandran, “FLECH: Fuzzy logic based energy efficient clustering hierarchy for nonuniform wireless sensor networks,” Wireless Communications and Mobile Computing, vol. 2017, no. 3, pp. 1–13, 2017. [Google Scholar]
24. W. Xie, Q. Zhang, Z. Sun and F. Zhang, “A clustering routing protocol for WSN based on type-2 fuzzy logic and ant colony optimization,” Wireless Personal Communications, vol. 84, no. 2, pp. 1165–1196, 2015. [Google Scholar]
25. G. Kadiravan, P. Sujatha, T. Asvany, R. Punithavathi, M. Elhoseny et al., “Metaheuristic clustering protocol for healthcare data collection in mobile wireless multimedia sensor networks,” Computers, Materials & Continua, vol. 66, no. 3, pp. 3215–3231, 2021. [Google Scholar]
 | This work is licensed under a Creative Commons Attribution 4.0 International License, which permits unrestricted use, distribution, and reproduction in any medium, provided the original work is properly cited. |