DOI:10.32604/cmc.2022.019167
| Computers, Materials & Continua DOI:10.32604/cmc.2022.019167 | |
| Article |
Improving Routine Immunization Coverage Through Optimally Designed Predictive Models
1Faculty of Electrical and Computer Engineering, NED University of Engineering and Technology, Karachi, 75270, Pakistan
2Department of Pediatrics and Child Health, Aga Khan University, Karachi, 74800, Pakistan
3Surrey Business School, University of Surrey, Guildford, GU2 7XH, United Kingdom
4Neurocomputation Lab, National Centre of Artificial Intelligence, NED University of Engineering &Technology, Karachi, 75270, Pakistan
5Faculty of IT and Design, The Hague University of Applied Sciences, 2521 EN, The Hague, The Netherlands
*Corresponding Author: Majida Kazmi. Email: majidakazmi@neduet.edu.pk
Received: 04 April 2021; Accepted: 08 May 2021
Abstract: Routine immunization (RI) of children is the most effective and timely public health intervention for decreasing child mortality rates around the globe. Pakistan being a low-and-middle-income-country (LMIC) has one of the highest child mortality rates in the world occurring mainly due to vaccine-preventable diseases (VPDs). For improving RI coverage, a critical need is to establish potential RI defaulters at an early stage, so that appropriate interventions can be targeted towards such population who are identified to be at risk of missing on their scheduled vaccine uptakes. In this paper, a machine learning (ML) based predictive model has been proposed to predict defaulting and non-defaulting children on upcoming immunization visits and examine the effect of its underlying contributing factors. The predictive model uses data obtained from Paigham-e-Sehat study having immunization records of 3,113 children. The design of predictive model is based on obtaining optimal results across accuracy, specificity, and sensitivity, to ensure model outcomes remain practically relevant to the problem addressed. Further optimization of predictive model is obtained through selection of significant features and removing data bias. Nine machine learning algorithms were applied for prediction of defaulting children for the next immunization visit. The results showed that the random forest model achieves the optimal accuracy of 81.9% with 83.6% sensitivity and 80.3% specificity. The main determinants of vaccination coverage were found to be vaccine coverage at birth, parental education, and socio-economic conditions of the defaulting group. This information can assist relevant policy makers to take proactive and effective measures for developing evidence based targeted and timely interventions for defaulting children.
Keywords: Machine learning; predictive models; routine immunization; vaccine coverage; pakistan; optimization; SMOTE
Routine Immunization (RI) plays an essential role in minimizing the global child morbidity and mortality rates by saving up to 2–3 million deaths globally each year [1]. However, 1.5 million still die due to vaccine preventable diseases (VPDs) annually [2]. It was estimated that 50% child deaths in Pakistan under one year of age have occurred due to VPDs [3]. The problem is not limited to only Pakistan or other LMICs rather it is also prevalent in regions of developed countries like the United States where they have adopted interventions such as recall/reminders to improve RI coverage [4]. The recent COVID-19 outbreak has added challenges regarding the RI coverage around the globe. Several vaccination campaigns are at risk for delay or cancellation that will ultimately triggers the outbreaks of VPDs in 2020 and beyond [5]. World Health Organization (WHO) data on RI coverage shows that more than 117 million children are at risk of missing measles vaccines alone [6]. Approximately 2 million additional children around the globe under the age of five are at risk of dying in the next 12 months due to low RI rates.
In Pakistan context, despite the government efforts to provide free vaccination through the Expanded Programme on Immunization (EPI) initiatives, polio remains endemic in the country. Its major reasons are low vaccine coverage, lack of understanding, awareness, and education among parents and other stake holders regarding the need and importance of completing the series of vaccines in RI. Some other logistics, cultural, social, and economic factors may also contribute to exacerbate the situation [7,8]. Concerned authorities have shown great interest to address this problem and taking necessary actions for improving RI coverage. Therefore, WHO aims to make RI vaccines available to everyone, and everywhere by 2030 with their global immunization agenda [9].
New innovative technologies can play a vital role in increasing overall RI coverage by providing information to take proactive and effective measures. With the emergence of modern tools for data analytics, it has now become much more convenient to study and analyze healthcare challenges for timely intervention, prediction, and prevention [10]. The use of machine learning (ML) tools has opened new doors of opportunities which can further help in minimizing the human effort for performing critical analysis, predicting the outcomes, and making intelligent decisions. This study makes use of the predictive analytics to improve RI by identifying defaulting and non-defaulting group of children early at the time of their birth.
The proposed prediction model is optimally designed to achieve better accuracy along with high sensitivity and specificity rates. Several ML algorithms were tested and evaluated before selecting random forest as the most optimal algorithm. The results of selected prediction model are further enhanced by removing data bias using Synthetic Minority Oversampling Techniques (SMOTE) [11] and selection of useful features. The balanced approach with respect to accuracy, sensitivity and specificity ensure that model outcomes remain practically relevant to the problem addressed. Rest of the paper is organized as follows: Section 2 discusses related works followed by methodology in Section 3. In later Section 4, Section 5 and Section 6, experimental results, discussion and comparison of study findings and conclusion is reported respectively.
Several studies have been conducted to improve RI coverage through different technological interventions. Each study has utilized different tools, methodologies, and datasets of different demographics to present the findings of their research. Therefore, the study objectives and outcomes also vary accordingly with their requirements. Zhu et al. [12] developed a clinical decision support system (CDSS) for scheduling the timelines and recommendations of RI vaccines using two CDSS algorithms for data of Regenstrief Medical Record System (RMRS). The study results showed an agreement rate of 81.3% and 90.6% for the eligible and recommended timelines compared to those recommended by domain experts. Another work was done by Abegaz et al. [13] where they have predicted Tetanus Toxoid (TT) immunization in women of childbearing age in Ethiopia. Among different ML algorithms, Multi-Layer Perceptron (MLP) classifier proved to be the best with an accuracy of 67.28%. Shastri et al. [14] presented a model to classify districts of Jammu and Kashmir based on low and high infant mortality regions. They have used children immunization data for classification and used Bayesian Transductive Adversarial Networks (TAN) and Naïve Bayes algorithms for classification. Bayesian TAN achieved an accuracy of 90.91% and Naïve Bayes attained an accuracy of 86.36%.
Chandir et al. [15] was among pioneers to conduct a study in Pakistan using predictive analytics to identify children at high risk of defaulting from a RI program. Several ML algorithms including recursive partitioning, support vector machines (SVMs), random forests, and C-forest were used. The best results were obtained with a random forest algorithm, which correctly predicted the defaulting and non-defaulting children with 75.6% accuracy, 94.9% sensitivity and 54.9% specificity rates. A similar study was carried out by Abebe et al. [16] to define infant immunization status in Ethiopia. They have tested the following ML algorithms including J48 decision trees, Sequential minimal optimization (SMO), SVM, MLP and PART rule. The J48 decision tree resulted in best classification with accuracy of 62.5%, weighted true positive (WTP) rate/sensitivity of 62.5% and a weighted false positive (WFP) rate of 35.5%. Whereas weighted true negative (WTN) rate/specificity can be derived as 1-WFP resulting in 64.5%.
Motivated from this work, Qazi et al. [17,18] proposed a prediction model for RI defaulters by classifying the datasets into sub-groups: not vaccinated, fully immunized, partially high, partially medium, and partially low. The grouping strategy was based on doses of vaccines taken by child over the period of 0–15 months. They achieved 98% accuracy with MLP classifier. Pakistan Health and Demographic Survey 2017–18 data was used comprising of 50,486 records with 1,186 attributes, out of which 7,153 records with 19 attributes were used to classify defaulters based on only risk intensity levels. As a result, the subset of data was biased towards defaulters only, which is quite difficult to identify at the time of birth.
Most of the previous studies [15–18] mainly emphasized on highly accurate prediction of defaulter group but at the cost of ignoring the correct identification of non-defaulting group. Although, they were able to achieve good accuracy scores, but with low sensitivity or specificity rates. Here, high sensitivity rate leads to correct prediction of positive class (defaulter group) whereas high specificity rate leads to correct prediction of negative class (non-defaulting group). Besides high accuracy, it is extremely important in healthcare domain to develop predictive models with high sensitivity and specificity scores to ensure correct identification of both the classes. Since these rates are inversely proportional to each other, it is difficult to maintain a balance to achieve optimal accuracy [19,20].
Therefore, this study proposed a pareto optimal predictive model which is capable to identify defaulters and non-defaulters of RI immunization visits early at the time of birth. The proposed model deploys Synthetic Minority Oversampling Techniques (SMOTE) [11] to overcome the class imbalance present in the dataset which is one of the major reasons for getting low sensitivity and/or specificity rates. The model selected 10 most useful features out of total 192 features by using domain knowledge. These features mainly include status of Bacille Calmette-Guerin BCG vaccine and socio-economic data variables of the child's family taken at the time of birth. The proposed model has the potential to help policy makers and health experts to take proactive measures for defaulting group through timely intervention such as smart phone applications, text-messages or call reminders and through awareness campaigns for improving vaccine uptake. In the next section, methodology for proposed prediction model is presented for improving RI coverage in Pakistan.
Fig. 1 shows the framework of proposed predictive analytics. It is comprised of five blocks: data preprocessing, feature selection, modeling and classification, model optimization and model evaluation. Dataset description along with explanation of each block is given in the next sub sections.
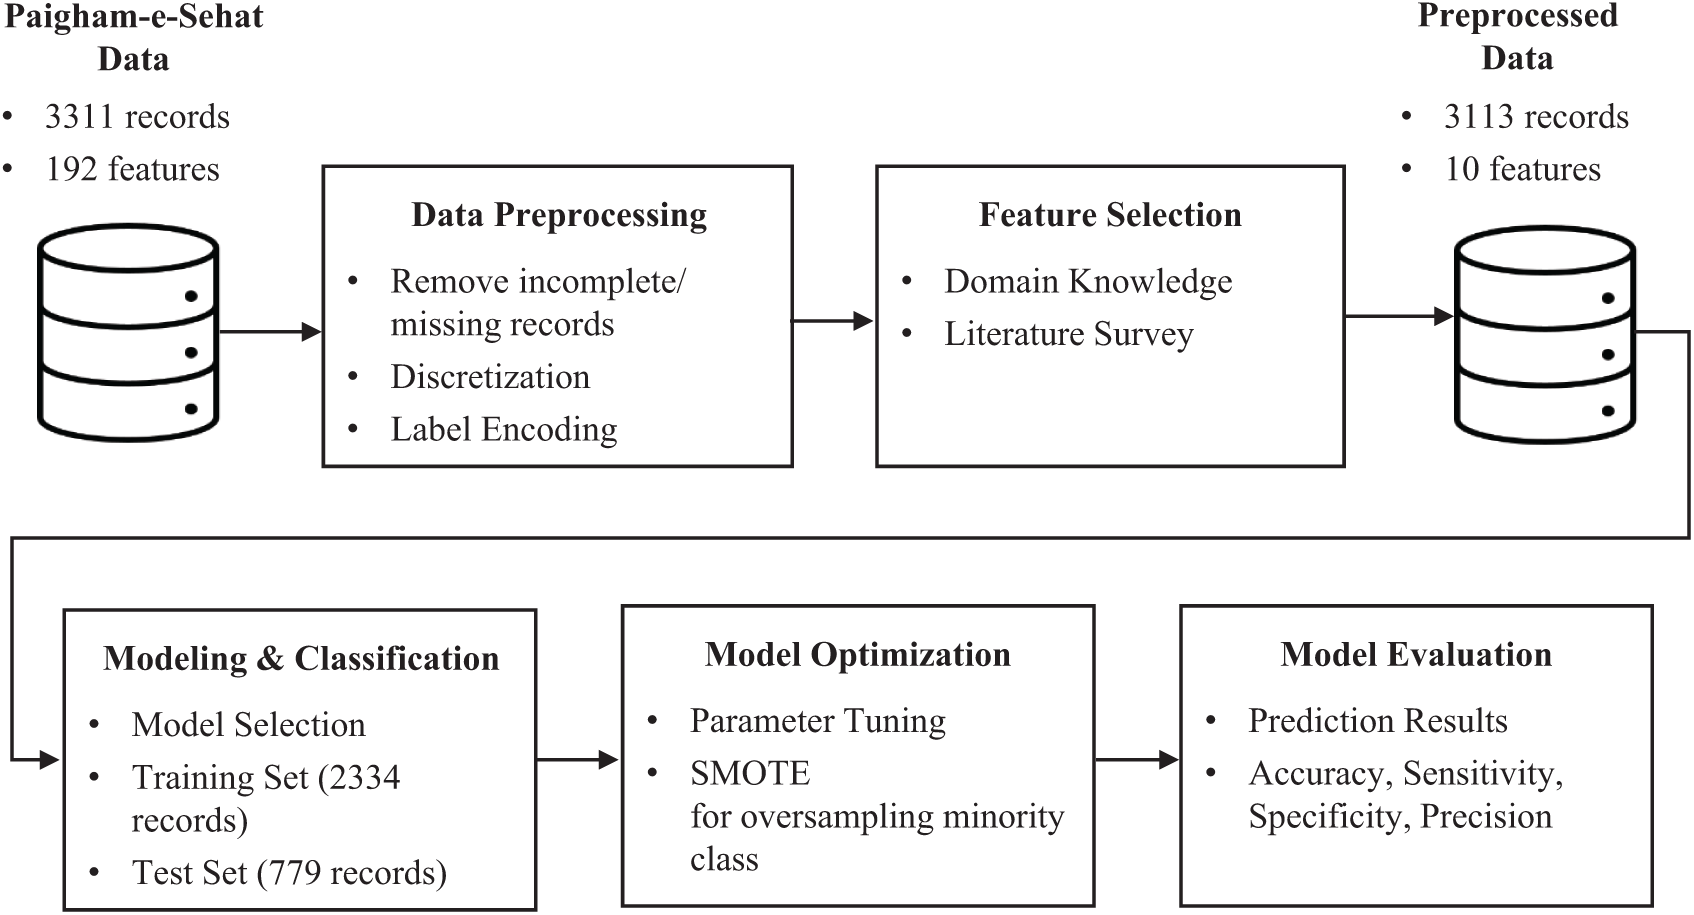
Figure 1: Framework of proposed predictive model
Vaccination data for this study was taken from Paigham-e-Sehat study [21], conducted by Aga Khan University, Pakistan supported by Grand Challenges Canada, Paigham-e-Sehat study. It aims to improve RI coverage through interventions such as personalized text messages and automated calls. The dataset comprises 3,311 records and 192 attributes, collected from Karachi and Matriari district of Pakistan. It includes four intervention arms and one control arm in which child median age at the time of enrolment was 5 days for each arm.
Paigham-e-Sehat dataset comprises of 3,311 records which were obtained from baseline and exit survey interviews. Data preprocessing involves cleaning of missing data, discretization, and label encoding. Therefore, 7 records from the exit interview were excluded due to incomplete data. Furthermore, 191 records from the exit survey were discarded due to the following reasons: refused, home locked, reattempt with no response and lost to follow up. The sample size after cleaning was taken to be 3,313 records that match the records of both baseline and exit interview data. Out of these 3,313 records incomplete/missing records were removed, and continuous discrete values were grouped together by assigning a range of value. Finally, label encoding was done to assign numeric values to categorical data.
Feature selection is the key to the performance of any predictive model. A total of 192 features were initially present in the dataset based on the responses taken from baseline and exit survey. Since, Paigham-e-Sehat study [21] focuses on improving RI coverage through text/call-based reminders. Therefore, numerous features belonged to the survey questions such as phone availability, preferred language, preferred time of reminder, phone usage, caregiver information, intervention arm, IDs of interviewer and interviewee. All these features were not directly related to our study outcomes, so the irrelevant features were dropped out from the feature set. City, gender of child, date of birth, date of death if applicable, age of parents, education level, primary language, income level, mode of transport and vaccine receive status of polio and BCG vaccine were shortlisted from baseline and exit survey. Feature selection was performed by using domain knowledge of health experts involved in this study, and also through comparing feature set used in previous studies [15–18]. It was deduced that parental education, healthcare utilization, religious barriers, logistics obstacles and wealth were associated with RI coverage [22]. Based on careful analysis, ten features were shortlisted whose description is summarized in the Tab. 1:

3.4 Modeling and Classification
Status of received vaccine for week 6, 10 and 14 of each child was available in the dataset. The class labels were chosen to be defaulters and non-defaulters based on whether they showed up on week 6, 10 and 14 of vaccination visits. Defaulter class comprises of children who never showed up for any of the vaccination visits whereas non-defaulter class were of children who at least showed up on week_6 or onwards.
Total nine supervised ML algorithms were chosen for predictive analytics based on their superior performance in similar studies [15,23–25]. The chosen ML algorithms are Logistic Regression, Support Vector Machine (SVM), Naive Bayes, Decision Tree Classification, Random Forest Classification, Artificial Neural Network (ANN), XG Boost, K-Nearest Neighbors (K-NN) and Kernel SVM as shown in Fig. 2.
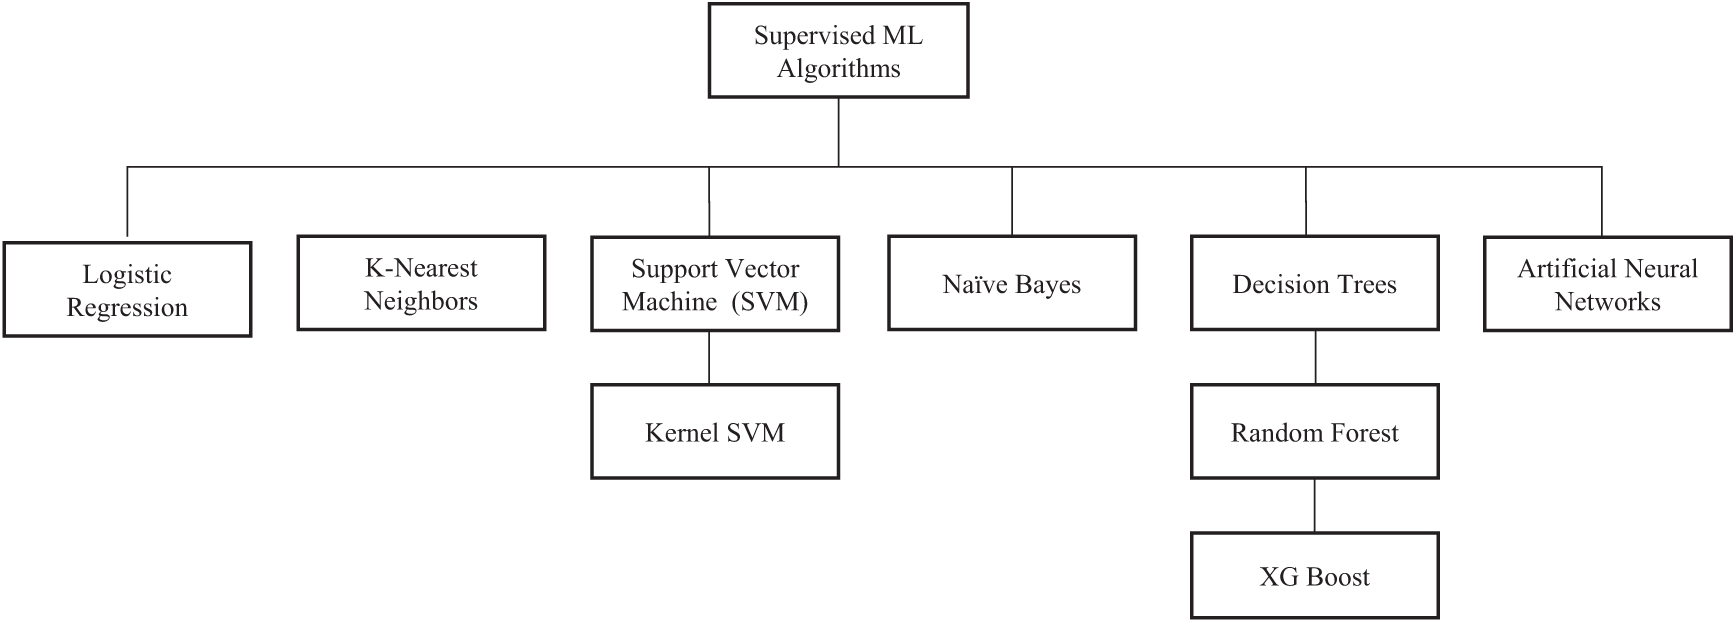
Figure 2: Supervised ML algorithms
Performance of all these algorithms were evaluated for training of our model. The overview of each algorithm is discussed as follows:
Logistic regression is a statistical mode that predicts the output using the logistic sigmoid function to calculate a probability value to be mapped on two or more discrete classes [26]. It is known to be fast and simplistic as compared to kernel SVM and other ensemble methods, but it may lag in terms of accuracy.
3.4.4 K-Nearest Neighbors (K-NN)
A k-nearest-neighbor is a simplest non-parametric classification method where a data point is classified based on its distance from its nearest neighbors and is assigned the class to which they belong. Here, k refers to no. of neighbors considered which is usually a smaller odd number but can be large for more accurate results. It requires data to be normalized and performs slowly with larger datasets.
3.4.5 Support Vector Machines (SVMs)
SVM works by visualizing feature set as a point in n-dimensional space (where n is number of features in your dataset) with the feature value taken as value of a coordinate [26]. Then, classification is done by determining the hyper-plane that best separates the two classes. It is a non-probabilistic method suitable for smaller dataset but may require additional computation cost.
Kernel SVM is used to convert linear SVM classier to solve a non-linear problem. They use different types of kernels i.e., linear, polynomial, radial basis function (RBF), and sigmoid functions to transforms data to a higher dimensional space where the points can be linearly separated [26]. The mapping of feature space is defined by the dot product between feature space representations of two data point due to which each kernel will result in different type of feature space and its performance will vary accordingly.
Naive Bayes is a probabilistic classifier based on Bayes’ theorem which assumes that each feature is statistically independent of each other and contribute equally to the prediction [26]. It provides extremely fast results and is useful for large datasets but its strong assumption for feature independence makes it difficult to apply in real-world applications.
3.4.8 Decision Tree Classification
Decision tree is tree-structured based classifier in which internal nodes represent the feature of a dataset, branches represent the decision rules, and each leaf node represents the outcome [26]. The core algorithm for building decision trees is called ID3, CART, MARS etc. They use entropy and information gain calculation at each iteration to construct a decision tree. Decision trees are easy to interpret, requires no normalization and feature selection is done automatically. They tend to over fit model which can be resolved by limiting tree depth parameter.
3.4.9 Random Forest Classification
Random forests are ensemble method for classification that train a multitude of decision trees in parallel with bootstrapping and aggregation known as bagging. The small decision trees are known as estimators each of which provides its own prediction and can solve over fitting problem faced by decision trees. They are simple and fast to implement and provide better accuracy in comparison to other classifiers.
Extreme Gradient Boosting (XG Boost) is a decision-tree-based ensemble ML algorithm that uses a gradient boosting framework to enhance speed and performance of boosted tree algorithms. It can handle overfitting problem but is sensitive to outliers due to which scalability on larger datasets is a concern.
3.4.11 Artificial Neural Network (ANN)
An artificial neural network (ANN) is a nonlinear statistical model based on a set of connected input output network where each connection is linked by a weight and learning is done through adjustments of these weights on each iteration to achieve specified accuracy score [26]. The performance of neural network depends on learning rule, architecture and transfer function used. They are computationally accurate but at the cost of being time consuming.
Parameter tuning for any ML algorithm is the key to its performance. It refers to choosing a set of optimal hyperparameters for learning. Tab. 2 summarizes the details of essential tuning parameters for each algorithm. The column of “defined parameter” includes values of the parameters where we have achieved better accuracy.

3.5.2 SMOTE for Imbalance Classification
Paigham-e-Sehat dataset comprising of 3,113 records was inherently imbalanced in terms of class distribution. It had a minority class of defaulting group with 726 records and a majority class of 2,387 records of non-defaulter group. This bias in data needs to be resolved through some data augmentation otherwise it potentially leads to provide insufficient data for training of minority class, that in turns affect sensitivity or specificity rates. Previous studies seem to overlook this important aspect towards achieving a good balance between sensitivity and specificity along with high accuracy. Therefore, either positive or negative class was identified more precisely than the other. In healthcare domain it is crucially important for predictive models to achieve a balance between these two to reduce misclassification [19,20].
Synthetic Minority Over-Sampling Techniques (SMOTE) were introduced in 2002 to resolve imbalance classification problem [11]. SMOTE works by synthesizing new data points of minority class, thus contributing towards balancing the class distribution without providing any additional information to the model [27]. Over sampling and under sampling methods are used to sample the minority class. Therefore, to overcome this bias in available dataset, SMOTE technique was deployed during training. This resulted in a new sample size of 4,774 records containing 2,387 records of defaulting children while 2,387 records were of none defaulting children. This optimization results in significant improvements in prediction results.
The focus of this study was to classify defaulting and non-defaulting groups early at the time of birth with high accuracy as well as maximum scores for sensitivity and specificity. Thus, performance of prediction models was evaluated using following criteria: confusion matrix accuracy, sensitivity, specificity, precision (positive and negative predictive value), as tabulated in Tab. 3. Where TP = True Positives, TN = True Negatives, FP = False Positives and FN = False Negatives.

To carry out this study, following four test scenarios were considered with respect to selection of features and inclusion of SMOTE. The test scenarios are as below:
• Test scenario 1: Using baseline features
• Test scenario 2: Using baseline and exit features
• Test scenario 3: Using baseline features with SMOTE technique
• Test scenario 4: Using baseline and exit features with SMOTE technique
Tab. 4 summarizes the results obtained from first test scenario, nine features of baseline survey (as in Tab. 1) were used to evaluate the performance of algorithms Among nine algorithms, kernel SVM achieved the highest accuracy with 76.3% while the sensitivity rate was limited to only 2.1%. Kernel SVM model predicted that 24.01% (187/779) children would default; among them, 2.13% (4/187) children defaulted. Similarly, it was predicted that 76% (592/779) children would come back for the next vaccination; among them, 99.7% (590/592) children did come back. The highest sensitivity of 41.2% was achieved by decision tree classification to permit correct identification of potential defaulters. By contrast, the highest specificity of 100% was achieved using logistic regression, SVM and ANN for correctly predicting the maximum number of children who will come back for RI but at the cost of lowest sensitivity of 0.5%, 0% and 0% respectively.

Tab. 5 summarizes the results obtained from second test scenario, in which performance of predictive models was evaluated on basis of nine features of baseline survey and one feature of exit survey as shown in Tab. 1. It was observed that the performance of predictive model was increased by adding exit survey feature. Among nine algorithms, XG Boost achieved the highest accuracy with 86.1% while the sensitivity rate was limited to only 46.5%. XG Boost predicted that 24.01% (187/779) children would default; among them, 46.5% (87/187) children defaulted. Similarly, it was predicted that 76% (592/779) children would come back for the next vaccination; among them, 98.6% (584/592) children did return. The highest sensitivity of 56.1% was achieved by decision tree classification that will permit correct identification of potential defaulters. By contrast, the highest specificity of 98.6% was achieved using logistic regression, SVM, Naïve Bayes, XG Boost and kernel SVM, i.e., to correctly predict the maximum number of children who will come back for RI but at the cost of lowest sensitivity of 46% respectively.

Tab. 6 summarizes the results obtained from third test scenario, in which performance of predictive models was evaluated on basis of nine features of baseline survey only as in Tab. 1, along with SMOTE technique. Sample dataset contained 3,113 records out of which 726 records were of defaulting children whereas 2,387 records were of children who will not default. To cover this bias in training the model, SMOTE technique was used to oversample the minority class. This resulted in a new sample size of 4,774 records containing 2,387 records of defaulting children while 2,387 records of defaulting children. Random forest achieved the highest accuracy with 78.5% while the specificity rate was limited to 75%. Random forest predicted that 49.4% (590/1194) children would default; among them, 82% (484/590) children defaulted. Similarly, it was predicted that 50.5% (604/1194) children would come back for the next immunization visit; out of them, 75% (453/604) children did come back. A sensitivity of 82% was also achieved by random forest that will permit correct identification of potential defaulters. By contrast, the highest specificity of 70.2% was achieved using XG Boost but at the cost of lower accuracy.

Similarly, Tab. 7 summarizes the results obtained from forth test scenario in which performance of predictive models was evaluated on basis of nine features of baseline survey and one feature of exit survey along with SMOTE technique. Random forest achieved the highest accuracy with 81.9% while the specificity rate was also achieved to be 80.3%. Random forest model predicted that 49.4% (590/1194) children would default; among them, 83.5% (493/590) children defaulted. Similarly, it was predicted that 50.6% (604/1194) children would come back for the next vaccination; among them, 80.3% (485/604) children did return. The highest sensitivity of 100% was achieved ANN but at the cost of 0% specificity that will permit correct identification of potential defaulters but not the children who will come back. By contrast, the highest specificity of 98.5% was achieved by Naïve Bayes but at the cost of lowest sensitivity of 37.5%.

Fig. 3 depicts the bar graphs for performance comparison of prediction models in different test scenarios 1–4. Accuracy, sensitivity, and specificity percentages are plotted against each algorithm. Tab. 8 tabulates the performance of most optimal algorithms for each of the four test scenarios. The results show that decision tree has performed well for test scenario 1 and random forest has proved to provide consistent high performing results in rest of the test scenarios. It is also evident that the fourth scenario is proved to be the best scenario for training prediction models.
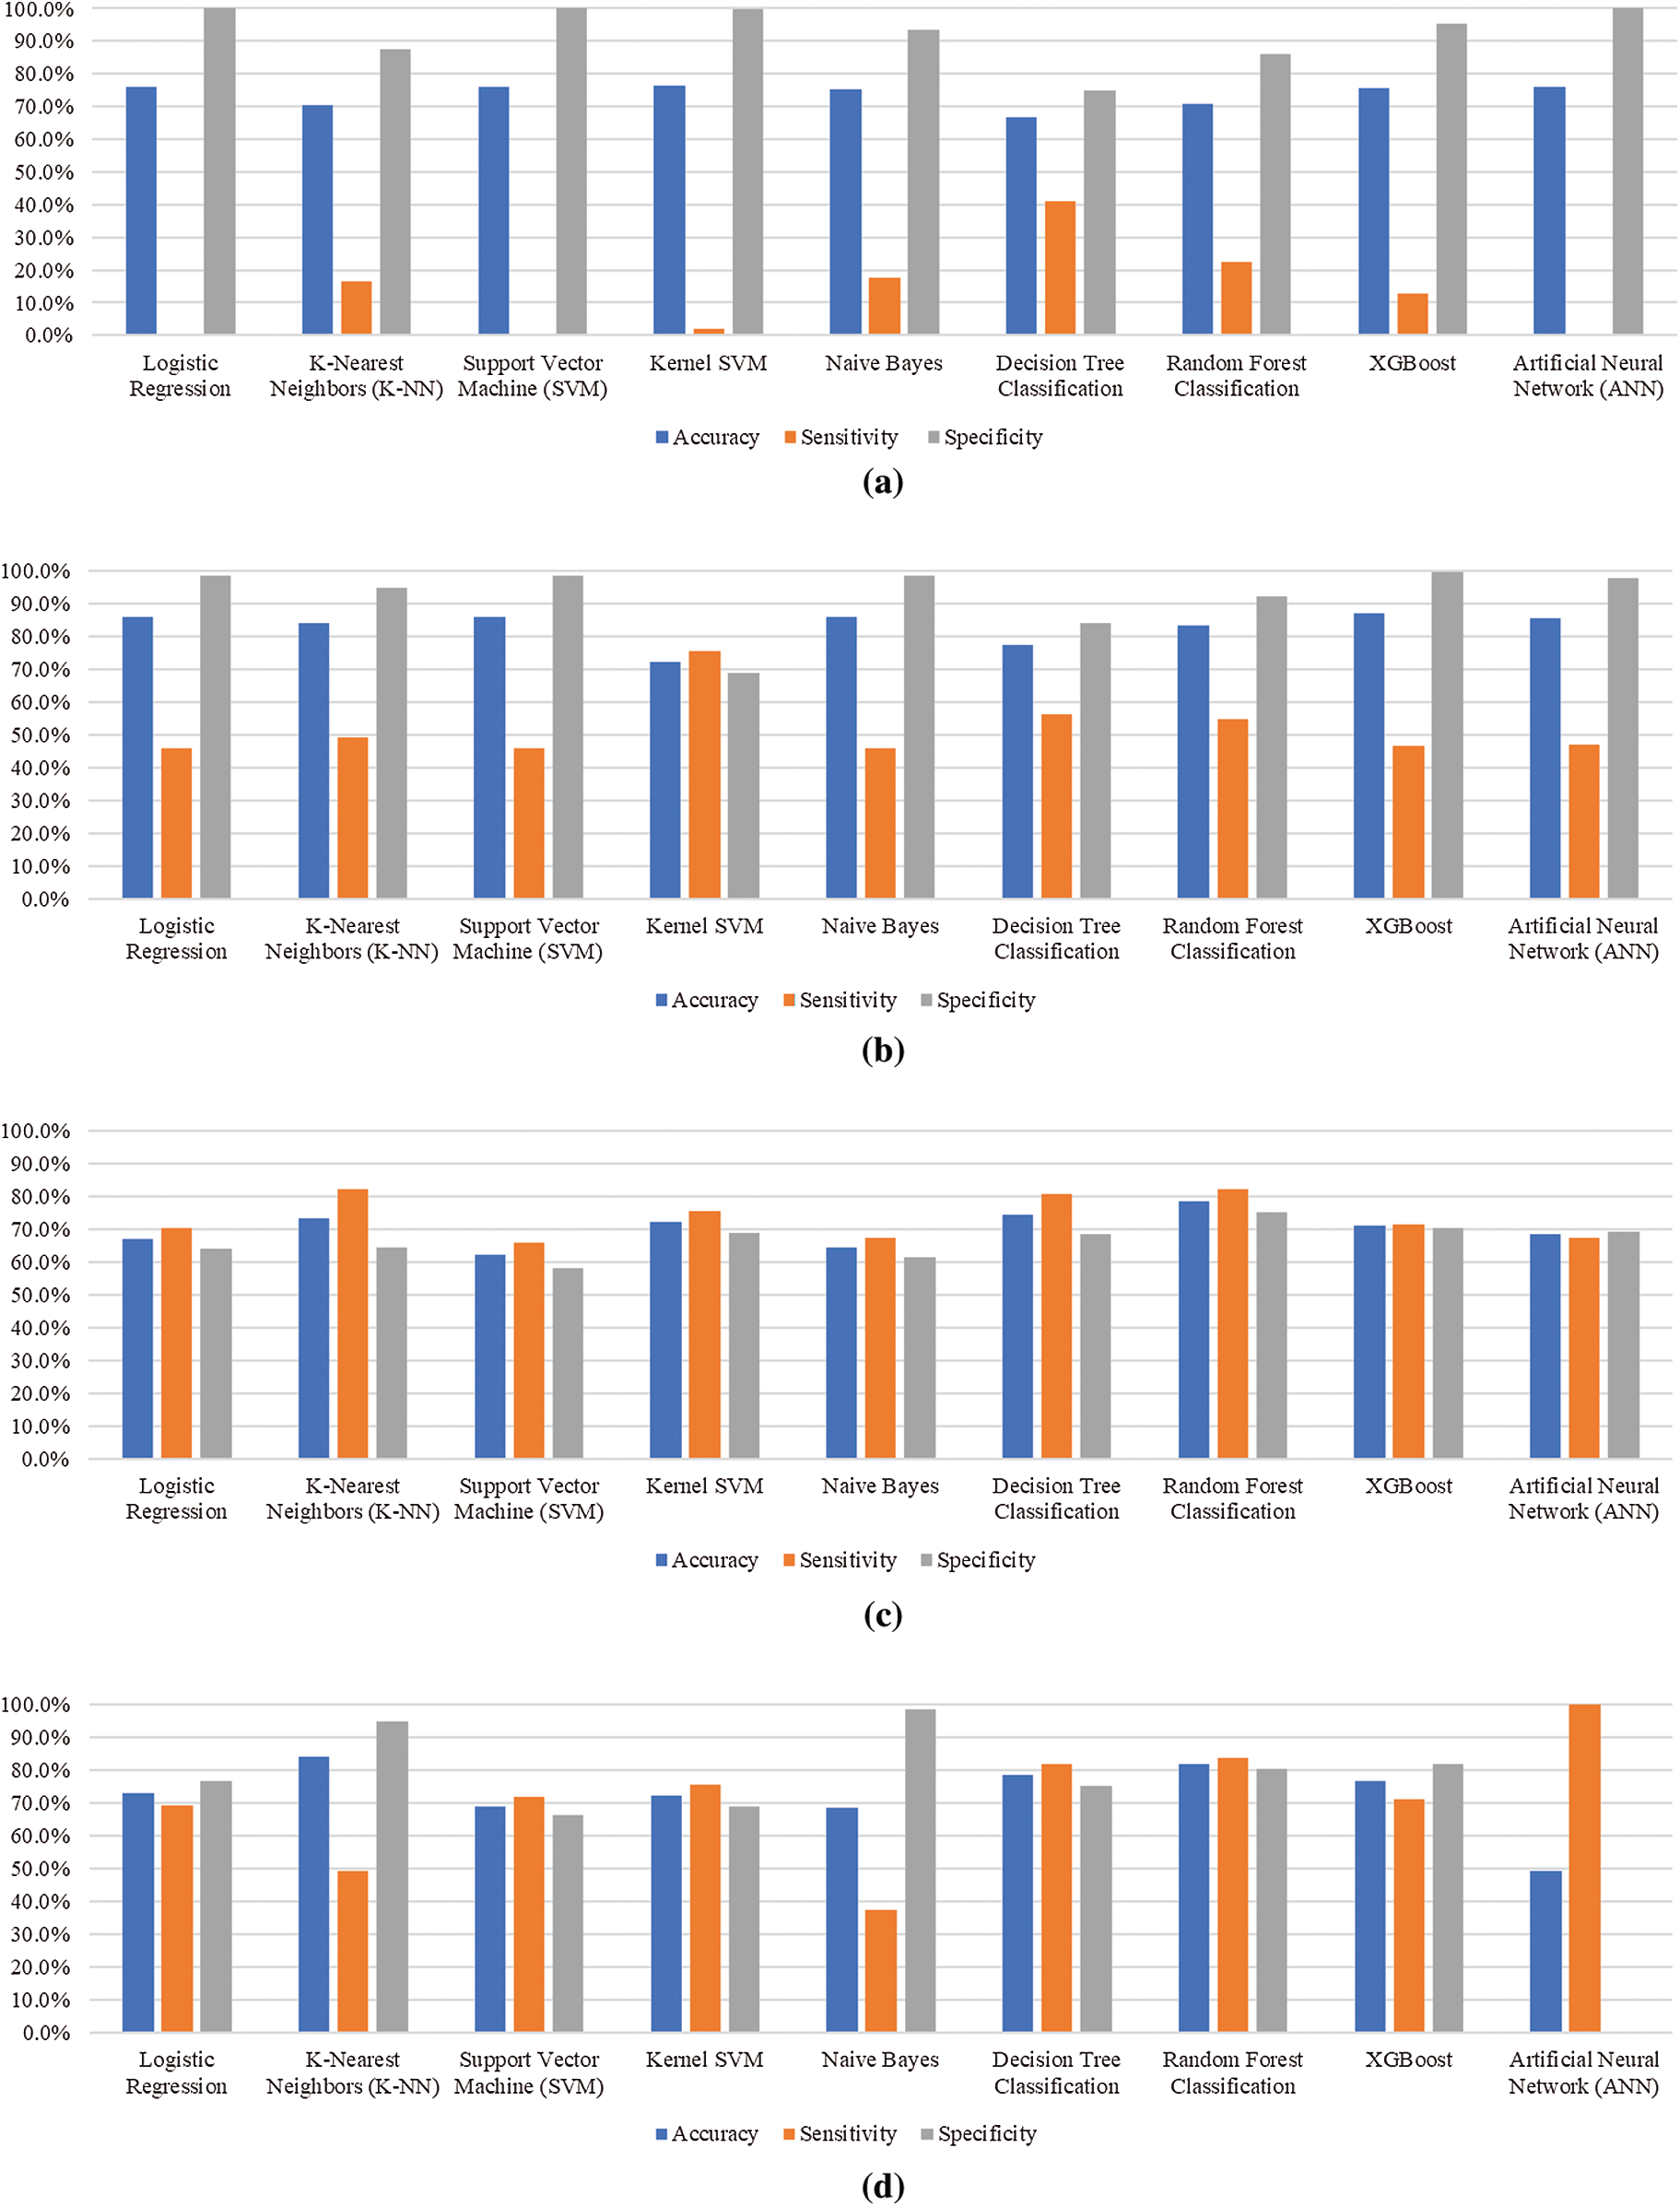
Figure 3: Performance comparison of prediction models for different test scenarios. (a) Test scenario 1, (b) Test scenario 2, (c) Test scenario 3, (d) Test scenario 4

This study has proposed the use of predictive analytics to improve the RI coverage for defaulting children early at the time of birth. The approach adopted in the study is relatively simple, effective, and efficient to be implemented in LMICs and regions where we do not have adequate amount of data available. The use of SMOTE technique is suggested to compensate the bias produced due to imbalance in class of defaulting and non-defaulting children. This optimization method has contributed to increase the overall performance of predictive model which can be evidently seen from the results presented in this study. The best results were obtained in test scenario 4 with an accuracy of 81.9% by using random forest algorithm. Tab. 9 presents a comparison of our results with similar studies reported in open literature.

It can be seen from the results that our predictive model has performed well in terms of accuracy, sensitivity, and specificity in comparison to the work of Abebe et al. [16] and Chandir et al. [15]. Also, we can observe that these studies have not given much importance to specificity scores which will lead to misclassification while predicting the defaulters. Therefore, it is extremely important to take account of sensitivity as well specificity scores to design a good classifier. Whereas the work presented by Qazi et al. [17,18] outperform in terms of all evaluation metrics for classification of high risk and low risk of defaulters in upcoming RI visits., The performance edge seems to be achieved mainly due to the utilization of a large dataset and relatively large number of features to train their model. However, in most of the cases, studies are conducted with practical constraints in data collection and difficulties in getting information of large number of features. In such a case, our proposed study can prove to be viable as it has utilized smaller dataset with only ten basic features for training models. The selected features were demographic and socio-economic data of each child along with the status of BCG vaccine uptake. Such features are relatively easier to gather even in resource constraint environment.
Furthermore, another key finding of our study includes the evaluation of graded feature importance. To further investigate which features are contributing higher for predicting defaulting children in RI visits, feature (i.e., variable) importance score was calculated. These scores are also called gini importance or mean decrease impurity [28]. In test scenarios with SMOTE technique i.e., scenario 3 and 4, random forest was found to be the most optimal algorithm. Therefore, feature importance of the same is presented in Fig. 4. In Fig. 4a, household income ranks highest with a score of 18%, qualification of the father as 16% and qualification of mother as 12%. However, in Fig. 4b status of BCG vaccine ranks highest with a score of 18%, household income as 15% and qualification of father as 13%. Based on results the targeted intervention areas for improving RI are low-income groups, parents education especially fathers as they are the head of the families and primary decision makers in Pakistani society. Moreover, those children who receive BCG vaccine dose at birth are more likely to come back for next immunization visits.
Therefore, to improve RI coverage it is essential to address above discussed factors along with the other interventions to create a greater impact of achieving the goal for universal coverage of RI. The above findings have opened new doors of investigation for taking customized timely interventions in improving the overall coverage and timeliness of RI. The above discussion shows that in LMICs like Pakistan; BCG vaccine coverage, poverty and illiteracy are the major causes of high rate of defaulting children in RI visits and same is aligned with the findings of similar studies [29–32]. The study findings can be used by health policy makers, health authorities, volunteers, charities, immunization programs, concerned government authorities and vaccinators to increase the overall coverage and timeliness of vaccination within the region. It can also be used for evidence based targeted interventions for the identified individuals or community of the defaulting group.
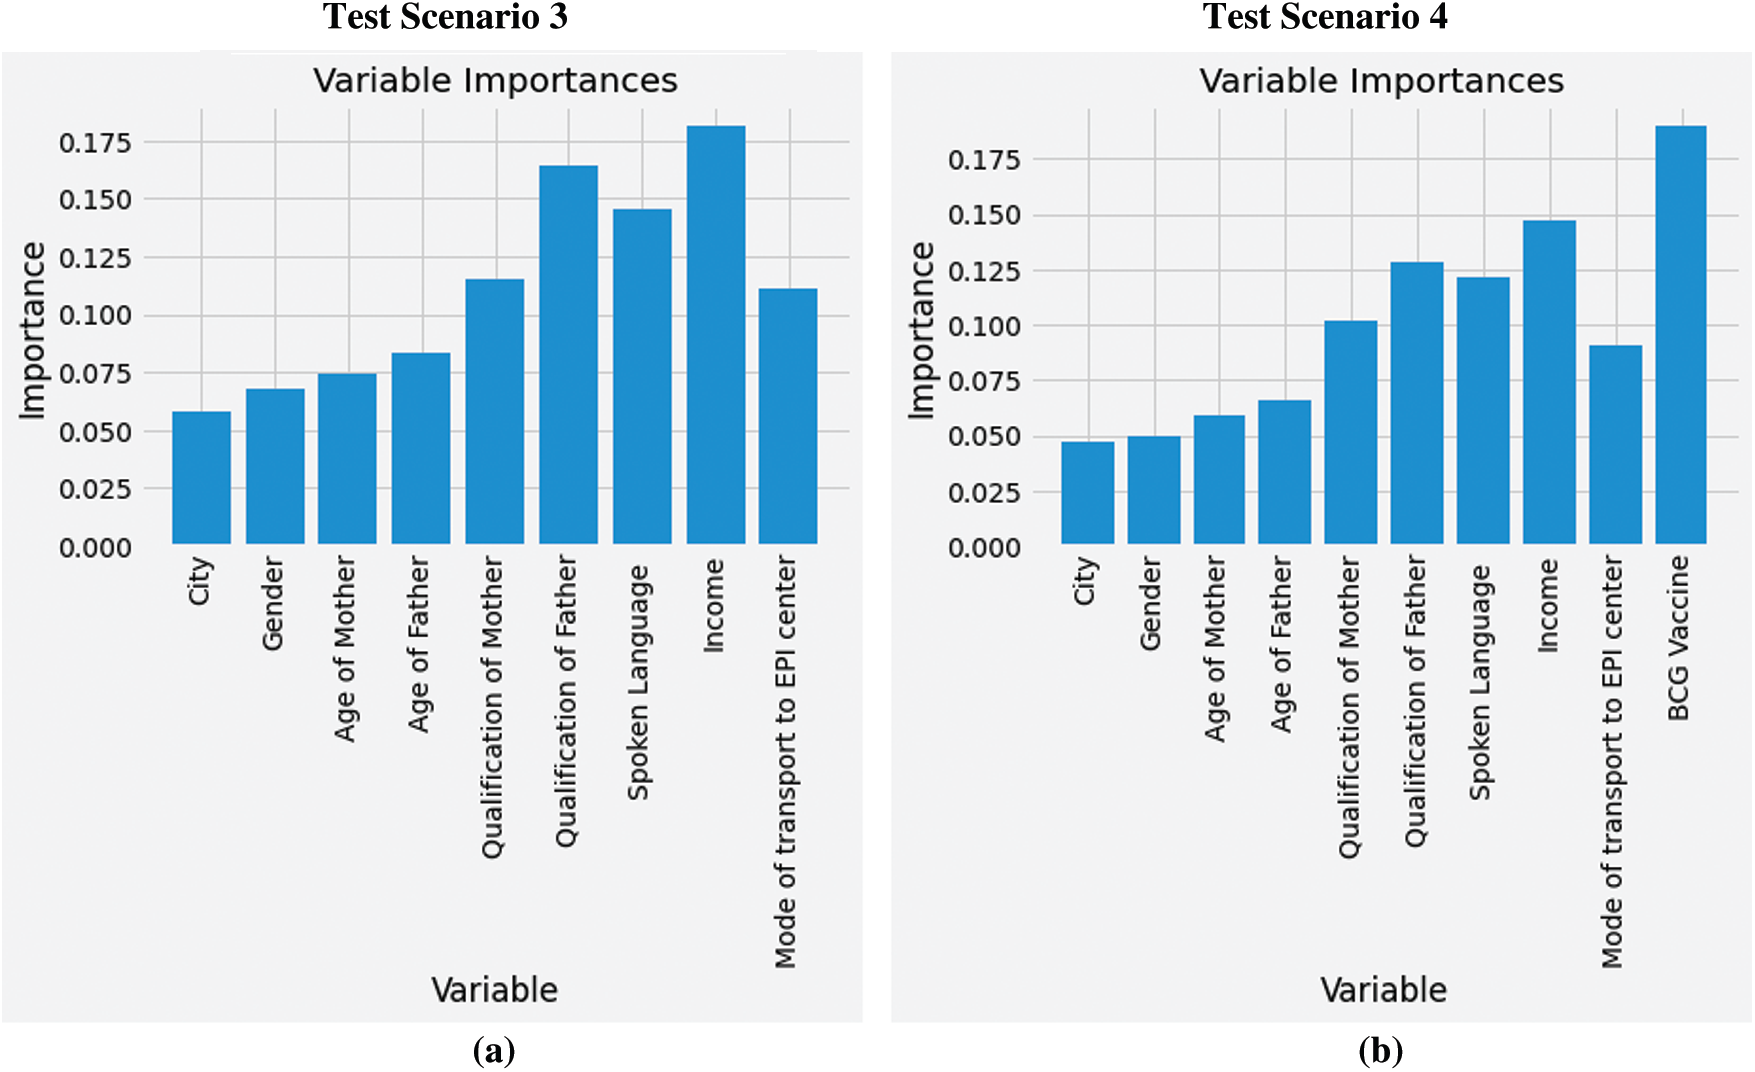
Figure 4: Feature importance: (a) Using baseline features with SMOTE technique, (b) Using baseline and exit features with SMOTE technique
The feasibility of proposed model is evident especially for practically constrained environments to correctly identify children in the defaulting group of immunization schedules. The proposed model uses pre-trained models which can be directly deployed using a computer/laptop to provide offline predictions and storage of data using local server instead of a remote sever which will require internet connectivity. Hence, the communities with low immunization rates especially backward areas can get the most benefit out of this study. Moreover, it can also help in improving other immunizations programs, and their coverage including COVID-19. To further evaluate the effectiveness of this model, one must take account of the demographic data which may influence the health system for overall improvement in RI coverage.
Lack of routine immunization coverage is a major concern all around the globe. It is extremely important for a child to receive vaccine doses at specific scheduled stages. To facilitate improvement in RI coverage, this study presents a predictive tool to help identify children who are likely to miss or delay the initial doses of vaccine. To improve practical relevance of the predictive model, it is optimized for accuracy, sensitivity as well as specificity. Data biases were technically removed to further improve performance. The study also highlighted significant features contributing to poor RI coverage. It was found that from Pakistan's perspective; BCG vaccine coverage, qualification of father and household income are key factors contributing towards the coverage of routine immunization. These results are in line with the findings of other similar studies for LMIC. We suggest that behavioral change requires to be addressed with the help of technological tools and interventions for providing awareness and assistance towards the defaulting group of people. Also, non-health factors such as the economy and education remain equally important to improve RI coverage. To achieve improved immunization coverage and timeliness, this study showcases potential avenues to help the concerned vaccinators, health authorities and policy makers to develop appropriate strategies, make timely decisions and take proactive measures for evidence based targeted interventions.
Funding Statement: This study was funded by GCRF UK and was carried out as part of project CoNTINuE - Capacity building in technology-driven innovation in healthcare.
Conflicts of Interest: The authors declare that they have no conflicts of interest to report regarding the present study.
1. World Health Organization, “Immunization coverage,” 2020. [Online]. Available: https://www.who.int/news-room/fact-sheets/detail/immunization-coverage. [Google Scholar]
2. UNICEF, “Immunization programme,” 2020. [Online]. Available: https://www.unicef.org/immunization. [Google Scholar]
3. Z. Haq, B. T. Shaikh, N. Tran, A. Hafeez and A. Ghaffar, “System within systems: Challenges and opportunities for the expanded programme on immunization in Pakistan,” Health Research Policy and Systems, vol. 17, no. 1, pp. 1–10, 2019. [Google Scholar]
4. C. W. LeBaron, D. M. Starnes and K. J. Rask, “The impact of reminder-recall interventions on low vaccination coverage in an inner-city population,” Archives of Pediatrics & Adolescent Medicine, vol. 158, no. 3, pp. 255, 2004. [Google Scholar]
5. World Health Organization, “WHO and UNICEF warn of a decline in vaccinations during COVID-19,” 2020. [Online]. Available: https://www.who.int/news/item/15-07-2020-who-and-unicef-warn-of-a-decline-in-vaccinations-during-covid-19. [Google Scholar]
6. World Health Organization, “More than 117 million children at risk of missing out on measles vaccines, as COVID-19 surges,” 2020. [Online]. Available: https://www.who.int/immunization/diseases/measles/statement_missing_measles_vaccines_covid-19/en/. [Google Scholar]
7. M. Butt, R. Mohammed, E. Butt, S. Butt and J. Xiang, “Why have immunization efforts in Pakistan failed to achieve global standards of vaccination uptake and infectious disease control,” Risk Management and Healthcare Policy, vol. 13, pp. 111–124, 2020. [Google Scholar]
8. I. D. Pavlopoulou, K. A. Michail, E. Samoli, G. Tsiftis and K. Tsoumakas, “Immunization coverage and predictive factors for complete and age-appropriate vaccination among preschoolers in Athens, Greece: A cross-sectional study,” BMC Public Health, vol. 13, no. 1, pp. 1–10, 2013. [Google Scholar]
9. World Health Organization, “Immunization agenda 2030: A global strategy to leave no one behind,” 2020. [Online]. Available: https://www.who.int/publications/m/item/immunization-agenda-2030-a-global-strategy-to-leave-no-one-behind. [Google Scholar]
10. M. Chen, Y. Hao, K. Hwang, L. Wang and L. Wang, “Disease prediction by machine learning over big data from healthcare communities,” IEEE Access, vol. 5, pp. 8869–8879, 2017. [Google Scholar]
11. N. V. Chawla, K. W. Bowyer, L. O. Hall and W. P. Kegelmeyer, “SMOTE: Synthetic minority over-sampling technique,” Journal of Artificial Intelligence Research, vol. 16, pp. 321–357, 2002. [Google Scholar]
12. V. J. Zhu, S. J. Grannis, W. Tu, M. B. Rosenman and S. M. Downs, “Evaluation of a clinical decision support algorithm for patient-specific childhood immunization,” Artificial Intelligence in Medicine, vol. 56, no. 1, pp. 51–57, 2012. [Google Scholar]
13. K. H. Abegaz and E. M. Atomssa, “Data mining of access to tetanus toxoid immunization among women of childbearing age in Ethiopia,” Machine Learning Research, vol. 2, no. 2, pp. 54–60, 2017. [Google Scholar]
14. S. Shastri and V. Mansotra, “A model for accurate prediction of child immunization data for knowledge discovery using Bayesian TAN and naive Bayes classifiers,” International Journal of Recent Technology and Engineering, vol. 8, no. 4, pp. 3335–3343, 2019. [Google Scholar]
15. S. Chandir, D. A. Siddiqi, O. A. Hussain, T. Niazi, M. T. Shah et al., “Using predictive analytics to identify children at high risk of defaulting from a routine immunization program: Feasibility study,” JMIR Public Health and Surveillance, vol. 4, no. 3, pp. e63, 2018. [Google Scholar]
16. H. Abebe and M. Meshesha, “Describing infant immunization status in Ethiopian,” IOSR Journal of Nursing and Health Science, vol. 9, no. 1, pp. 1–6, 2020. [Google Scholar]
17. S. Qazi, M. Usman, A. Mahmood, A. Afzaal Abbasi, M. Attique et al., “Smart healthcare using data-driven prediction of immunization defaulters in expanded program on immunization (EPI),” Computers, Materials & Continua, vol. 66, no. 1, pp. 589–602, 2020. [Google Scholar]
18. S. Qazi, M. Usman and A. Mahmood, “A data-driven framework for introducing predictive analytics into expanded program on immunization in Pakistan,” Wiener Klinische Wochenschrift, 2020. [Google Scholar]
19. R. Parikh, A. Mathai, S. Parikh, G. Chandra Sekhar and R. Thomas, “Understanding and using sensitivity, specificity and predictive values,” Indian Journal of Ophthalmology, vol. 56, no. 1, pp. 45–50, 2008. [Google Scholar]
20. D. M. Naeger, M. P. Kohi, E. M. Webb, A. Phelps, K. G. Ordovas et al., “Correctly using sensitivity, specificity, and predictive values in clinical practice: How to avoid three common pitfalls,” American Journal of Roentgenology, vol. 200, no. 6, pp. W566–W570, 2013. [Google Scholar]
21. A. M. Kazi, N. Ahsan, A. Khan, S. Jamal, H. Kalimuddin et al., “Personalized text messages and automated calls for improving vaccine coverage among children in Pakistan: Protocol for a community-based cluster randomized clinical trial,” JMIR Research Protocols, vol. 8, no. 5, pp. e12851, 2019. [Google Scholar]
22. H. Imran, D. Raja, N. C. Grassly, M. Z. Wadood, R. M. Safdar et al., “Routine immunization in Pakistan: Comparison of multiple data sources and identification of factors associated with vaccination,” International Health, vol. 10, no. 2, pp. 84–91, 2018. [Google Scholar]
23. H. Byeon, “Is the random forest algorithm suitable for predicting Parkinson's disease with mild cognitive impairment out of Parkinson's disease with normal cognition,” International Journal of Environmental Research and Public Health, vol. 17, no. 7, pp. 2594, 2020. [Google Scholar]
24. M. Z. Alam, M. S. Rahman and M. S. Rahman, “A random forest based predictor for medical data classification using feature ranking,” Informatics in Medicine Unlocked, vol. 15, pp. 100180, 2019. [Google Scholar]
25. T. Shaikhina, D. Lowe, S. Daga, D. Briggs, R. Higgins et al., “Decision tree and random forest models for outcome prediction in antibody incompatible kidney transplantation,” Biomedical Signal Processing and Control, vol. 52, pp. 456–462, 2019. [Google Scholar]
26. G. Bonaccorso, Machine Learning Algorithms: Reference Guide for Popular Algorithms for Data Science and Machine Learning, Birmingham, UK: Packt Publishing, 2017. [Google Scholar]
27. H. He, Y. Ma and J. Wiley, Imbalanced Learning: Foundations, Algorithms, and Applications, Hoboken, New Jersey: John Wiley & Sons, Inc., 2013. [Google Scholar]
28. L. Breiman, J. H. Friedman, R. A. Olshen and C. J. Stone, Classification and Regression Trees, Boca Raton, Florida: Routledge, 2017. [Google Scholar]
29. L. C. Maina, S. Karanja and J. Kombich, “Immunization coverage and its determinants among children aged 12–23 months in a peri-urban area of Kenya,” Pan African Medical Journal, vol. 14, no. 3, 2013. [Google Scholar]
30. T. Crocker-Buque, G. Mindra, R. Duncan and S. Mounier-Jack, “Immunization, urbanization and slums—A systematic review of factors and interventions,” BMC Public Health, vol. 17, no. 1, pp. 1, 2017. [Google Scholar]
31. C. S. Wiysonge, O. A. Uthman, P. M. Ndumbe and G. D. Hussey, “Individual and contextual factors associated with low childhood immunization coverage in sub-saharan Africa: A multilevel analysis,” PLOS One, vol. 7, no. 5, pp. e37905, 2012. [Google Scholar]
32. J. W. Noh, Y. Kim, N. Akram, K.-B. Yoo, J. Park et al., “Factors affecting complete and timely childhood immunization coverage in sindh, Pakistan; a secondary analysis of cross-sectional survey data,” PLOS One, vol. 13, no. 10, pp. e0206766, 2018. [Google Scholar]
 | This work is licensed under a Creative Commons Attribution 4.0 International License, which permits unrestricted use, distribution, and reproduction in any medium, provided the original work is properly cited. |