DOI:10.32604/cmc.2022.019323
| Computers, Materials & Continua DOI:10.32604/cmc.2022.019323 | |
| Article |
Distributed Healthcare Framework Using MMSM-SVM and P-SVM Classification
Department of Information Technology, National Engineering College (Autonomous), Kovilpatti, 628503, Tamilnadu, India
*Corresponding Author: R. Sujitha. Email: rsujitharesearch1@gmail.com
Received: 10 April 2021; Accepted: 27 May 2021
Abstract: With the modernization of machine learning techniques in healthcare, different innovations including support vector machine (SVM) have predominantly played a major role in classifying lung cancer, predicting coronavirus disease 2019, and other diseases. In particular, our algorithm focuses on integrated datasets as compared with other existing works. In this study, parallel-based SVM (P-SVM) and multiclass-based multiple submodels (MMSM-SVM) were used to analyze the optimal classification of lung diseases. This analysis aimed to find the optimal classification of lung diseases with id and stages, such as key-value pairs in MapReduce combined with P-SVM and MMSVM for binary and multiclasses, respectively. For non-linear classification, kernel clustering-based SVM embedded with multiple submodels was developed. Both algorithms were developed using Apache spark environment, and data for the analysis were retrieved from microscope lab, UCI, Kaggle, and General Thoracic surgery database along with some electronic health records related to various lung diseases to increase the dataset size to 5 GB. Performance measures were conducted using a 5 GB dataset with five nodes. Dataset size was finally increased, and task analysis and CPU utilization were measured.
Keywords: Lung cancer; COVID-19; machine learning; deep learning; parallel based support vector machine; multiclass-based multiple submodel
Big data plays a vital role in analyzing extremely large data sets with reduced complexity and efficient analysis. With enhanced techniques of big data, a large amount of data has been handled in parallel. In specific, data classification has been performed using salient solutions. In the real world, data with exponential growth are complex and challenging to classify [1]. Prediction of coronavirus disease 2019 (COVID-19) is mandatory to prevent the risk of spread, and pre-determination of lung cancer stages is mandatory to determine lung cells damaged in increasing stages [2]. In medical science, affected parts can be retrieved and used to diagnose early stages of the disease [3]. Biopsy is the initial step in diagnosis; during this process, cells are sampled and intricately examined under the microscope to predetermine intra-tumoral cells [4]. However, efficient methods and equipment for accurate recognition and diagnosis remain lacking.
Parallel classification has become appropriate to solve classification problems in big data; in specific, distributed support vector machines (SVMs) have an iterative MapReduce framework, improved communication between nodes, and linear classification [5]. Classification and regression problems have become salient in binary classification, and MapReduce-based distributed parallel-based SVM (P-SVM) has been proposed to solve them [6]. P-SVM also solves optimization problems and is used for statistical learning theory to predict hypotheses with improved accuracy through iterative training of split datasets.
Lung cancer is a leading disease worldwide. For eradication of lung cancer, health checkers should employ various methods, but processing and extracting results from many datasets are challenging [7]. A previous study [8] extracted information from several datasets by using P-SVM. This technique uses row-based, approximate matrix factorization, which loads only essential data to each machine to perform parallel computation. In addition, some of the computations use big data tools. Another study [9] solved optimization problems over the cloud by using MapReduce techniques along with parallel computation. It also used statistical learning theory to predict the hypothesis that minimizes empirical risks and focused on multiclass parallel computations.
In [10], the author used multiple submodel parallel SVM (MSM-SVM) on a spark to accelerate the training process with non-linear SVM. Furthermore, data splitting methods improve the performance of parallel computations and approximate global solution with several local submodels. The author deployed and encountered a multiclass with a “one-against-one” strategy [11]. A new convolutional neural network-based multimodal disease risk prediction algorithm has been proposed to handle structured and unstructured data [12,13]. In addition, the latent factor model has been developed to handle incomplete data [14]. The former process also reconstructs missing data. Reference [15] analyzed the persistence of diabetes by using HUE. Moreover, they accurately counted the number of persons suffering from diabetes by using SVM. Reference [16] developed a tele-ecg system with Hadoop and big data framework by using mining techniques for processing and classifying datasets related to cardiovascular disease. Although Hadoop has been developed, some of the issues in handling large datasets raised concerns in terms of server handling. The most significant and essential tool in big data is MapReduce. The efficient use of MapReduce improves performance [17,18]. The author analyzed MapReduce impacts and penalty parameters with respect to large-scale datasets, divided datasets into chunks, and processed them under the Hadoop framework. Another efficient sub-model in MapReduce is an adjoint method [19]. The MapReduce based adjoint method prevents brain disease by detecting it earlier.
Reference [20] implemented communication efficient versions of parallel SVM and further developed CA-SVM. The author deployed statistical methods to improve its efficiency in communication and used algorithmic refinements. C-means clustering, which uses the UCI machine repository to collect data, has been proposed for analyzing patient records [21,22]. The author provided a framework for predicting and prescribing drugs for specified diseases. Reference [23] provided predictive pattern matching with Hadoop MapReduce environments to predict diabetes mellitus. The developed machine learning-based prediction methodology has drawbacks in its early analysis. Therefore, a new accurate prediction methodology is required to overcome the proposed methodology.
References [24,25] deliberated the basics of predictive analytics in healthcare. In our system, RBF acts as a non-linear kernel for SVM with respect to study. The study showed the impacts of predictive analytics in healthcare as general applications. A study [26] deployed a parallel RMC algorithm to classify medical data. This algorithm works better for integrated data as in our model. Hence, we used this model for comparison with our proposed model. Cascade SVM from a previous study [27] has been updated and compared with our proposed model. The only difference with cascade SVM is that it classifies the seed of flowers, which is the general application.
In this study, datasets with underlying SVM with threshold-based techniques for classification were developed. Furthermore, classified support vectors were fed to MMSM-SVM with some parameter changes and passes to MapReduce to extract id and stages from classified vectors. Apart from multiple submodels, to cluster similar datasets, were incorporated with kernel clustering-based SVM (KCB-SVM) and de-clustering was reduced and to cover all hidden data the most of dataset falls near the margin of support vectors. P-SVM and MMSM-SVM with some parameter settings were convened for binary classification. Finally, id and stages were retrieved from the MapReduce framework with four nodes of parallel computation. This analysis aimed to find the optimal classification of lung diseases with id and stages, such as key-value pair in MapReduce combined with P-SVM and MMSVM for binary and multiclasses, respectively. In this analysis, the MMSM-SVM algorithm was developed from MSM-SVM to classify high-dimensional lung disease datasets. Furthermore, the MapReduce technique was utilized to retrieve different id and stages from the classified support vectors. The obtained result proves that the developed MMSM-SVM algorithm has 92% higher accuracy in classification with optimal data sets when compared with other learning techniques. The P-SVM algorithm also has an accuracy of 90% in classification with different parameter settings for every dataset. Both algorithms were developed using Apache spark environment, and the data for the analysis were retrieved from microscope lab, UCI, Kaggle, and General Thoracic surgery database along with some HER (Electronic Health Records) related to various lung diseases to increase the datasets.
2 Proposed Approach and Methodology
In big data classification, SVM models and sub-models have their own architecture. The proposed classification architecture is shown in Fig. 1. Samples similar in nature form one cluster, and others are more likely to become support vectors. Samples in different regions are less likely able to train. Meanwhile, the training of samples uses local sub-models.
2.1 Modelling of Multi Class-Based Multiple Sub Models Support Vector Machine
Multiclass classification ensembles the most significant part in various classification tasks because it resides in the stages or classes of datasets. The submodel approach is suited for multiclass classification. For every class
Decision function of local sub models can be derived as
For one-vs.-all, let training set T = ((x1, y1),(x2, y2),…,(xn, yn)), where y = 1…k, where k is the number of classes. Let l = 1…k number of classes and l considered as positive class and other k − 1 classes are considered as negative classes. With these representations, decision function becomes
With One-vs.-all,
To find if the specified class belongs to or not,
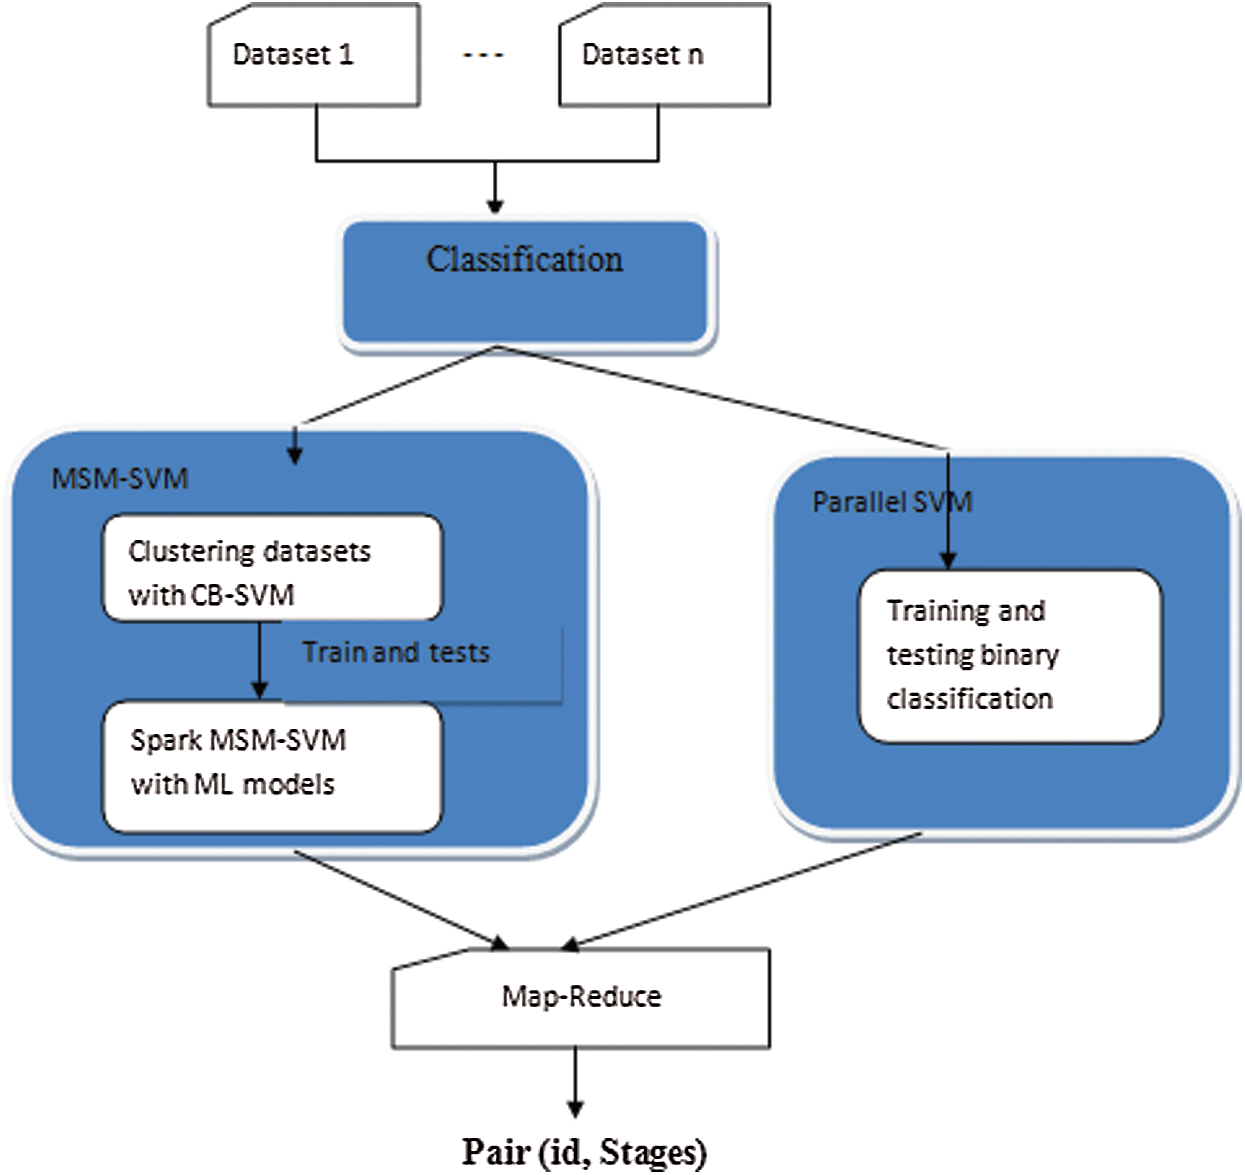
Figure 1: Overall layout of proposed methodology
In multiple submodels, the system must leave away local training by enabling the cluster and splitting models. Some of the clusters may have classes Ct, where
In the clustering stage, the clustering feature (CF) for every cluster should include
where c and r form the center of the cluster and radius. where the radius is calculated by
Let (xi, yi) be input parameters and Hi be the geometric metric of the mapped feature space. Radius is calculated with respect to the cluster center and distance between two data points.
For the RBF kernel, the distance measures are computed as follows:
Suppose some clusters are not selected for computing the cluster center, then it is computed as follows:
H(l−1)k is merged into cluster Hly and then CFs of cluster Hly are updated as Hly = Hly, where H(l−1)k depicts the unselected cluster and Hly depicts the unselected cluster with margin Y(8). The radius can be calculated as the maximum summation of clusters and unselected clusters with the distance of clusters and unselected clusters. Here, l is the cluster level.
Declustering can be implemented with the condition for positive classes,
for negative classes,
Let the parameters be the number of cores, sample size, LC lung cancer datasets with 1 to C, where C depicts the number of classes, SP sputum datasets, and datasets with 1 to C and DT depicts datasets and clustering model.
Algorithm 1:
1. Load support vectors of (xi, yi) with more than one classes C to RDD
2. Use RDD.map() to generate (id, stages) pairs with RDD
3. Merge the vectors with respect to id to form local subsets {LC}Ci = 1 and {SP}Ci = 1 with RDD.groupByKey();
4. Use KCB-SVM to select subclusters from {LC}
5. Cluster similar classes using WTA.
6. Decluster other classes.
7. Repeat steps 5 and 6 to cover all data points.
8. For i = 1…C parallel do
9. fi: X → R.
10. Yi = argmax{{1…C}}
11. fi(X) as the final class
2.2 Modelling of Parallel Support Vector Machine
Fig. 2 depicts the layout of P-SVM. The support vectors that are already classified are given as input to P-SVM. Subvectors are calculated and optimized using P-SVM. Then, the calculated support vectors of the previous sub-SVM are given as an input to the next sub-SVM. Therefore, the output of more than two last sub support vectors forms input to the present support vectors. The process continues until single support vectors are derived as the result. Furthermore, P-SVM can be achieved in spark using library LIBSVM.
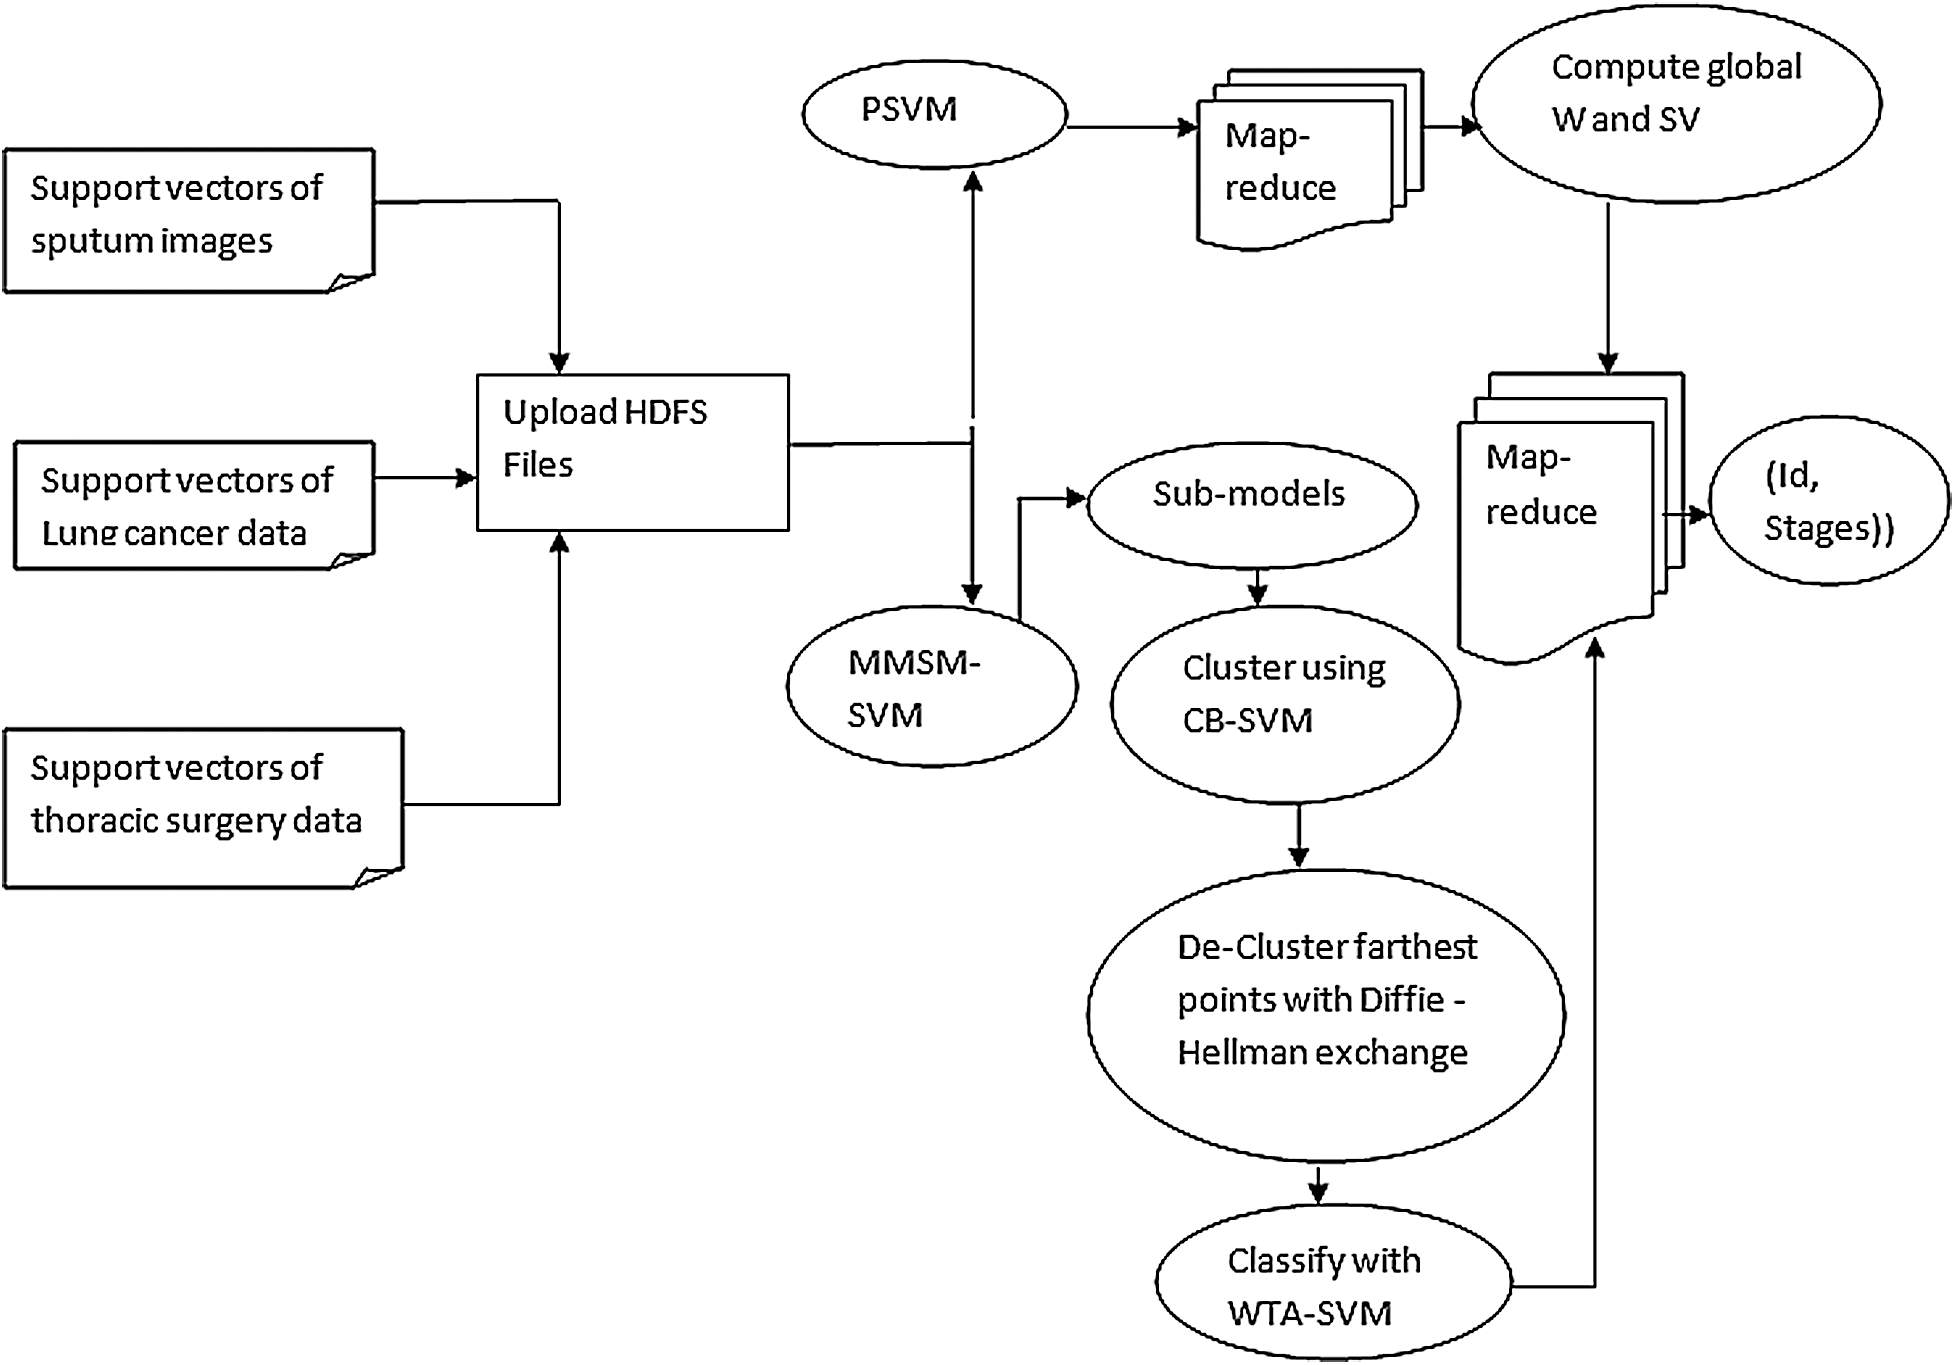
Figure 2: Design of developed approach
Fig. 3 shows the support vectors of sputum, lung cancer, and thoracic surgery datasets with n size. The size of support vectors may vary for every iteration.
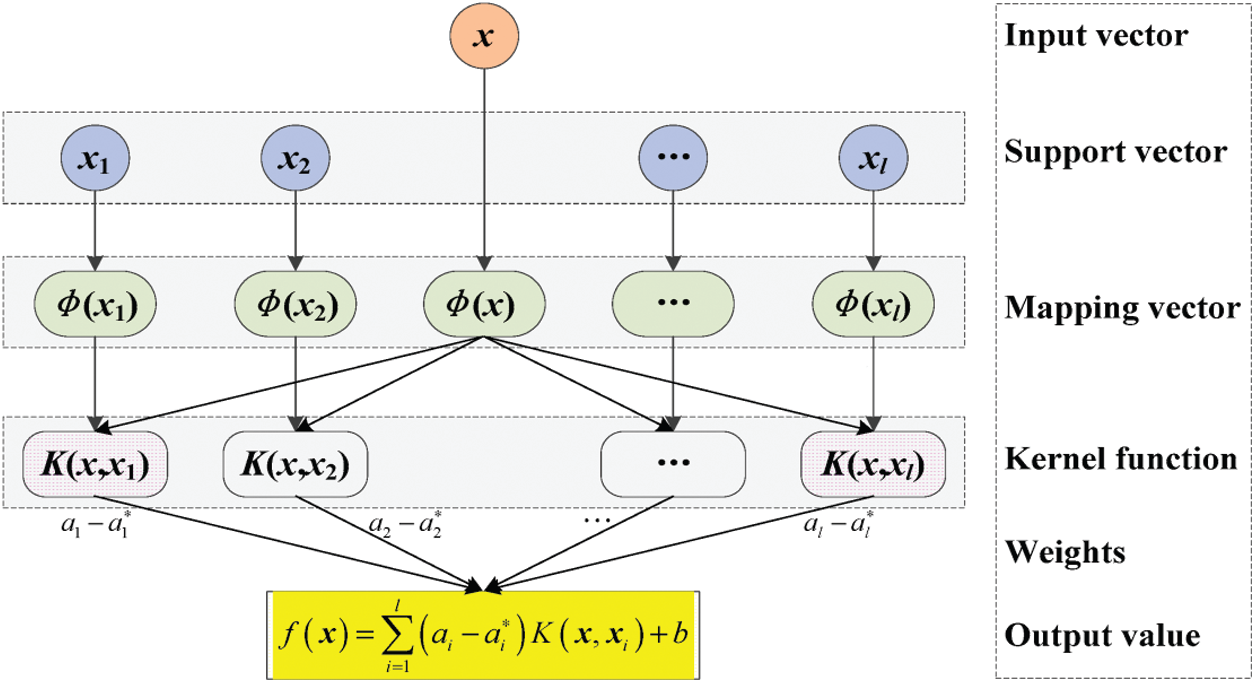
Figure 3: Parallel SVM architecture
Algorithm 2:
Input: n training instances, m number of machines, s global support vectors, h hypothesis, v iterations
Output:
1. Load support vectors of (xi, yi) for i = 0, 1
2. Use RDD.map() to generate (id, stages) pairs with RDD
3. For i = 0 to 1 do
4. Load xi into hdfs
5. End for
6. Initially h → 0, v → 0 in master node
7. While v > 0
8. V → v + 1
9. For each node in the cluster C, C = c1, c2… cm
10. S → s + 1;
11. S → s + n; add global support vectors with subsets of training data
12. Train support vector machine with new merged dataset.
13. Find out all the support vectors with each data subset.
14. Merge all local SVs and calculate the global SVs
15. If hv = hv−1stop, else go to step 8
16. fi(x) as final class
17. Map reduce ();
18. Generate (id, stages) with MapReduce()
19. End
MapReduce is a programming model suitable for processing huge data. The developed MapReduce is shown in Fig. 4. Hadoop is capable of running MapReduce programs written in various languages, such as Map phase and Reduce phase. An input to each phase is key-value pairs, and every programmer needs to specify two functions: map and reduce.
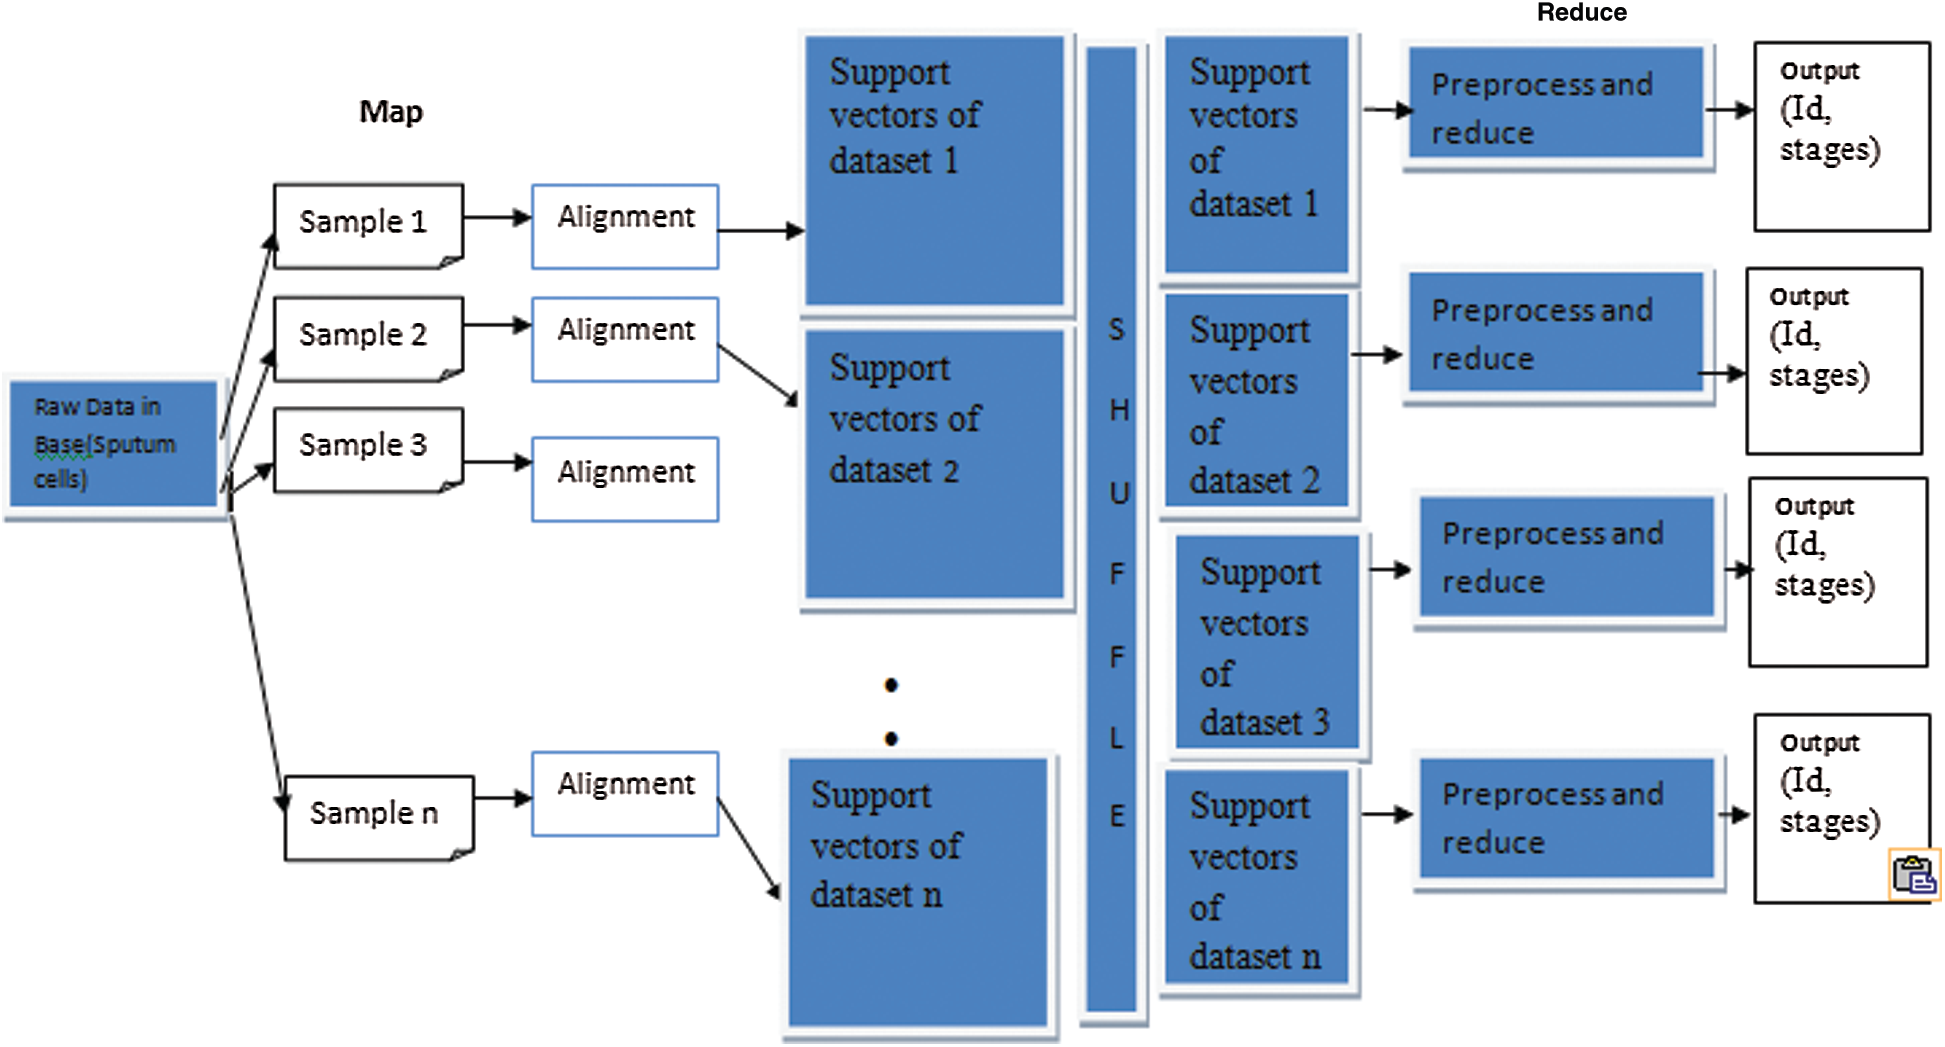
Figure 4: MapReduce framework of proposed methodology
Let MT be a set of all tasks with map function and MD be the results of data after being split. Let splitting (MS) be as follows,
MS depicts the splitting of input data in the map phase with respect to different tasks. The data derived from MS is the partial function of given input data, which is required.
Herein, the map phase involves portioning of input data and further returns reduced data, which is then fed as input to reduce tasks. Therefore, results of map tasks would be of (id, stages) pairs with unstructured format. The Reduce task is formatted as,
The above function (14) Reduce splits (RS) process intermediate results by formatting and generate partition of reduced data. Then, the reduced task (RT) is given by
RT takes input as RS and partitions the reduced data, which is in required format (id, stages).
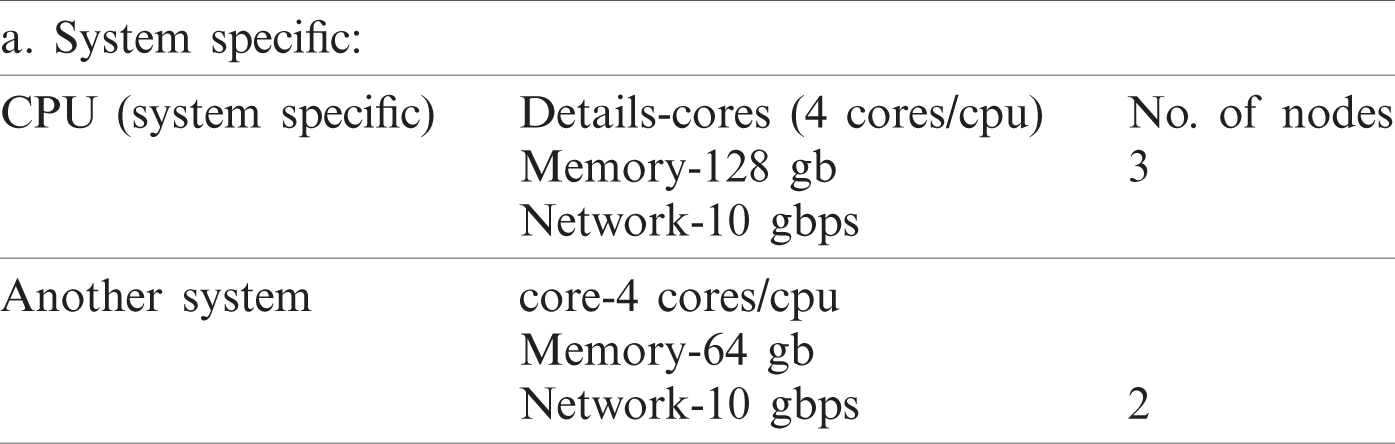
We computed the classification accuracy in the data center with three executors per node and five nodes used. Hence, five nodes with RAM size 64 GB and executor memory at 19 GB and total big data size to 500 GB are used. Furthermore, we increased data size starting from 5 GB by leap and bounds and reduced the running time. Hence, we need 15 tasks/node for data and used 75 tasks with five nodes in parallel. Moreover, Pyspark, LIBSVM, and MapReduce for Parallel SVM binary classification and MMSM-SVM environments were used for the parallel execution of multiclass. The datasets used in the experiment are listed in Tab. 1. We used 8:2 for sputum, thoracic surgery, and lung cancer datasets. Sample size for MMSM-SVM was 0.5. The iteration of the experiment increases by n times, where n depends on the size of the datasets.
The datasets used in our work are listed in Tab. 1. Furthermore, 8:2 was considered for sputum datasets, 7:3 for thoracic surgery datasets, and 5:5 for lung cancer datasets as training data. The sample size for MSM-SVM was 0.5. The iteration of the experiment increases by n times, where n depends on the size of the datasets. We set the iteration as 200 for binary because stability was achieved in the 200th iteration.
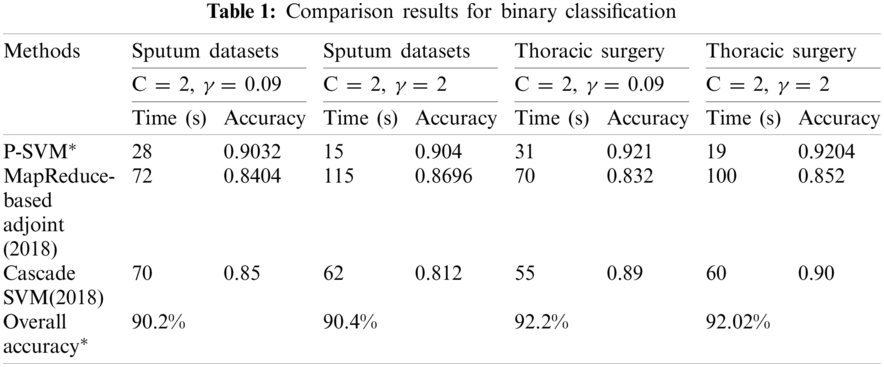
MMSM-SVM is also a submodel of P-SVM. The difference is that P-SVM classifies well in binary classification. To obtain accurate results, we used MMSM-SVM and P-SVM for multiclass and binary classification, respectively. The obtained experimental results are shown in Tabs. 1 and 2 for binary and multiclass classification, respectively. The obtained results were compared with previous literature [19,27]. C and γ values changed, and time in sec and accuracy were measured. The analysis was carried out on the basics of C = 2 and γ = 0.09 for sputum datasets, C = 2 and γ = 2 for sputum datasets, C = 2 and γ = 0.09 for thoracic surgery datasets, and C = 2 and γ = 2 for thoracic surgery datasets.
As shown in Tab. 1, the proposed methodology takes 28 s and 90% accuracy with C = 2 and γ = 0.09 for sputum datasets while 15 s and 90.4% accuracy for C = 2 and γ = 2 sputum datasets. Computation timing is 31 s and accuracy is 92.2% for C = 2 and γ = 0.09 thoracic surgery while 19 s and 92% for C = 2 and γ = 2 thoracic surgery. This analysis indicates that the proposed methodology takes lesser computational timing with higher accuracy when compared with the methods in [19,27]. These measures were observed at the dataset size of 5 GB.
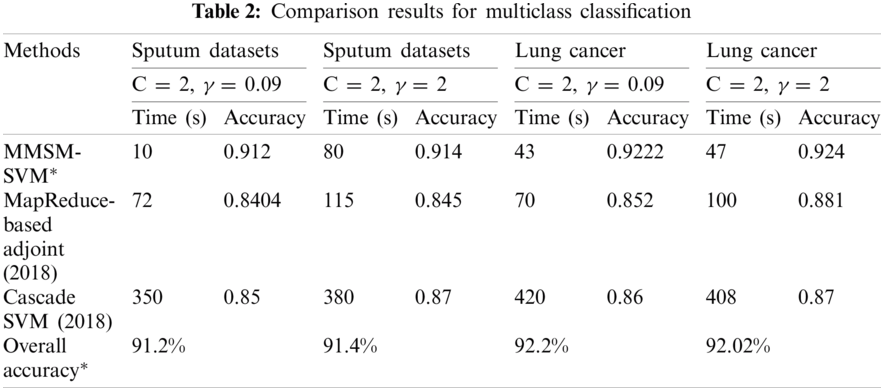
The results obtained for multiclass classification are listed in Tab. 2. This analysis was carried out on the basics of C = 2 and γ = 0.09 for sputum datasets, C = 2 and γ = 2 for sputum datasets, C = 2 and γ = 0.09 for lung cancer datasets, and C = 2 and γ = 2 for lung cancer datasets. As shown in Tab. 2, the proposed methodology takes 10 s and 91% accuracy with C = 2 and γ = 0.09 for sputum datasets while 80 s and 91.4% for C = 2 and γ = 2 sputum datasets. It has 43 s computation timing and 92.2% accuracy for C = 2 and γ = 0.09 lung cancer datasets while 47 s and 92.4% for C = 2 and γ = 2 lung cancer datasets. The average time for every model was compared with accuracy metrics to show that our proposed method performs better. As shown in Fig. 6, at the specified time 120 s, the accuracy of P-SVM is higher than those of other existing models. Meanwhile, the accuracy of MMSM-SVM is higher than other existing works, as shown in Fig. 6b. This analysis indicates that the proposed mythology takes lesser computational timing with increasing accuracy when compared with the methods in [19,27]. In addition, our dataset contains replicas of data to increase the dataset size.
The execution time and accuracy of our model analysis for 100–1000 mb samples are listed in Tabs. 1 and 2, and graphs for the corresponding plots are shown in Fig. 6.
For the five nodes and above parameter settings in Tab. 2, the average time computation and accuracy for the corresponding time were measured and compared with existing models.
Figs. 5a–5c depict the performance analysis of the sputum, lung cancer, and thoracic surgery datasets obtained for the proposed methodology. From the perspective of the results in Figs. 4–6, the accuracy improved to 92.2% and stabilized for varying iterations. Then, we increased the number of nodes and analyzed the performance. Fig. 6 shows the accuracy analysis for the binary and multiclass classification. As shown in Fig. 6a, the accuracy of P-SVM is higher than those of MapReduce and Cascade SVM. The accuracy measures are 3% higher than those of MapReduce and 8% higher than those of Cascade SVM. As illustrated in Fig. 6b, the accuracy of MMSM-SVM is higher than those of MapReduce and Cascade SVM. The above figure shows that the running time for each node is 120 s on average, which increases with increasing dataset size. For five nodes, it would become 300–380 s for five nodes. Similarly, task analysis was obtained from below graph for about 5 GB dataset. Hence, we increased the dataset size from 2 to 5 GB, and metrics outcomes deviate for each dataset size that has been discussed so far.
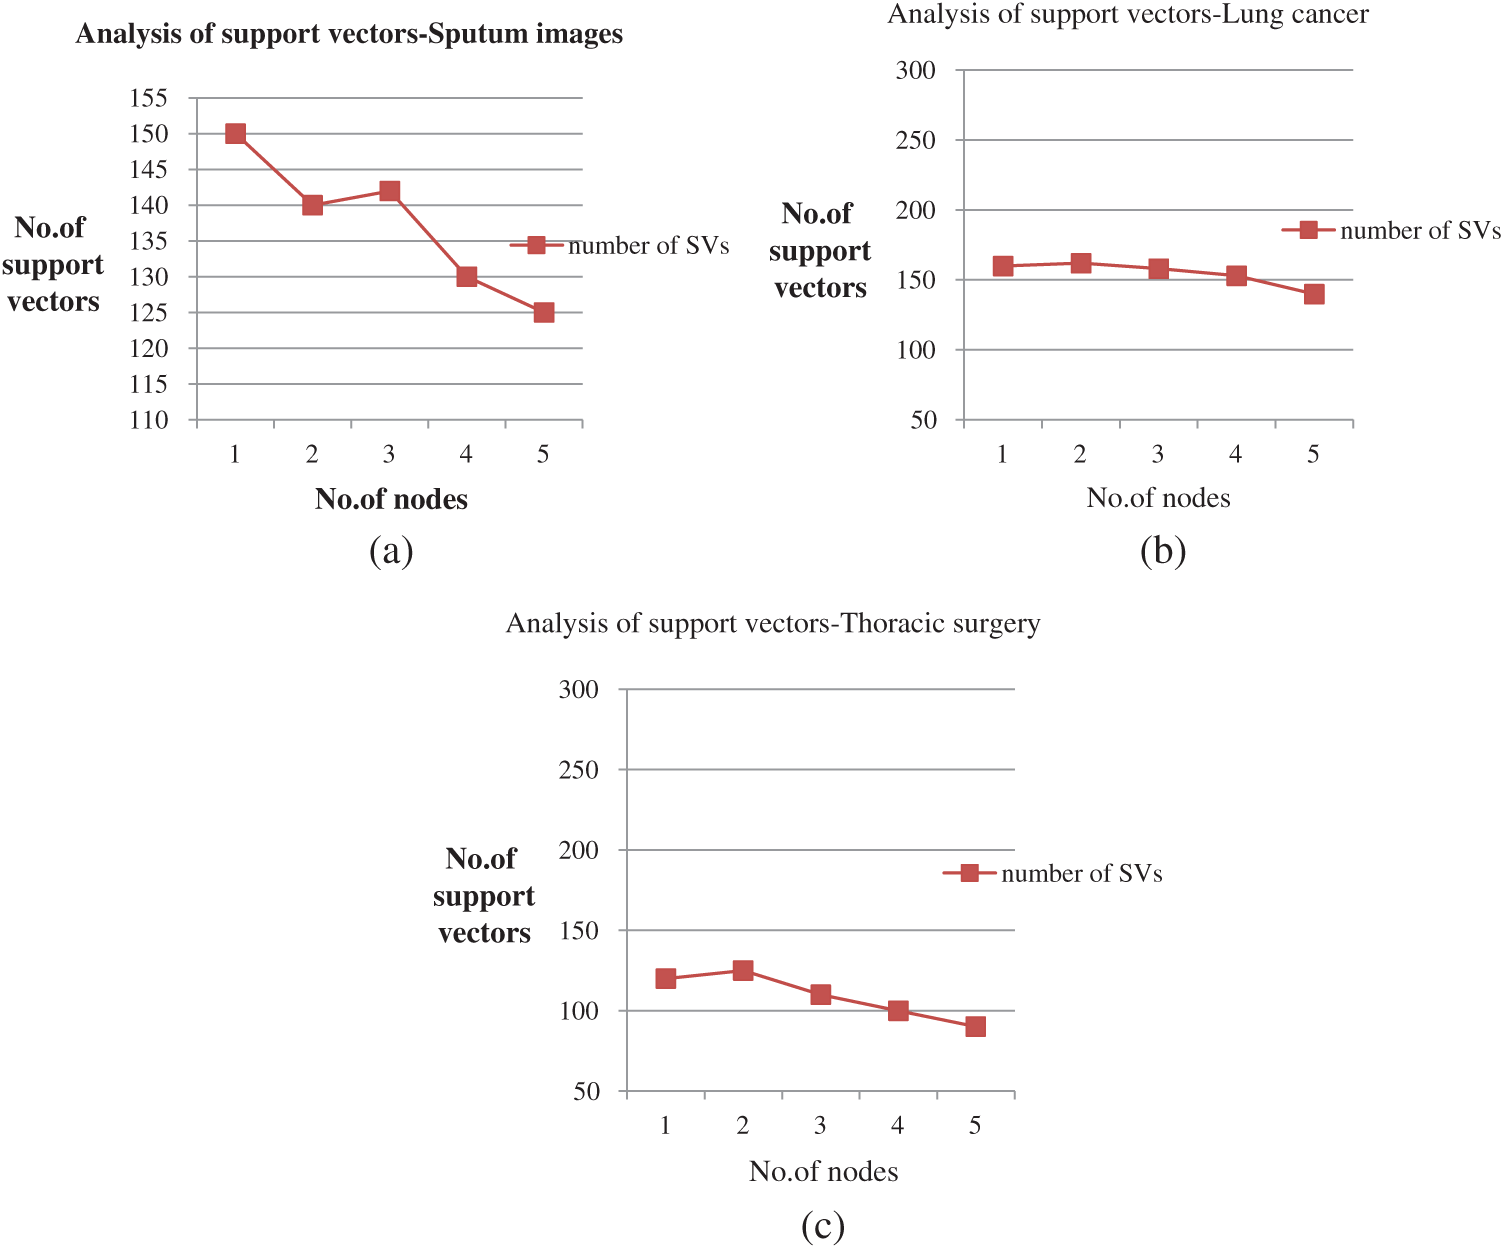
Figure 5: (a) Performance analysis for sputum datasets (b) Performance analysis of lung cancer datasets (c) Performance analysis of thoracic surgery datasets
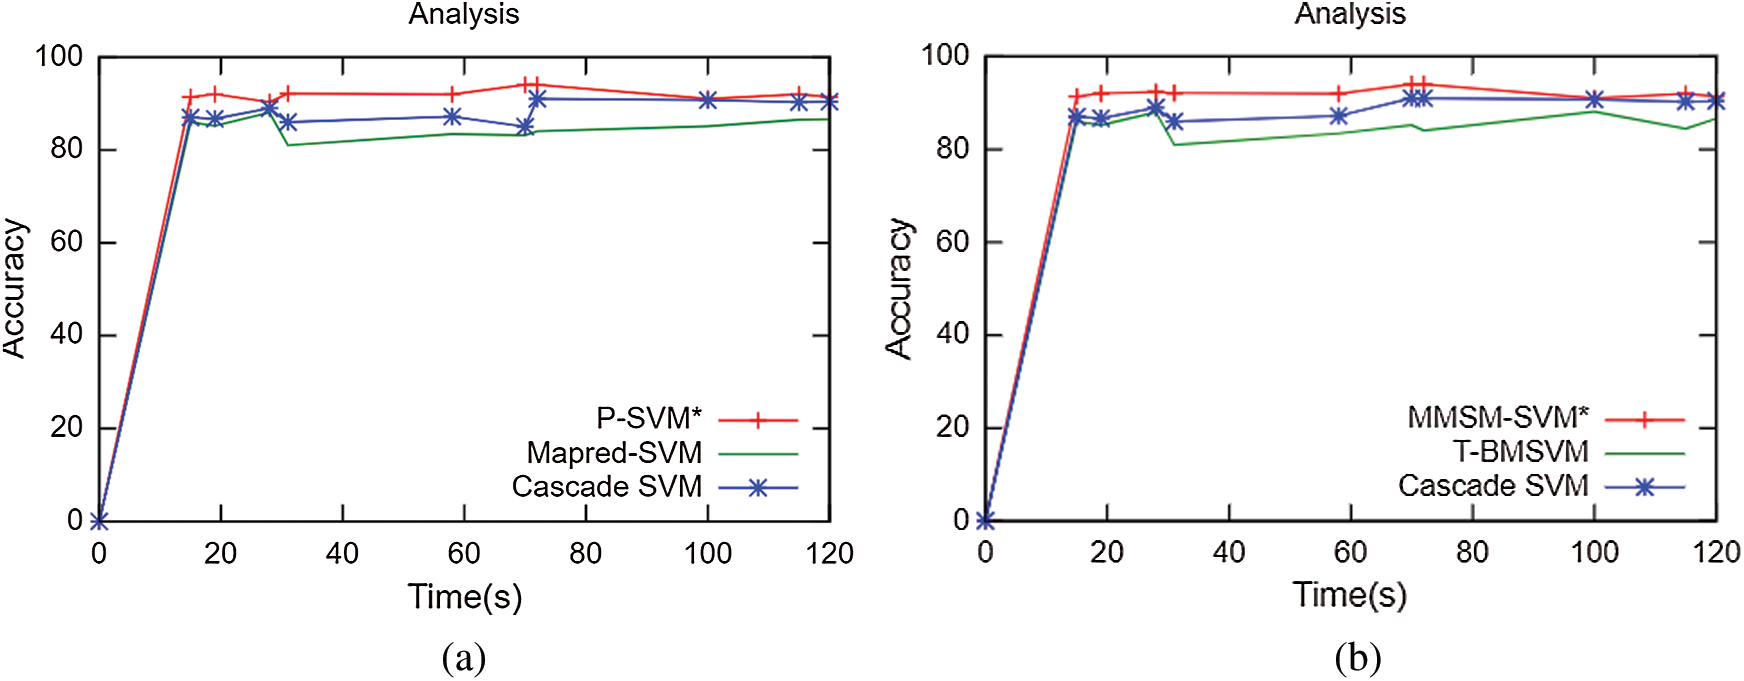
Figure 6: Accuracy analysis (a) Binary classification (b) Multiclass classification
The number of tasks analyzed for 5 GB data shows that it performs the optimal number of tasks for the corresponding dataset size. That is, it yields only 75 tasks for 5 GB data.
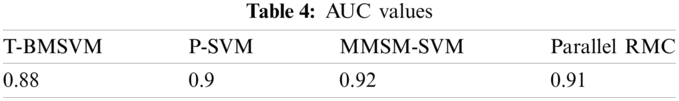
No. of tasks shared between five nodes (number of nodes required and allotted is discussed in Section 3) are as each node-4 cores, 15 tasks/node. In accordance with MapReduce and other tasks, optimized performance includes 20 tasks for 2 GB data and increased data set size as in Tab. 3. We achieved this optimization with respect to all jobs, specifically for MapReduce jobs. The graph plots are illustrated in Fig. 7. Furthermore AUC values were computed by measuring the specificity and sensitivity of various algorithms, as shown in Fig. 9. The corresponding values are listed in Tab. 4.
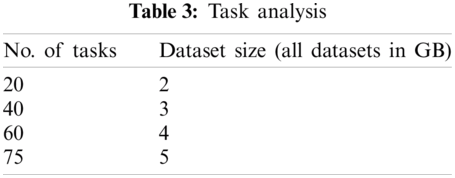
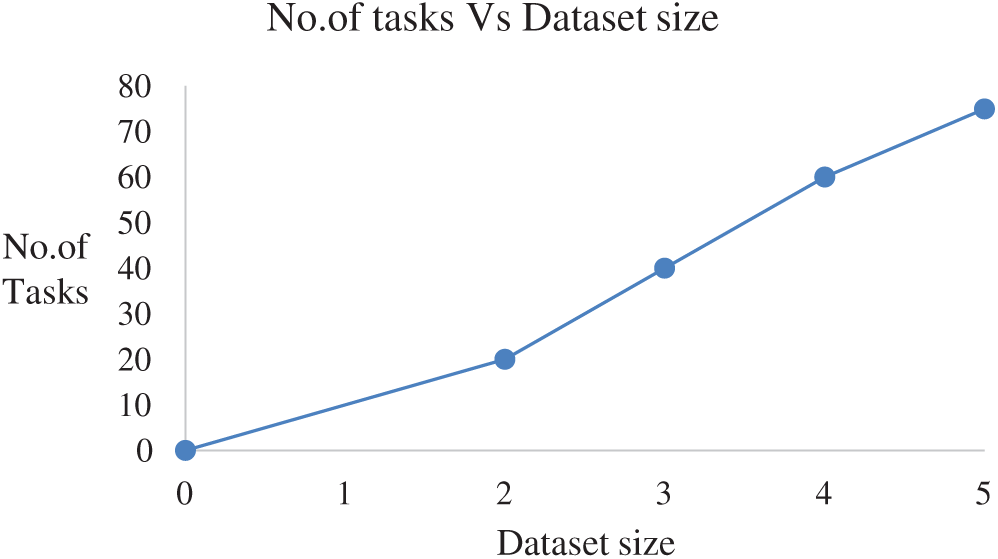
Figure 7: Task analysis
From the resource utilization, our algorithms and dataset should achieve better CPU utilization. In our study, we achieved about 70%–75% CPU utilization in an average of all algorithms. Fig. 9 illustrates the varying measures of balanced datasets in all our proposed algorithm. In specific, datasets utilize 74% in existing works compared with our proposed method. Even though all mechanisms work well in all metrics, we prove that our datasets work dynamically with respect to every algorithm. CPU utilization plots are illustrated in Fig. 8.

Figure 8: CPU utilization
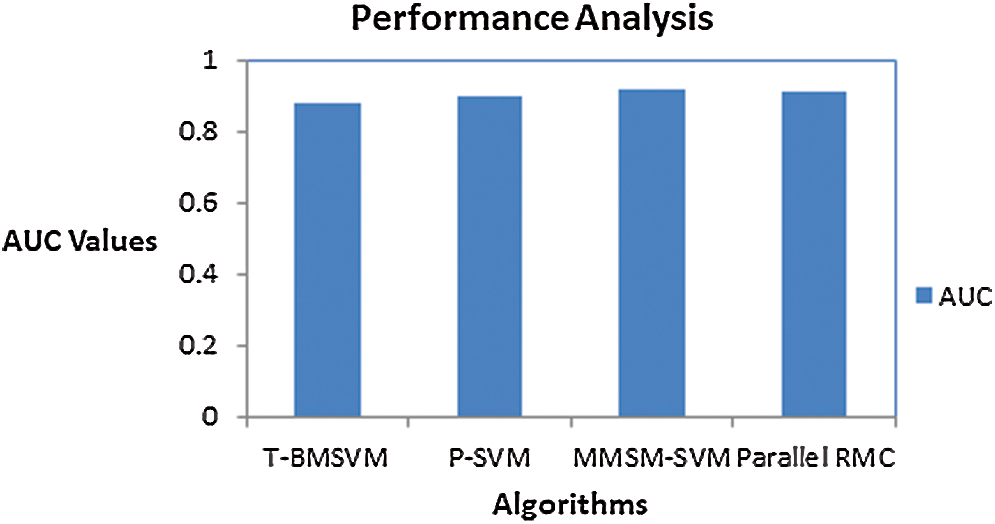
Figure 9: AUC scores for various methods
AUC values for the proposed models are specified in Tab. 4.
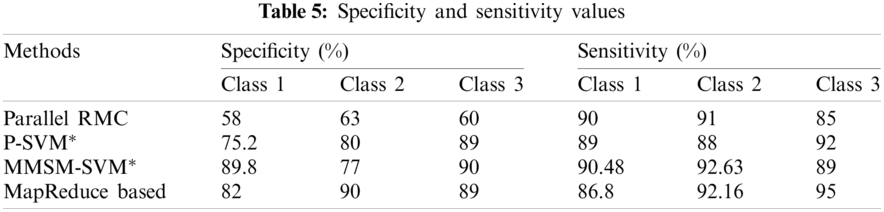
Sensitivity and specificity of all the classes in every model are discussed in Tab. 5, from which AUC values were calculated.
The accuracy of the proposed method is 2.3% higher than that of MapReduce and 7.2% higher than that of Cascade SVM. The results prove that the prediction efficiency using the proposed algorithm is greater than that using the MapReduce-based adjoint [19] and Cascade SVM [27]. In some plots, the parallel RMC proposed by [26] has been compared and proves the efficiency of the proposed models for some parameters.
P-SVM and MMSM-SVM were proposed to analyze the optimal classification of diseases, such as lung cancer. The proposed models for binary and multiclass classifications outperform other methodologies. For binary classification, P-SVM deployed and retrieved the stages by using the MapReduce phase. Meanwhile, for multiclass classification, MMSM-SVM retrieved the results with improved accuracy. Using KCB-SVM, datasets split regarding likely samples in a cluster so that the training phase is easier to do and works well in nonlinear dimensions. In addition, the proposed solution approximates better accuracy without repeated training and testing, which enables the model to use the classification and storage capacity. For load balancing, the model uses HDFS balancer. The approach enrolls multiclass with the winner-takes-all strategy. Results show that the support vectors and training time with a large set of data sets scrutinize binary and multiclass classification with optimized parameter settings. In addition, the proposed method shows an accuracy of 90% in classification when compared with competitive methodologies. Our work could diagnose the stages earliest. Thus, the proposed method can be applied to predict other healthcare-related issues, such as COVID-19, by collecting symptoms of patients from electronic health records. Our study can prevent COVID-19 by collecting health conditions of in-patients who treated for other diseases and predict the possibility of COVID-19.
Acknowledgement: This study is supported by the Tamil Nadu State Council of Science and Technology. The authors thank the government for their financial assistance and valuable support.
Funding Statement: This study is supported by the Tamil Nadu State Council of Science and Technology.
Conflicts of Interest: The authors declare that they have no conflicts of interest to report regarding the present study.
1. R. Lin, Z. Xie, Y. Hao and J. Wang, “Improving high-tech enterprise innovation in big data environment: A combinative view of internal and external governance,” International Journal of Information Management, vol. 50, pp. 575–585, 2020. [Google Scholar]
2. D. Fanelli and F. Piazza, “Analysis and forecast of COVID-19 spreading in China, Italy and France,” Chaos, Solitons & Fractals, vol. 134, pp. 1–6, 2020. [Google Scholar]
3. D. Arora, C. Ritu and S. Ajeet, “System biology approach to identify potential receptor for targeting cancer and biomolecular interaction studies of indole [2, 1-a] isoquinoline derivative as anticancerous drug candidate against it,” Interdisciplinary Sciences: Computational Life Sciences, vol. 11, no. 1, pp. 125–134, 2019. [Google Scholar]
4. C. M. Rice, S. A. Renowden, K. Urankar, S. Love and N. J. Scolding, “Brain biopsy before or after treatment with corticosteroids?,” Neuroradiology, vol. 62, no. 5, pp. 545–546, 2020. [Google Scholar]
5. K. Bandagar, P. Sowkuntla, S. A. Moiz and P. S. Prasad, “MR_IMQRA: An efficient mapreduce based approach for fuzzy decision reduct computation,” in Proc. PReMI, Tezpur, India, pp. 306–316, 2019. [Google Scholar]
6. S. H. Ebenuwa, M. S. Sharif, M. Alazab and A. Al-Nemrat, “Variance ranking attributes selection techniques for binary classification problem in imbalance data,” IEEE Access, vol. 7, pp. 24649–24666, 2019. [Google Scholar]
7. J. Zhao, Y. Xu and H. Fujita, “An improved non-parallel universum support vector machine and its safe sample screening rule,” Knowledge-Based Systems, vol. 170, pp. 79–88, 2019. [Google Scholar]
8. V. Abeykoon, G. Fox and M. Kim, “Performance optimization on model synchronization in parallel stochastic gradient descent based SVM,” in Proc. CCGRID, Larnaca, Cyprus, pp. 508–517, 2019. [Google Scholar]
9. S. Yadav and J. Prakash, “A survey on implementation of word-count with map reduce programming oriented model using hadoop framework,” in Proc. ICACSE, Sultanpur, UP, India, pp. 1–5, 2019. [Google Scholar]
10. C. Liu, B. Wu, Y. Yang and Z. Guo, “Multiple submodels parallel support vector machine on spark,” in Proc. IEEE Big Data, Washington, DC, pp. 945–950, 2016. [Google Scholar]
11. S. Neelakandan and D. Paulraj, “An automated exploring and learning model for data prediction using balanced CA-sVM,” Ambient Intelligence and Humanized Computing, pp. 1–12, 2020. [Google Scholar]
12. M. Javid and J. Hamidzadeh, “An active multi-class classification using privileged information and belief function,” Machine Learning and Cybernetics, vol. 11, no. 3, pp. 511–524, 2020. [Google Scholar]
13. A. Grover, A. Kalani and S. K. Dubey, “Analytical approach towards prediction of diseases using machine learning algorithms,” in Proc. CONFLUENCE, Noida, UP, India, pp. 793–797, 2020. [Google Scholar]
14. L. Yahaya, N. D. Oye and E. J. Garba, “A comprehensive review on heart disease prediction using data mining and machine learning techniques,” American Journal of Artificial Intelligence, vol. 4, no. 1, pp. 20–29, 2020. [Google Scholar]
15. C. B. Storlie, T. M. Therneau, R. E. Carter, N. Chia, J. R. Bergquist et al., “Prediction and inference with missing data in patient alert systems,” Journal of the American Statistical Association, vol. 115, no. 529, pp. 32–46, 2020. [Google Scholar]
16. Y. Wang, Y. Lv, L. Jin and G. Liang, “Revealing the mechanism of EGCG, genistein, rutin, qercetin, and silibinin against hIAPP aggregation via computational simulations,” Interdisciplinary Sciences: Computational Life Sciences, vol. 12, no. 1, pp. 59–68, 2020. [Google Scholar]
17. H. Ozkan, O. Ozhan, Y. Karadana, M. Gulcu, S. Macit et al., “A portable wearable tele-eCG monitoring system,” IEEE Transactions on Instrumentation and Measurement, vol. 69, no. 1, pp. 173–182, 2019. [Google Scholar]
18. J. P. Verma, B. Patel and A. Patel, “Big data analysis: Recommendation system with Hadoop framework,” in Proc. CICT, Ghaziabad, India, pp. 92–97, 2015. [Google Scholar]
19. M. Zettam, J. Laassiri and N. Enneya, “A mapreduce-based adjoint method for preventing brain disease,” Journal of Big Data, vol. 5, no. 27, pp. 1–7, 2018. [Google Scholar]
20. O. Kramer, “Cascade support vector machines with dimensionality reduction,” Applied Computational Intelligence and Soft Computing, vol. 2015, pp. 1–9, 2015. [Google Scholar]
21. A. Purwar and S. K. Singh, “Hybrid prediction model with missing value imputation for medical data,” Expert Systems with Applications, vol. 42, no. 13, pp. 5621–5631, 2015. [Google Scholar]
22. M. M. Mishu, “A patient oriented framework using big data & C-means clustering for biomedical engineering applications,” in Proc. ICREST, Dhaka, Bangladesh, pp. 113–115, 2019. [Google Scholar]
23. T. J. Mathew and E. Sherly, “Analysis of supervised learning techniques for cost effective disease prediction using non-clinical parameters,” in Proc. IC4, Thiruvananthapuram, India, pp. 356–360, 2018. [Google Scholar]
24. R. Sitharthan, T. Parthasarathy, S. S. Rani and K. C. Ramya, “An improved radial basis function neural network control strategy-based maximum power point tracking controller for wind power generation system,” Transactions of the Institute of Measurement and Control, vol. 41, no. 11, pp. 3158–3170, 2019. [Google Scholar]
25. T. A. Naqishbandi and N. Ayyanathan, “Clinical big data predictive analytics transforming healthcare:an integrated framework for promise towards value-based healthcare,” in Proc. ICETE, Hyderabad, India, pp. 545–561, 2020. [Google Scholar]
26. Z. Qi, Y. Tian, Y. Shi and V. Alexandrov, “Parallel RMCLP classification algorithm and its application on the medical data,” IEEE Transactions on Cloud Computing, vol. 8, no. 2, pp. 532–538, 2020. [Google Scholar]
27. G. Jaya Brindha and E. S. G. Subbu, “Ant colony technique for optimizing the order of cascaded SVM classifier for sunflower seed classification,” IEEE Transactions on Emerging Topics in Computational Intelligence, vol. 2, no. 1, pp. 78–88, 2018. [Google Scholar]
 | This work is licensed under a Creative Commons Attribution 4.0 International License, which permits unrestricted use, distribution, and reproduction in any medium, provided the original work is properly cited. |