DOI:10.32604/cmc.2022.019435
| Computers, Materials & Continua DOI:10.32604/cmc.2022.019435 | |
| Article |
Optimal Load Forecasting Model for Peer-to-Peer Energy Trading in Smart Grids
1Department of Electrical and Electronics Engineering, Christian College of Engineering and Technology, Oddanchatram, 624619, India
2Department of Electrical and Electronics Engineering, K. Ramakrishnan College of Engineering, Tiruchirappalli, 621112, India
3Department of Computer Science and Engineering, Christian College of Engineering and Technology, Oddanchatram, 624619, India
4Department of Computer System and Technology, Faculty of Computer Science and Information Technology, University of Malaya, 50603, Kuala Lumpur, Malaysia
5Department of Information Systems, King Khalid University, Muhayel Aseer, 62529, Saudi Arabia
6Department of Information Systems - Girls Section, King Khalid University, Mahayil, 62529, Saudi Arabia
*Corresponding Author: Ihsan Ali. Email: ihsanali@ieee.org
Received: 13 April 2021; Accepted: 28 May 2021
Abstract: Peer-to-Peer (P2P) electricity trading is a significant research area that offers maximum fulfilment for both prosumer and consumer. It also decreases the quantity of line loss incurred in Smart Grid (SG). But, uncertainities in demand and supply of the electricity might lead to instability in P2P market for both prosumer and consumer. In recent times, numerous Machine Learning (ML)-enabled load predictive techniques have been developed, while most of the existing studies did not consider its implicit features, optimal parameter selection, and prediction stability. In order to overcome fulfill this research gap, the current research paper presents a new Multi-Objective Grasshopper Optimisation Algorithm (MOGOA) with Deep Extreme Learning Machine (DELM)-based short-term load predictive technique i.e., MOGOA-DELM model for P2P Energy Trading (ET) in SGs. The proposed MOGOA-DELM model involves four distinct stages of operations namely, data cleaning, Feature Selection (FS), prediction, and parameter optimization. In addition, MOGOA-based FS technique is utilized in the selection of optimum subset of features. Besides, DELM-based predictive model is also applied in forecasting the load requirements. The proposed MOGOA model is also applied in FS and the selection of optimal DELM parameters to improve the predictive outcome. To inspect the effectual outcome of the proposed MOGOA-DELM model, a series of simulations was performed using UK Smart Meter dataset. In the experimentation procedure, the proposed model achieved the highest accuracy of 85.80% and the results established the superiority of the proposed model in predicting the testing data.
Keywords: Peer to Peer; energy trade; smart grid; load forecasting; machine learning; feature selection
The drastic increase in the dispersion of Renewable Energy Sources (RES) like roof-top Photovoltaic (PV) panel, small-sized wind turbine and enhanced networking components, transformed the classical energy consumer to a prosumer who exploits and sells the produced energy [1]. Owing to stochastic characteristics of DER, it is challenging to forecast and meet the energy demands. As a result, when a prosumer has excess electricity than his/her consumption level, the energy can either be stored in batteries and/or be traded to another consumer or to the grid. This direct Energy Trading (ET) process between prosumer and the consumer is called Peer-to-Peer (P2P) ET which generally occurs in local electricity distribution systems. In P2P ET, the peer is normally an individual entity or a set of entities who trade the energy straightaway or with other peers without any intermediaries like local energy suppliers. In unidirectional traditional ET technique, energy is generally transmitted from large scale generators to consumers through long distance electricity transmission networks, whereas the cash flow occurs in reverse direction.
On the contrary, a P2P ET market allows multi-directional trading in local P2P markets. Several trials have been conducted so far from which it is realized that the ET depends on ‘P2P economy’. These trials mostly found that the electricity consumers were offered discounted pricing so that they can prefer the intended energy supplier. The responsibility of P2P energy transaction, at the stage of distribution network, has been examined in the last decade. In literature [2], a P2P-enabled networking model was presented to save the energy bill for every micro-grid and enhance the applicability of local DER. An ensemble of demand-side organisation models was integrated together with P2P ET to minimise the cost incurred in SG. In addition, the researchers [3] introduced a distributed demand-side management model in collaboration with public ET to reduce the home energy bill in community microgrid. In the study conducted earlier [4], a price-enabled demand response energy distribution technique was developed. In addition, a part of multi-agent energy management technique has also been developed in the recent times.
The release of Advanced Metering Infrastructures (AMI), networking technology, and electronic domains in SG together help in recording, monitoring and analyzing the effect of manipulating characteristics on electric load prediction process. Earlier, traditional and computational intelligence techniques were used to forecast electricity load demands. There exists a few Machine Learning (ML) models to forecast the energy load demands. However, there is a need exists for appropriate method that can resolve the issues mentioned above i.e., imprecise prediction outcomes and high financial loss. When the prediction results observe 1% error, it increases the cost incurred upon total utility up to 10 million. So, the electricity utilization company designed a rapid, reliable, and easy short-term electric load forecasting technique. In addition, a precise predictive process was found to be advantageous in the detection of significant faults and achievement of consistent grid operations.
In recent years, several load predictive techniques have been presented with the application of decision-making process in SG. In literature [5], a new generalised method was presented to model the offline data. This method comprises of distinct seasonal cycles that use Autoregressive and Moving Average (ARMA) components. An Ensemble Subsampled Support Vector Regression (ESSVR) was developed in the literature [6] to forecast and estimate the load requirements. Besides, a Deep Belief Network (DBN) Restricted Boltzmann Machine (RBM) was applied for load prediction. It mitigated the predictive error to a reasonable computation time. Hong et al. predicted the electricity load demands using an hybridisation technique in which Seasonal Recurrent Support Vector Regression (SRSVR) technique was applied along with Chaotic Artificial Bee Colony Algorithm (CABCA). The experimental results were evaluated through comparative analysis against ARIMA technique. Although the previous works offered a reasonable analysis of electric load prediction, there is still a need to devise effective load forecasting models.
The current research paper presents a new Multi-Objective Grasshopper Optimisation Algorithm (MOGOA) with Deep Extreme Learning Machine (DELM)-based short-term load predictive technique called MOGOA-DELM model P2P ET in SGs. The proposed MOGOA-DELM model involves four distinct stages of operations such as data cleaning, Feature Selection (FS), prediction, and parameter optimization. Further, the study also exploited the MOGOA-based FS technique to select the optimum subset of features. Besides, DELM-based predictive model is employed in forecasting the load demands. The utilization of MOGOA for FS as well as the optimal choice of DELM parameters enhanced the predictive outcome. A detailed experimentation analysis was carried out on UK smart meter dataset to validate the effectiveness of the proposed MOGOA-DELM model.
New Internet of Things (IoT)-enabled Deep Learning (DL) model was presented in the literature [7] to overcome the load forecasting problem with maximum accuracy. In addition, this model qualitatively investigated the manipulation, since it primarily influences the prediction process. But the crucial part is the distribution of massive quantities of data in available communication networks. An Adaptive Hybrid Learning Model (AHLM) was presented for forecasting the intensity levels of solar irradiance. In addition, the study also exploired the hybridisation of Back Propagation (BP), Genetic algorithm (GA), and Neural Network (NN) for learning nonlinear characteristics of the data. The presented AHLM model learnt the nature through offline data and effectively forecasted the solar intensities. The presented technique outperformed both short and long-term prediction horizons. Prediction is crucial for optimal and significant harvesting of solar energy. Therefore, both shrinkage and election operator techniques were presented to forecast the production of solar energy. The proposed model was trained based on the past climatic data to minimise the forecasting errors and the results revealed the supremacy of the parameters involved in training process.
A new hybrid short-term load forecasting technique was designed in the literature [8] using Enhanced Empirical Mode Decomposition, ARIMA, and Wavelet Neural Network (WNN) that was optimized through Fruit-Fly Immune (FFI) method. To determine the superior performance of the presented technique, the electric load data was exploited. The experimental values showcased the effectual outcome of the presented model over available techniques. Another DL-based electricity load forecasting technique was developed in the literature [9]. It extracts the abstracted features using a stacked denoising auto-encoder model. Using the extracted features, Support Vector Regression (SVR) was trained to forecast the load demand. A novel ELM model was presented in the literature [10] based on mixed kernel for upcoming load prediction.
Zeng et al. [11] developed a new model through hybridization of ELM switching delayed Particle Swarm Optimisation (PSO) technique to forecast the short-term load. Both weight and bias parameters were tuned using switching delayed technique. A tanh-based activation function was utilised due to the characteristics of generalisation issue which gets rid of both needless hidden node and over-training issues. The simulation values showcased that the presented technique has outperformed the RBF NN model. In Zhang et al. [12], another hybrid prediction technique was proposed through the integration of Singular Spectrum Analysis (SSA), SVM, and Cuckoo Search (CS) model for load forecasting. The past data was cleaned using SSA and was fed as input to Support Vector Machine (SVM) for prediction. In addition, the tuning of the parameters, involved in SVM, was performed using the chosen CS algorithm.
In Chen et al. [13], a clustering-based hybridization technique was designed to predict the electricity demands of hotels on an hourly basis. The operation building remains non-stationary, owing to the presence of uneven electric temporal characteristics. An online modified predictive technique was presented using SVR and wavelet decomposition technique with fuzzy C-Means (FCM) algorithm. The presented technique enhanced the accuracy over other classical models. In Guo et al. [14], a novel Deep Neural Network (DNN) technique was developed to forecast the short-term load. It was validated against the case study conducted in China upon energy consumption. Another hybridized forecasting technique was designed in the literature [15] by integrating feature extractor and 2-stage predictor. The 2-stage predictor used Ridgelet Neural Network (RNN) and Elman neural network for precise forecasting. Also, an optimisation algorithm was utilised in the selection of control variables in the predictor. A short-term load predictive model, using SVR, was presented in the literature [16] to increase the relative forecast accuracy and effectiveness.
3 The Proposed MOGOA-DELM Model
The overall working principle involved in the proposed MOGOA-DELM model is shown in Fig. 1. Primarily, smart meter data is preprocessed to remove the unwanted details and improve the quality of data. Next, MOGOA-based feature subset selection process is carried out to choose an optimal set of features. Finally, the DELM model is applied for load prediction in SG environment. Simultaneously, MOGOA-based hyperparameter optimisation process is carried out to decide the parameter values of the DELM model.
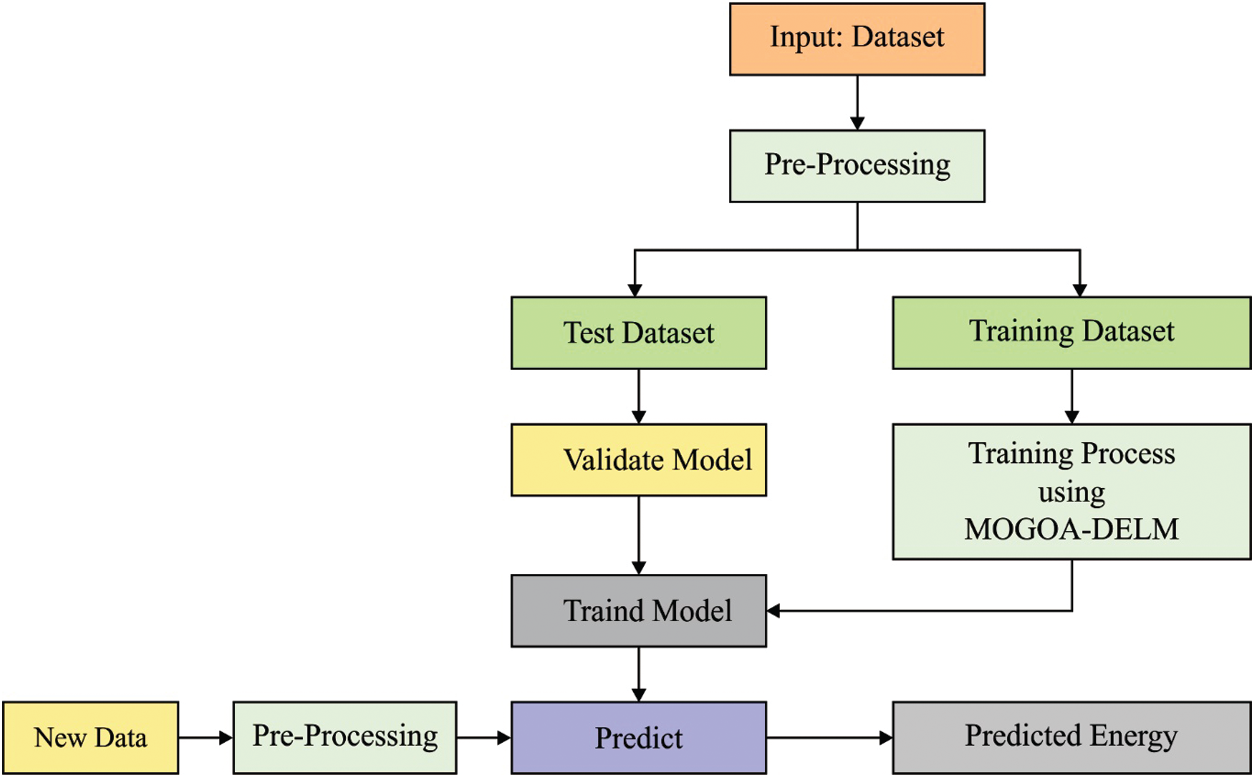
Figure 1: The working process of MOGOA-DELM model
At the beginning, the input data is fed into data cleaning stage. The missing values are filled with the mean values of the past electricity information. The cleaned data is then provided and normalised due to outliers, while the weight matrix is considerably low. At the end of preprocessing, the data quality gets increased to a certain level.
3.2 MOGOA Based Feature Selection
GOA is presented based on the foraging behaviour of grasshoppers. GOA is mathematically defined based on the formula that decides the location of every grasshopper and is shown in Eq. (1):
where
where
The complete values of the distance beween ‘i’th and ‘j’th representatives are defined herewith.
Therefore, the normalised value can be calculated as follows.
where
Therefore,
The peculiar characteristic of GOA is the attenuation of comfortable zone based on rounds. The comfort region represents the sphere over optimal agent. In comfort region, rest of the agents are expelled from the leader and are attracted to the exterior of the comfort region [17]. The comfort region is the sphere of optimal agent. The decreasing coefficient
where
where
Under FS problem, every result is constrained to the binary values of 0 and 1. To employ GOA in FS, a binarised model is presented. Here, a solution can be represented as 1-dimensional vector, where the vector length depends on the feature count in actual dataset. The cells in the vector has either ‘1’ or ‘0’. Here, value ‘1’ denotes the selection of respective feature; else, the value is kept as ‘0’. Eq. (9) is implemented to map the continuous values to binary ones.
where
FS process could be defined by multiobjective optimisation issue in which two contradictory aims need to be attained, with lesser attributes and higher classifier outcome. Fig. 2 shows the flowchart of GOA model. Here, optimum solution is the solution that is comprised of few chosen features and a better classifier outcome. The predictive outcome of the DELM model is employed as the fitness function to assess the performance of every search agent [18]. To balance the chosen feature count and classifier outcome, the fitness function of GOA can be defined as follows
where
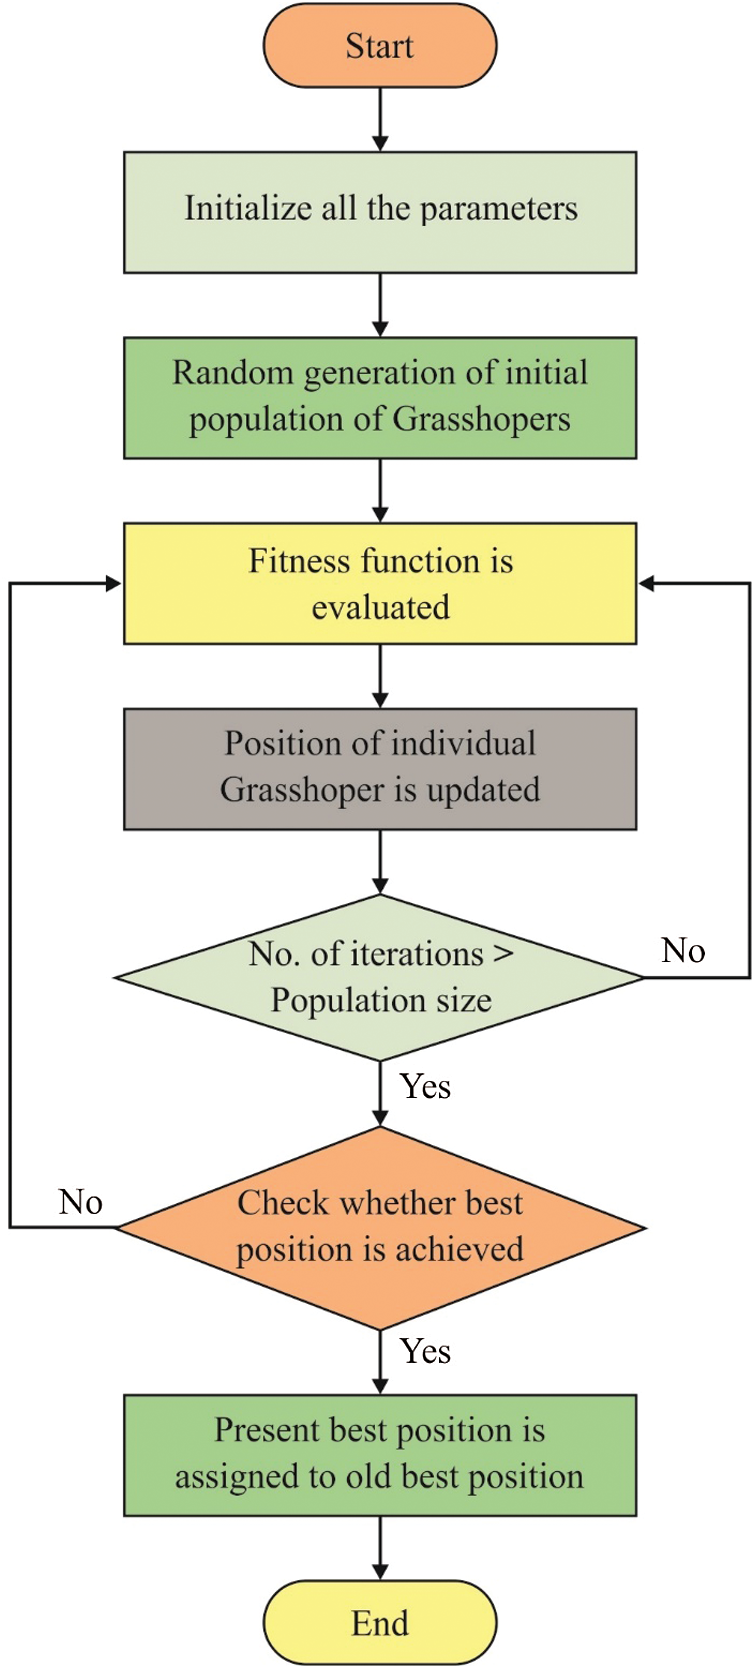
Figure 2: The flowchart of GOA algorithm
Here, MOGOA is applied as a wrapper FS technique by applying DELM classification model as a fitness function. It can be used with DELM classifier to evaluate the efficiency of the selected set of features. The proposed MOGOA-DELM model comprises of two major levels namely, FS and classification. Firstly, the MOGOA-DELM model receives the actual data as input, whereas the MOGOA selects a valuable set of features which is then fed into DELM model.
In this stage, DELM-based prediction process is carried out for electricity load prediction. Autoencoder (AE) is an Artificial Neural Network (ANN) method which is widely employed in DL concepts. It is a kind of unsupervised NN, where the output and input of the AE are identical in nature. ELM-AE is an updated model which is used in the generation of input signal and AE. Fig. 3 portrays the structure of ELM. ELM-AE model comprises of input, hidden, and output layers. Based on the Hidden Layer (HL) outcome that defines the input signal, ELM-AE model is partitioned into three distinct demonstrations as given below.
•
•
•
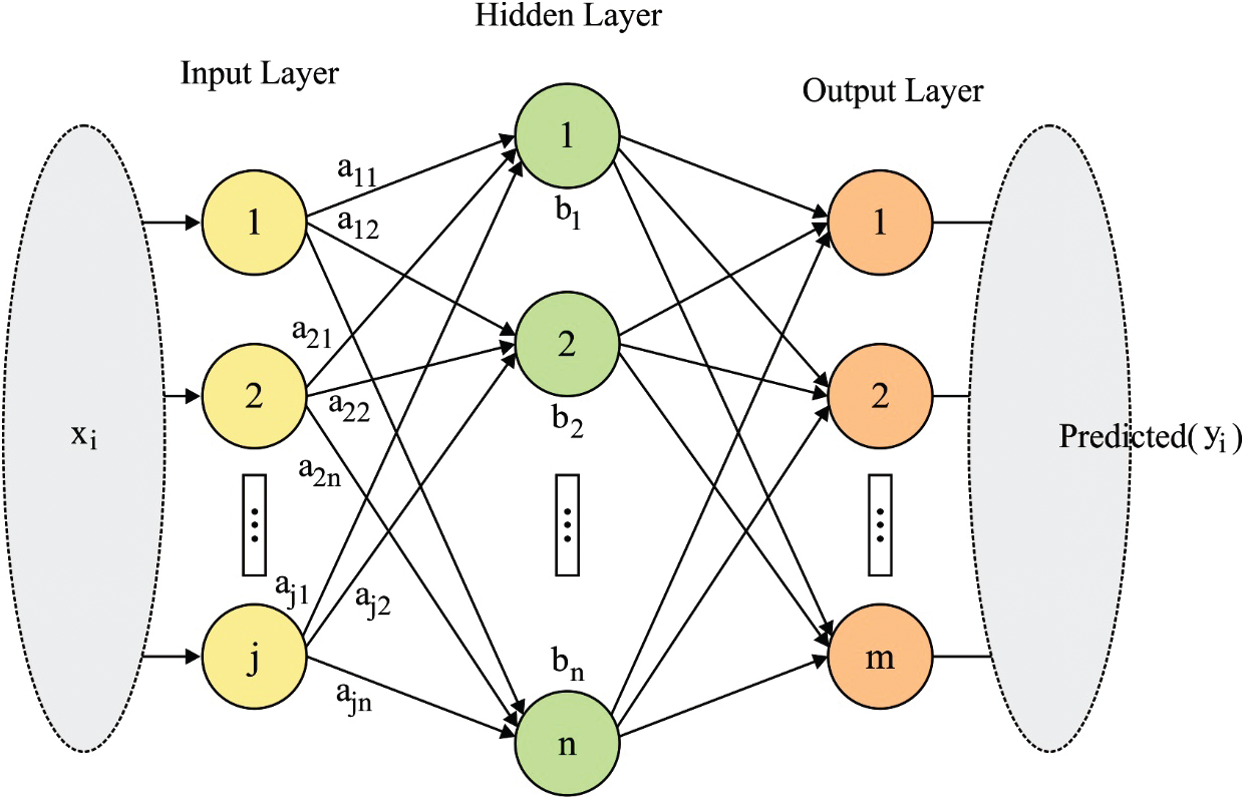
Figure 3: The structure of ELM
There exists two major variations between ELM-AE and classical ELM model. Primarily, ELM is a supervised learning model in which the outcome of the ELM denotes labels. However, ELM-AE is an unsupervised NN model, and the outcome of ELM-AE is identical to the input of ELM-AE. To
The ELM-AE model is used to obtain the output weight
If the training sample count is lower than the HL node count, then
For equivalent dimension ELM-AE representation, the output weight
Multilayer Extreme Learning Machine (MLELM) is one of the unsupervised networks which is commonly used to train the variables in all layers. However, there is a variation i.e., MLELM model does not require fine-tuning of the network [19]. It utilises the ELM-AE model to train the variables in all layers and the MLELM HL activation function is found to be linear or non-linear piecewise. When the activation function of MLELM
where
MLELM utilises ELM-AE for parameter training in all the layers whereas the ML-ELM HL activation function is found to be linear or non-linear piecewise, and the mapping of MLELM is either linear or nonlinear. If the mapping is unknown, then the HL can be added while the kernel function can be constructed. Alternatively, the outcome of MLELM HL
where
3.4 Parameter Optimization Using MOGOA
MOGOA is applied in the selection of hyperparameters for DELM model. Here, Gaussian kernel is used with parameter
where the fitness is determined for the tested data. For parameter tuning process, MOGOA is used [20]. In addition, all the agents are defined using
The performance of the MOGOA-DELM model was validated using UK Smart Meter dataset [21], which contains household id, plans used (standard or dynamic time of use), date and time, meter readings (Kwh), and acorn groups. Tabs. 1–3 and Figs. 4–6 show the result of the analysis conducted for MOGOA-DELM model against existing techniques under the application of three datasets such as training, validation, and testing.
Tab. 1 provides a detailed comparison of MOGOA-DELM model against existing methods on training dataset [22,23]. The table values denote that the RF model exhibited ineffective prediction outcomes with a MAPE of 32.48, accuracy of 30.88%, and MSE of 0.3. The ARIMA technique offered slightly upgraded outcomes with a MAPE of 38.24, accuracy of 31.01%, and MSE of 0.35. In the meantime, the Fg model accomplished somewhat enhanced results with a MAPE of 51.86, accuracy of 34.28%, and MSE of 0.72. Followed by, the L_f model resulted in a moderate MAPE of 36.08, accuracy of 34.37%, and MSE of 0.32. Along with these results, the L_b model accomplished a manageable outcome with a MAPE of 36.03, accuracy of 36.15%, and MSE of 0.31. KNN model reached a certain increase with its MAPE value being 33.36, accuracy being 36.15% and MSE being 0.31. Though the RPART model resulted in somewhat reasonable results i.e., MAPE of 37.08, accuracy of 36.36%, and MSE of 0.32, the NNET model surpassed it with a MAPE of 32.39, accuracy of 39.99%, and MSE of 0.34. Besides, the Z24 model gained increased outcomes over NNET with a MAPE of 42.94, accuracy of 40.9%, and MSE of 0.61. Simultaneously, the SVR model displayed satisfactory results by achieving a MAPE of 28.73, accuracy of 43.98%, and MSE of 0.35. Eventually, the ARIMA-NN model produced a competitive result of MAPE—27.8, accuracy of 44.32%, and MSE of 0.31. But the presented MOGOA-DELM model outperformed all other methods with a MAPE of 10.73, accuracy of 89.94%, and MSE of 0.12.

Tab. 2 demonstrates a detailed comparison of MOGOA-DELM method against existing models on validation dataset. The table values infer that the ARIMA model showcased ineffective prediction outcome with a MAPE of 50.60, accuracy of 18.57%, and MSE of 0.49. Likewise, the KNN method has offered somewhat increased results with the MAPE of 35.01, accuracy of 33.28%, and MSE of 0.39. Along with that, the L_b technique accomplished somewhat higher outcomes with a MAPE of 34.19, accuracy of 35.07%, and MSE of 0.40. Afterwards, L_f model achieved moderate results with a MAPE of 33.72, accuracy of 35.81%, and MSE of 0.43. Similarly, the RPART model accomplished manageable results with a MAPE of 38.69, accuracy of 37%, and MSE of 0.42. Fg model attained certainly higher result with a MAPE of 45.74, accuracy of 37.59%, and MSE of 0.77. However, the RF model produced slightly reasonable results with a MAPE of 32.72, accuracy of 37.89%, and MSE of 0.39. The NNET model surpassed it with a MAPE of 32.19, accuracy of 41.60%, and MSE of 0.41. Also, the Z24 approach gained an increased outcome over NNET with a MAPE of 40.33, accuracy of 43.68%, and MSE of 0.59. At the same time, the SVR model portrayed satisfactory results and ended up with a MAPE of 28.95, accuracy of 44.43%, and MSE of 0.46. Eventually, the ARIMA-NN methodology resulted in a competitive outcome with a MAPE of 28.12, accuracy of 45.34%, and MSE of 0.39. But the presented MOGOA-DELM method has surpassed other techniques with a MAPE of 11.89, accuracy of 87.63%, and MSE of 0.14.
Tab. 3 showcases a detailed comparison of MOGOA-DELM model against existing techniques on testing dataset. The table values represent that the ARIMA model portrayed an ineffective prediction outcome with a MAPE of 41.14, accuracy of 20.83%, and MSE of 0.26. In line with this, the L_b manner offered a somewhat higher result with a MAPE of 36.05, accuracy of 33.63%, and MSE of 0.22. Simultaneously, the RPART approach accomplished a slightly higher results with a MAPE of 38.50, accuracy of 35.12%, and MSE of 0.24. The L_f technique resulted in a moderate outcome with a MAPE of 36.50, accuracy of 35.71%, and MSE of 0.23. Likewise, Fg method too accomplished manageable results with a MAPE of 56.27, accuracy of 37.80%, and MSE of 0.63. Similarly, the RF model obtained a certainly higher value with a MAPE of 32.57, accuracy of 41.07%, and MSE of 0.22. Even though the KNN model produced somewhat reasonable outcome with a MAPE of 30.27, accuracy of 41.37%, and MSE of 0.22, the NNET model surpassed it with a MAPE of 30.28, accuracy of 42.26%, and MSE of 0.21. Moreover, the Z24 model gained enhanced results over NNET with a MAPE of 37.69, accuracy of 45.83%, and MSE of 0.44. Simultaneously, the SVR model demonstrated satisfactory results and produced a MAPE of 26.78, accuracy of 47.02%, and MSE of 0.23. But, the ARIMA-NN method resulted in a competitive result with a MAPE of 28.12, accuracy of 45.34%, and MSE of 0.39. Finally, the proposed MOGOA-DELM methodology outperformed all other models with a MAPE of 12.74, accuracy of 85.80%, and MSE of 0.15.


Figure 4: Results of the analysis of MOGOA-DELM model in terms of MAPE

Figure 5: Results of the analysis of MOGOA-DELM model in terms of accuracy

Figure 6: Results of the analysis of MOGOA-DELM model in terms of MSE
The current research study developed an efficient MOGOA-DELM-based short-term load predictive method for P2P ET in SGs. The proposed MOGOA-DELM model involves four distinct stages of operations namely, data cleaning, FS, prediction, and parameter optimisation. MOGOA-based feature subset selection process was carried out to select the optimal set of features. Besides, the DELM model was applied in load prediction under SG environment. Simultaneously, MOGOA-based hyperparameter optimization process was carried out to decide the parameter values of DELM model. To validate the effectiveness of the proposed MOGOA-DELM model, a detailed experimentation analysis was carried out on UK Smart Meter dataset. The experimental values pointed out the superiority of the presented method in predicting the testing data and the model obtained the highest accuracy of 85.80%. Therefore, it can be treated as an appropriate load forecasting tool for SG environment. In future, the presented MOGOA-DELM model can be implemented in real-time environments and hybrid metaheuristic algorithms can be used to achieve improved outcomes.
Funding Statement: The authors extend their appreciation to the Deanship of Scientific Research at King Khalid University for funding this work through Research Groups under grant number (RGP. 1/282/42). This work is also supported by the Faculty of Computer Science and Information Technology, University of Malaya, under Postgraduate Research Grant (PG035-2016A).
Conflicts of Interest: The authors declare that they have no conflicts of interest to report regarding the present study.
1. G. Hafeez, K. S. Alimgeer and I. Khan, “Electric load forecasting based on deep learning and optimised by heuristic algorithm in SG,” Applied Energy, vol. 269, pp. 114915, 2020. [Google Scholar]
2. W. Amin, Q. Huang, M. Afzal, A. A. Khan, K. Umer et al., “A converging non-cooperative & cooperative game theory approach for stabilising peer-to-peer electricity trading,” Electric Power Systems Research, vol. 183, pp. 106278, 2020. [Google Scholar]
3. M. Afzal, Q. Huang, W. Amin, K. Umer, A. Raza et al., “Blockchain enabled distributed demand side management in community energy system with smart homes,” IEEE Access, vol. 8, pp. 37428–37439, 2020. [Google Scholar]
4. N. Liu, X. Yu, C. Wang, C. Li, L. Ma et al., “Energy-sharing model with price-based demand response for microgrids of peer-to-peer prosumers,” IEEE Transactions on Power Systems, vol. 32, no. 5, pp. 3569– 3583, 2017. [Google Scholar]
5. K. G. Boroojeni, M. H. Amini, S. Bahrami, S. S. Iyengar, A. I. Sarwat et al., “A novel multi-time-scale modeling for electric power demand forecasting: From short-term to medium-term horizon,” Electric Power Systems Research, vol. 142, pp. 58–73, 2017. [Google Scholar]
6. Y. Li, J. Che and Y. Yang, “Subsampled support vector regression ensemble for short term electric load forecasting,” Energy, vol. 164, pp. 160–170, 2018. [Google Scholar]
7. L. Liangzhi, K. Ota and M. Dong, “When weather matters: IoT-based electrical load forecasting for SG,” IEEE Communications Magazine, vol. 55, no. 10, pp. 46–51, 2017. [Google Scholar]
8. J. Zhang, Y. M. Wei, D. Li, Z. Tan and J. Zhou, “Short term electricity load forecasting using a hybrid model,” Energy, vol. 158, pp. 774–781, 2018. [Google Scholar]
9. C. Tong, J. Li, C. Lang, F. Kong, J. Niu et al., “An efficient deep model for day-ahead electricity load forecasting with stacked denoising auto-encoders,” Journal of Parallel and Distributed Computing, vol. 117, pp. 267–273, 2018. [Google Scholar]
10. Y. Chen, M. Kloft, Y. Yang, C. Li and L. Li, “Mixed kernel based extreme learning machine for electric load forecasting,” Neurocomputing, vol. 312, pp. 90–106, 2018. [Google Scholar]
11. N. Zeng, H. Zhang, W. Liu, J. Liang and F. E. Alsaadi, “A switching delayed PSO optimised extreme learning machine for short-term load forecasting,” Neurocomputing, vol. 240, pp. 175–182, 2017. [Google Scholar]
12. X. Zhang, J. Wang and K. Zhang, “Short-term electric load forecasting based on singular spectrum analysis and support vector machine optimised by Cuckoo search algorithm,” Electric Power Systems Research, vol. 146, pp. 270–285, 2017. [Google Scholar]
13. Y. Chen, H. Tan and U. Berardi, “Day-ahead prediction of hourly electric demand in non-stationary operated commercial buildings: A clustering-based hybrid approach,” Energy and Buildings, vol. 148, pp. 228–237, 2017. [Google Scholar]
14. Z. Guo, K. Zhou, X. Zhang and S. Yang, “A deep learning model for short-term power load and probability density forecasting,” Energy, vol. 160, pp. 1186–1200, 2018. [Google Scholar]
15. N. Ghadimi, A. Akbarimajd, H. Shayeghi and O. Abedinia, “Two stage forecast engine with feature selection technique and improved meta-heuristic algorithm for electricity load forecasting,” Energy, vol. 161, pp. 130–142, 2018. [Google Scholar]
16. W. C. Hong, “Electric load forecasting by seasonal recurrent SVR (support vector regression) with chaotic artificial bee colony algorithm,” Energy, vol. 36, no. 9, pp. 5568–5578, 2011. [Google Scholar]
17. M. Steczek, W. Jefimowski and A. Szeląg, “Application of grasshopper optimisation algorithm for selective harmonics elimination in low-frequency voltage source inverter,” Energies, vol. 13, no. 23, pp. 6426, 2020. [Google Scholar]
18. A. E. Hegazy, M. A. Makhlouf and G. S. E. Tawel, “Improved salp swarm algorithm for feature selection,” Journal of King Saud University-Computer and Information Sciences, vol. 32, no. 3, pp. 335–344, 2020. [Google Scholar]
19. S. Ding, N. Zhang, X. Xu, L. Guo and J. Zhang, “Deep extreme learning machine and its application in EEG classification,” Mathematical Problems in Engineering, vol. 2015, pp. 1–11, 2015. [Google Scholar]
20. Z. Y. Algamal, M. K. Qasim, M. H. Lee and H. T. M. Ali, “Improving grasshopper optimisation algorithm for hyperparameters estimation and feature selection in support vector regression,” Chemometrics and Intelligent Laboratory Systems, vol. 208, pp. 104196, 2021. [Google Scholar]
21. UK Smart Meter dataset, 2019. [Online]. Available: https://cc-uploads.s3.amazonaws.com/open_links/HumAIn+2019/UK_Smart_Meter.zip. [Google Scholar]
22. M. Suresh and M. S. Anbarasi, “Hybridisation of ARIMA with neural network for electricity energy consumption forecasting and analysis on smart meter data,” Adalya Journal, vol. 9, no. 3, pp. 824–841, 2020. [Google Scholar]
23. K. Gajowniczek and T. Ząbkowski, “Electricity forecasting on the individual household level enhanced based on activity pattern,” PLOS one, vol. 12, no. 4, pp. e0174098, 2017. [Google Scholar]
 | This work is licensed under a Creative Commons Attribution 4.0 International License, which permits unrestricted use, distribution, and reproduction in any medium, provided the original work is properly cited. |