DOI:10.32604/cmc.2022.019443
| Computers, Materials & Continua DOI:10.32604/cmc.2022.019443 | |
| Article |
Deep Learning Approach for Analysis and Characterization of COVID-19
1School of Computing, Graphic Era Hill University, Dehradun (UK), India
2Department of Information Technology, College of Computer and Information Technology, Taif University, Taif, 21944, Saudi Arabia
3School of Computer Science & IT, JAIN (to be Deemed University), Bangalore, India
4School of Computing, Dehradun Institute of Technology, Uttarakhand, India
5Department of Computer Engineering, Faculty of Science and Technology, Vishwakarma University, Pune, India
6Department of Computer Engineering, College of Computer and Information Technology, Taif University, Taif, 21944, Saudi Arabia
*Corresponding Author: Mamoon Rashid. Email: mamoon873@gmail.com
Received: 13 April 2021; Accepted: 19 May 2021
Abstract: Early diagnosis of a pandemic disease like COVID-19 can help deal with a dire situation and help radiologists and other experts manage human resources more effectively. In a recent pandemic, laboratories perform diagnostics manually, which requires a lot of time and expertise of the laboratorial technicians to yield accurate results. Moreover, the cost of kits is high, and well-equipped labs are needed to perform this test. Therefore, other means of diagnosis is highly desirable. Radiography is one of the existing methods that finds its use in the diagnosis of COVID-19. The radiography observes change in Computed Tomography (CT) chest images of patients, developing a deep learning-based method to extract graphical features which are used for automated diagnosis of the disease ahead of laboratory-based testing. The proposed work suggests an Artificial Intelligence (AI) based technique for rapid diagnosis of COVID-19 from given volumetric chest CT images of patients by extracting its visual features and then using these features in the deep learning module. The proposed convolutional neural network aims to classify the infectious and non-infectious SARS-COV2 subjects. The proposed network utilizes 746 chests scanned CT images of 349 images belonging to COVID-19 positive cases, while 397 belong to negative cases of COVID-19. Our experiment resulted in an accuracy of 98.4%, sensitivity of 98.5%, specificity of 98.3%, precision of 97.1%, and F1-score of 97.8%. The additional parameters of classification error, mean absolute error (MAE), root-mean-square error (RMSE), and Matthew’s correlation coefficient (MCC) are used to evaluate our proposed work. The obtained result shows the outstanding performance for the classification of infectious and non-infectious for COVID-19 cases.
Keywords: Coronavirus; covid-19; respiratory infection; computed tomography; deep neural network
The novel coronavirus first encountered in Wuhan, China, has been designated as SARS-COV2 ((i.e., Severe Acute Respiratory Syndrome Coronavirus 2), while the disease it causes is known as COVID-19 (Corona Virus Disease 2019) [1]. Several coronaviruses can cause conditions ranging from an acute illness like the common cold to severe diseases like SARS and MERS (Middle East Respiratory Syndrome) [1]. The outbreak of uncommon and human-to-human contagious respiratory disease called COVID-19, caused by SARS-COV2 has been termed a pandemic by the World Health Organization (WHO). It affected a total of 215 countries with a majority of cases from the USA, Brazil, India, Russia, Peru, Chile, etc. [1] and 134,308,070 overall cases reported till April 10, 2021, out of which 2,907,944 people have lost their lives. According to WHO’s estimation, there is a 3.4% mortality rate record till April 10, 2021. The novel coronavirus’s contagiousness is highest among other coronaviruses, as suggested by R0 metric. On average, an infectious human can spread the virus to about 3 other healthy humans [1]. Thus, it is essential to diagnose the patients suffering from COVID-19 and quarantine them for monitoring and treatment in isolation. A general observation is that a patient with compromised immunity due to medical history is more susceptible to subgroup than other patients. This makes early diagnosis and isolation more crucial to safeguard them, especially the cancer patients who have twice more risk of getting infected than ordinary people [1]. The diagnosis of COVID-19 patients is possible using various criteria, i.e., symptoms, epidemiology, CT images, and pathology tests. The signs of COVID-19 contain cold, cough, fever, pneumonia, and other respiratory discomforts [2,3]. However, the symptoms mentioned above might not be the specific COVID-19 symptoms as there are many reports of asymptomatic patients tested positive through chest CT images and pathological tests.
The chest CT images of COVID-19 patients in their early stages contain ground glass-opacity in one of the lungs, which later progresses to both lungs [4,5]. The same features are observed in the in the pneumonic patients with little differences, which are difficult to identify by the radiologists. Artificial intelligence techniques like CNN (Convolutional Neural network) can help us to detect such problems. CNN can also detect pneumonia using X-ray images, the nature of pulmonary swellings using CT images, or cyst from endoscopic videos [6–9].
Due to pandemic lockdown and lack of resources, person RT-PCR diagnosis provides a prominent and better option for quick results with high sensitivity. The RT-PCR official diagnosis reported a sensitivity of 30%–70%. In contrast, at that time, the CT diagnosis was more sensitive [10]. US labs from the University of Washington suggests that the next generation COVID-19 RT-PCR diagnosis yields more than 95% sensitivity. However, the X-rays are not much sensitive to COVID-19 and can result in a false-negative diagnosis. In contrast, CT images of the chest are more detailed and distinguishable than X-ray images [11]. CT’s pattern detection capability is recommended to utilize the CT imaging in case of unavailability of pathological testing as it can identify the actual negative cases accurately. Still, for confirming actual positive cases, it needs further testing. Individuals presented to the hospital with the chest findings mentioned above may need isolation and should get comprehensive confirmatory testing and required treatment. However, significantly less work examined CT imaging technique with the implementation of deep learning methods to detect COVID-19 features. So we aim to analyze the results yielded by implementing deep learning-based CNN to detect the presence of COVID-19 from given CT images that can that can act as the right choice for diagnosing the potential patients more efficiently and reliably.
Based on the challenges given in the above paragraphs, we highlight the significant contributions of this paper as follows:
a. AI-based technique is proposed for rapid diagnosis of COVID-19 from given volumetric CT images of patient’s chest images by extracting its visual features and then using these features in the deep learning module.
b. To analyze the results yielded by implementing deep learning-based CNN to detect the presence of COVID-19 from given CT images.
c. The classification results achieved by our implemented model are compared with state-of-art, and results achieved in our model outperform existing works for classification by achieving an accuracy of 98.4%, sensitivity of 98.5%, the specificity of 98.3%, the precision of 97.1%, F1 score of 97.8% for infectious and non-infectious COVID-19 cases.
The remaining paper is presented as follows. Section 2 discusses the existing literature in the field of COVID-19. Section 3 provides information related to the dataset and proposed model. Section 4 provides the experimental setup and results, and the conclusion of the manuscript is given in Section 5.
In this section, the existing works related to COVID-19 with CT imaging are discussed, along with their limitations. The authors summarized all works in this section based on existing literature where CT imaging classify COVID-19, and all techniques used and results achieved are discussed. The preparedness for COVID-19 in countries with exponentially increasing cases has emphasized the need for quick and reliable diagnosis, containment, and contact tracing. The nucleic acid-based RT-PCR test can be made more efficient and reliable through other diagnostic techniques. The abnormality detected in CT imaging predates RT-PCR in asymptomatic and symptomatic patients who were later diagnosed with COVID-19 [12]. In some instances, COVID-19 positive diagnosis had no CT imaging findings, which likely shows an early infection. Data shows that of 36 patients scanned within two days of showing symptoms, about 90% were tested positive for COVID-19 through RT-PCR, but about 56%patients had no CT findings [13]. As per the expert opinion, the combination of three CT observations, i.e., crazy paving patterns, consolidations, and ground-glass opacities, may help identify COVID-19 and pneumonia patients, and the same facts have also been reported in studies [14].
The work conducted in [15] involved 1014 patients subjected to both types of testing, i.e., RT-PCR and CT. The sensitivity related to CT imaging is 97% of RT-PCR positive cases. The 81% of patients diagnosed negative through RT-PCR but found positive through CT were reassigned as “probable” by analyzing their clinical symptoms. The study based on five patient RT-PCR reports also found the same facts, and all five patients were found COVID-19 positive after few days of isolation [16].
A study indicates mild splenomegaly in various viral diseases, which is not there in earlier studies of COVID-19 [17]. There were six patients with typical initial CT images who were asymptomatic and contacted confirmed COVID-19 patients. This data emphasizes the need to use RT-PCR and CT imaging to monitor patients’ condition or recovery. The patients with severe infections or those who lost their lives because of pneumonia related to COVID-19 are considerably older. Moreover, their CT findings had more crazy-paving, consolidation patterns, the involvement of peribronchovascular, pleural effusion, and developed air bronchograms. Thus, the radiology based feature can describe prognostic imaging biomarkers of pneumonia related to COVID-19. The unstable or severe patients also show the involvement of peribronchovascular and the subpleural distribution found in the lungs’ periphery. In contrast, stable patients show perilobular opacity and Reverse Halo Sign (RHS) [17]. Moreover, the severe and deceased patients have a higher pleural effusion frequency, though these findings are not COVID-19 specific and reported by the article’s authors [18].
The time of taking the CT scan and the severity of the disease are the factors that affect the findings of radiography. In mild or acute symptomatic patients, about 18% of total patients had normal CT images, while only 3% of total patients developed severe illness later [19,20]. A study revealed the rate of the wrong diagnosis of COVID-19 by radiologists. For 51 patients, they found that the CT features of COVID-19 were overlapping with that of infection caused by adenovirus [21]. The false-negative cases recorded through CT scan were 3.9% (2/51) and suggest CT imaging as a potential testing method. A study conducted for pediatric patients used CT and the laboratory-based test of 20 such patients, of which 65% had contact with already positive COVID-19 family members and found that cough and fever were common symptoms recorded by 65% and 60% of the patients, respectively [22]. The features related to CT scans involved co-infection in 40%, pulmonary lesions in 30%, bilateral pulmonary lesions in 50%, 20% with no findings, and 80% with procalcitonin elevation (not common among adults).
A deep-learning-based technique called COVNet (COVID-19 Detection Neural Network) was developed to extract the features from CT images of the patients’ chest and then used to diagnose the presence of COVID-19 in that patient [23–25]. CT images of non-pneumonia and CAP (Community-Acquired Pneumonia) are analyzed to determine the model’s effectiveness. It involves a dataset taken from 6 hospitals, and performance analysis of the model is done through specificity, sensitivity, and AUC (Area Under Curve) associated with operating characteristics of the receiver [26,27]. For COVID-19 diagnosis, specificity is reported as 294 in 307 (96%), and sensitivity is 114 in 127 (90%). AUC is found to be 0.96 (p-value < 0.001) [28]. In a study [29,30], a CNN based technique is used for classifying the CT image as COVID-19 positive, viral pneumonia, influenza, or normal. A comparison is made with the results of CNN and other 3D and 2D deep learning-based models. The CNN based model was able to yield specificity and sensitivity of 92.2% and 98.2%, respectively.
From the above state-of-the-art, it is clear that there are significantly fewer number works that examined CT imaging techniques with the implementation of deep learning methods for detecting COVID-19 features. So we aim to analyze the results yielded by implementing deep learning-based CNN to detect the presence of COVID-19 from given CT images that can be utilized for diagnosing the potential patients more efficiently and reliably.
Accurate detection of COVID-19 is a challenging task for all the experts of the medical fraternity. Therefore, in this work, a computer-assisted system has been proposed to analyze and classify COVID-19 cases using CT images and deep learning methods. The description of the dataset, proposed model, experiments, and results are discussed in this section.
CT scans are promising in providing accurate, fast, and cheap screening and testing of COVID-19. In this paper, a dataset used for implementing the proposed technique contains 746 chest CT images taken from 143 patients with an average age of 49 ± 15 years and two classes, namely (1) class 1: infectious, i.e., CT images having positive report for COVID-19 and (2) class 2: non-infectious, i.e., CT images having negative report for COVID-19. A total of 480 images of the given dataset were used for the training set; 80 images of the given dataset is used as a validation set, while 186 remaining images were utilized for the testing set. The data is available at https://github.com/UCSD-AI4H/COVID-CT [26].
3.2 Overview of the Proposed Architecture
The proposed work consists of three major sections: a pre-processing section, model building section, and decision making section. Each section includes a set of processes, and each method helps get the desired results. The experimental workflow diagram of the proposed system is shown in Fig. 1.
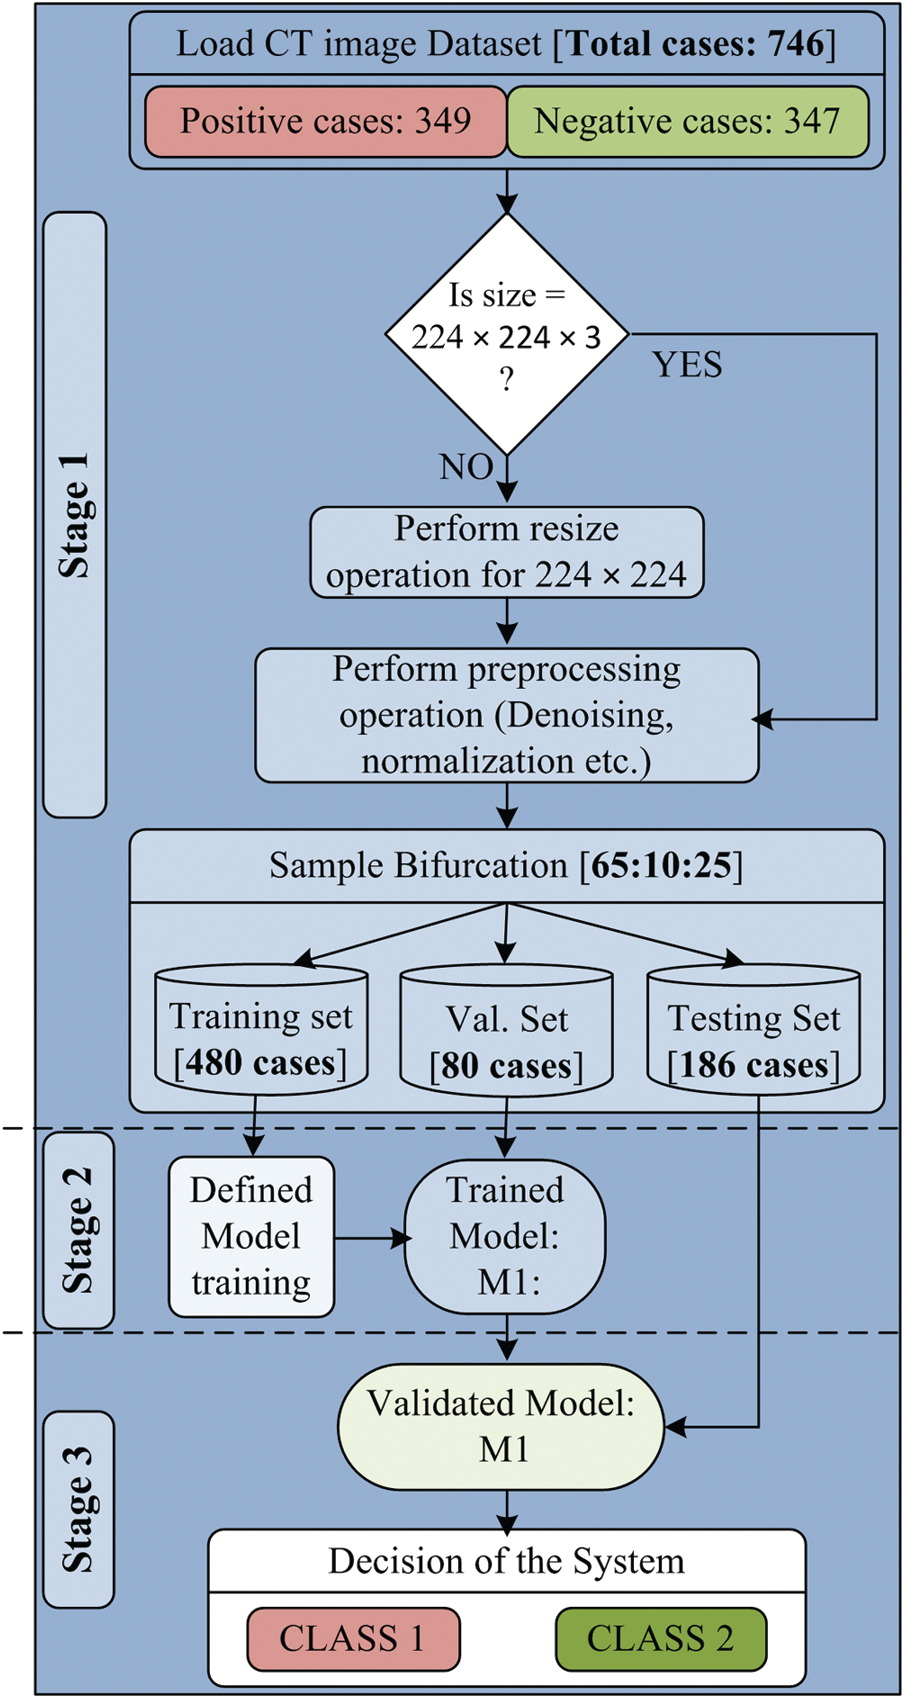
Figure 1: Experimental work flow diagram of proposed model
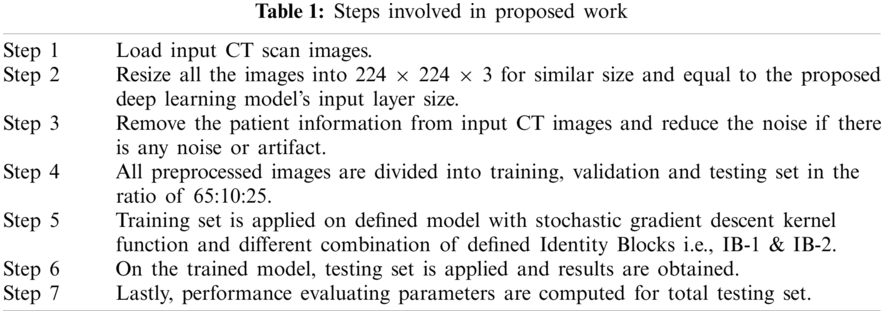
Step involved in proposed work are given in Tab. 1:
The first section of the designed model is the preprocessing section, in which the input CT scan images are loaded. The CT scan images of the collected dataset are generated from different CT scanners having various features. Due to this, there are so many variations in image resolution. It is also known that the variations in input data size can be a massive constraint for the development of any high performing system. Therefore, all input images are resized to 224 × 224 pixels. Another essential part of the preprocessing section is de-noising. Each resized image is passed through the de-noising filter to remove artifacts and noise from the input image. The patient’s information is also removed before going to use the images. After that, the complete dataset is ready to use and passed to sample bifurcation.
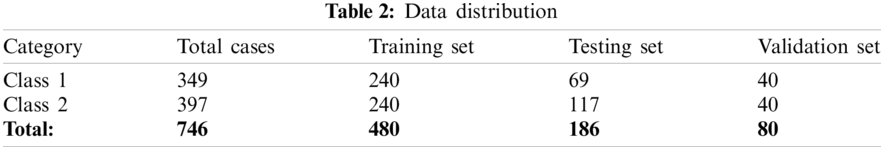
In the sample bifurcation step, ideally, the whole sample is partitioned into three sets called the training set, validation set, and testing set according to the ratio of 65:10:25. Therefore, the total number of training samples is 480, the validation sample is 80, and the remaining 186 samples are used as the testing set. Among 480 training samples, 240 cases belong to Class 1, and the remaining 240 cases belong to the Class 2 category. In the same manner, 40 cases are taken from both types for the validation set. For 186 testing samples, 69 samples belong to Class 1, and 117 samples belong to Class 2 case. A brief description of dataset bifurcation is given in Tab. 2. After the training and testing set creation, normalization is performed. The significant benefits of normalization are scaling and centering the data in the range of 0 and 1. It also improves the performance of the system and reduces the computation time. The normalized training and testing set is used for classification model building.
The proposed model consists of two identity blocks, named IB-1 and IB-2 [27]. Each IB-X where, X = {1, 2} block consists of two paths. One is called the main path, and the other is called the shortcut path. The structure of IB-1 and IB-2 are shown in Fig. 2.
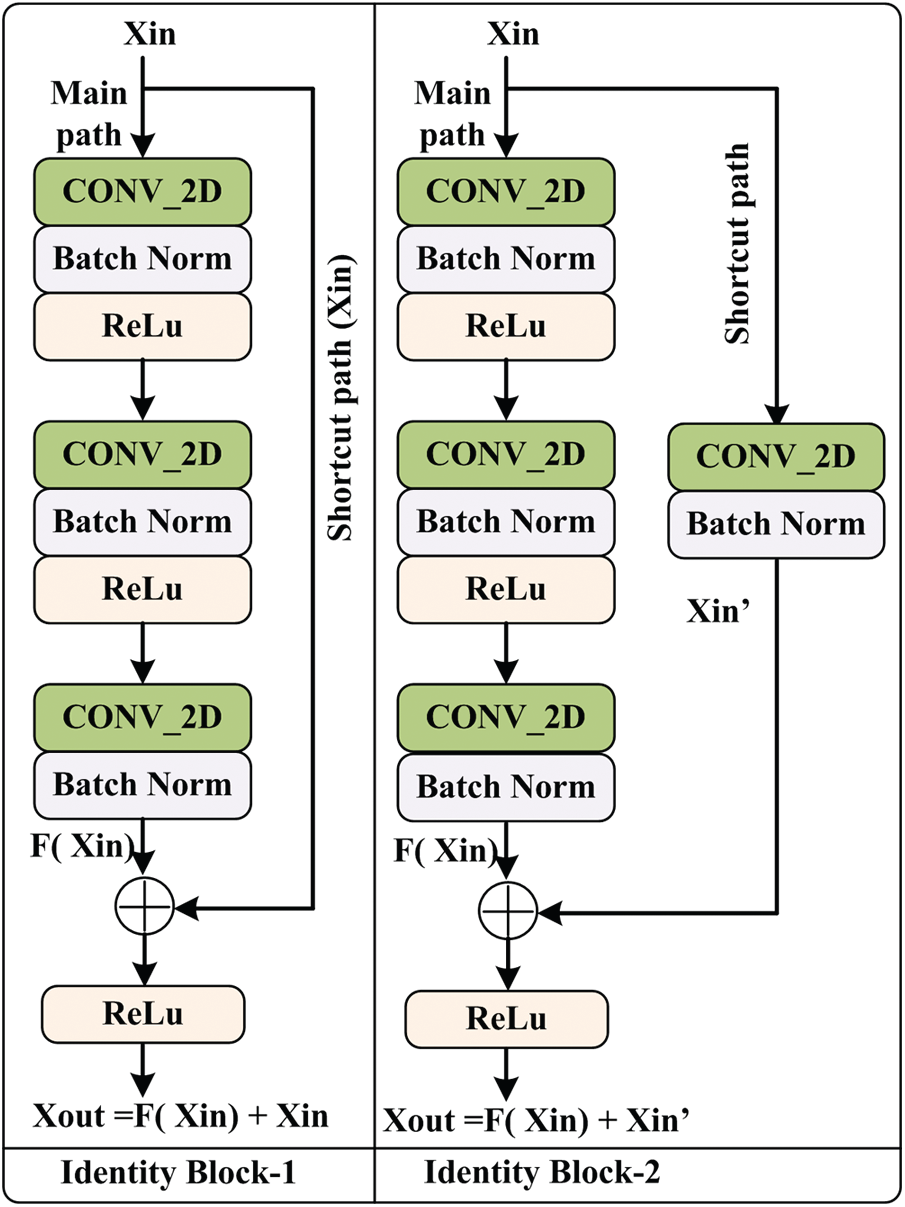
Figure 2: Architecture of identity block
The main path of IB-1 consists of three CONV_2D layers, three normalization layers, and two non-linear activation functions, ‘ReLu.’ Initially, Xin is passed through the main path, and the output of the main path is added with original Xin using a shortcut path and passed to the ‘ReLu’ for better performance. The IB-2 is similar to the IB-1 except for the shortcut path. This shortcut path is composed of CONV_2D and normalization layers. After that, Xout is obtained using the addition of main path output and shortcut path output. The mathematical expression of IB-1 and IB-2 output is given in Eqs. (1) and (2).
From Fig. 2, it is observed that the main path of IB-1 and IB-2 has three layers. The first layer CONV_2D uses the F1 type filter of size [1 × 1] and stride of size [1 × 1] with valid padding. The second layer CONV_2D uses the F2 type filter, and at layer three, CONV_2D uses F3 type filter of size [1 × 1] and stride of size [1 × 1] with valid padding. For each layer, 0 is used as the seed value for the random initialization. In the case of IB-2, the shortcut path consists of CONV_2D and batch normalization layer. This CONV_2D uses an F3 type filter of size [1 × 1] and stride of size [1 × 1] with valid padding.
The proposed deep neural network model is comprised of a stack of layers, and information flow between layers for the discrimination of infectious and non-infectious cases is shown in Fig. 3. The detailed description and architecture of the implemented model is given is Fig. 4. Initially, the input image is padded with zero paddings of size [3 × 3], and then the convolutional operation is performed using filter size [7 × 7] of 64 kernels with a stride of [2 × 2]. The sequence of operation is followed by batch normalization, a non-linear activation function ReLu and max pooling.
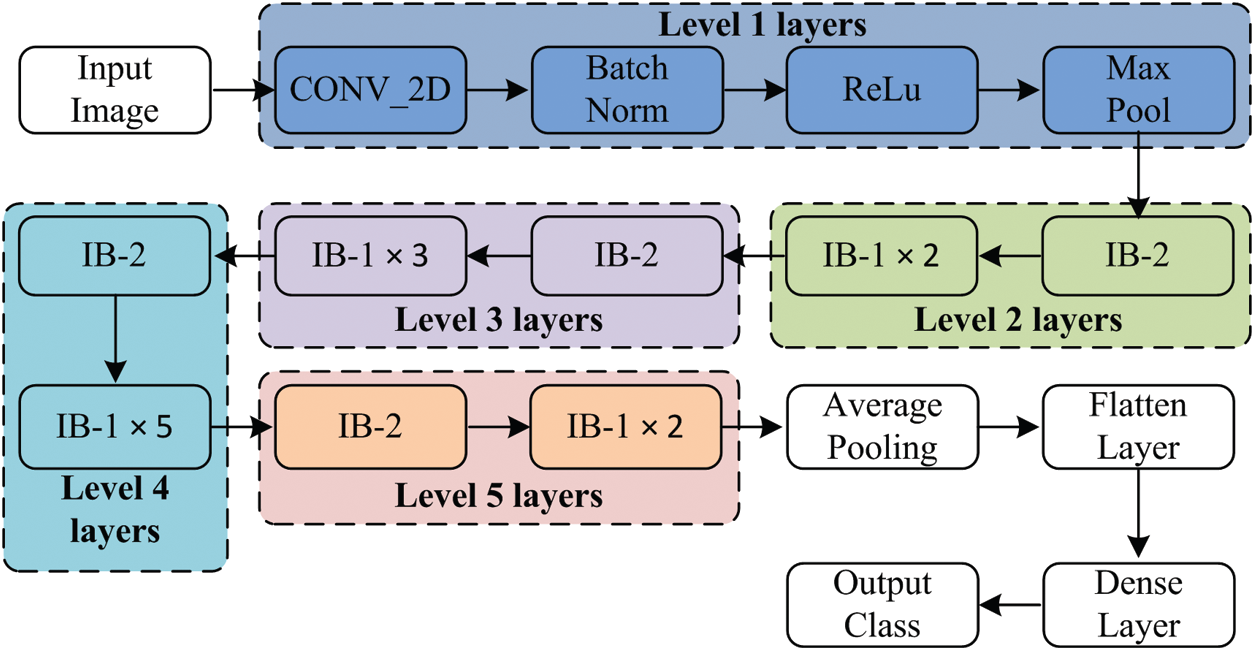
Figure 3: Layer wise data flow in proposed model
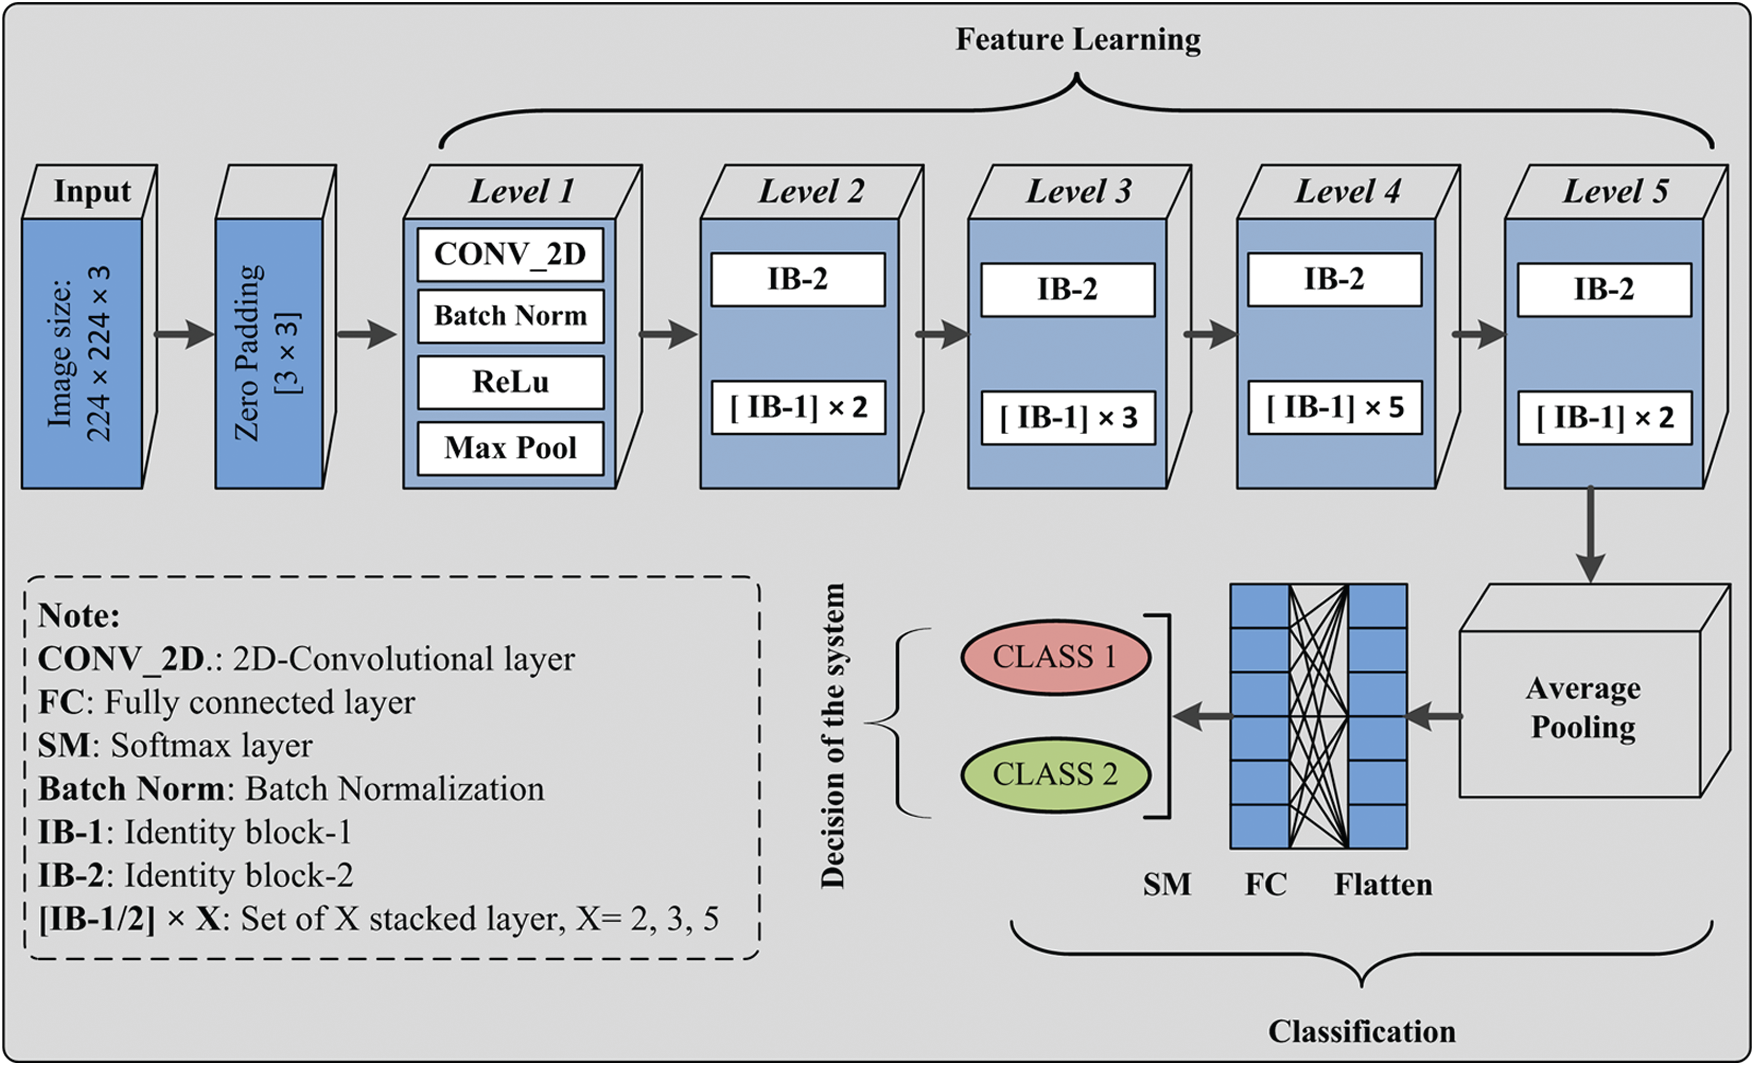
Figure 4: Covid-19 CT chest images and deep neural network proposed model
At this level, pooling uses a window of size [3 × 3] with a stride of [2 × 2], and at level 2, IB-2 uses three-layered stack filters of size [64 × 64 × 256] with a stride of [1 × 1]. The operations’ result is passed to two sets of IB-1, with three identical sets of size filters [64 × 64 × 256]. At the next level of the model, IB-2 comprises three sets of identical filters of size [128 × 128 × 512] with a stride of [2 × 2]. After that, three sets of IB-1 are used with three sets of filters of size [128 × 128 × 512]. At level 4, three similar sets of filters of size [256 × 256 × 1024] are used with a stride of [2 × 2]. This set is followed by five blocks of IB-1 using three sets of filters of size [256 × 256 × 1024]. At the next level of the proposed model, IB-2 uses three sets of filters of size [512 × 512 × 2048], and then the output of IB-2 is passed to the two identical blocks of IB-1 using three sets of filters of size [512 × 512 × 2048]. After that, average pooling of windows size [2 × 2] is applied, and then pooled features are passed to the flatten layer. The computed features are passed to a dense layer having a ‘softmax’ function as an activation layer. Finally, according to the ‘softmax’ layer output, the decision takes place.
3.2.3 Optimized Gradient Descent
In past studies, it has been found that Optimized Gradient Descent or Stochastic Gradient Descent (SGD) is frequently used for DL model training and attain promising results [29]. SGD is an optimization technique mathematically defined as given expression in Eq. (3) for training sample Xin with label Yin.
The algorithm used for SGD training is described in Algorithm 1.
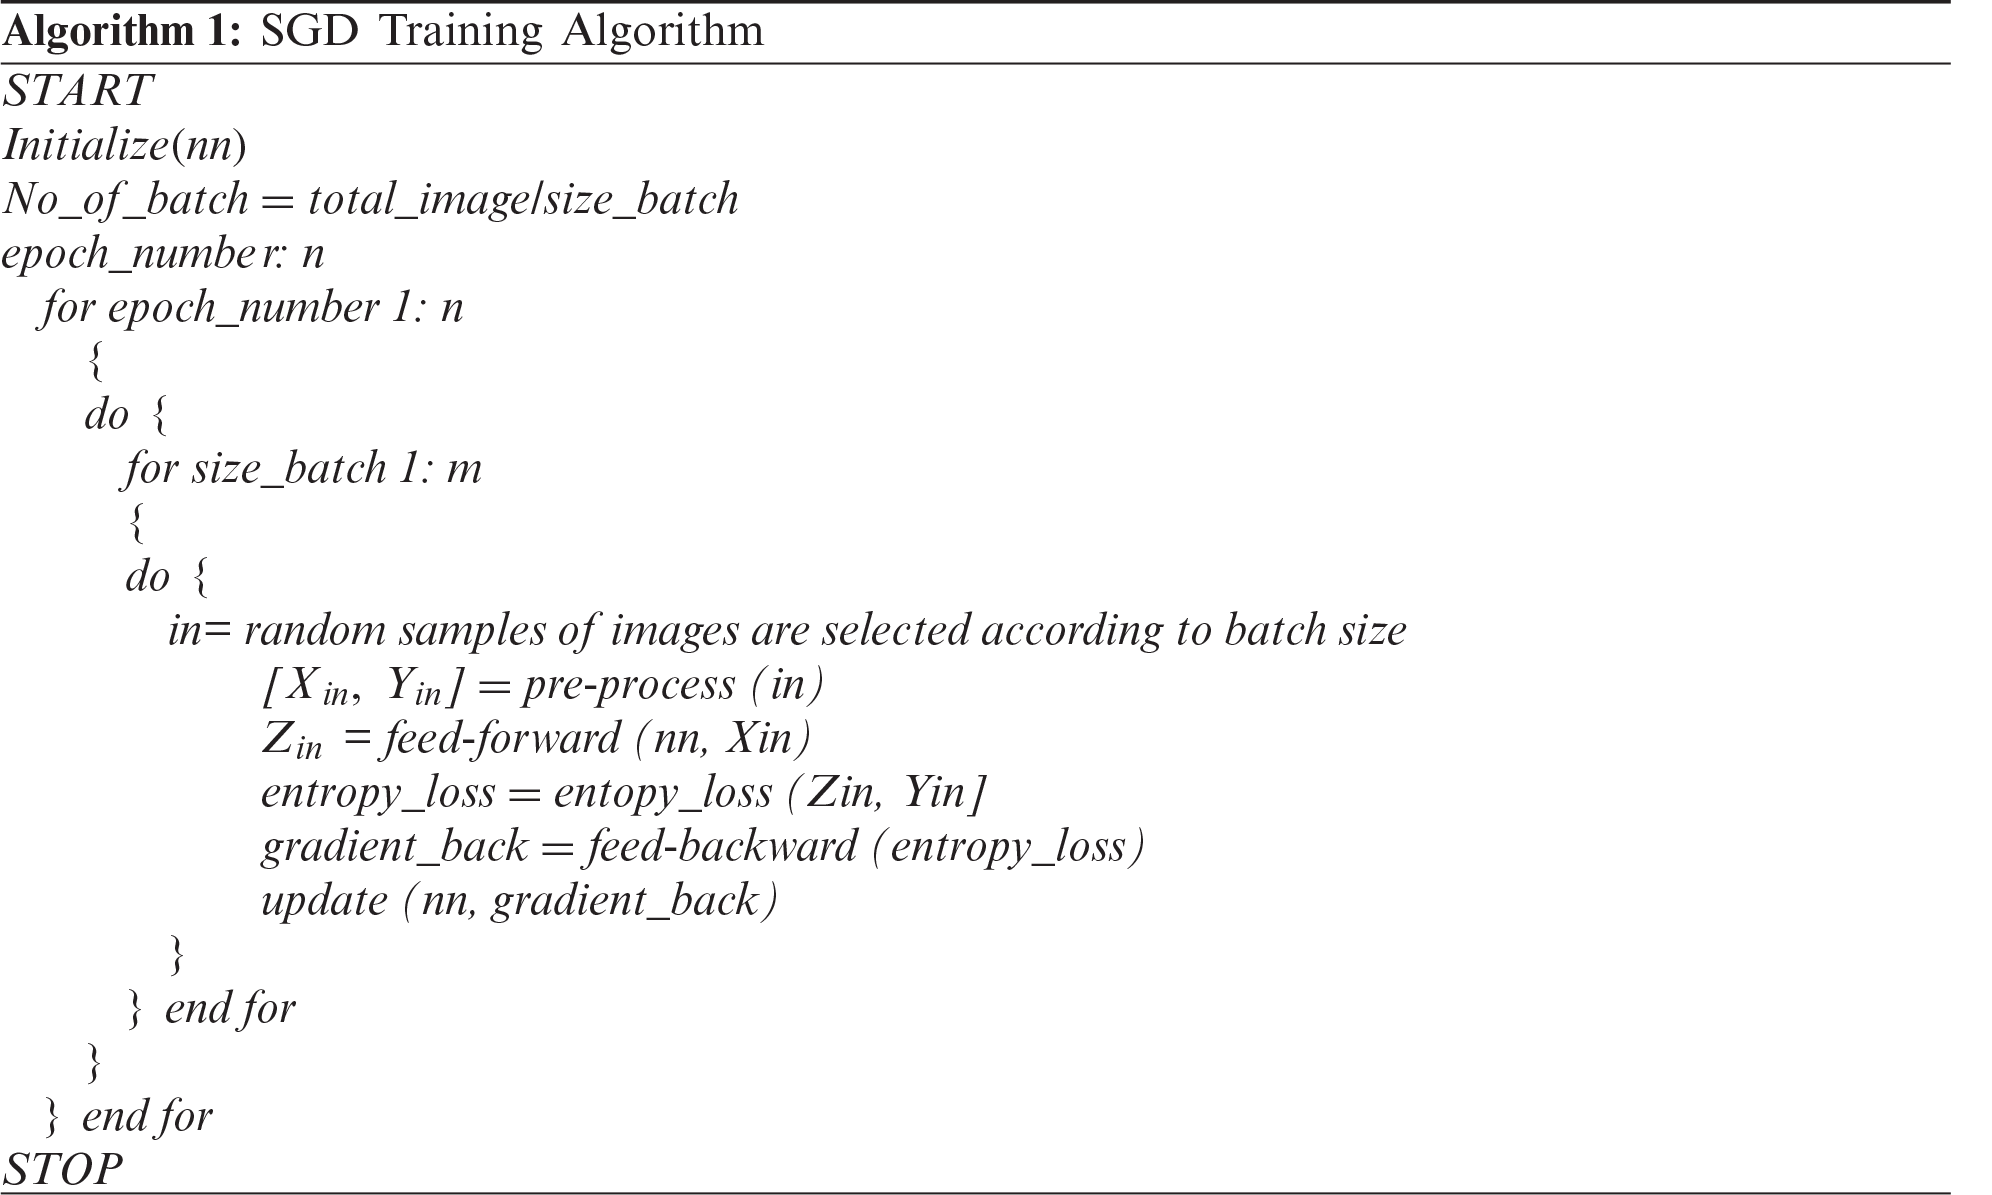
The mathematical expression of entropy loss is defined as Eq. (4).
Fig. 5 shows the difference between the COVID-19 positive case and negative case CT scan images before and after processing. After passing the image to the proposed model, the appearance between the positive case and negative cases is easily distinguishable, and thus the proposed model gives more relevant results.
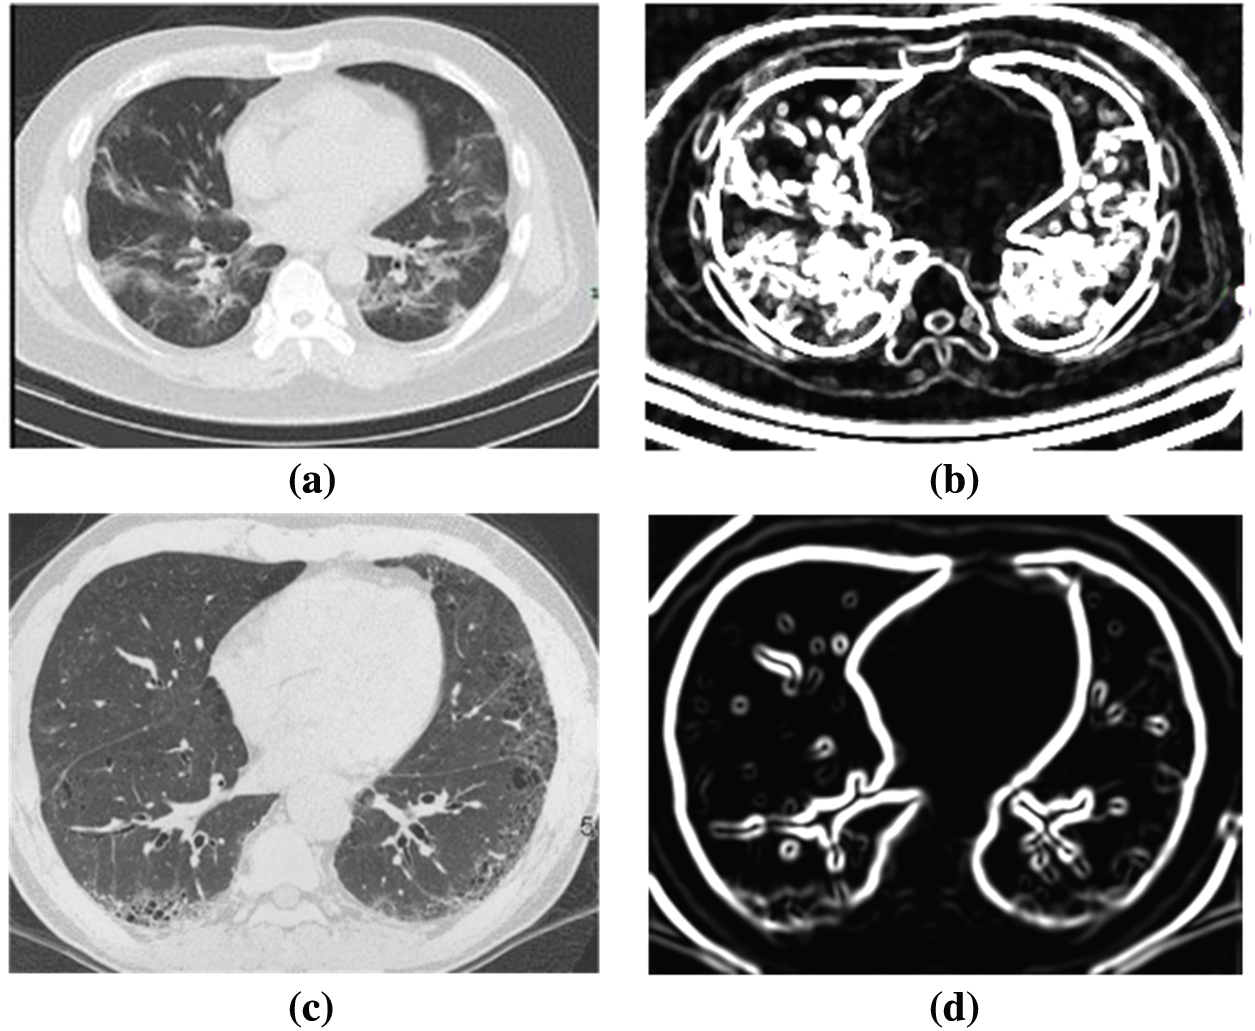
Figure 5: Example of input and post processed image (a) Original COVID-19 CT scan image, (b) Post processed COVID-19 CT scan image, (c) Input non-COVID-19 image and (d) Post processed non-COVID-19 image
In the proposed model, levels 1 to 5 are used for feature learning purposes. After feature learning, classification is performed using the average pooling layer, flatten layer, FC layer, and soft-max layer. In the classification section, the instance of the testing set is passed to the validated model, and then the obtained class label is considered as the decision of the proposed system for the particular input test sample. Similarly, the whole test sample is passed to the validated model that assigned a label to each input sample. The performance of the model is evaluated using performance metrics, which are described in the next section.
3.3 Performance Metrics for Quantitative Analysis
The experiment’s outcome for the proposed work is evaluated in terms of classification accuracy, sensitivity, specificity, precision F1score, and classification error [30]. The help of the confusion matrix obtains all parameters. The structure of the confusion matrix (CM) with value is shown in Fig. 8. After that, additional parameters like mean absolute error (MAE), root mean squared error (RMSE), and Matthews’s correlation coefficient (MCC) is computed as given in equations Eqs. (5)–(7). If the value of MAE and RMSE is closer to zero, it shows that the proposed work is better and more reliable. In the same manner, MCC is used to define the quality of designed binary classifiers in the form of balanced assessment and help identify the ineffectiveness of binary classifiers.
The statistical analysis is performed using Cohen’s kappa coefficient [30]. It shows the significance or reliability of the proposed work. The kappa coefficient
where
where, PClass 1 and PClass 2 are computed as given expression in Eq. (11).
This paper has carried out extensive work to analyze and characterize COVID-19 using CT chest images. For the desired outcome, we use a deep neural network with optimized gradient descent. The environmental setup for experiment execution and obtained results are discussed in the next section.
The complete experimentation is performed on HP Z4 G4 workstation. The system specification is given as Intel Xeon W-2014 CPU @ 3.2 GHz, 64 GB RAM, 4GB NVIDIA Quadro P1000, 256 GB SS, and 2TB SATA HDD. All images are stored in this system, and the Python environment is used for performing the experiments. In this experiment, an image dataset of a 746 CT scan is used. A set of 746 images consists of 349 cases of Class 1 and 397 cases of Class 2 category. Among 746 cases, 480 samples are used as a training set, 80 samples are used as validation sets, and the remaining 186 samples are used as a testing set. Initially, the designed model M1 is trained using a training set for 50 epochs, and the trained model is validated using the validation set.
The proposed model’s performance during the training & validation phase is measured in the form of training accuracy, loss, validation accuracy, and validation loss. During the training and validation, the proposed model’s performance is outstanding, and the achieved training accuracy is 97.7%, and the training loss is 0.52. The validation accuracy of the model is achieved as 98.4%, and validation loss is 0.502. The curve between training and validation loss is shown in Fig. 6, and a comparative analysis of training accuracy and validation accuracy is shown in Fig. 7.
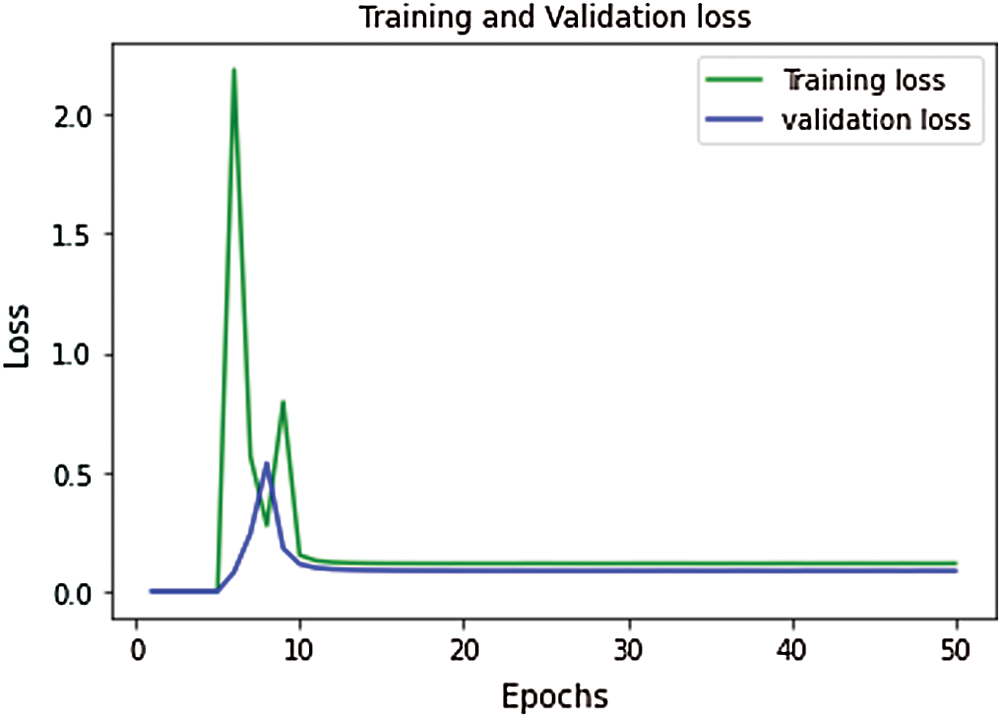
Figure 6: Performance curve for training vs. validation loss
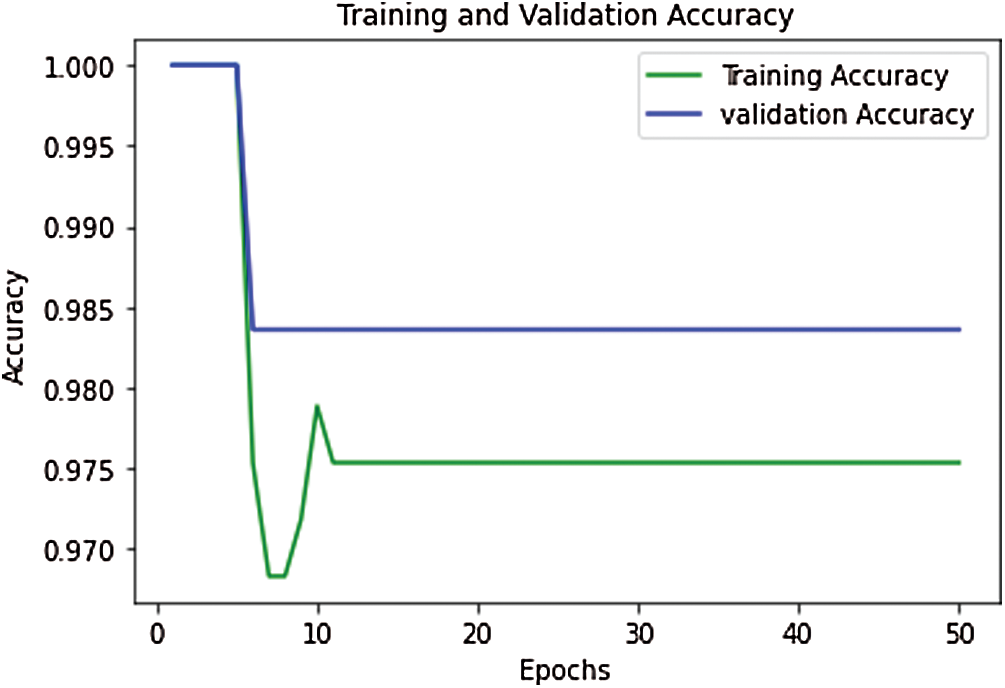
Figure 7: Performance curve for training vs. validation accuracy
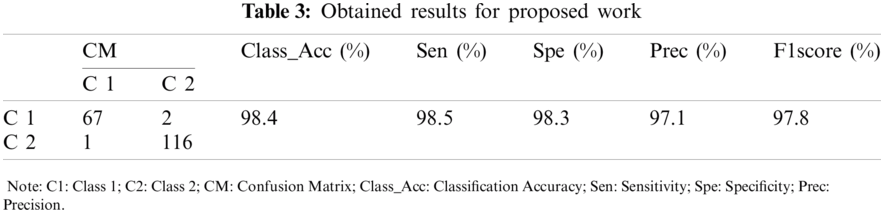
The performance of experimentation done on the designed model is evaluated in the form of classification accuracy (Class_Acc), sensitivity (Sen), specificity (Spe), precision (Prec), F1score, and classification error as given in Fig. 8. Additional parameters like MAE, RMSE, and MCC are also evaluated for the proposed work. After that, the testing set is passed to the model, and the obtained result is given in Tab. 3.
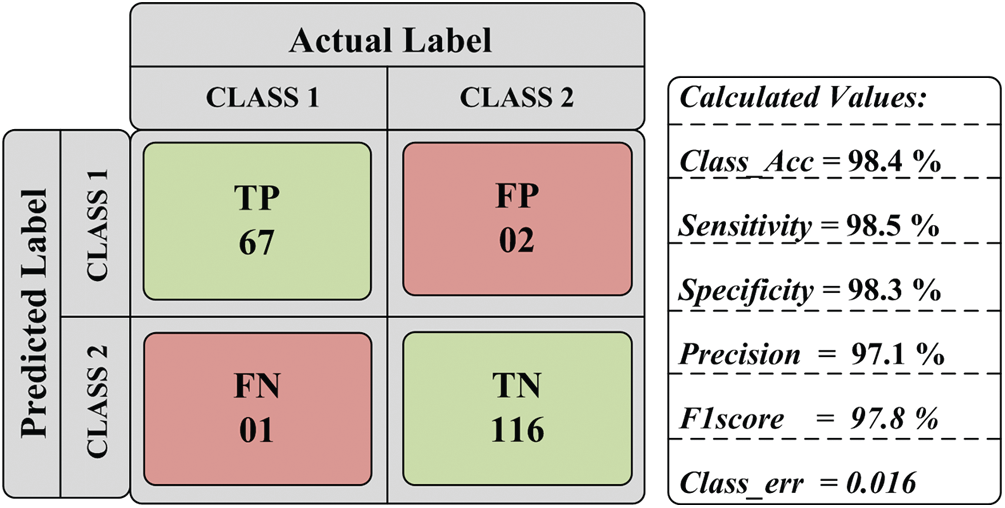
Figure 8: Obtained parametric value
The outcome of the proposed model is further analyzed by two different approaches: quantitative and statistical analysis. Under quantitative analysis, accuracy, sensitivity, specificity, precision, and F1score is computed. Like classification error, few additional parameters, MAE, RMSE, and MCC, are also evaluated for the proposed work. Cohen’s kappa analysis is used for statistical analysis.
After the regressive work, the obtained results of 186 testing samples are reported in Tab. 2 and observed that the achieved classification accuracy is 98.4%. The proposed model yields 98.5% of sensitivity, 98.3% specificity, 97.1% precision, and 97.8% F1score, as shown in Fig. 9. The proposed system’s classification accuracy 98.4% (183/186) shows that the 183 samples are correctly classified from 186 samples. From 183 correctly classified samples, 67 samples of positive cases (Class 1) out of 69 cases are detected, while 116 samples of negative cases (Class 2) out of 117 samples are correctly detected. Out of 69 Class 1 cases, 2 cases are predicted as negative, and out of 117 Class 2 samples, 1 case is predicted as Class 1. Therefore, a total of 3 cases is misclassified out of 186 cases. The misclassification accuracy of the system is obtained at 1.6% (3/186). From 3 misclassified samples, two samples belong to the Class 1 category, and one sample belongs to the Class 2 category.
The performance of the proposed system for individual class classification is obtained as 97.1% (67/69) for positive cases (Class 1) and 99.1% (116/117) for negative cases (Class 2). For 69 test samples of class 1, 67 samples are correctly classified, and 116 out of 117 cases of Class 2 are correctly detected. For validating the proposed system, additional parameters like classification error, MAE, RMSE, and MCC is calculated. The obtained value of classification error is 0.016, MAE is 0.244, RMSE is 0.464, and MCC is 1.14 × 10⁻⁴ is shown in Fig. 10. The obtained results show the promising outcome of the proposed work.
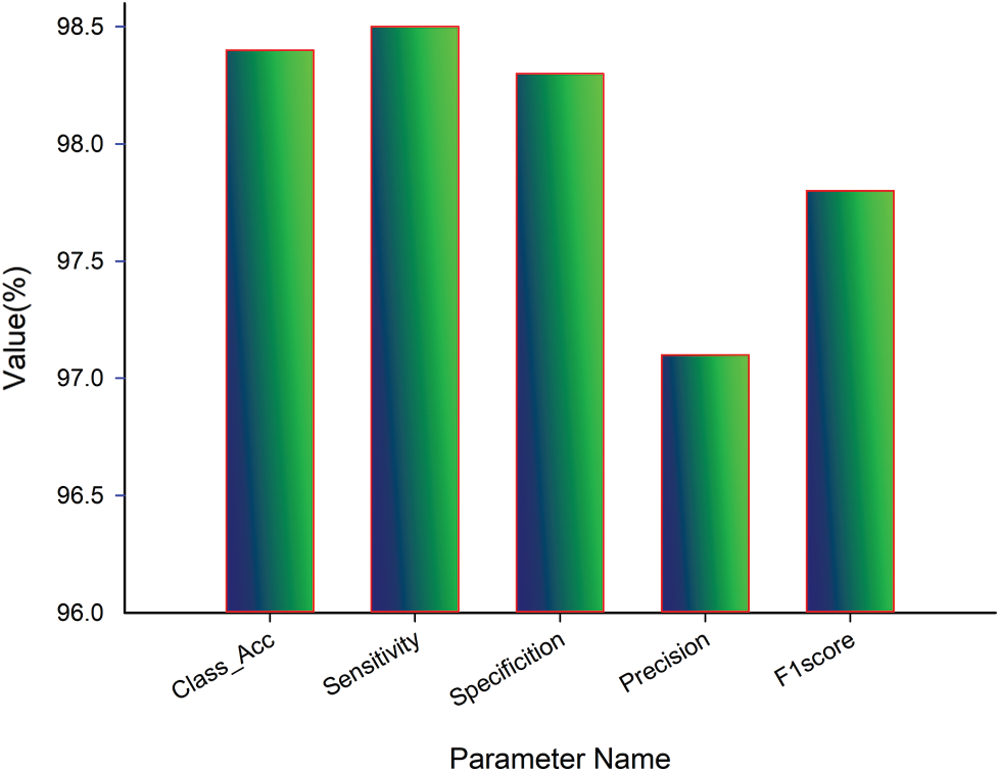
Figure 9: Quantitative analysis of proposed work
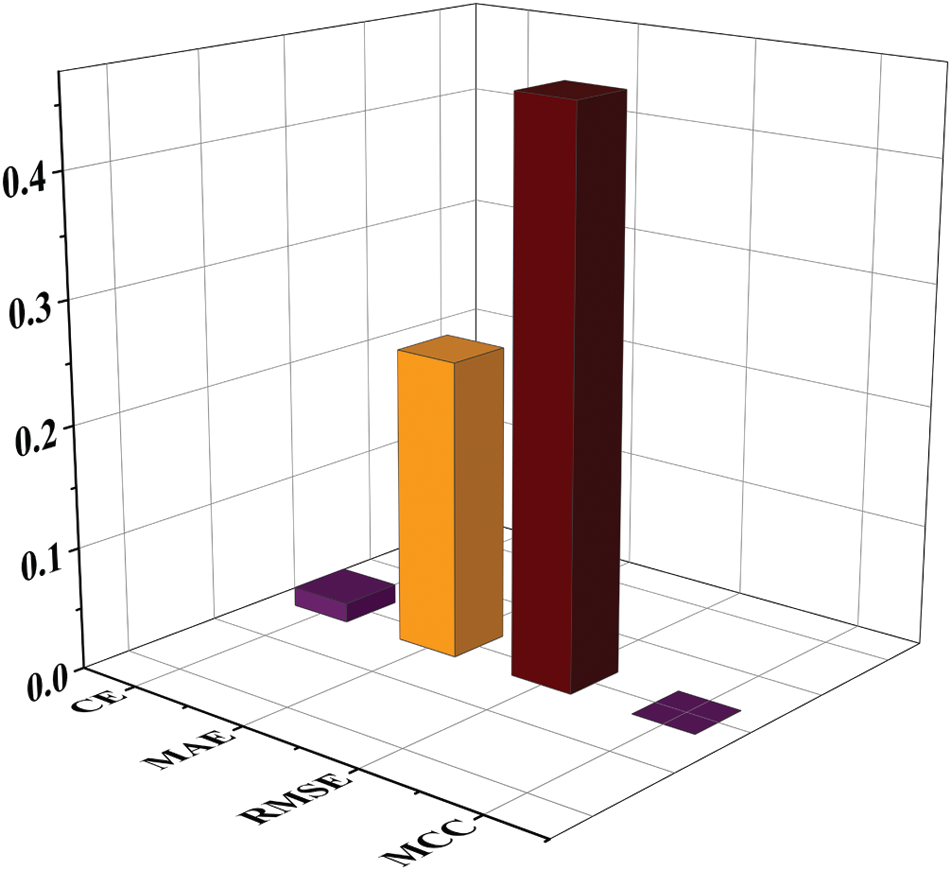
Figure 10: Quantitative and parametric analysis of proposed work
With the help of the confusion matrix given in Tab. 2, the value of TP is 67, the value of FP is 2, the value of FN is 1, and TN’s value is 116. Using these values, P0 and Pe are computed, and the obtained value of P0 and Pe is helpful in the computation of kappa value. So the value of P0 and Pe is calculated as:
Similarly, the value of the remaining term is obtained as
The present work is compared with the early published studies [23–27]. The proposed work has also been directly compared with the study [25] because both studies are based on the same images. The comparative analysis is presented in Tab. 4 and Fig. 11.
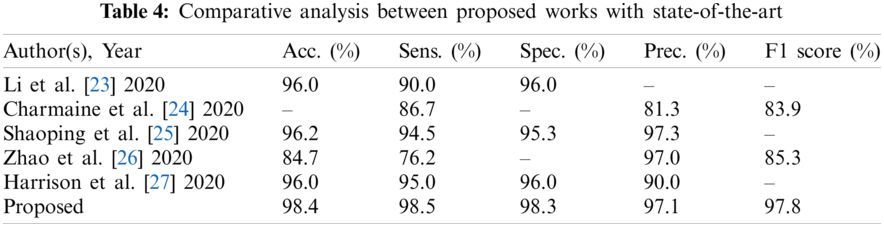
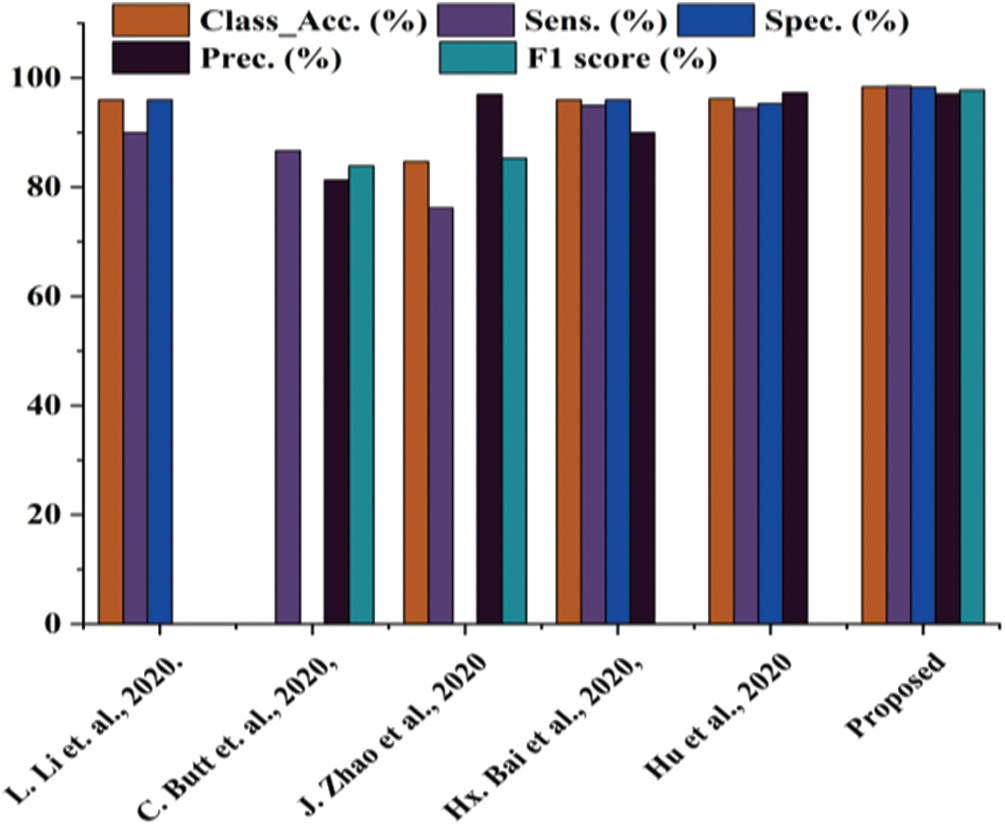
Figure 11: Comparative analysis between proposed works with state-of-the-art
Tab. 3 shows that the proposed work performs better in every aspect than studies [23–27]. The proposed work classification accuracy is superior to previously published work, making the system more stable. The proposed work also yields better sensitivity value, specificity value, precision, and F1 score. Thus, it is concluded that the proposed work is better than the previously published work.
COVID-19 or SARS-COV2 has been termed a pandemic by WHO and treated as a massive threat to public health. Thus, the correct and premature detection of the COVID-19 positive case patient is critical. CT scan is the critical tool for detecting COVID-19 pneumonia among various imaging modalities because of its feasibility, promptness, and high sensitivity. The proposed AI-based approach for detecting COVID-19 shows promising results with high accuracy of 98.4%, sensitivity of 98.5%, specificity of 98.3%, precision of 97.1%, and F1 score of 97.8%, and classification error of 1.6%. After that, additional parameters MAE, RMSE, and MCC are evaluated for the proposed work. The obtained value of MAE 0.244, RMSE of 0.464, and MCC of 1.14 × 10⁻⁴ shows promising results. It helps identify coronavirus-infected and non-infected patients. Lastly, the kappa coefficient value is calculated for evaluating the statistical analysis and reliability of the developed system. The obtained value of the kappa coefficient shows the reliability and significance of the proposed work are high. The database used about 746 chests scanned CT images containing both infected subjects with COVID-19 and normal subjects. The results obtained by utilizing various COVID-19 CT imaging features show that artificial intelligence-based techniques can potentially diagnose the patients more efficiently and reliably. Despite achieving good success in the detection and diagnosis of COVID-19 by deep learning algorithms, these algorithm based equipments are not available in all the health centers and medical laboratories. This is one such challenge that needs an attention in future research.
Funding Statement: This research was supported by Taif University Researchers Supporting Project number (TURSP-2020/215), Taif University, Taif, Saudi Arabia.
Conflicts of Interest: The authors declare that they have no conflicts of interest to report regarding the present study.
1. L. Y. Lee, J. B. Cazier, T. Starkey, C. D. Turnbull, U. C. C. M. P. Team et al., “COVID-19 mortality in patients with cancer on chemotherapy or other anticancer treatments: A prospective cohort study,” The Lancet, vol. 395, no. 10241, pp. 1919–1926, 2020. [Google Scholar]
2. C. Nanshan, M. Zhou, X. Dong, J. Q. F. Gong, Y. Han et al., “Epidemiological and clinical characteristics of 99 cases of 2019 novel coronavirus pneumonia in Wuhan, China: A descriptive study,” The Lancet, vol. 395, no. 10223, pp. 507–513, 2020. [Google Scholar]
3. S. Feng, J. Wang, J. Shi, Z. Wu, Q. Wang et al., “Review of artificial intelligence techniques in imaging data acquisition, segmentation and diagnosis for covid-19,” IEEE Reviews in Biomedical Engineering, vol. 14, pp. 4–15, 2020. [Google Scholar]
4. W. Dawei, B. Hu, C. Hu, F. Zhu, X. Liu et al., “Clinical characteristics of 138 hospitalized patients with 2019 novel coronavirus-infected pneumonia in Wuhan, China,” JAMA, vol. 323, no. 11, pp. 1061–1069, 2020. [Google Scholar]
5. S. Wang, Y. Zha, W. Li, Q. Wu, X. Li et al., “A fully automatic deep learning system for COVID-19 diagnostic and prognostic analysis,” European Respiratory Journal, vol. 56, pp. 775–819, 2020. [Google Scholar]
6. D. Dong, Z. Tang, S. Wang, H. Hui, L. Gong et al., “The role of imaging in the detection and management of COVID-19: A review,” IEEE Reviews in Biomedical Engineering, vol. 14, pp. 16–29, 2020. [Google Scholar]
7. M. Chen, S. Xiaobo, Y. Zhang, D. Wu and M. Guizani, “Deep features learning for medical image analysis with convolutional autoencoder neural network,” IEEE Transactions on Big Data, vol. 99, pp. 1, 2017. [Google Scholar]
8. Z. Qingchen, T. L. Yang, Y. Zheng, C. Zhikui and P. Li, “An efficient deep learning model to predict cloud workload for industry informatics,” IEEE Transactions on Industrial Informatics, vol. 14, no. 7, pp. 3170–3178, 2018. [Google Scholar]
9. G. M. Usman and W. C. Karl, “Fast enhanced CT metal artifact reduction using data domain deep learning,” IEEE Transactions on Computational Imaging, vol. 6, pp. 181–193, 2019. [Google Scholar]
10. P. Yun, M. Lin, Y. Fu, H. Kan, L. Hong et al., “Colorectal tumor segmentation of CT scans based on a convolutional neural network with an attention mechanism,” IEEE Access, vol. 8, pp. 64131–64138, 2020. [Google Scholar]
11. A. B. Mohamed, R. Mohamed, M. Elhoseny, R. K. Chakrabortty and M. Ryan, “A hybrid covid-19 detection model using an improved marine predators algorithm and a ranking-based diversity reduction strategy,” IEEE Access, vol. 8, pp. 79521–79540, 2020. [Google Scholar]
12. A. Tao, Y. Zhenlu, H. Hongyan, Z. Chenao, C. Chong et al., “Correlation of chest CT and RT-PCR testing in coronavirus disease 2019 (COVID-19) in China: A report of 1014 case,” Radiology, vol. 296, pp. 200642, 2020. [Google Scholar]
13. C. Michael, A. Bernheim, M. Xueyan, N. Zhang, M. Huang et al., “CT imaging features of 2019 novel coronavirus (2019-nCoV),” Radiology, vol. 295, no. 1, pp. 202–207, 2020. [Google Scholar]
14. L. Elaine, Y. Ming-Yen and P. L. Khong, “COVID-19 pneumonia: What has CT taught us?,” The Lancet Infectious Diseases, vol. 20, no. 4, pp. 384–385, 2020. [Google Scholar]
15. F. Yicheng, H. Zhang, X. Jicheng, L. Minjie, Y. Lingjun et al., “Sensitivity of chest CT for COVID-19: Comparison to RT-PCR,” Radiology, vol. 296, pp. 200432, 2020. [Google Scholar]
16. X. Xingzhi, Z. Zhong, W. Zhao, C. Zheng, F. Wang et al., “Chest CT for typical 2019-nCoV pneumonia: Relationship to negative RT-PCR testing,” Radiology, vol. 296, pp. 200343, 2020. [Google Scholar]
17. B. X. Harrison, B. Hsieh, Z. Xiong, K. Halsey, J. W. Choi et al., “Performance of radiologists in differentiating COVID-19 from viral pneumonia on chest CT,” Radiology, vol. 296, pp. 46–54, 2020. [Google Scholar]
18. W. Zhao, Z. Zhong, X. Xingzhi, Y. Qizhi and J. Liu, “Relation between chest CT findings and clinical conditions of coronavirus disease (COVID-19) pneumonia: A multicenter study,” American Journal of Roentgenology, vol. 214, no. 5, pp. 1072–1077, 2020. [Google Scholar]
19. P. Yueying, G. Hanxiong, Z. Shuchang, Y. Wang and L. Qian, “Initial CT findings and temporal changes in patients with the novel coronavirus pneumonia (2019-nCoVA study of 63 patients in Wuhan, China,” European radiology, vol. 30, pp. 3306–3309, 2020. [Google Scholar]
20. G. Wei-jie, N. Zheng-yi, Y. Hu, L. Wen-hua, O. Chun-quan et al., “Clinical characteristics of coronavirus disease 2019 in China,” New England Journal of Medicine, vol. 382, no. 18, pp. 1708–1720, 2020. [Google Scholar]
21. L. Yan and X. Liming, “Coronavirus disease 2019 (COVID-19Role of chest CT in diagnosis and management,” American Journal of Roentgenology, vol. 214, pp. 1280–1286, 2020. [Google Scholar]
22. X. Wei, S. Jianbo, Y. Guo, P. Xuehua, L. Zhen et al., “Clinical and CT features in pediatric patients with COVID-19 infection: Different points from adults,” Pediatric Pulmonology, vol. 55, no. 5, pp. 1169–1174, 2020. [Google Scholar]
23. L. Lin, Q. Lixin, X. Zeguo, Y. Youbing, X. Wang et al., “Artificial intelligence distinguishes COVID-19 from community acquired pneumonia on chest CT,” Radiology, pp. 905–920, 2020. [Google Scholar]
24. B. Charmaine, G. Jagpal, C. David and B. A. Babu, “Deep learning system to screen coronavirus disease 2019 pneumonia,” Applied Intelligence, vol. 6, pp. 1–7, 2020. [Google Scholar]
25. H. Shaoping, Y. Gao, N. Zhangming, Y. Jiang, L. Lao et al., “Weakly supervised deep learning for covid-19 infection detection and classification from CT images,” IEEE Access, vol. 8, pp. 118869–118883, 2020. [Google Scholar]
26. J. Zhao, Y. Zhang, X. He and P. Xie, “COVID-CT-Dataset: A CT scan dataset about COVID-19,” arXiv preprint arXiv: 2020,13865, 2003. [Google Scholar]
27. B. X. Harrison, R. Wang, Z. Xiong, B. Hsieh, K. Chang et al., “AI augmentation of radiologist performance in distinguishing covid-19 from pneumonia of other etiology on chest CT,” Radiology, vol. 296, pp. 201491, 2020. [Google Scholar]
28. L. Deng, “A tutorial survey of architectures, algorithms, and applications for deep learning,” APSIPA Transactions on Signal and Information processing, vol. 3, no. 3, pp. 7825, 2014. [Google Scholar]
29. L. Yaxi, W. Huangfu, H. Zhang and K. Long, “An efficient stochastic gradient descent algorithm to maximize the coverage of cellular networks,” IEEE Transactions on Wireless Communications, vol. 18, no. 7, pp. 3424–3436, 2019. [Google Scholar]
30. M. Manoj, G. Srivastava, S. R. K. Somayaji, T. R. Gadekallu, P. K. R. Maddikunta et al., “An incentive based approach for COVID-19 planning using blockchain technology,” in 2020 IEEE Globecom Workshops, Taipei, Taiwan, pp. 1–6, 2020. [Google Scholar]
 | This work is licensed under a Creative Commons Attribution 4.0 International License, which permits unrestricted use, distribution, and reproduction in any medium, provided the original work is properly cited. |