DOI:10.32604/cmc.2022.019490
| Computers, Materials & Continua DOI:10.32604/cmc.2022.019490 | |
| Article |
A Cascaded Design of Best Features Selection for Fruit Diseases Recognition
1Department of Computer Science, COMSATS University Islamabad, Wah Campus, 47080, Pakistan
2Department of Computer Science, HITEC University Taxila, Taxila, 47040, Pakistan
3College of Computer Engineering and Sciences, Prince Sattam Bin Abdulaziz University, Al-Khraj, Saudi Arabia
4National University of Science and Technology Islamabad, Islamabad, Pakistan
5Faculty of Applied Computing and Technology, Noroff University College, Kristiansand, Norway
6Research Group of Embedded Systems and Mobile Application in Health Science, College of Arts, Media and Technology, Chiang Mai University, Chiang Mai, 50200, Thailand
*Corresponding Author: Orawit Thinnukool. Email: orawit.t@cmu.ac.th
Received: 15 April 2021; Accepted: 05 June 2021
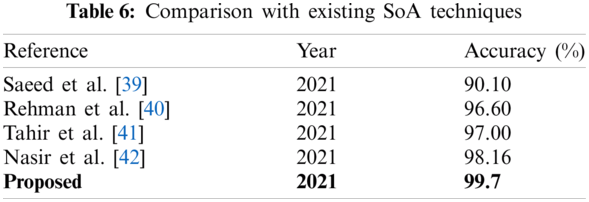
Abstract: Fruit diseases seriously affect the production of the agricultural sector, which builds financial pressure on the country's economy. The manual inspection of fruit diseases is a chaotic process that is both time and cost-consuming since it involves an accurate manual inspection by an expert. Hence, it is essential that an automated computerised approach is developed to recognise fruit diseases based on leaf images. According to the literature, many automated methods have been developed for the recognition of fruit diseases at the early stage. However, these techniques still face some challenges, such as the similar symptoms of different fruit diseases and the selection of irrelevant features. Image processing and deep learning techniques have been extremely successful in the last decade, but there is still room for improvement due to these challenges. Therefore, we propose a novel computerised approach in this work using deep learning and featuring an ant colony optimisation (ACO) based selection. The proposed method consists of four fundamental steps: data augmentation to solve the imbalanced dataset, fine-tuned pre-trained deep learning models (NasNet Mobile and MobileNet-V2), the fusion of extracted deep features using matrix length, and finally, a selection of the best features using a hybrid ACO and a Neighbourhood Component Analysis (NCA). The best-selected features were eventually passed to many classifiers for final recognition. The experimental process involved an augmented dataset and achieved an average accuracy of 99.7%. Comparison with existing techniques showed that the proposed method was effective.
Keywords: Fruits diseases; data augmentation; deep learning; features fusion; feature selection
There is a need for proper and early detection of fruit spots and patches on leaves or any other part of a fruit plant to identify symptoms of dangerous non-curious diseases due to the huge contribution to the country's economy made by fruit growth productivity in the agricultural sector [1]. A day of automatic techniques can detect fruit diseases in the early stages, thereby precluding manual intervention [2]. Image processing and computer vision techniques can recognise and classify fruit diseases from any large image dataset [3,4]. Research areas of image processing in agriculture involve different domains, such as the pre-processing and segmentation of the dataset from the computer vision and image processing domain [5,6]. On another level, features are extracted and selected by computer vision and pattern reorganisation and then classified by artificial intelligence and machine learning [7]. Pre-processing techniques include dataset augmentation, contrast enhancement, histogram techniques and noise removal [8]. Similarly, segmentation techniques include thresholding, as well as edge-based segmentation and clustering-based segmentation [9]. A feature extractor technique, also known as feature descriptors, includes a handcrafted feature descriptor, learning-based feature descriptor, deep learning-based feature descriptor, area, and graph feature-based extractor. Classical features, such as texture, colour, point and shape, have mainly been used to recognise plant diseases in the past two years [10,11].
Fruit diseases have recently been automatically detected and classified using computer technologies instead of being manually monitored by humans [12]. Machine learning and computer vision algorithms have been used to recognise the diseased part of a leaf and they have been particularly beneficial by easily identifying signs of an infected region, i.e., when the sign of a disease appears on a plant leaf [13]. Deep learning is part of ML, which utilises the neural network for the extraction of deep features [14,15], and this method has been applied in many applications for plant disease detection and classification in recent years [16]. Deep learning techniques produce more accurate results than classical techniques because the features are automatically extracted and utilised for classification purposes. Zhu et al. [17] introduced an automated system for recognising grape diseases using an image analysis and a backpropagation neural network. This model could easily perceive four grape leaf diseases [Sphaceloma ampelinum de Bary, anthracnose, round spot and downy mildew]. Sladojevic et al. [18] proposed a process to identify plant diseases using an automatic classifying method, which was able to visually recognise thirteen different plant diseases with a 96.3% accuracy. Jhuria et al. [19] presented a technique to identify fruit diseases during the farming process, and it was able to identify two apple diseases and one grape disease. Firstly, the image dataset was pre-processed, which included resizing the function of each image (200, 250). Next, the morphological and textural features of the image were extracted separately and the morphological features produced good results and textures. At the end of the classification, the results were found to be 90% accurate.
Pixia et al. [20] proposed a method for detecting cucumber disease using image-processing tools. The pre-processing step involved grey scaling and smoothing the image, and in the segmentation step, the operation of the corrosion lesion was applied to the image dataset. As for the feature extraction, colour feature extraction was used to extract the morphological features in order to reduce any inappropriate features. The disease detection rate was 96% at the end of all observations and results. Degadwala et al. [21] utilised both classification and segmentation techniques and identified three apple diseases (apple scab, apple rot, apple blotch). Firstly, they used a K-means clustering technique to segment the image dataset and then extracted the features using colour features (global colour histogram, Color Coherence Vector) and Textural Features (Local Binary Pattern), as well as a fusion of the features. Lastly, a Random Forest Classifier was used to improve the accuracy of the classification. In discussing how to identify and classify green litchi disease, He et al. [22] mentioned the challenge involved in trying to separate the background compared to detecting the red litchi disease. As for feature extraction, colour features were extracted first, then the appropriate features were taken using LDA and finally, a support vector machine was used for the classification. According to the results, the precision rate of green litchi recognition was 80.4% and the recall rate was 76.4%.
The above-listed studies still have many challenges, which reduce the accuracy of their recognition. The first challenge is the availability of sufficient datasets, which is followed by an imbalanced dataset. The second challenge is the huge similarity of the symptoms of different fruit diseases, which leads to the misclassification of images. Another issue faced by researchers is the selection of the best features because irrelevant and redundant features reduce the accuracy of the recognition. Therefore, we propose an automated system based on deep learning and an ant colony optimisation (ACO) based feature selection to overcome these challenges. The major contributions of this work are as follows;
• Augmented the data to increase the size of the dataset and balance the original dataset to increase the training performance of the deep learning model.
• Fine-tuned NasNet Mobile and MobileNet V2 based on the classification layer. Added a new layer that includes information about the target dataset (augmented fruit diseases dataset).
• Selected the best features using a hybrid ACO and a Neighbourhood Component Analysis (NCA) and passed them to many classifiers for a final recognition.
The remainder of this manuscript is organised as follows: The proposed methodology, including deep learning models, fusion of deep features and selection scheme, is discussed in Section 2. The results are presented and compared in Section 3 and the work is concluded in Section 4.
In the proposed methodology, two pre-trained deep learning models, NasNet-Mobile and MobileNet-V2, are used to extract the deep features. A hybrid approach based on the ACO and NCA is then proposed to select the best features, which are classified using supervised learning algorithms. The proposed flow diagram of the automated recognition of fruit diseases is illustrated in Fig. 1 and each step is detailed below.
2.1 Data Collection and Preparation
The Plant Village dataset, which was obtained from Kaggle, was used for this work [23]. It contains a massive number of classes of different plant diseases, but we only considered fruit leaf diseases; hence, the shortened dataset only consisted of 15 classes comprising six type of fruit, which include Apples (scab, black rot, cedar rust, healthy), Cherries (healthy, powdery mildew), Grapes (black rot, esca black measles, healthy, leaf blight, Isariopsis Leaf Spot), Orange Haunglongbing (Citrus_greening), Peaches (Bacterial spot, healthy) and Strawberries (healthy, Leaf scorch).
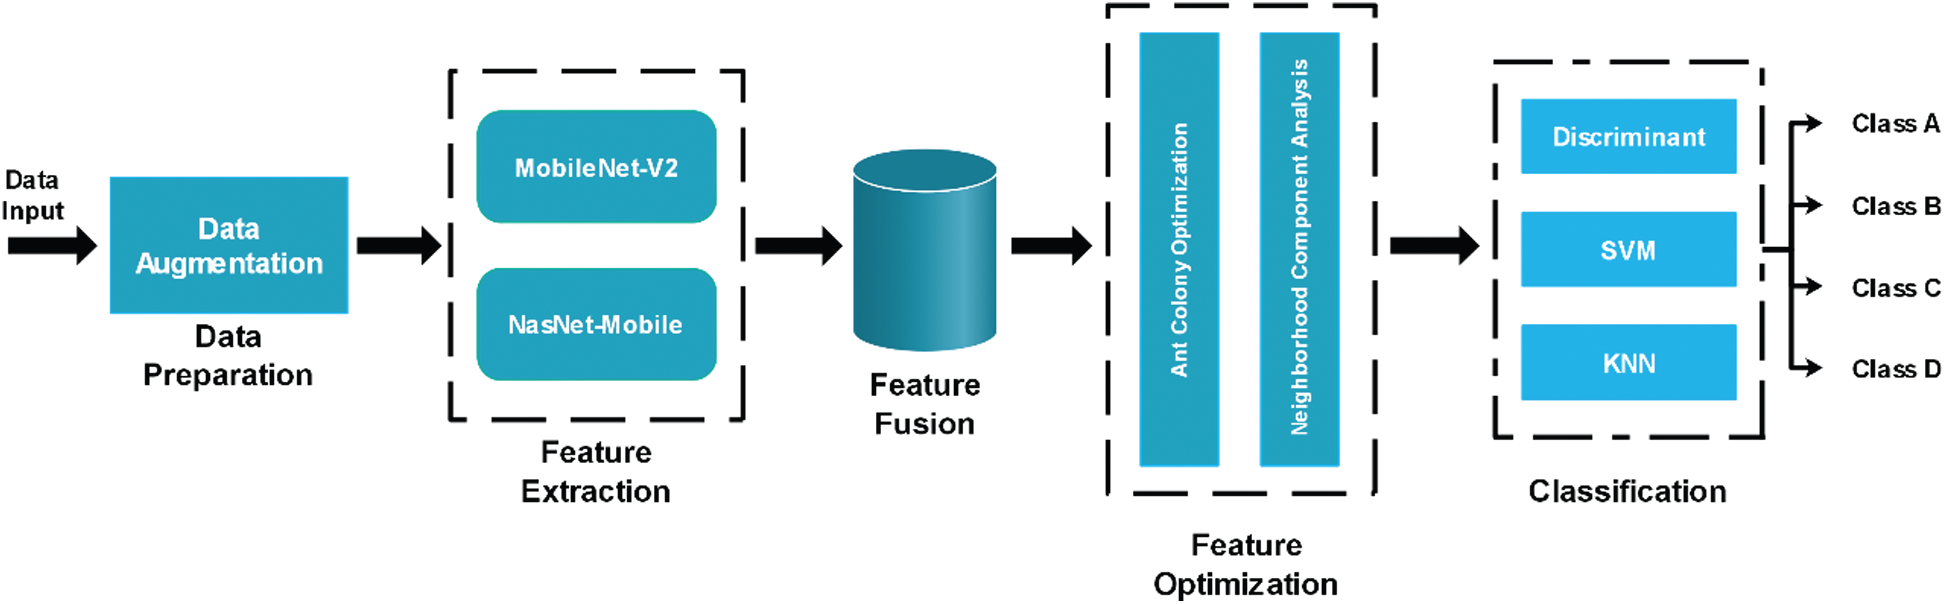
Figure 1: Proposed flow diagram for fruit diseases recognition. * A, B, C, D represents the image labels. These labels are examples, and actual labels are cucumber leaf diseases
Using imbalanced data for classification creates bias, which affects the results. Hence, it is necessary to augment the data for image-processing tasks. As mentioned above, the original dataset contained 15 classes, a few of which were imbalanced. Therefore, we balanced them using three different operations: a horizontal flip, vertical flip, and transposition. 600 images were left in each class after the augmentation. A few sample images are shown in Fig. 2. The main purpose of this step was to increase the number of images in the dataset for better training purposes.
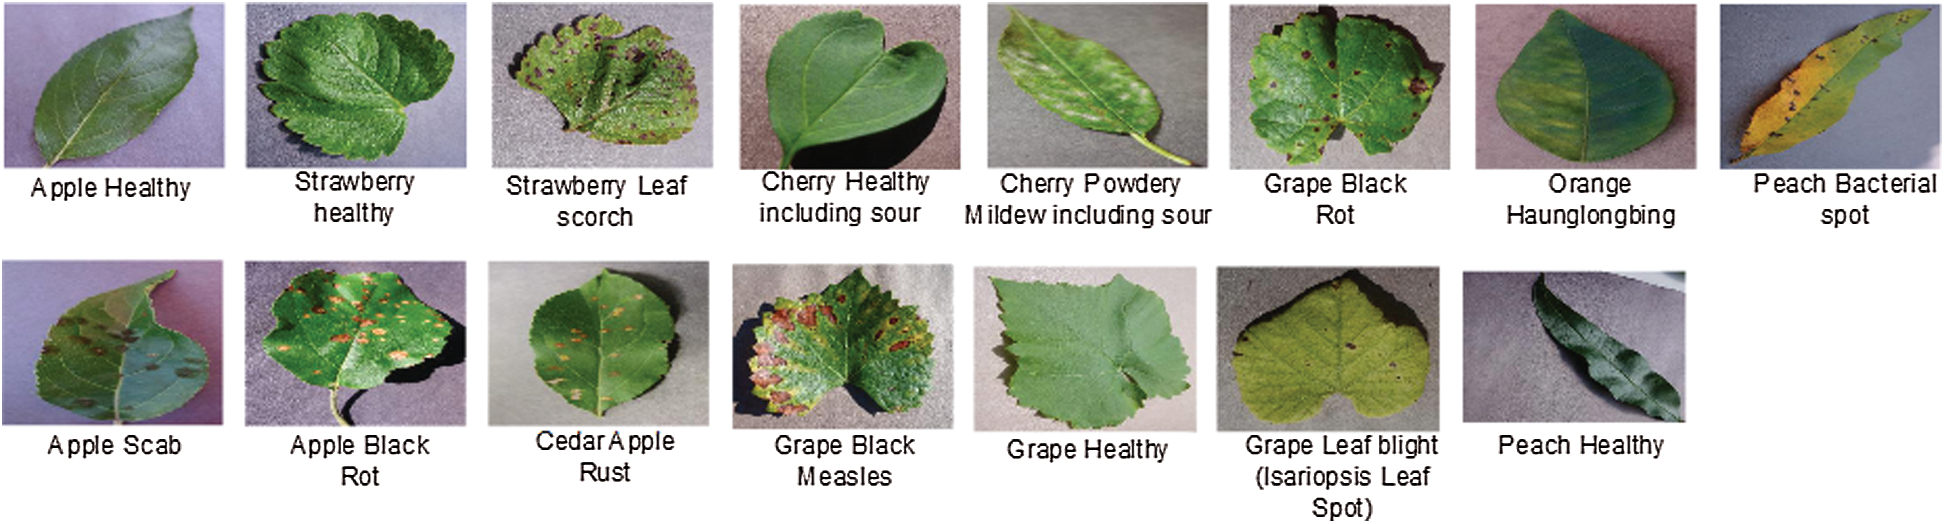
Figure 2: Sample images of augmented dataset for fruit leaf diseases
Deep convolutional neural networking (DCNN) has achieved surprising success in AI, ML and image processing in the past two decades [24,25]. Convolutional neural networking (CNN) has improved the performance of different recognition tasks over the years by observing and exploiting different network architectures and structural modifications. The twist in the technology of CNNs can be classified in different ways, such as function activation in architecture, learning algorithms, optimisation and regularisation in architectural layers, ti name but a few [26]. In this work, we implemented two pre-trained DCNN architectures, NasNet-Mobile and MobileNet-V2, to recognise fruit leaf diseases.
Neural architecture search (NAS) is the latest DL technique in the field of artificial neural networks (ANN). It was proposed by the Google brain team in 2016 and has three constituents: search space, search strategy and performance estimation [27]. Search space involves searching for convoluted performances, fully-connected, max-pooling, etc., and then checking the connection between the layers through which complete feasible network architectures are formed. The search strategy involves the use of random search and reinforced learning to sample the population of network architecture candidates by receiving child model performance rewards (maximum accuracy, time management). Meanwhile, the main focus of performance estimation is to reduce computational resources or time regulation of network architecture, so that the performance is estimated at the search strategy position when receiving the child model performance rewards [28,29].
In the proposed work, we fine-tuned this model and then trained with images of fruit leaf diseases. A fully connected layer was removed in the fine-tuning process and a new layer added that only included selected classes of fruit diseases. After that, the modified model was trained using transfer learning and a new model was learned. The deep features were extracted from the average pool layer, which was later utilised for classification purposes. The architecture of the NasNet-Mobile is illustrated in Fig. 3.
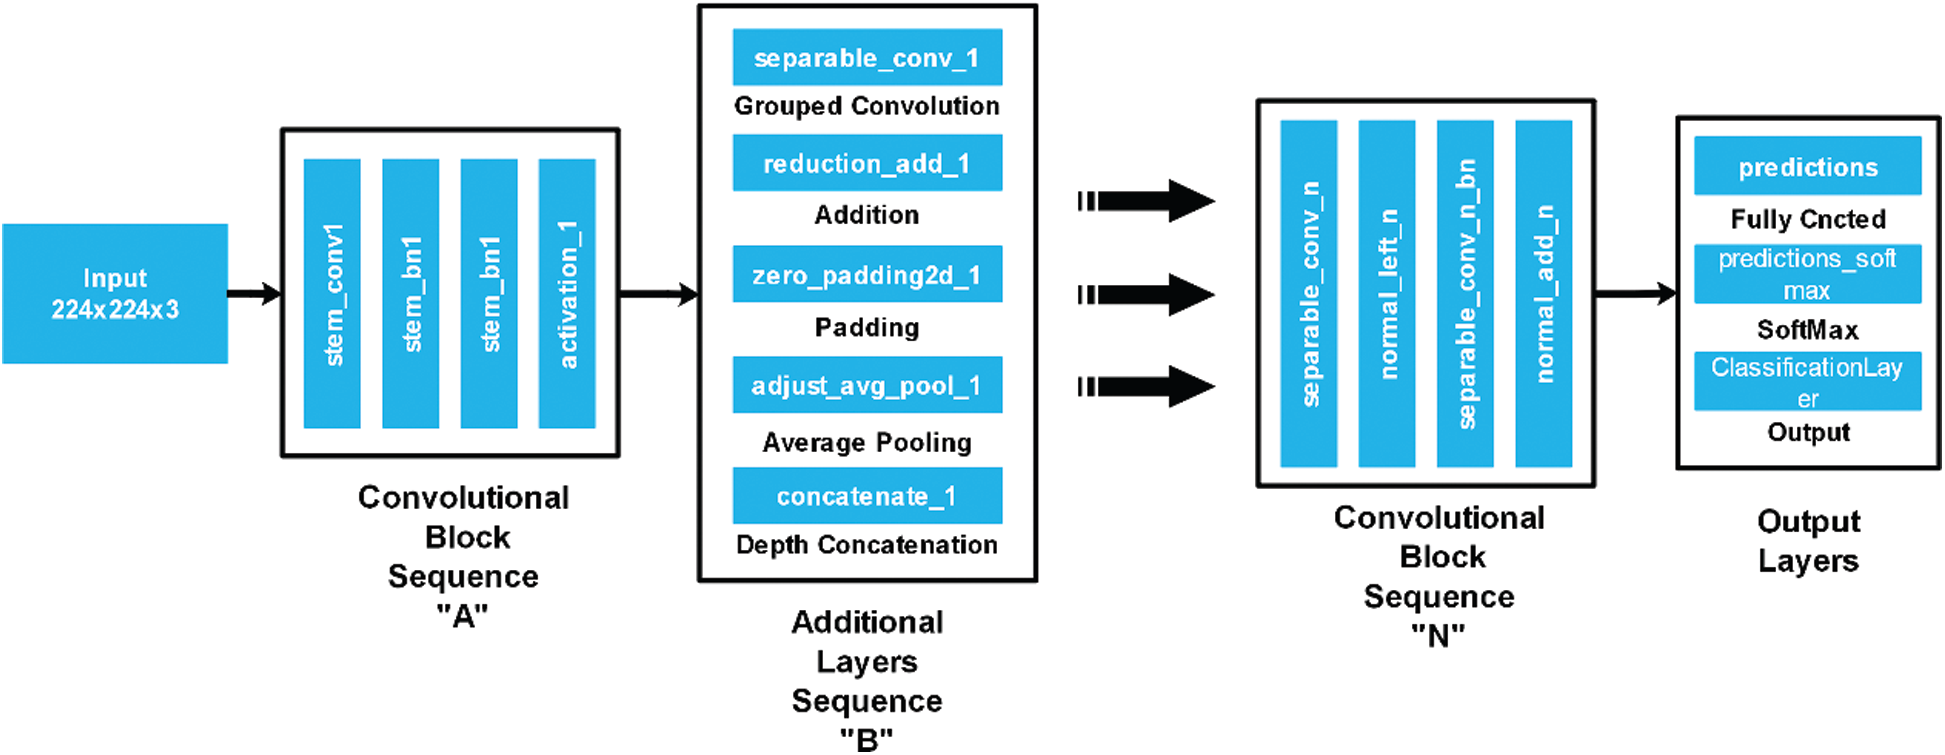
Figure 3: NasNet Mobile architecture
MobileNet-V2, which includes 53 deep layers, is the most commonly-used approach in artificial neural networks (ANN). It is less complex and contains less deep CNNs and its performance is effective for lightweight models (like any mobile device with a low computational or processing power). The fact that there is no proper static relationship between independent variables and dependent variables (non-linearity) in MobileNet-V1 layers, is removed in MobileNet-V2, which contains distinguishable filters made of depth-wise convolution and point-wise convolution. 1 × 1 filters are used to overcome the computing complexity of normal convolution that makes the network lightweight [30].
In this work, we firstly fine-tuned this model and trained on images of fruit leaf diseases. We removed a fully connected layer in the fine-tuning process and added a new layer that only included selected classes of fruit diseases. The modified model was then trained to learn a new target model using transfer learning. The deep features were extracted from the convolutional layer and utilised for classification purposes later. The architecture of MobileNet-V2 is illustrated in Fig. 4.
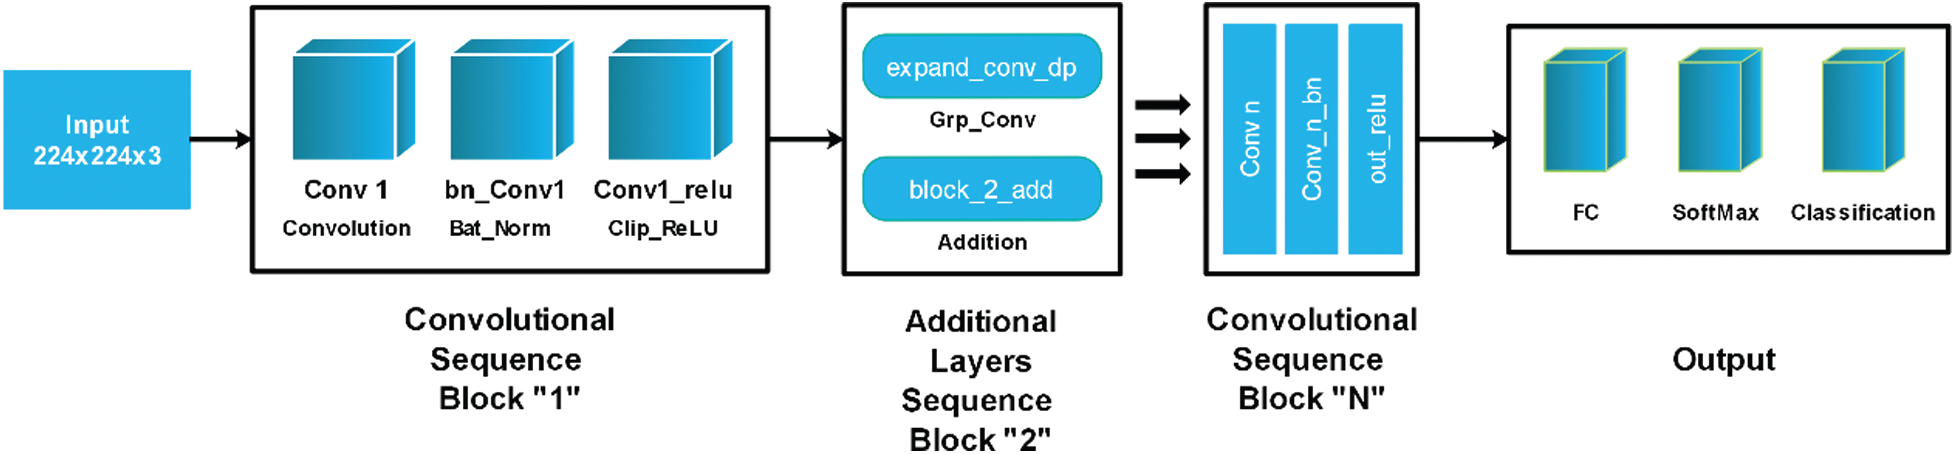
Figure 4: Modified MobileNet-V2 architecture
This is a process of combining multiple features into one matrix for more information about an object [31,32]. Many techniques for feature fusion are introduced in the literature, such as serial-based approach and a parallel approach. Better information about features is always needed to achieve a more accurate classification. In this work, we used a serial-based approach for the fusion of the deep learning features of both models. The dimensions of the features of both models were
This process is visually illustrated in Fig. 5. From which it can be seen that the features were extracted from two dense layers called prediction and logits and then fused using the above equation to improve the features information. However, since it was found during the experimental process that this step increased the redundancy among features, it was essential to remove it using a feature selection approach.
The selection of the best features is a hot research area in patten recognition [33,34]. Features from different sources, including some redundant information, are fused in one matrix. Many feature selection techniques introduced in the literature show an improved performance. Genetic algorithms, particle swarm optimisation (PSO) and entropy-based selection are just a few of the famous feature selection techniques [35,36]. In this work, we implemented a hybrid ACO-NCA feature selection approach, which initially involved selecting the features using ACO and then passing the output to NCA as an input. The final output was classified using supervised learning algorithms for the final classification.
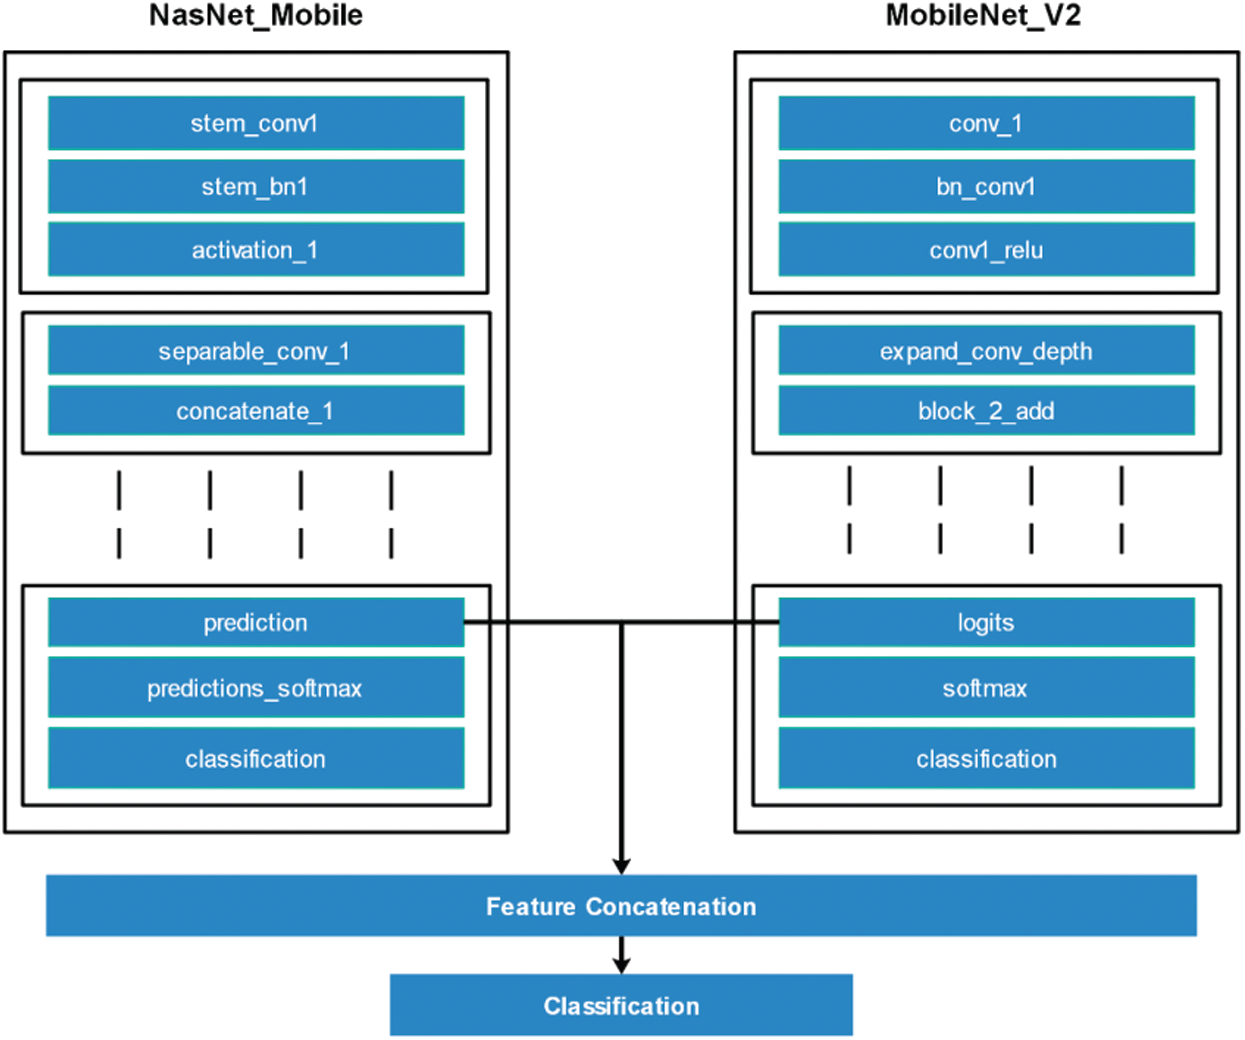
Figure 5: Visual representation of features fusion
2.4.1 Feature Selection Using Ant Colony Optimization (ACO)
Swarm intelligence facilitates the observation of the social behaviour of animals, birds and insects and obtain some ideas to make an analysis to solve our daily-life problems. Ant colony optimisation (ACO) is an example of swarm intelligence, which enables us to study the foraging (searching food) behaviour of the ant species. All ants generate or deposit pheromone on the ground while searching for food, highlighting the specific path for other members of the colony to follow. Since most ants are blind, this (Pheromone) is the only way they can communicate, which is an example of stigmergy. Pheromone is a chemical substance produced by animals and it changes the behaviour of animals of the same species [37]. Eq. (2) shows the pheromone level in a graph.
where τ is the quantity of pheromone, that is an ant deposit. Then i and j show the edge connecting node i and node j on the graph. K is the Kth ant, and
where m denotes the total number sof ants. The status of current pheromone and the new pheromone that should be deposited by all ends. Here vaporization occur, because experiment done once by all ants on edges of graph.
where (1-
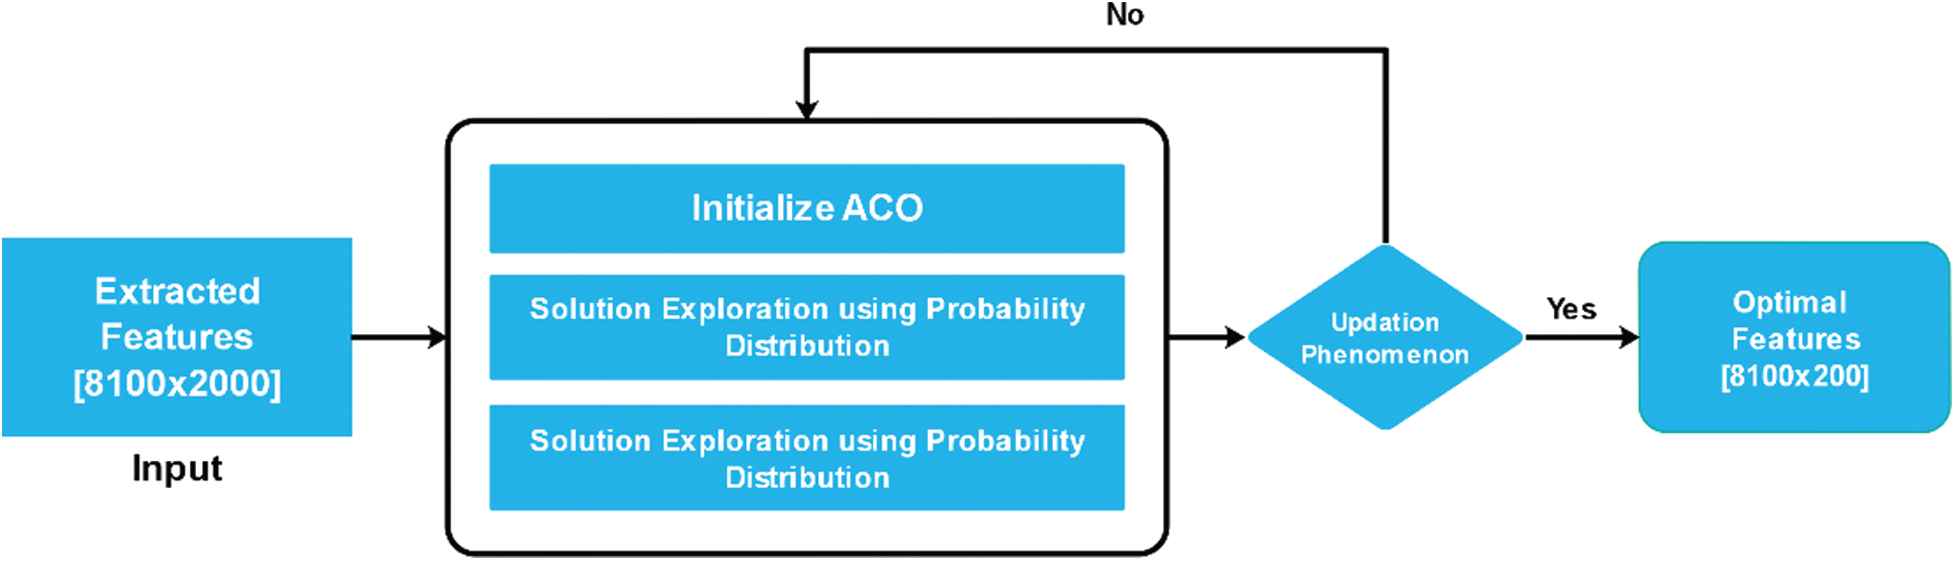
Figure 6: Work flow of ACO for best feature selection
2.4.2 Feature Selection Using Neighborhood Component Analysis (NCA)
The concept of Distance Metrics Learning (DML) is utilised in many ML algorithms because it makes it easy to define the patterns of the input dataset. The work of an NCA is based upon Mahalanobis Distance (MD) to find the k-nearest neighbours (KNN), which makes it possible to learn the linear transformation of a given dataset to achieve the most accurate classification of a complex nearest neighbour in the transformed space [38]. Euclidian Distance (ED) is a parallel approach to distance metrics. It finds the distance between two points in straight line on a graph and it also has the same weight and independence.
The NCA is embedded with a gradient descent-based optimisation function, which starts by randomly selecting an arbitrary neighbour
where,
where,
In Eq. (3),
Finally, the mathematical formulation of objective function maximization and error rate of assessed speculation is derived as follows:
where,
The results of the proposed framework are presented in this section. The dataset details are discussed in Section 3. Both augmented and original datasets were utilised for the experimental process and a total of 15 diseases of six different fruits were considered in the recognition process. The selected fruit were apples, cherries, grapes, oranges, peaches and strawberries and the images were both healthy and diseased. 70% of the images were used in the training of the modified deep learning models, while the remaining 30% were used for the testing. The learning rate of the deep model training was 0.0001, there were 100 epochs with 30 iterations per epoch. Multiple classifiers with many different methods were utilised for the classification results. Many performance measures were also utilised, such as accuracy, sensitivity, precision, false-negative rate (FNR), false positive rate (FPR), and area under the curve (AUC). All the experiments were performed on an HP Core i7-7500U laptop with 8 GB of RAM and 228 GB SSD, which is able to host MATLAB 2020a.
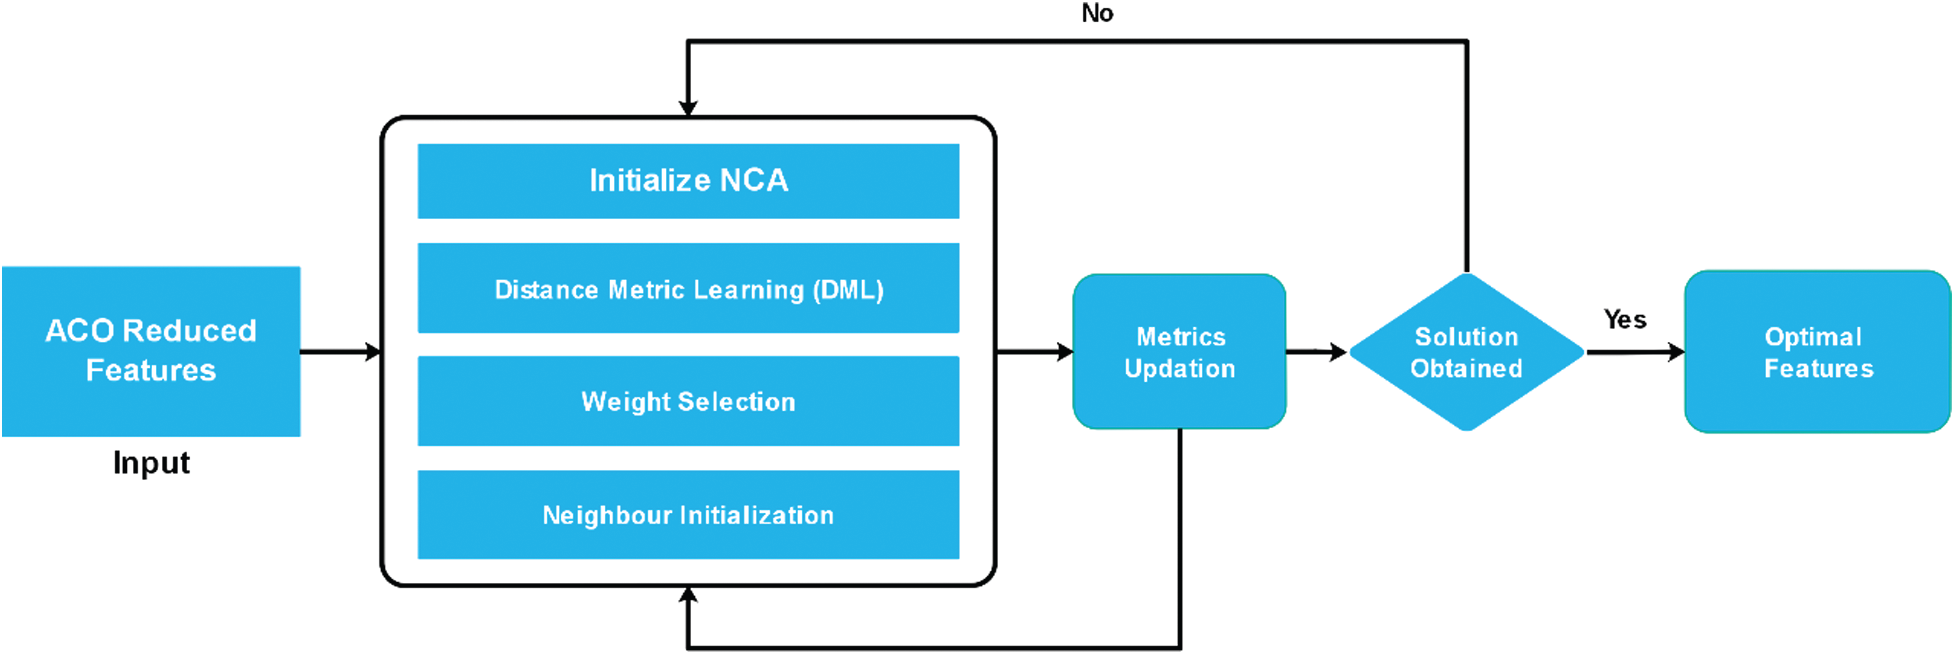
Figure 7: Workflow of NCA-based ACO features reduction
The first experiment began with passing the augmented images to the pre-trained modified NasNet-Mobile network. The extracted deep features were passed in the classifiers and the results in Tab. 1 show that the linear discriminant classifier was better than 97.2% accurate. The sensitivity rate (Sen) was 97.2% and the precision rate (Pre) was 97.24%. The sensitivity rate can be verified by the confusion matrix in Fig. 8, in which it is illustrated that correct prediction accuracy of each class was >95%. The other classifiers, such as the linear SVM, MG-SVM, Cg-SVM, Fine KNN, and Weighted KNN achieved an accuracy of 94.5%, 93.5%, 89.9%, 87.7%, and 88.3%, respectively.
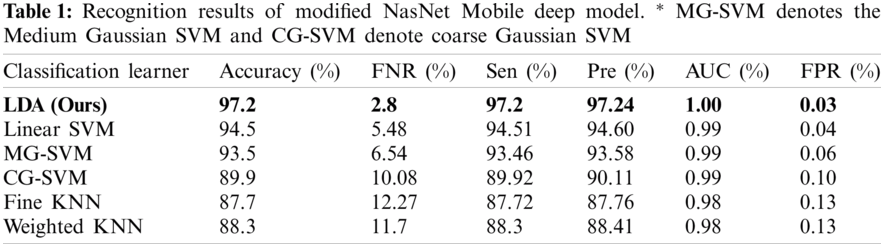
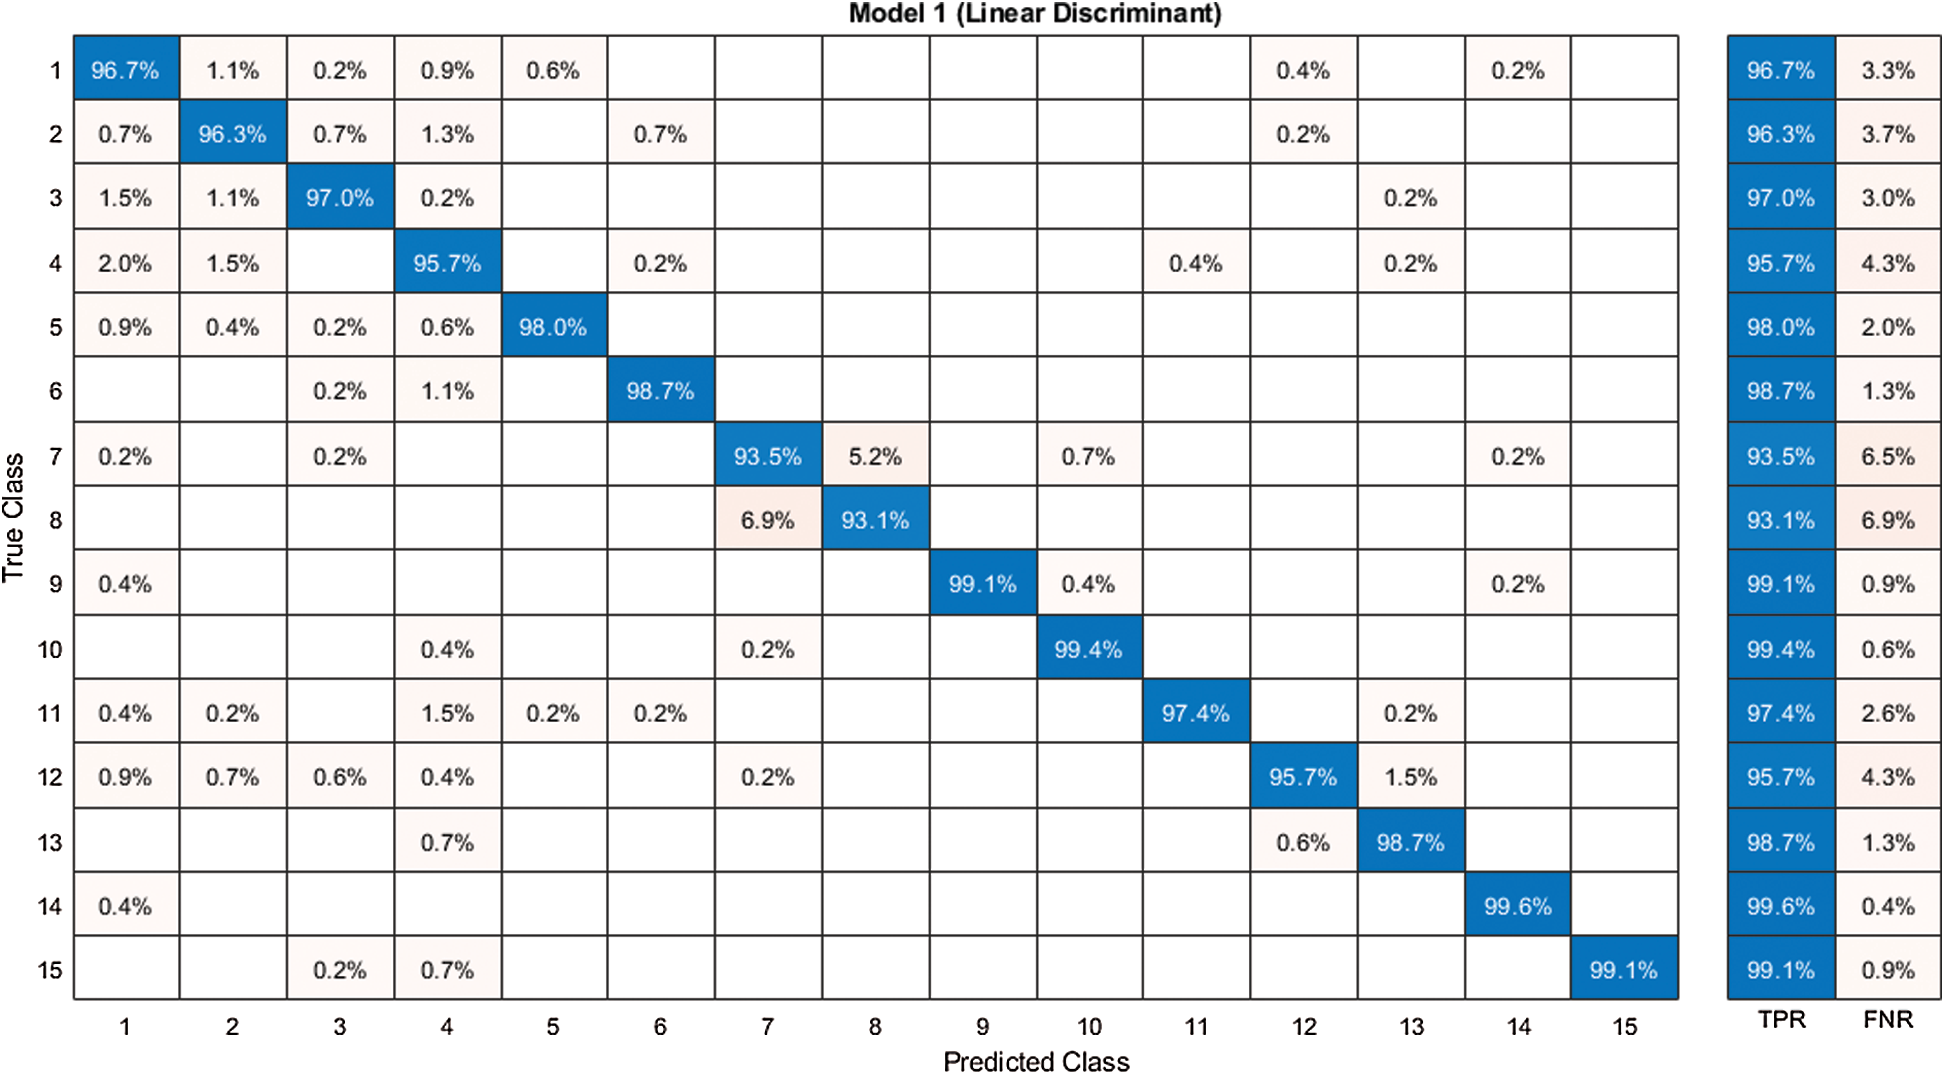
Figure 8: Confusion matrix of our method for experiment 1
The second experiment began with passing the augmented images to the pre-trained modified MobileNet-V2 deep CNN model. The results of passing the extracted deep features in the classifiers are presented in Tab. 2, which shows that the linear discriminant (ours) classifier was better than 98.5% accurate The sensitivity rate (Sen) was 98.48% and the precision rate (Pre) was 98.5%. The sensitivity rate can be verified by the confusion matrix in Fig. 9, in which it is illustrated that the correct prediction accuracy of each class was >96%. The other classifiers, such as the linear SVM, MG-SVM, Cg-SVM, Fine KNN, and Weighted KNN achieved an accuracy of 98.2%, 97.9%, 96.8%, 96.3%, and 96.1%, respectively. Hence, the accuracy of using the modified MobileNet V2 had improved.
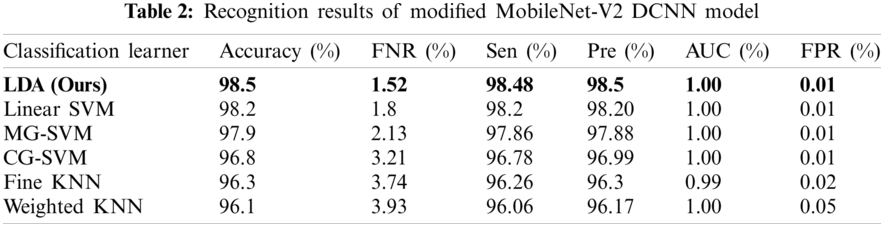
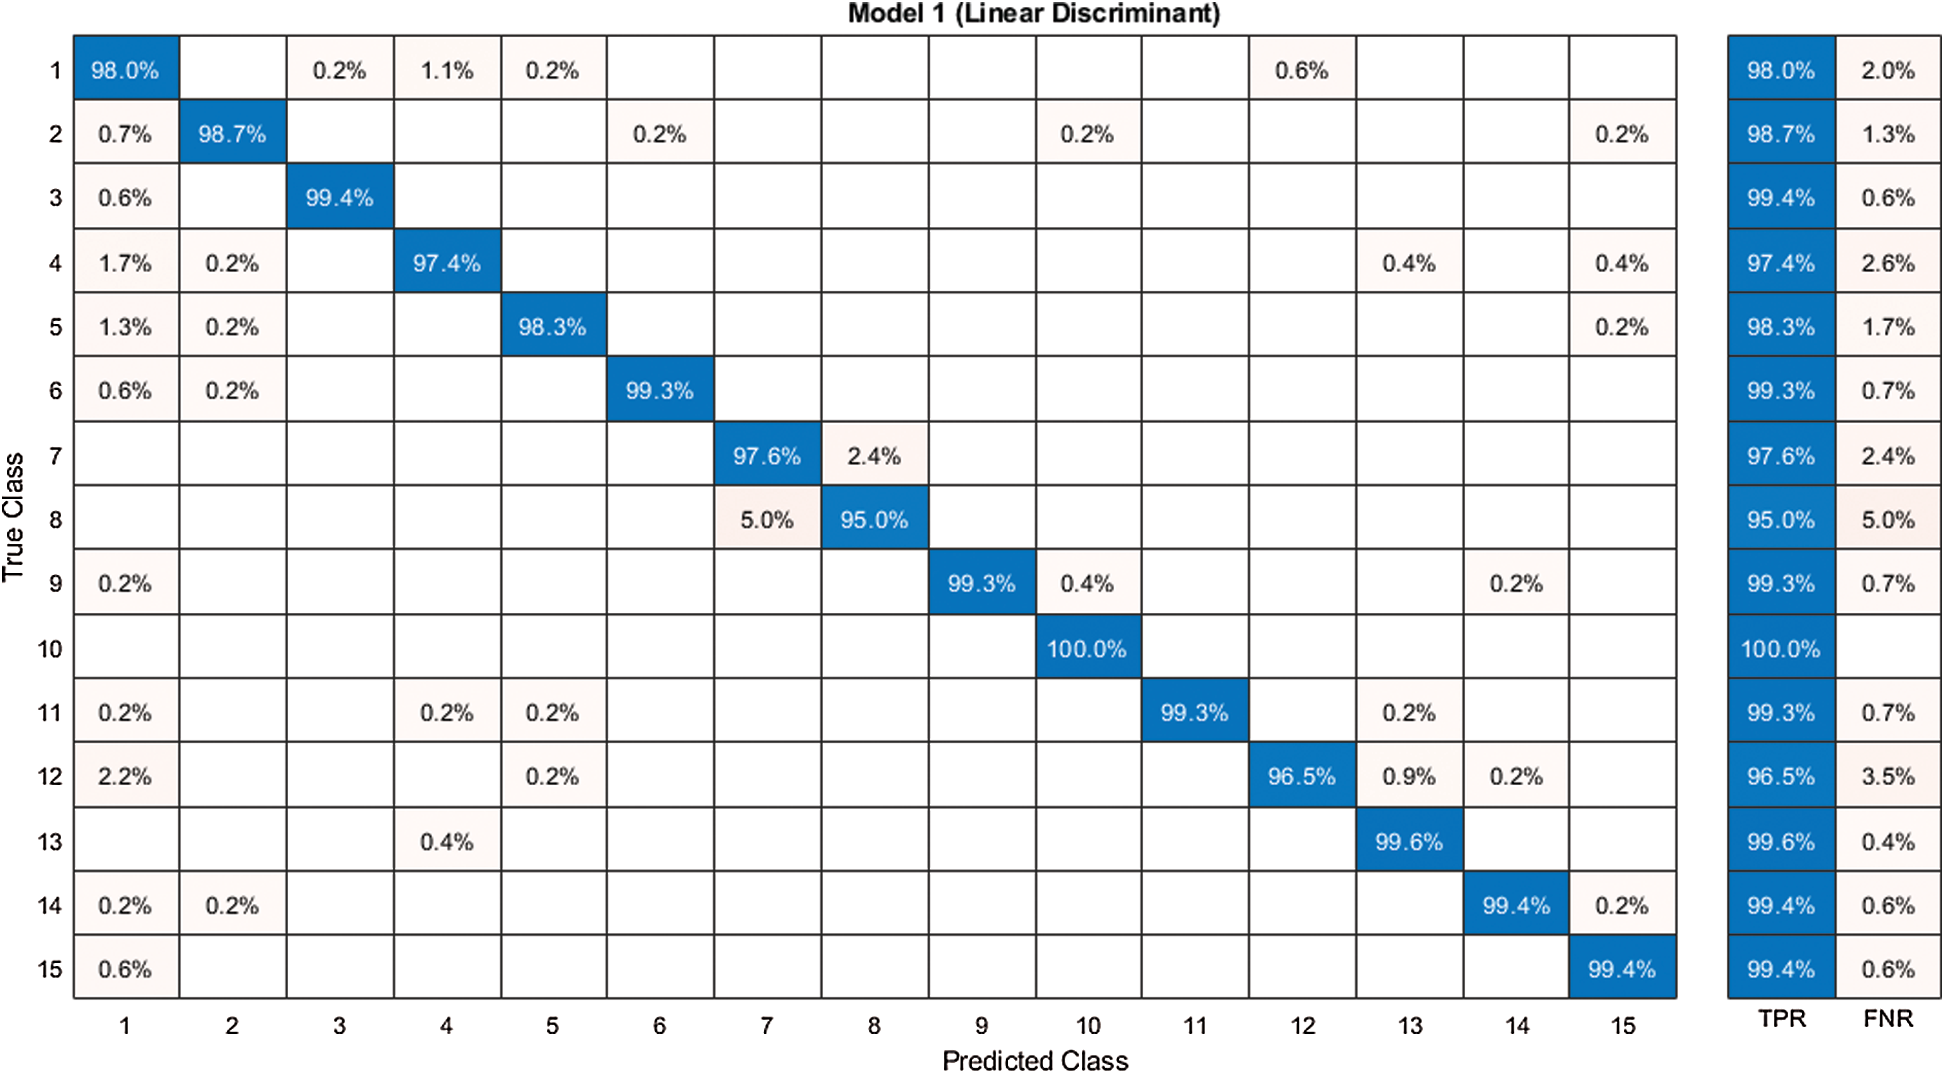
Figure 9: Confusion matrix of our method for experiment 2
The features of both deep models were fused in this experiment and the ACO was applied to select the best features. Then, the features were further reduced using the NCA approach and the results are presented in Tab. 3. It is noted in this table that the linear discriminant classifier was the most accurate with 99.7% accuracy. The sensitivity rate of this classifier was 99.7% and the precision rate was 99.71%. The other classifiers, such as the Linear SVM, MG-SVM, CG-SVM, Fine-KNN, and Weighted KNN achieved an accuracy of 99.1%, 98.7%, 98.3%, 95.8%, and 96.4%, respectively. The confusion matrix of the linear discriminant classifier using the proposed framework is illustrated in Fig. 10, which can verify the sensitivity rate of the proposed framework. It is demonstrated in this figure that the prediction accuracy of each class was above 99%. Therefore, the accuracy of the proposed framework had improved compared to experiments 1 and 2.
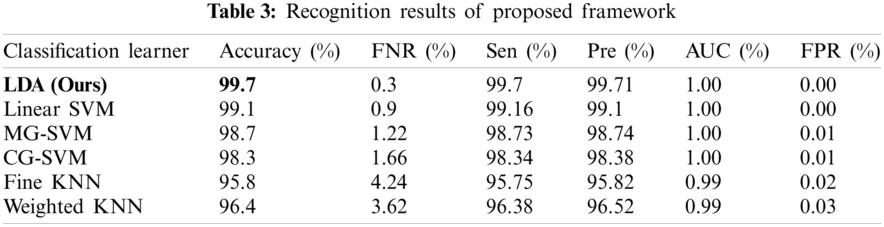
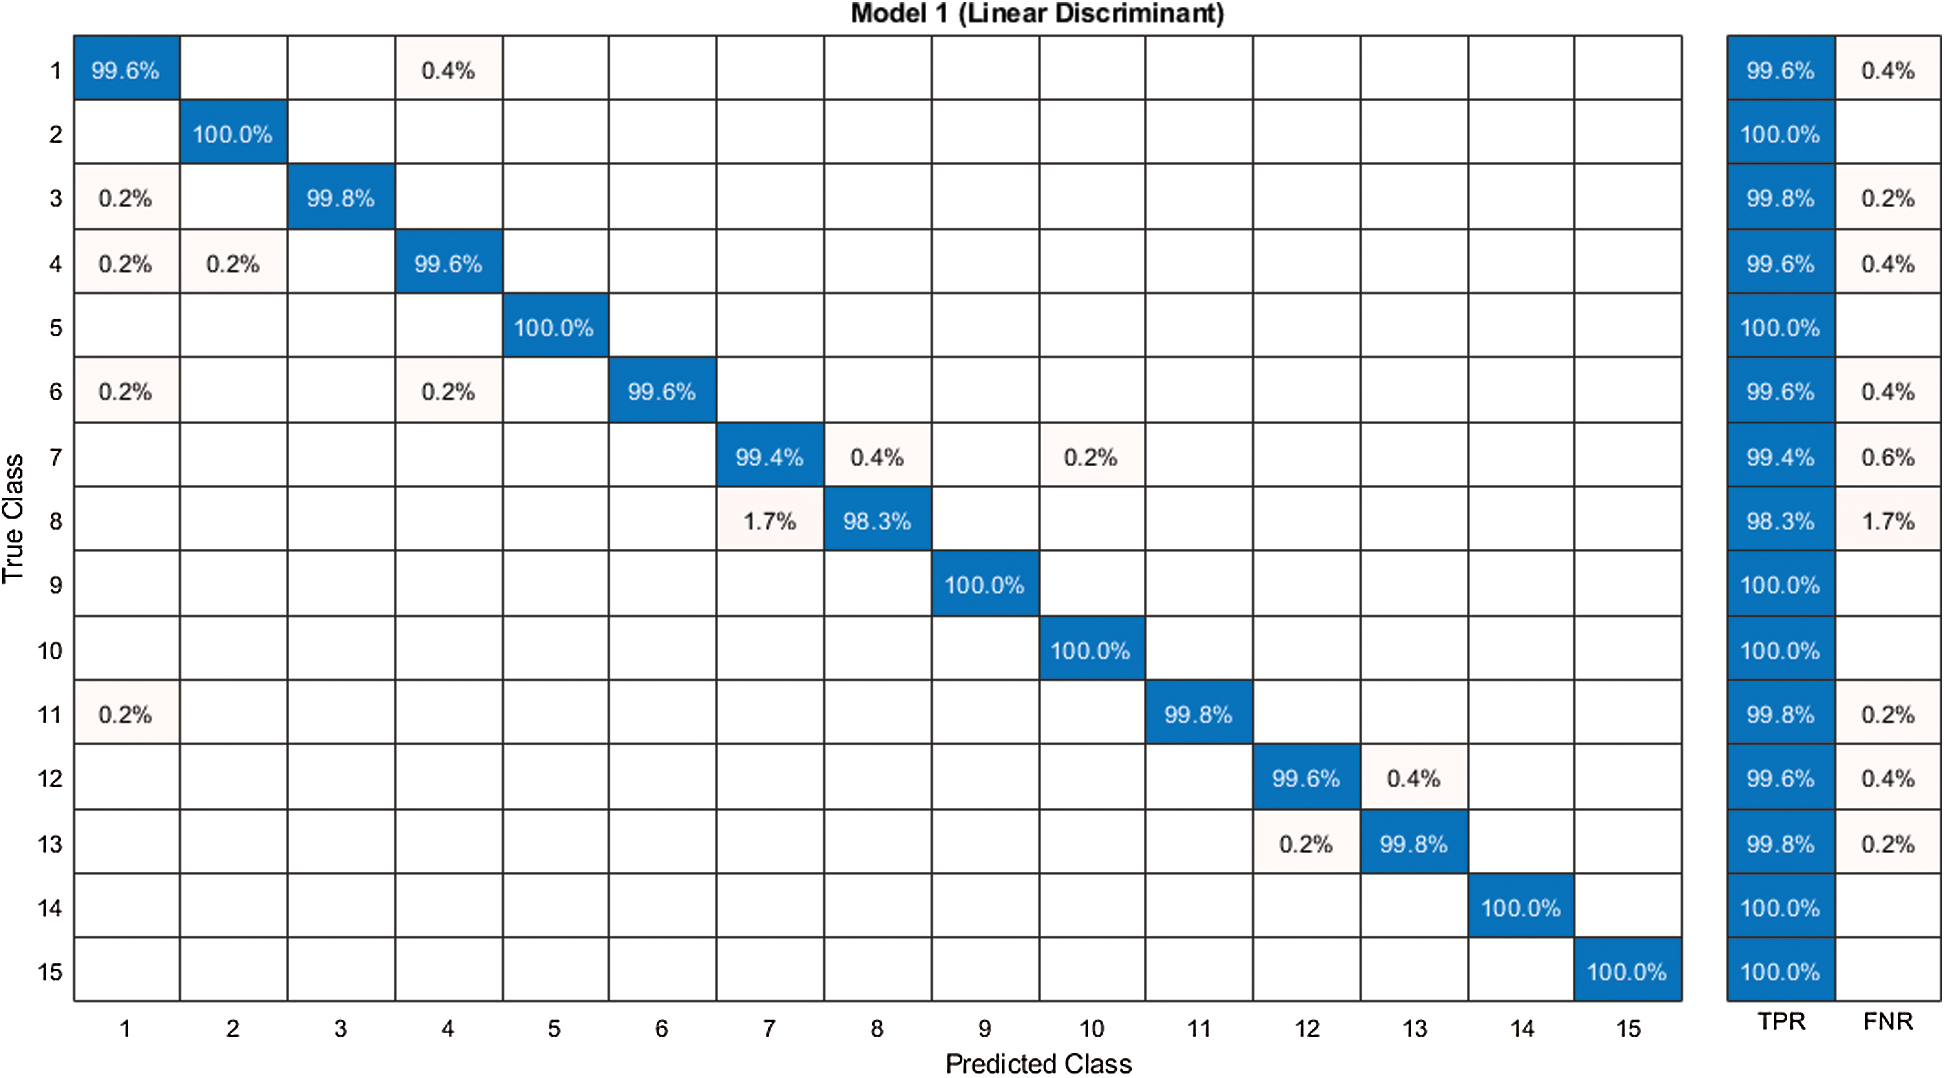
Figure 10: Confusion matrix of our proposed framework
The results of the fusion process are shown in Tab. 4, from which it can be seen that the fusion of the features of both deep models achieved an accuracy of 98.4%. The ACO-based features were then selected and found to have achieved an accuracy of 98.1%, which is almost consistent (See Tab. 5). The steps involved in the proposed framework, namely, the fusion of deep CNN features and the ACO-based selection were subjected to a time-based comparison and the results are shown in Fig. 11. It can be seen from this figure that the ACO-based selection process was less time-consuming. Similarly, the results of the computational performance of the fusion process, selection using the ACO and the proposed framework are shown in Fig. 12, from which it can be seen that the proposed framework was faster than the other methods. Finally, we compared the proposed framework with some recent studies and it was found that the proposed framework improved the accuracy of the process, as shown in Tab. 6.
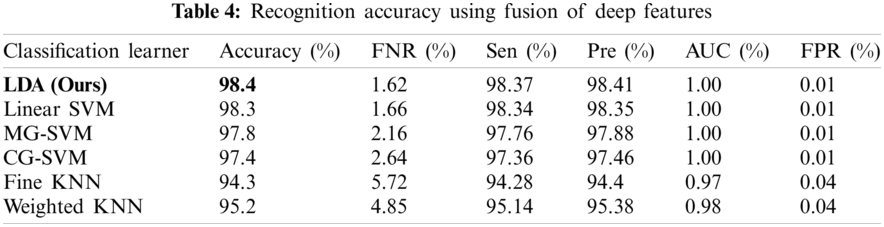
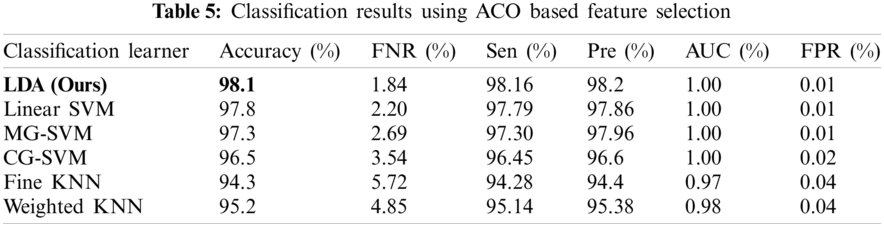
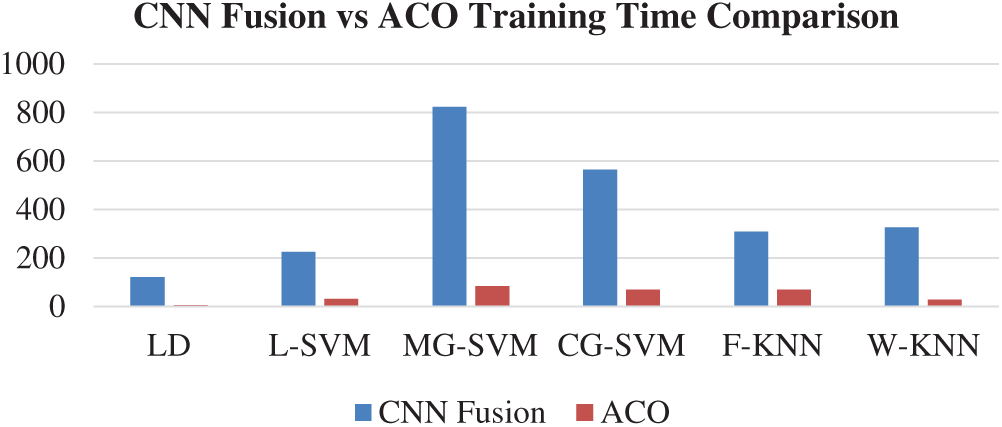
Figure 11: Time comparison of CNN fused features and ACO based selection
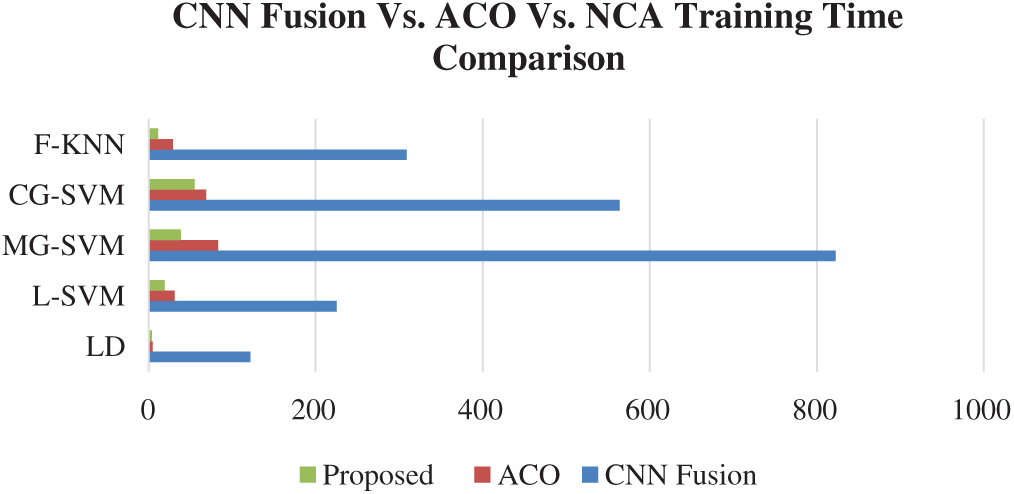
Figure 12: Time comparison of CNN fused features, ACO based selection, and proposed framework
A framework based on automated deep learning and best feature selection has been presented in this work for the recognition of fruit leaf diseases. Two deep learning pre-trained models were used and fine-tuned based on the number of classification layers. The features were extracted from both modified models and fused using a serial-based approach. An ACO was applied to select the best features in the first phase, which was later improved with an NCA reduction approach. The final selected features were classified using multiple classifiers and a linear discriminant for better accuracy. The proposed method proved to perform well compared to existing techniques. It can be concluded from the results that the augmentation process improved the recognition accuracy compared to the original dataset. The recognition accuracy was further improved by a fusion of deep learning features and this was increased by the proposed framework. The main strengths of the proposed framework are that it increases the recognition accuracy and consumes less computational time.
Funding Statement: This research work was partially supported by Chiang Mai University.
Conflicts of Interest: The authors declare that they have no conflicts of interest to report regarding the present study.
1. A. Adeel, M. Sharif, F. Azam, J. H. Shah, T. Umer et al., “Diagnosis and recognition of grape leaf diseases: An automated system based on a novel saliency approach and canonical correlation analysis based multiple features fusion,” Sustainable Computing: Informatics and Systems, vol. 24, pp. 100349, 2019. [Google Scholar]
2. V. Singh and A. K. Misra, “Detection of plant leaf diseases using image segmentation and soft computing techniques,” Information Processing in Agriculture, vol. 4, pp. 41–49, 2017. [Google Scholar]
3. V. Pooja, R. Das and V. Kanchana, “Identification of plant leaf diseases using image processing techniques,” in 2017 IEEE Technological Innovations in ICT for Agriculture and Rural Development, Chennai, India, pp. 130–133, 2017. [Google Scholar]
4. Z. Iqbal, M. F. Azam, M. I. U. Lali and M. Y. Javed, “Detection and classification of citrus diseases in agriculture based on optimized weighted segmentation and feature selection,” Computers and Electronics in Agriculture, vol. 150, pp. 220–234, 2018. [Google Scholar]
5. Z. Iqbal, J. H. Shah, M. H. ur Rehman and K. Javed, “An automated detection and classification of citrus plant diseases using image processing techniques: A review,” Computers and Electronics in Agriculture, vol. 153, pp. 12–32, 2018. [Google Scholar]
6. T. Akram, M. Sharif, M. Awais, K. Javed, H. Ali et al., “CCDF: Automatic system for segmentation and recognition of fruit crops diseases based on correlation coefficient and deep CNN features,” Computers and Electronics in Agriculture, vol. 155, pp. 220–236, 2018. [Google Scholar]
7. G. Geetharamani and A. Pandian, “Identification of plant leaf diseases using a nine-layer deep convolutional neural network,” Computers and Electrical Engineering, vol. 76, pp. 323–338, 2019. [Google Scholar]
8. I. Patel, S. Patel and A. Patel, “Analysis of various image preprocessing techniques for denoising of flower images,” International Journal of Computer Sciences and Engineering, vol. 6, pp. 1111–1117, 2018. [Google Scholar]
9. N. Dhanachandra and Y. J. Chanu, “A survey on image segmentation methods using clustering techniques,” European Journal of Engineering and Technology Research, vol. 2, pp. 15–20, 2017. [Google Scholar]
10. J. Ma, X. Jiang, A. Fan, J. Jiang and J. Yan, “Image matching from handcrafted to deep features: A survey,” International Journal of Computer Vision, vol. 129, pp. 23–79, 2021. [Google Scholar]
11. N. Muhammad, Rubab, N. Bibi, O. Y. Song and S. A. Khan, “Severity recognition of aloe vera diseases using AI in tensor flow domain,” Computers, Materials and Continua, vol. 66, pp. 2199–2216, 2021. [Google Scholar]
12. T. Akram, M. Sharif and T. Saba, “Fruits diseases classification: Exploiting a hierarchical framework for deep features fusion and selection,” Multimedia Tools and Applications, vol. 79, pp. 25763–25783, 2020. [Google Scholar]
13. M. Rashid, M. Alhaisoni, S. H. Wang, S. R. Naqvi, A. Rehman et al., “A sustainable deep learning framework for object recognition using multi-layers deep features fusion and selection,” Sustainability, vol. 12, pp. 5037, 2020. [Google Scholar]
14. S. Kadry, M. Alhaisoni, Y. Nam, Y. Zhang, V. Rajinikanth et al., “Computer-aided gastrointestinal diseases analysis from wireless capsule endoscopy: A framework of best features selection,” IEEE Access, vol. 8, pp. 132850–132859, 2020. [Google Scholar]
15. I. Ashraf, M. Alhaisoni, R. Damaševičius, R. Scherer, A. Rehman et al., “Multimodal brain tumor classification using deep learning and robust feature selection: A machine learning application for radiologists,” Diagnostics, vol. 10, pp. 565, 2020. [Google Scholar]
16. Y. Li, H. Wang, L. M. Dang, A. Sadeghi-Niaraki and H. Moon, “Crop pest recognition in natural scenes using convolutional neural networks,” Computers and Electronics in Agriculture, vol. 169, pp. 105174, 2020. [Google Scholar]
17. J. Zhu, A. Wu, X. Wang and H. Zhang, “Identification of grape diseases using image analysis and BP neural networks,” Multimedia Tools and Applications, vol. 79, pp. 14539–14551, 2020. [Google Scholar]
18. S. Sladojevic, M. Arsenovic, A. Anderla, D. Culibrk and D. Stefanovic, “Deep neural networks based recognition of plant diseases by leaf image classification,” Computational Intelligence and Neuroscience, vol. 2016, pp. 1–16, 2016. [Google Scholar]
19. M. Jhuria, A. Kumar and R. Borse, “Image processing for smart farming: Detection of disease and fruit grading,” in 2013 IEEE Second Int. Conf. on Image Information Processing, Chennai, India, pp. 521–526, 2013. [Google Scholar]
20. D. Pixia and W. Xiangdong, “Recognition of greenhouse cucumber disease based on image processing technology,” Open Journal of Applied Sciences, vol. 3, pp. 27, 2013. [Google Scholar]
21. B. J. Samajpati and S. D. Degadwala, “Hybrid approach for apple fruit diseases detection and classification using random forest classifier,” in 2016 Int. Conf. on Communication and Signal Processing, Mumbai, India, pp. 1015–1019, 2016. [Google Scholar]
22. Z. L. He, J. T. Xiong, R. Lin, X. Zou, Z. G. Yang et al., “A method of green litchi recognition in natural environment based on improved LDA classifier,” Computers and Electronics in Agriculture, vol. 140, pp. 159–167, 2017. [Google Scholar]
23. J. G. A. Barbedo, “Impact of dataset size and variety on the effectiveness of deep learning and transfer learning for plant disease classification,” Computers and Electronics in Agriculture, vol. 153, pp. 46–53, 2018. [Google Scholar]
24. A. Rehman, T. Saba, Z. Mehmood, U. Tariq and N. Ayesha, “Microscopic brain tumor detection and classification using 3D CNN and feature selection architecture,” Microscopy Research and Technique, vol. 84, pp. 133–149, 2021. [Google Scholar]
25. N. Hussain, A. Majid, M. Alhaisoni, S. A. C. Bukhari, S. Kadry et al., “Classification of positive COVID-19 CT scans using deep learning,” Computers, Materials and Continua, vol. 66, pp. 2923–2938, 2021. [Google Scholar]
26. A. Khan, A. Sohail, U. Zahoora and A. S. Qureshi, “A survey of the recent architectures of deep convolutional neural networks,” Artificial Intelligence Review, vol. 53, pp. 5455–5516, 2020. [Google Scholar]
27. S. K. Addagarla, G. K. Chakravarthi and P. Anitha, “Real time multi-scale facial mask detection and classification using deep transfer learning techniques,” International Journal, vol. 9, pp. 1–21, 2020. [Google Scholar]
28. X. He, K. Zhao and X. Chu, “AutoML: A survey of the state-of-the-art,” Knowledge-Based Systems, vol. 212, pp. 106622, 2021. [Google Scholar]
29. B. Zoph, V. Vasudevan, J. Shlens and Q. V. Le, “Learning transferable architectures for scalable image recognition,” in Proc. of the IEEE Conf. on Computer Vision and Pattern Recognition, NY, USA, pp. 8697–8710, 2018. [Google Scholar]
30. T. Li, W. Bo, C. Hu, H. Kang, K. Wang et al., “Applications of deep learning in fundus images: A review,” Medical Image Analysis, vol. 1, pp. 101971, 2021. [Google Scholar]
31. S. A. Khan, O. Y. Song and M. Nazir, “Medical imaging fusion techniques: A survey benchmark analysis, open challenges and recommendations,” Journal of Medical Imaging and Health Informatics, vol. 10, pp. 2523–2531, 2020. [Google Scholar]
32. S. Kadry, Y. D. Zhang, T. Akram, M. Sharif, A. Rehman et al., “Prediction of COVID-19-pneumonia based on selected deep features and one class kernel extreme learning machine,” Computers and Electrical Engineering, vol. 90, pp. 106960, 2021. [Google Scholar]
33. I. M. Nasir, M. Yasmin, J. H. Shah, M. Gabryel, R. Scherer et al., “Pearson correlation-based feature selection for document classification using balanced training,” Sensors, vol. 20, pp. 6793, 2020. [Google Scholar]
34. M. U. Khan, S. Aziz, T. Akram, F. Amjad, K. Iqtidar et al., “Expert hypertension detection system featuring pulse plethysmograph signals and hybrid feature selection and reduction scheme,” Sensors, vol. 21, pp. 247, 2021. [Google Scholar]
35. A. Majid, M. Yasmin, A. Rehman, A. Yousafzai and U. Tariq, “Classification of stomach infections: A paradigm of convolutional neural network along with classical features fusion and selection,” Microscopy Research and Technique, vol. 83, pp. 562–576, 2020. [Google Scholar]
36. M. A. Khan, F. Ahmed, M. Mittal, L. M. Goyal, D. J. Hemanth et al., “Gastrointestinal diseases segmentation and classification based on duo-deep architectures,” Pattern Recognition Letters, vol. 131, pp. 193–204, 2020. [Google Scholar]
37. M. Dorigo, M. Birattari and T. Stutzle, “Ant colony optimization,” IEEE Computational Intelligence Magazine, vol. 1, pp. 28–39, 2006. [Google Scholar]
38. E. W. Teh, T. DeVries and G. W. Taylor, “Proxynca++: Revisiting and revitalizing proxy neighborhood component analysis,” in European Conf. on Computer Vision, Leicester, UK, pp. 1–6, 2020. [Google Scholar]
39. F. Saeed, M. Mittal, L. M. Goyal and S. Roy, “Deep neural network features fusion and selection based on PLS regression with an application for crops diseases classification,” Applied Soft Computing, vol. 103, pp. 107164, 2021. [Google Scholar]
40. Z. u. Rehman, F. Ahmed, R. Damaševičius, S. R. Naqvi, W. Nisar et al., “Recognizing apple leaf diseases using a novel parallel real-time processing framework based on MASK RCNN and transfer learning: An application for smart agriculture,” IET Image Processing, vol. 1, pp. 1–23, 2021. [Google Scholar]
41. M. B. Tahir, K. Javed, S. Kadry, Y. D. Zhang, T. Akram et al., “Recognition of apple leaf diseases using deep learning and variances-controlled features reduction,” Microprocessors and Microsystems, vol. 3, pp. 104027, 2021. [Google Scholar]
42. I. M. Nasir, A. Bibi, J. H. Shah, M. Sharif, K. Iqbal et al., “Deep learning-based classification of fruit diseases: An application for precision agriculture,” Computers, Materials and Continua, vol. 66, pp. 1949–1962, 2021. [Google Scholar]
 | This work is licensed under a Creative Commons Attribution 4.0 International License, which permits unrestricted use, distribution, and reproduction in any medium, provided the original work is properly cited. |