DOI:10.32604/cmc.2021.020027
| Computers, Materials & Continua DOI:10.32604/cmc.2021.020027 | |
| Article |
Data Traffic Reduction with Compressed Sensing in an AIoT System
1Hanshin University, Osan-si, 18101, Korea
2Hancom with Inc., Seongnam-si, 13493, Korea
*Corresponding Author: Jeongwook Seo. Email: jwseo@hs.ac.kr
Received: 06 May 2021; Accepted: 07 June 2021
Abstract: To provide Artificial Intelligence (AI) services such as object detection, Internet of Things (IoT) sensor devices should be able to send a large amount of data such as images and videos. However, this inevitably causes IoT networks to be severely overloaded. In this paper, therefore, we propose a novel oneM2M-compliant Artificial Intelligence of Things (AIoT) system for reducing overall data traffic and offering object detection. It consists of some IoT sensor devices with random sampling functions controlled by a compressed sensing (CS) rate, an IoT edge gateway with CS recovery and domain transform functions related to compressed sensing, and a YOLOv5 deep learning function for object detection, and an IoT server. By analyzing the effects of compressed sensing on data traffic reduction in terms of data rate per IoT sensor device, we showed that the proposed AIoT system can reduce the overall data traffic by changing compressed sensing rates of random sampling functions in IoT sensor devices. In addition, we analyzed the effects of the compressed sensing on YOLOv5 object detection in terms of performance metrics such as recall, precision, mAP50, and mAP, and found that recall slightly decreases but precision remains almost constant even though the compressed sensing rate decreases and that mAP50 and mAP are gradually degraded according to the decreased compressed sensing rate. Consequently, if proper compressed sensing rates are chosen, the proposed AIoT system will reduce the overall data traffic without significant performance degradation of YOLOv5.
Keywords: 5G; Internet of Things; data traffic; compressed sensing; YOLOv5
Internet of Things (IoT) is a dynamic global network infrastructure with self-configuration capabilities based on standards and interoperable communication protocols, in which the physical and virtual things have their own identities and properties and are integrated into IoT networks through various wired and wireless interfaces [1]. The IoT networks mean interconnected world-wide networks based on sensory, communication, networking, and information processing technologies. Modern wireless technologies have extended the sensory capabilities of IoT devices and expanded the range of the IoT network significantly. Recently, some emerging technologies such as artificial intelligence (AI), edge computing, and compressed sensing are being applied to IoT to meet the needs of users and provide specific services [2,3]. Artificial Intelligence of Things (AIoT) is a new technology enabling the IoT sensor devices to analyze their sensing data, make decisions and act on the decisions without human involvement [2]. To incorporate compressed sensing (CS), often called compressive sensing, in IoT applications, some pieces of literature were reviewed in [4].
The IoT networks includes wireless local area networks (WLANs) and low power wide area networks (LPWANs). Wireless fidelity (WiFi) is one of WLANs following the IEEE 802.11 standards and it is one of widespread access networks for providing wireless connectivity to IoT devices [5]. It has infrastructure and ad-hoc modes provided by all versions of the WiFi standard family. IEEE 802.11n and 802.11ac can offer a maximum data rate of 600 Mbps and 7 Gbps, respectively. Next, Long-term evolution machine (LTE-M) and narrowband IoT (NB-IoT) as LPWANs have been presented since 3GPP Release 12 and Release 13 to support massive machine-type communications (mMTC) [6]. The requirements for mMTC are almost identical to those for LTE-M and NB-IoT [7]. A low-complexity User Equipment (UE) Category M1 as LTE-M in Release 13 was presented to enable low-cost devices, extended discontinuous reception cycles for reduced power consumption, and coverage enhancement mode operation. NB-IoT was also introduced to offer the flexibility of deployment by allowing the user of a small portion of the available spectrum in the LTE bands and coexisting with LTE and global system for mobile communication (GSM) in licensed frequency bands. Note that LTE-M supports the peak data rate of 1 Mbps for both downlink and uplink, and NB-IoT supports the data rate of 200 kbps for downlink and 20 kbps for uplink [8]. The IoT edge gateway plays an important role in heterogeneous IoT networks [9], whose main function is to forward the data from IoT sensor devices to a destination node, namely an IoT server through existing wireless communication protocols such as WiFi, LTE-M, NB-IoT, ZigBee, Bluetooth, etc. In recent years, IoT sensor devices have been forced to send a large amount of data such as images, videos, and voices for providing AI services such as object detection using deep learning in IoT applications [10]. Inevitably, IoT networks are facing severe data traffic overload problems. For Instance, it may cause time delay or latency due to limited bandwidth and unstable channel conditions (e.g., congestion, collisions, and interference) and leads to delayed decision-making for time-sensitive operations. Moreover, the centralized IoT server becomes inefficient and expensive for storing and processing a large amount of data from various types of IoT sensor devices. Jung et al. [3] proposed an oneM2M-compliant AIoT monitoring system where an AIoT edge device extracted video frame images from a CCTV camera in a pig house, detected multiple pigs in the images by a faster region-based convolutional neural network model, and tracked them by an object center-point tracking algorithm. However, they did not consider the data traffic problem. Although Djelouat et al. [4] reviewed CS-based IoT applications and highlighted emerging trends and identified avenues for future CS-based IoT research, they did not present any CS-based IoT system model and its experimental results. In [11], the authors proposed a gradient CS method for image data reduction in unmanned aerial vehicles (UAVs) where a surveillance center reconstructed decreased amount of image pixels received from the UAVs and then performed an image processing method for suspicious objects detection. However, they did not consider an AIoT system model using object detection based on deep learning. Moreover, they did not analyze the effects of compressed sensing rate on an AIoT system model in detail.
Therefore, in this paper, we propose an AIoT system model using compressed sensing to solve the data traffic problem that occurs when transmitting a large amount of data through the IoT network for an AI service such as YOLOv5 object detection. Our main contributions are as follows: First, we suggest a practical AIoT system architecture for data traffic reduction between IoT sensor devices and an IoT edge gateway through separating a random sampling matrix, a CS recovery, and a transformation matrix of compressed sensing. Second, we analyze the effects of compressed sensing on various aspects of the proposed AIoT system such as data traffic reduction and object detection performance to provide a performance reference. The rest of this paper is organized as follows. Section 2 introduces the configuration and operation of the proposed AIoT system and explains functional separation of compressed sensing for data traffic reduction and YOLOv5 object detection. Section 3 analyzes some experimental results to show the effects of the compressed sensing on YOLOv5 object detection. Finally, concluding remarks are presented in Section 4.
2 Data Traffic Reduction in an AIoT System
2.1 Proposed AIoT System Model
The proposed AIoT system model is illustrated in Fig. 1 where there are some IoT sensor devices with random sampling functions for compressed sensing, an IoT edge gateway with CS recovery and domain transform functions for compressed sensing and a YOLOv5 deep learning function for object detection, and an IoT server. The IoT sensor device extracts a large data, e.g., an
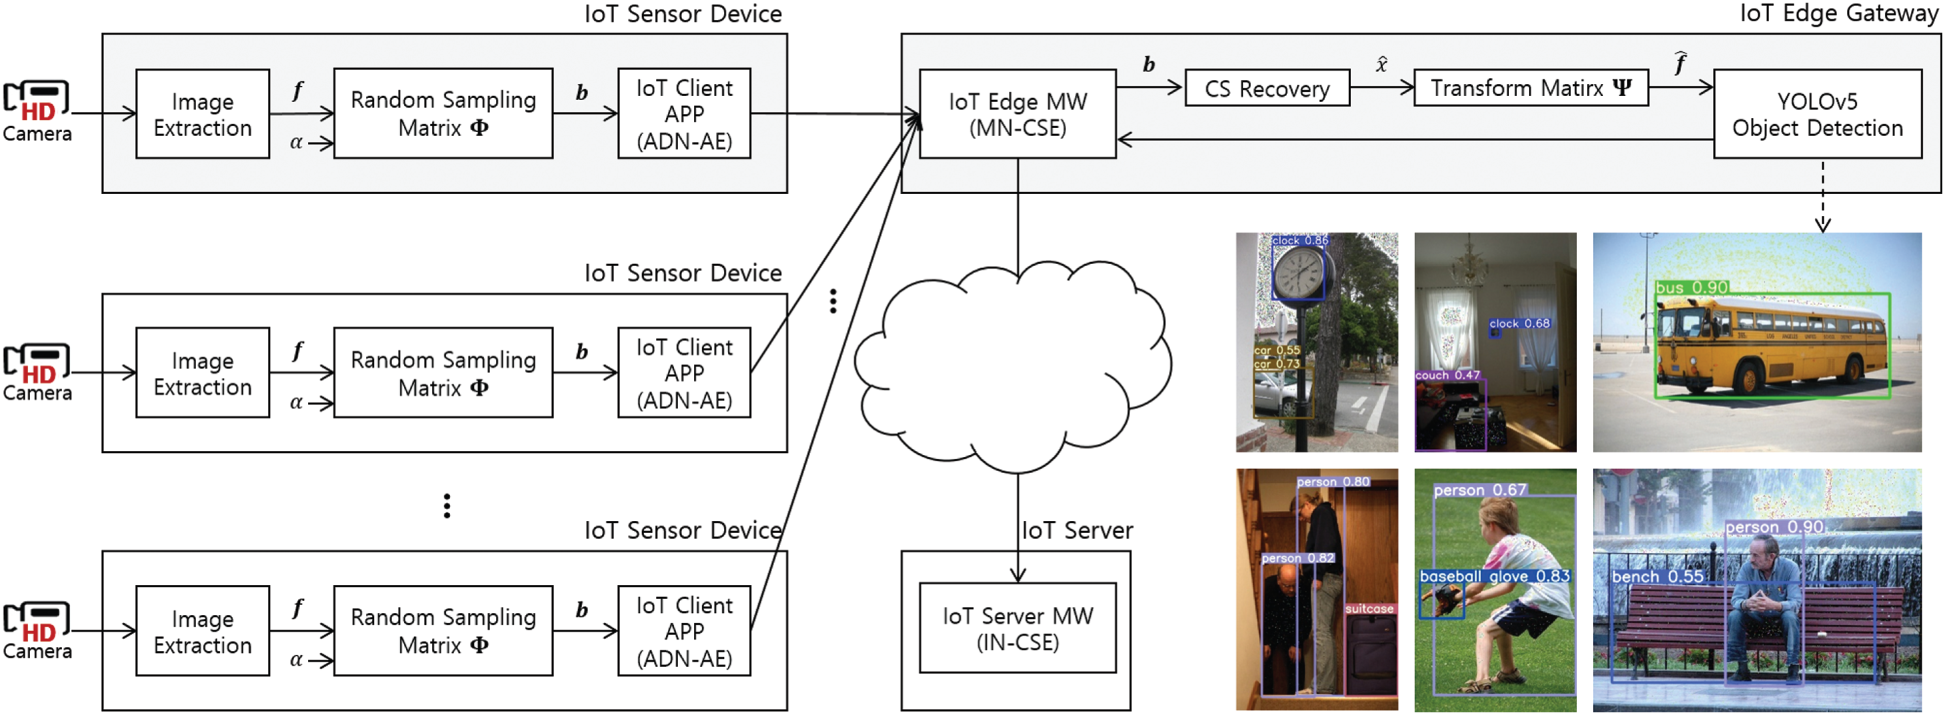
Figure 1: Proposed AIoT system model with IoT sensor devices, an IoT edge gateway, and an IoT server
In the IoT edge gateway, the IoT edge MW modeled as a middle node-common service entity (MN-CSE) in [13] temporarily stores the compressed image
2.2 Compressed Sensing for Data Traffic Reduction
Compressed sensing is known as a signal sampling framework for improving sampling efficiency by sampling sparse signals at a rate much lower than the Nyquist rate [15,16]. It accurately recovers the original high-dimensional sparse signal from low-dimensional measurement vectors with high probability by solving an optimization problem with a scarcity attribute. For random sampling in compressed sensing, single pixel, Gaussian, Bernoulli, and sparse random matrices are usually used and among them we choose a random single pixel matrix [17]. In addition, there are a lot of optimization methods for CS recovery such as
As mentioned before, each IoT sensor device performs the compressed sensing that can be given as
where
The IoT edge gateway performs the CS recovery in order to find the optimal sparse transform domain representation
where
where the entries of
where
In Fig. 2, we explain the effects of compressed sensing on data traffic reduction in terms of data rate per IoT sensor device and number of IoT sensor devices through simple analytical results.
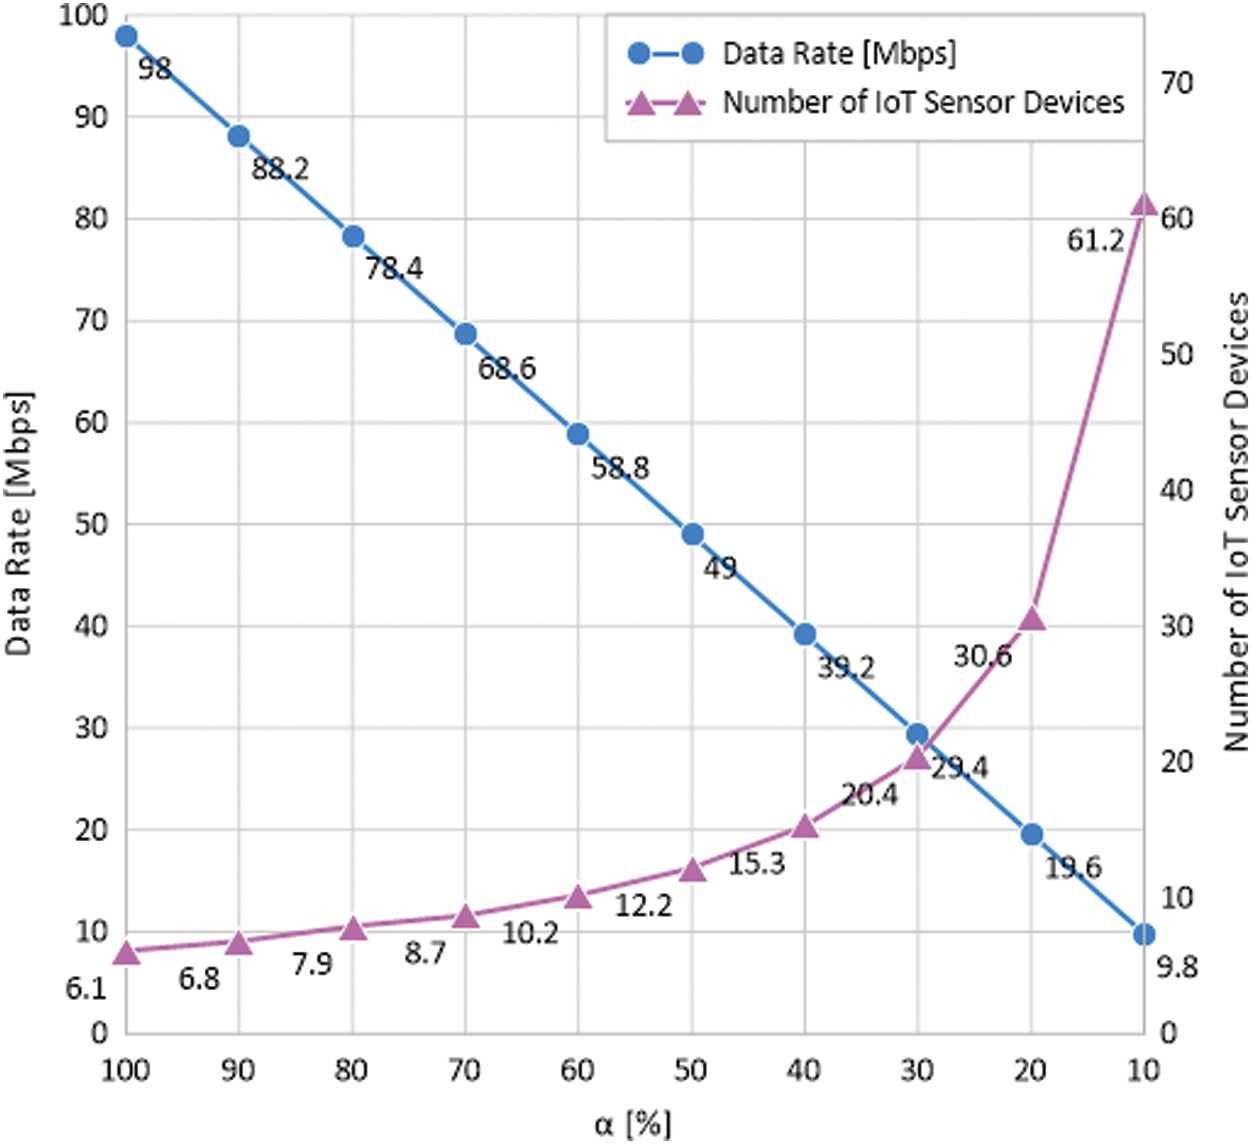
Figure 2: Effects of compressed sensing on data traffic reduction in terms of data rate per IoT sensor device and number of IoT sensor devices according to compressed sensing rate
We assume that an IoT network between IoT sensor devices and an IoT edge gateway is IEEE 802.11n WLAN whose maximum data rate is 600 megabits per second (Mbps). If the size of the original image or frame is
2.3 Object Detection with YOLOv5
We consider the YOLOv5 model, the latest release of the YOLO series for object detection in the IoT edge gateway. Because the YOLO series integrated target area prediction and category determination into a single neural network model [19–21], it can solve a speed problem critical to implementation of the IoT edge gateway. Especially, the execution speed of YOLOv5 has been greatly improved even compared with YOLOv4. Also, YOLOv5 is about 88% smaller than YOLOv4. Thus, it is suitable to be installed on the IoT edge gateway and it has higher accuracy and better ability to detect small objects.
In Fig. 3, YOLOv5 uses a backbone architecture, referred to CSPDarknet, for feature extraction by incorporating cross stage partial network (CSPNet) into Darknet. The CSPNet partitions a feature map of the base layer into two parts and then merging them through a cross-stage hierarchy to make the gradient flow propagate through different network paths. By integrating the gradient changes into the feature map, it decreases model parameters and floating point operations per second, thereby reducing model size as well as ensuring inference speed and accuracy [22]. Next, YOLOv5 exploits path aggregation network (PANet) for feature fusion, which adopts a feature pyramid network (FPN) structure with enhanced bottom-up path to improve the propagation of low-level features. Simultaneously, the PANet performs adaptive feature pooling which links feature grid and all feature levels for making useful information in each feature level propagate directly to the following subnetwork. This can improve the location accuracy of the object. Finally, the YOLO layer is used for producing detection results such as class, score, location, and size. It generates three feature maps with
For training the YOLOv5 network, a binary cross-entropy with logits loss, which combines a sigmoid function and a binary cross-entropy loss in one single class [23], is utilized as the loss function given by
where N is the batch size,
The stochastic gradient descent (SGD) optimizer is considered for minimizing the loss function. It repeats the process of obtaining the gradient and updating the model parameters for each training sample rather than obtaining an accurate gradient using the entire training data [24–26]. YOLOv5 has four different versions with a small (s), a medium (m), a large (l), and an extra-large (x) model. YOLOv5s has the lowest performance but the highest frame rate, whereas YOLOv5x has the best performance but the lowest frame rate. We will use the YOLOv5x model with the best performance.
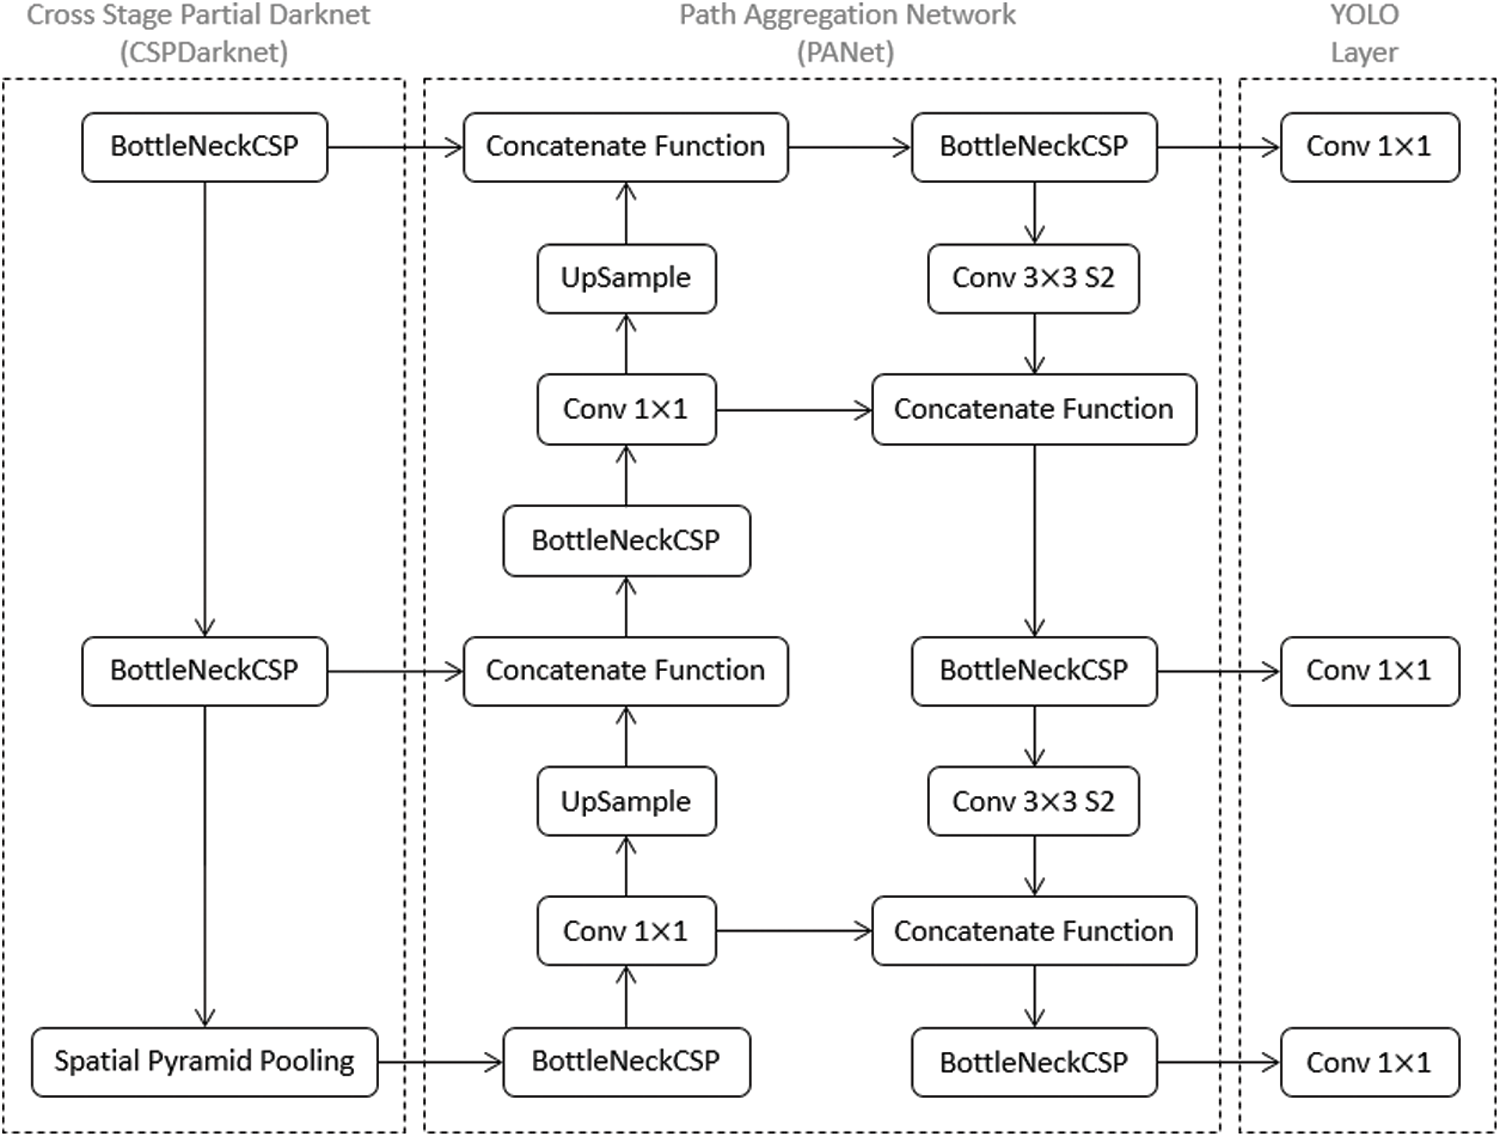
Figure 3: YOLOv5 network architecture with CSPDarknet, PANet, and YOLO Layer [22]
We describe experimental results to evaluate the performance of the proposed AIoT system model in terms of the effects of the compressed sensing on object detection. First, we developed each IoT sensor device with a Raspberry Pi 4 Model B, where the random sampling function and IoT client application were implemented based on [14,27], respectively. Instead of real-time images from a C270 HD webcam attached on the Raspberry Pi 4, 128 images of the COCO dataset were fed into the IoT sensor device for objective performance evaluation. Next, we conducted the IoT edge gateway on a personal computer with an NVIDIA GeForce GTX 960, CUDA 10.2, cuDNN 7.6.5, in which the IoT edge middleware, CS recovery and YOLOv5x were implemented based on [14,27,28], respectively. Especially, Pytorch 1.6.0 running on Ubuntu 18.04.4 was employed as an open source machine learning framework for YOLOv5x. Finally, the IoT server was implemented but not used since it was not necessary for performance evaluation.
Fig. 4 shows the detection results of YOLOv5 model for an original image
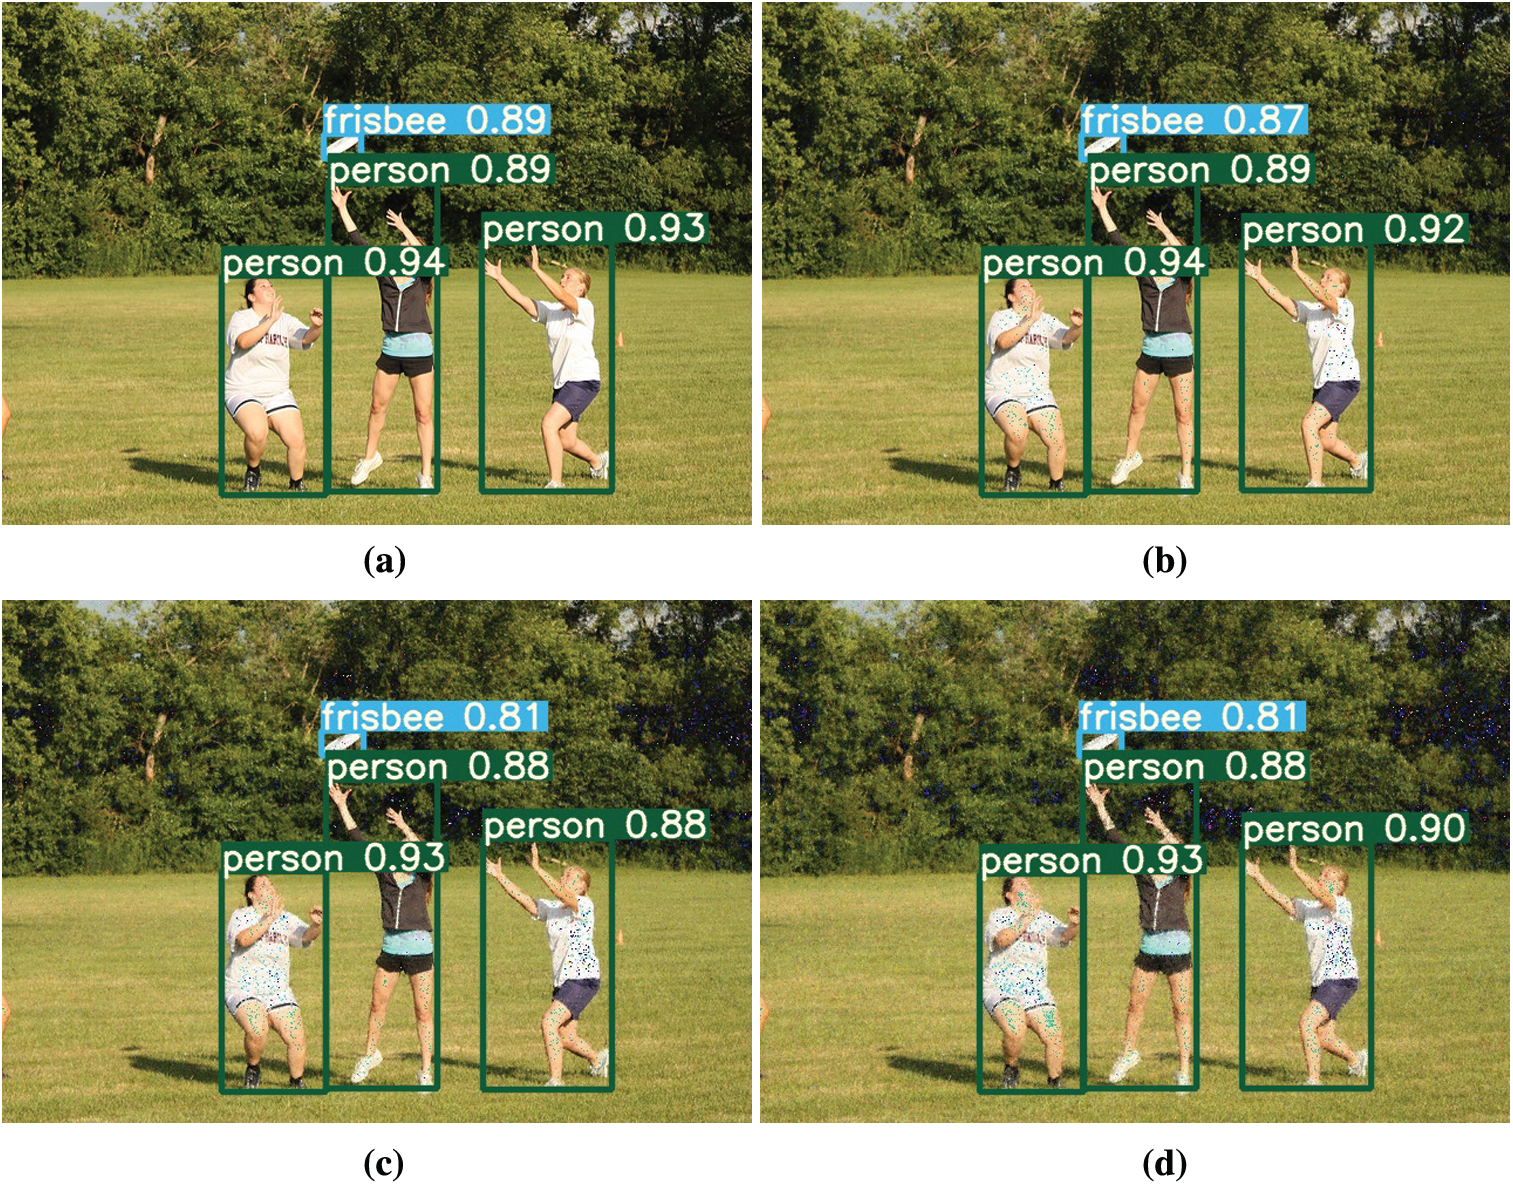
Figure 4: Detection results of YOLOv5 model: (a) original image, (b) compressed sensing rate of 90%, (c) compressed sensing rate of 70% and (d) compressed sensing rate of 50%
We compare recall and precision performances according to compressed sensing rates in Fig. 5. Recall and precision is generally defined as [29]
where
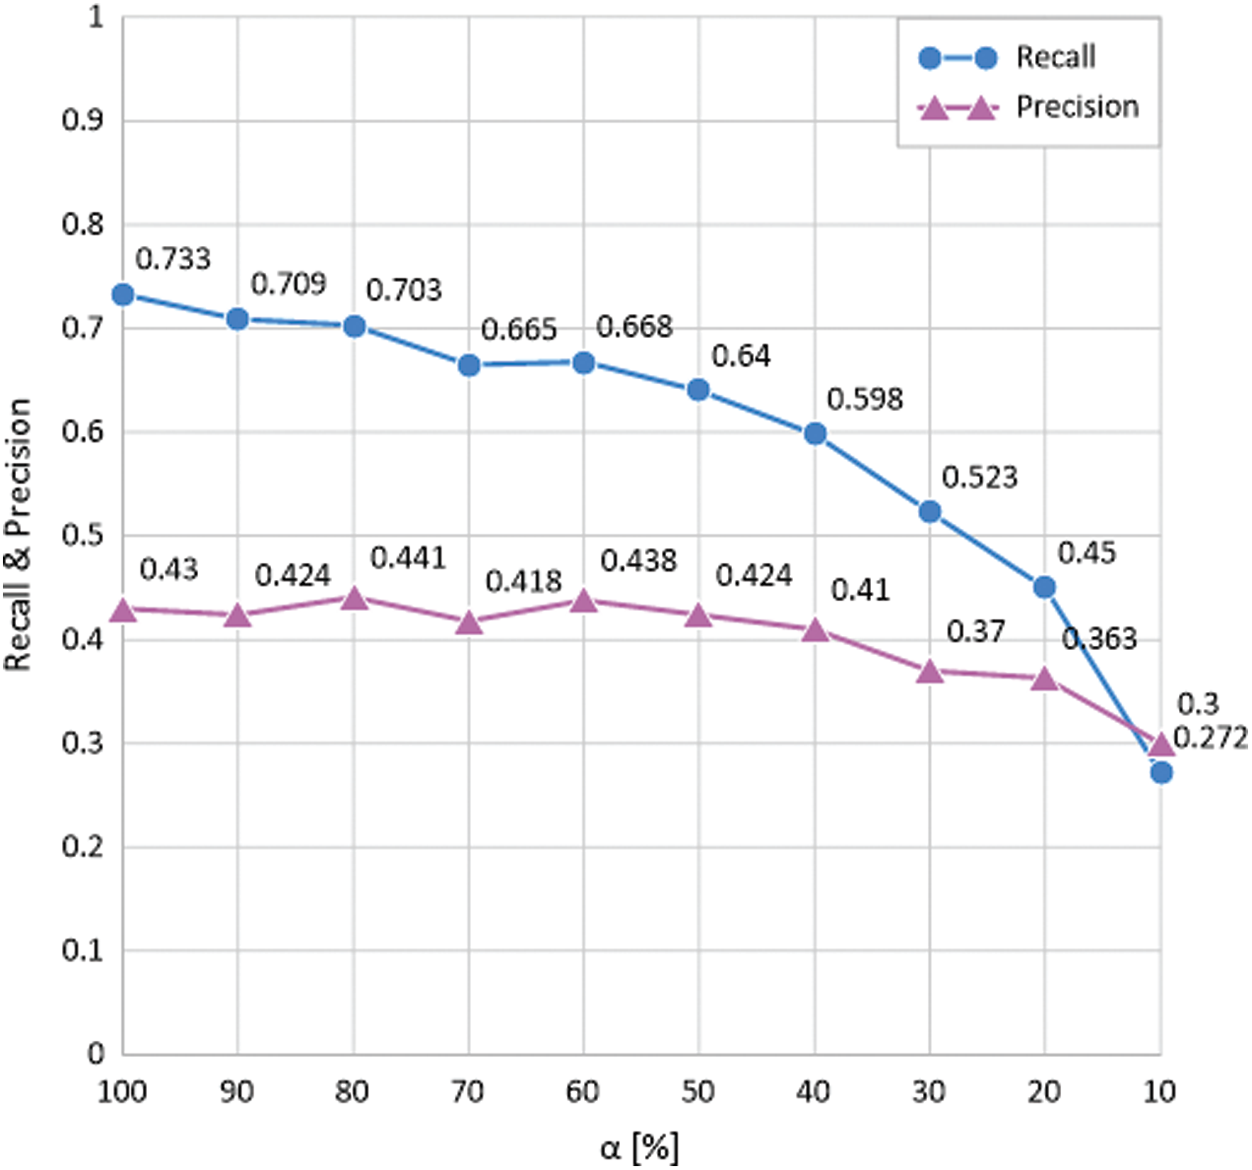
Figure 5: Recall and precision performances according to compressed sensing rate
We compare mean average precision 50 (mAP50) and mAP performances according to compressed sensing rates in Fig. 6. As a performance metric in measuring the accuracy of object detection models, AP is the precision averages across all recall values between 0 and 1 at various Intersection over Union (IoU) thresholds and is interpreted as the area under the curve of the precision-recall curve. mAP corresponds to the AP averaged over all classes for IoU ratio values ranging from 0.5 to 0.95 with a step size of 0.05, and mAP50 denotes mAP at IoU = 0.5 [30]. Note that the IoU is a ratio of the intersecting area of the predicted bounding box and the ground-truth bounding box to the total area of them combined. In general, if the IoU value is more than 0.5, it is judged as being detected properly. Otherwise, it is judged as being incorrect. At the compressed sensing rate
By analyzing experimental results in Figs. 2 and 6 together, we can draw a meaningful conclusion. When compressed sensing rate
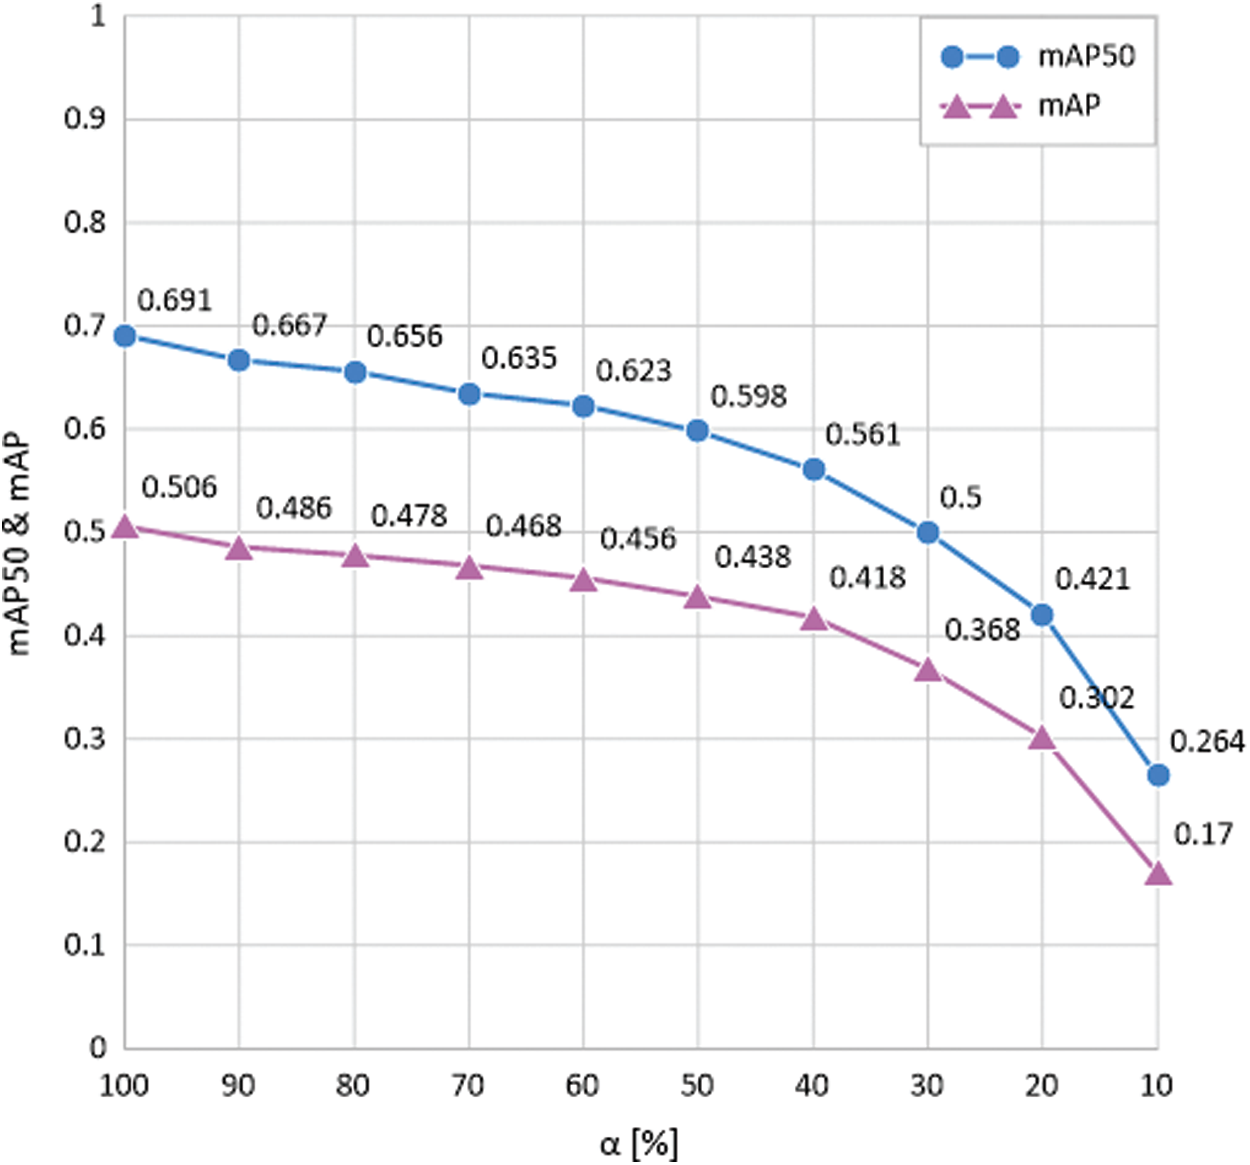
Figure 6: mAP50 and mAP performances according to compressed sensing rate
In this paper, we proposed an oneM2M-compliant AIoT system in which there are some IoT sensor devices with random sampling functions for compressed sensing, an IoT edge gateway with CS recovery and domain transform functions for compressed sensing, and a YOLOv5 deep learning function for object detection, and an IoT server. This AIoT system was able to reduce its overall data traffic or add more IoT sensor devices by changing compressed sensing rates of random sampling functions in IoT sensor devices. To analyze the effects of the compressed sensing on YOLOv5 object detection in the IoT edge gateway, recall and precision performances were first investigated, and we found that recall slightly decreases but precision remains almost constant even though the compressed sensing rate decreases. Furthermore, after analyzing mAP50 and mAP performances, we found that mAP50 and mAP are gradually degraded as the compressed sensing rate decreases. Therefore, if proper compressed sensing rates of IoT sensor devices are chosen, the proposed AIoT system will reduce the overall data traffic or increase the number of IoT sensor devices without significant performance degradation of YOLOv5.
Funding Statement: This work was supported by Institute for Information & communications Technology Planning & Evaluation (IITP) grant funded by the Korea government (MSIT) (No. 2020-0-00959, Fast Intelligence Analysis HW/SW Engine Exploiting IoT Platform for Boosting On-device AI in 5G Environment).
Conflicts of Interest: The authors declare that they have no conflicts of interest to report regarding the present study.
1. L. Atzori, A. Lera and G. Morabito, “The internet of things: A survey,” Computer Networks, vol. 54, no. 15, pp. 2787–2805, 2010. [Google Scholar]
2. J. Varghese, S. K. Vargheese and E. Peter, “A study on artificial intelligence of things: Techniques and applications,” A Journal of Composition Theory, vol. 13, no. 3, pp. 888–896, 2020. [Google Scholar]
3. W. Jung, S. Kim, S. Hong and J. Seo, “An AIoT monitoring system for multi-object tracking and alerting,” Computers, Materials & Continua, vol. 67, no. 1, pp. 337–348, 2021. [Google Scholar]
4. H. Djelouat, A. Amira and F. Bensaali, “Compressive sensing-based IoT applications: A review,” Journal of Sensor and Actuator Networks, vol. 7, no. 4, pp. 2224–2708, 2018. [Google Scholar]
5. A. Guillen-Perz, R. Sanchez-Iborra, M. Cano, J. C. Sanchez-Aarnoutse and J. Garcia-Haro, “Wifi networks on drones,” in 2016 ITU Kaleidoscope: ICTs for a Sustainable World (ITU WT), pp. 1–8, 2016. [Online]. Available: https://ieeexplore.ieee.org/document/7805730. [Google Scholar]
6. A. Hoglund, G. A. Medina-Acosta, S. N. K. Veedu, O. Liberg, T. Tirronen et al., “3GPP Release-16 preconfigured uplink resources for LTE-m and NB-ioT,” IEEE Communications Standards Magazine, vol. 4, no. 2, pp. 50–56, 2020. [Google Scholar]
7. R. Ratasuk, D. Zhou and R. Sinha, “LTE-M coexistence within 5G new radio carrier,” in 2020 IEEE 3rd 5G World Forum, Bangalore, India, pp. 224–228, 2020. [Google Scholar]
8. B. S. Chaudhari, M. Zennaro and S. Borkar, “LPWAN technologies: Emerging application characteristics, requirements, and design considerations,” Future Internet, vol. 12, no. 3, pp. 1–25, 2020. [Google Scholar]
9. S. K. Lee, M. Bae and H. Kim, “Future of IoT networks: A survey,” Applied Sciences, vol. 7, no. 10, pp. 2076–3417, 2017. [Google Scholar]
10. J. Kang and D. Eom, “Offloading and transmission strategies for IoT edge devices and networks,” Sensors, vol. 19, no. 4, pp. 1424–8220, 2019. [Google Scholar]
11. J. Music, I. Orovic, T. Marasovic, V. Papic and S. Stankovic, “Gradient compressive sensing for image data reduction in UAV based search and rescue in the wild,” Mathematical Problems in Engineering, vol. 2016, pp. 1–14, 2016. [Google Scholar]
12. I. Y. Ahn, N. M. Sung, J. H. Lim, J. W. Seo and I. D. Yun, “Development of an onem2m-compliant IoT platform for wearable data collection,” KSII Transactions on Internet and Information System, vol. 13, no. 1, pp. 1–15, 2019. [Google Scholar]
13. oneM2M, Release 2 TS-0004 v2.27.0, Service Layer Core Protocol Specification, 2020. [Google Scholar]
14. OCEAN, Mobius Release 2 v2.0.0, Installation Guide. 2018. [Google Scholar]
15. C. Lu, W. Chen and H. Xu, “Deterministic bipolar compressed sensing matrices from binary sequence family,” KSII Transactions on Internet and Information Systems, vol. 14, no. 6, pp. 2497–2517, 2020. [Google Scholar]
16. C. Lu, W. Chen and H. Xu, “Binary sequence family for chaotic compressed sensing,” KSII Transactions on Internet and Information Systems, vol. 13, no. 9, pp. 4645–4664, 2019. [Google Scholar]
17. S. L. Brunton and J. N. Kutz, Data-driven Science and Engineering: Machine Learning, Dynamical System, and Control. Cambridge: Cambridge University Press, 2019. [Google Scholar]
18. K. Hayashi, M. Nagahara and T. Tanaka, “A user's guide to compressed sensing for communications systems,” IEICE Transactions on Communications, vol. E96-B, no. 3, pp. 685–712, 2013. [Google Scholar]
19. R. Rijayanti, R. F. Muhammad and M. Hwang, “Vehicle waiting time information service using vehicle object detection at fuel charging station,” Journal of Information and Communication Convergence Engineering, vol. 18, no. 3, pp. 147–154, 2020. [Google Scholar]
20. D. G. Choe and D. K. Kim, “Deep learning-based image data processing and archival system for object detection of endangered species,” Journal of Information and Communication Convergence Engineering, vol. 18, no. 4, pp. 267–277, 2020. [Google Scholar]
21. Y. Liu, B. H. Lu, J. Peng and Z. Zhang, “Research on the use of YOLOv5 object detection algorithm in mask wearing recognition,” World Scientific Research Journal, vol. 6, no. 11, pp. 276–284, 2020. [Google Scholar]
22. R. Xu, H. Lin, K. Lu, L. Cao and Y. Liu, “A forest fire detection system based on ensemble learning,” Forests, vol. 12, no. 2, pp. 1999–4907, 2021. [Google Scholar]
23. I. Melekhov, A. Tiulpin, T. Sattler, M. Pollefeys, E. Rahtu et al., “DGC-Net: dense geometric correspondence network,” in 2019 IEEE Winter Conf. on Applications of Computer Vision, Waikoloa, HI, USA, pp. 1034–1042, 2019. [Google Scholar]
24. L. Bottou, “Large-scale machine learning with stochastic gradient,” in Proc. of COMPSTAT’2010, Paris, France, pp. 177–186, 2010. [Google Scholar]
25. N. Ketkar, “Stochastic gradient descent,” in Deep Learning with Python, Berkeley, CA: Apress, pp. 113–132, 2017. [Google Scholar]
26. J. Yang and G. Yang, “Modified convolutional neural network based on dropout and the stochastic gradient descent optimizer,” Algorithms, vol. 11, no. 3, pp. 1999–4893, 2018. [Google Scholar]
27. Robert Taylor, “Compressed sensing in python,” 2016. [Online]. Available: http://www.pyrunner.com/weblog/2016/05/26/compressed-sensing-python/ (Accessed 20 July 2016). [Google Scholar]
28. G. Jocher. YOLOv5. 2020. [Online]. Available: https://github.com/ultralytics/yolov5. [Google Scholar]
29. Y. J. Huang, R. Powers and G. T. Montelione, “Protein NMR recall, precision, and f-measure scores (RPF scoresStructure quality assessment measures based on information retrieval statistics,” Journal of the American Chemical Society, vol. 127, no. 6, pp. 1665–1674, 2005. [Google Scholar]
30. D. Zhou, J. Fang, X. Song, C. Guan, J. Yin et al., “Iou loss for 2D/3D object detection,” in 2019 Int. Conf. on 3D Vision, Quebec City, QC, Canada, pp. 85–94, 2019. [Google Scholar]
 | This work is licensed under a Creative Commons Attribution 4.0 International License, which permits unrestricted use, distribution, and reproduction in any medium, provided the original work is properly cited. |