DOI:10.32604/cmc.2022.019990
| Computers, Materials & Continua DOI:10.32604/cmc.2022.019990 | |
| Article |
Handling Class Imbalance in Online Transaction Fraud Detection
1School of Computer Science and Engineering, Lovely Professional University, Punjab, India
2Department of Computing and Mathematics, Manchester Metropolitan University, UK & School of Electrical Engineering and Computer Science, National University of Science and Technology, Islamabad, Pakistan
3Department of Computer Science and Engineering, Soonchunhyang University, Asan, 31538, Korea
4Department of Electrical and Computer Engineering, Dhofar University, Salalah, Oman
5College of Computer Engineering and Sciences, Prince Sattam bin Abdulaziz University, Al-Kharj, 11942, Saudi Arabia
*Corresponding Author: Yunyoung Nam. Email: ynam@sch.ac.kr
Received: 03 May 2021; Accepted: 04 June 2021
Abstract: With the rise of internet facilities, a greater number of people have started doing online transactions at an exponential rate in recent years as the online transaction system has eliminated the need of going to the bank physically for every transaction. However, the fraud cases have also increased causing the loss of money to the consumers. Hence, an effective fraud detection system is the need of the hour which can detect fraudulent transactions automatically in real-time. Generally, the genuine transactions are large in number than the fraudulent transactions which leads to the class imbalance problem. In this research work, an online transaction fraud detection system using deep learning has been proposed which can handle class imbalance problem by applying algorithm-level methods which modify the learning of the model to focus more on the minority class i.e., fraud transactions. A novel loss function named Weighted Hard- Reduced Focal Loss (WH-RFL) has been proposed which has achieved maximum fraud detection rate i.e., True Positive Rate (TPR) at the cost of misclassification of few genuine transactions as high TPR is preferred over a high True Negative Rate (TNR) in fraud detection system and same has been demonstrated using three publicly available imbalanced transactional datasets. Also, Thresholding has been applied to optimize the decision threshold using cross-validation to detect maximum number of frauds and it has been demonstrated by the experimental results that the selection of the right thresholding method with deep learning yields better results.
Keywords: Class imbalance; deep learning; fraud detection; loss function; thresholding
Two types of transactions are generally performed either they are genuine transactions performed by the actual users or fraud transactions performed by the fraudsters. To verify that a transaction is performed by the actual user, it is matched with the history of transactions performed by the user. If it is not matched, then it may be categorized as a fraud. Genuine transactions occur largely in number as compared to fraudulent transactions. Thus, a fraud detection system should be able to detect the frauds in imbalanced data of transactions occurring in real-time. Rule-based systems are used to detect fraudulent transactions in which rules are based on the existing experience to detect only the occurred fraudulent patterns and existing fraudulent behaviors. In rule-based systems, rules are pre-programmed to identify the changes in patterns. These rule based expert systems are not capable to detect online fraudulent transactions effectively. The application of deep learning seems to be promising in the fraud detection domain due to the favorable results produced [1,2]. Also, there is less human involvement required for defining rules in deep learning-based systems. Deep learning methods are being widely used in computer vision and other domains as well due to their increased popularity and availability of data. However, in fraud detection systems, not much research has been done due to the non-availability of confidential banking, insurance data, etc. Datasets available are limited and have been already transformed from the original form due to confidentiality issues. Hence, feature extraction is one of the main challenges for Machine Learning Classifiers [3]. Also, genuine and fraudulent transactions have an overlapping pattern. Deep Neural Network with multiple hidden layers can transform and extract features automatically as compared to other machine learning models which need additional feature extraction techniques [4].
Class imbalance problem is inherent in various real-life applications like credit card fraud detection, the medical diagnosis of disease e.g., whether a patient has cancer or not. The drawback of using this imbalanced data into the system leads to the bias towards the majority class because classic learning algorithms are trained to maximize the overall accuracy and such high score accuracy may mislead about the performance of the learning model. Class imbalance is one of the main issues in the transactional dataset. However, it is still understudied, and research on the usage of deep learning to handle class imbalance in non-image data like historical transactional data, insurance, or medical claims, etc. is limited [5,6]. Most of the research works have used data-level techniques to handle class imbalance. Data level methods modify the data by undersampling or oversampling to balance the class frequencies. However, undersampling can cause the loss of valuable information from the data and oversampling can cause overfitting of the learning model due to the addition of redundant samples in the dataset [7]. Thus, by altering the dataset, the important information like hidden patterns may get lost. The research work using Algorithm - level techniques that change the learning of the model to handle class imbalance problem is limited. Thresholding with deep learning for solving class imbalance problem has not been much studied [8,9]. It has no impact on the learning of the model. It only changes the output of the model by altering the default threshold of the model. The default threshold in the case of balanced data is generally 0.5. However, when data is imbalanced, the decision threshold must be adjusted to give equal importance to the majority as well as minority classes in the dataset.
In this research work, a deep learning-based model has been proposed for handling class imbalance problem in online transaction fraud detection. Algorithm level approaches i.e., loss functions have been explored for handling class imbalance by altering the learning of the model. Also, a novel loss function has been proposed to maximize the fraud detection rate i.e., TPR. Thresholding has been explored in conjunction with deep learning to optimize the decision threshold for altering the output of the learning model. The decision threshold of proposed deep learning model has been optimized using validation data in order to achieve maximum fraud detection rate. By experimental results, it has been demonstrated that choosing the right thresholding method yields better results. Also, it has been shown as the decision threshold gets adjusted by altering the learning of model. The relationship between class imbalance level and decision threshold has also been found.
2 Deep Learning with Class Imbalance
Class imbalance naturally exists in many real applications where one class generally dominates the others in terms of frequency. The methods to address the class imbalance problem are data level, algorithm level and hybrid methods. In algorithm level methods, the importance of minority class is increased by adjusting the learning of the model. The different approaches to modify the backpropagation learning of neural network are cost-sensitive classification, adaptive learning rate, new loss functions, and output threshold moving or thresholding [10]. In this research work, various loss functions and thresholding have been applied to the deep learning model for handling the class imbalance problem.
Loss functions play an important role in the learning of a neural network (NN). Loss can be referred to as the prediction error of a Neural Network (NN). In this research work, the following loss functions have been used for altering the learning of NN. Fig. 1 has been used for example purpose only to show the comparison of loss functions.
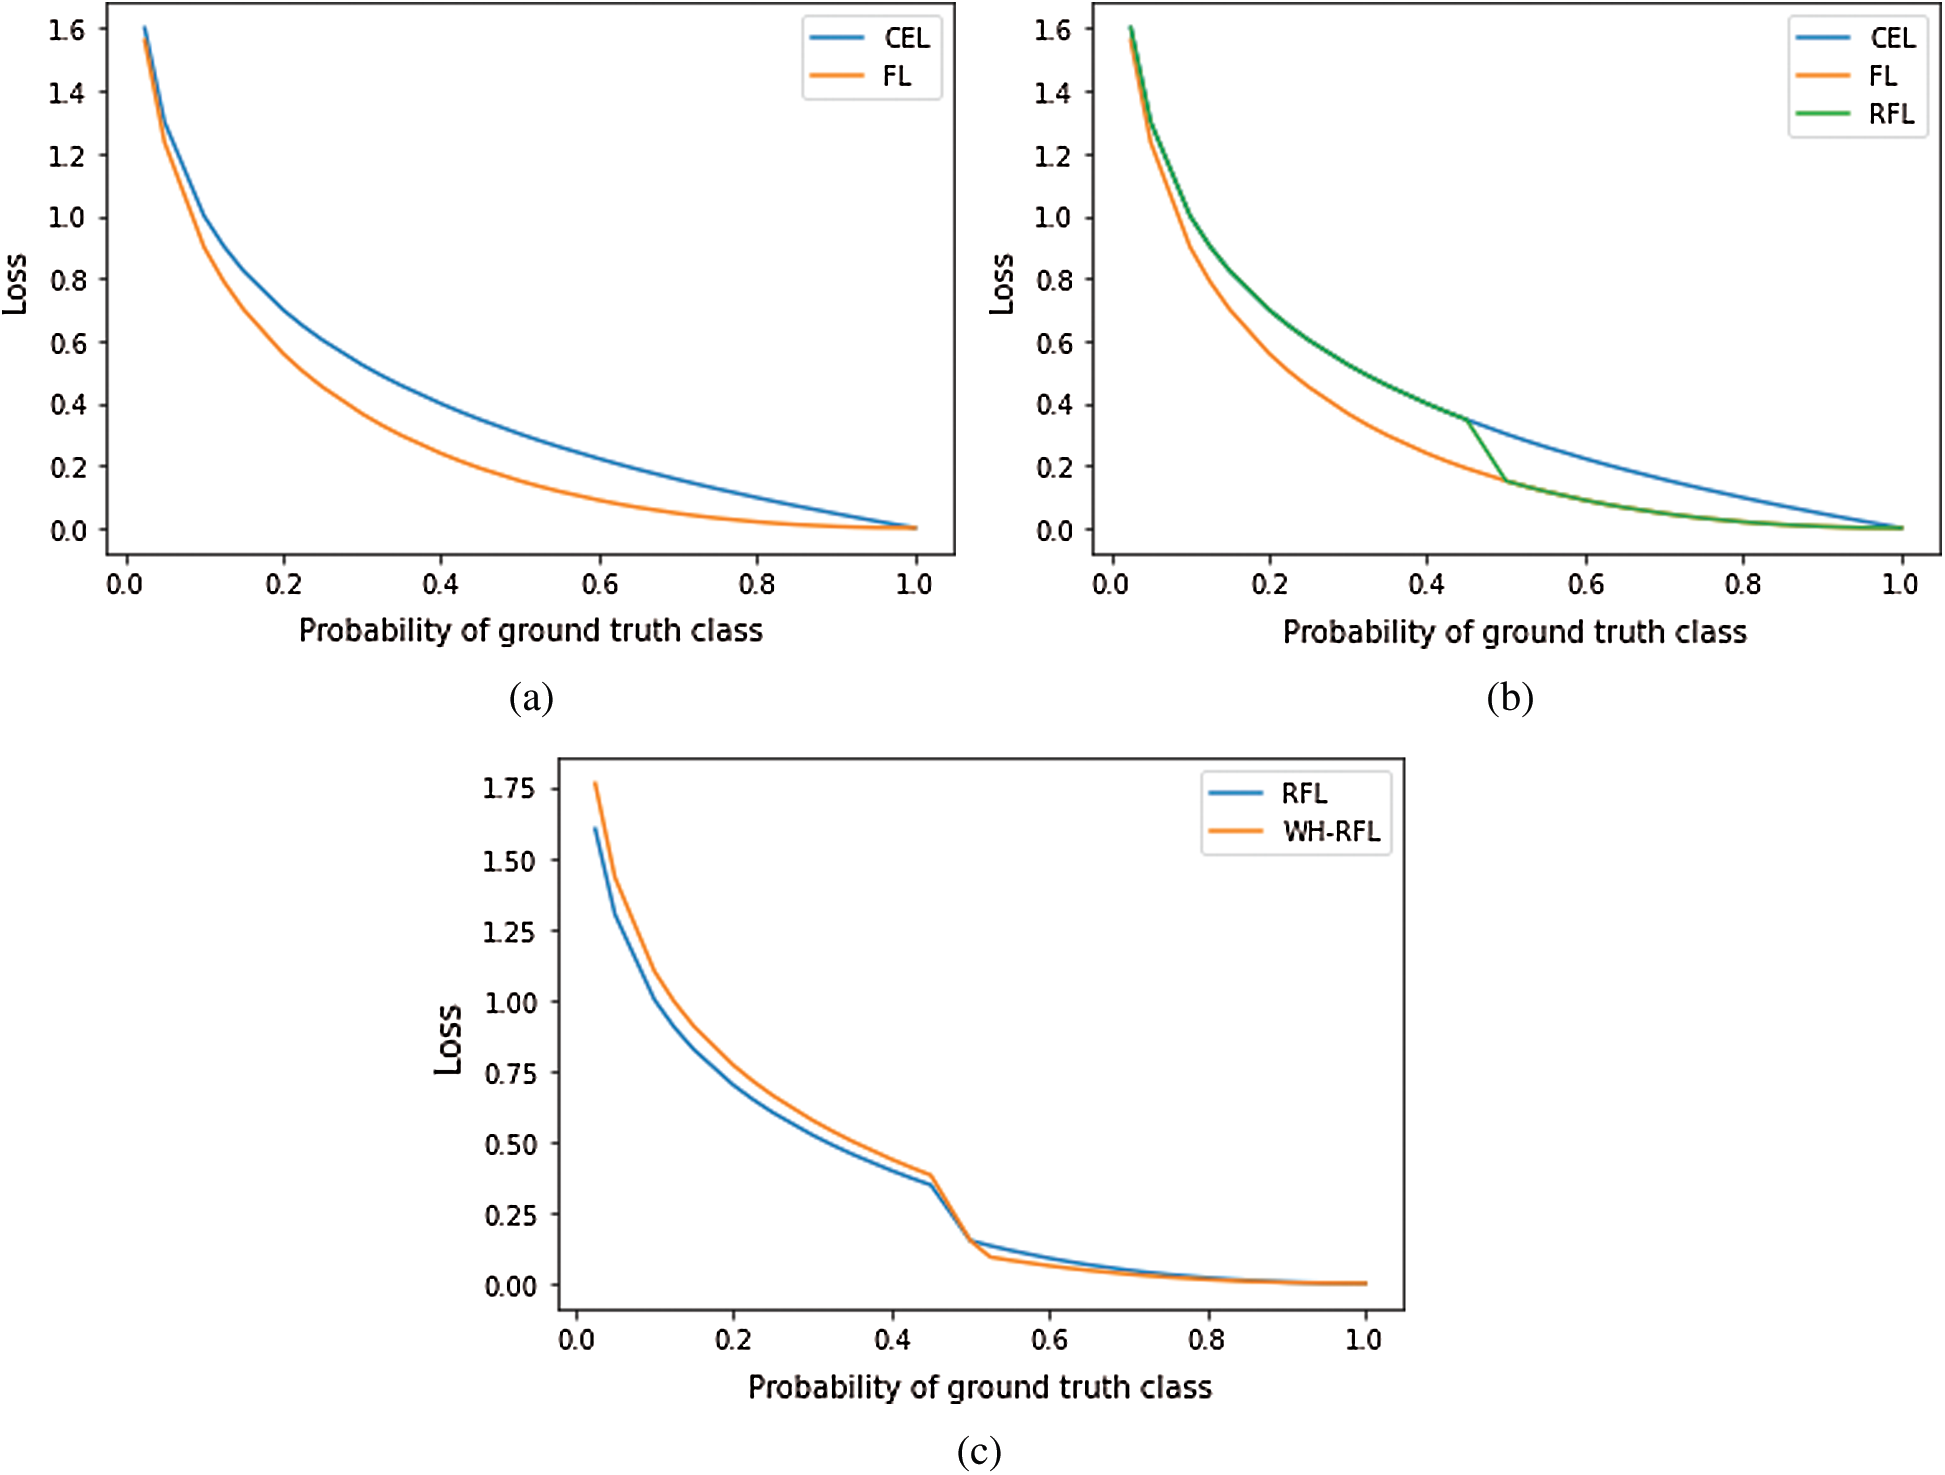
Figure 1: Comparison of (a) CEL & FL, (b) CEL, FL, & RFL and (c) RFL & WH-RFL
A novel loss function proposed by Lin et al. [11] that addresses the class imbalance problem in object detection. This loss function down weights the easily classified class examples to contribute less to the loss and have little influence on the weight updates. Cross entropy loss (CEL) does not perform well when there is an extreme class imbalance. Hence, FL reshapes the CEL loss to down weight the majority class examples which are easily classified by the model as shown in Fig. 1a. This is done by multiplying the CEL by a modulating factor,
Here,
2.1.2 Weighted Cross-Entropy Loss (w-CEL) and Weighted Focal Loss (w-FL)
Weighted cross-entropy loss (W-CEL) [12] and Weighted focal loss (W-FL) [13] use a variable
2.1.3 Reduced Focal Loss (RFL)
Sergievskiy et al. [14] have introduced a novel loss function named reduced focal loss (RFL) function for object detection in satellite imagery. They have modified the focal loss function to reduce the contribution of well-classified examples and soften the response of the loss function to hard examples. Hard examples are those which are having probabilities less than a threshold value in the case of positive examples e.g., the probabilities of positive examples contribute to high loss in the range 0 to 0.5. Thus, to give more importance to the hard examples, they have been applied flat weights. The equation for the reduced focal loss (RFL) used in this research work has been described as following:
where,
Here, the value of
The objective of this research work is to maximize the fraud detection rate i.e., TPR, and to maintain the overall performance of the model. Thus, hard positive examples i.e., fraud transactions having a probability less than 0.5 need to get more attention in the loss. Hence, to achieve maximum fraud detection rate (TPR), the reduced focal loss (RFL) function has been tuned by giving more weightage to the hard-positive examples as compared to the hard-negative examples. Thus, RFL has been modified and named as Weighted Hard-Reduced Focal loss (WH-RFL) because only hard examples have been provided weights rather than whole examples i.e., by multiplying the loss calculated for hard-positive examples by a flat weight value, weight1 and multiplying the loss calculated for hard negative examples by a flat weight value, weight2 where weight1 > weight2 (i.e., giving more weightage to the hard positive examples in loss). As shown in Fig. 1c, the value of loss is high for hard positive examples and low for hard negative examples as compared to RFL. Thus, the equation of WH-RFL loss function is given as:
where,
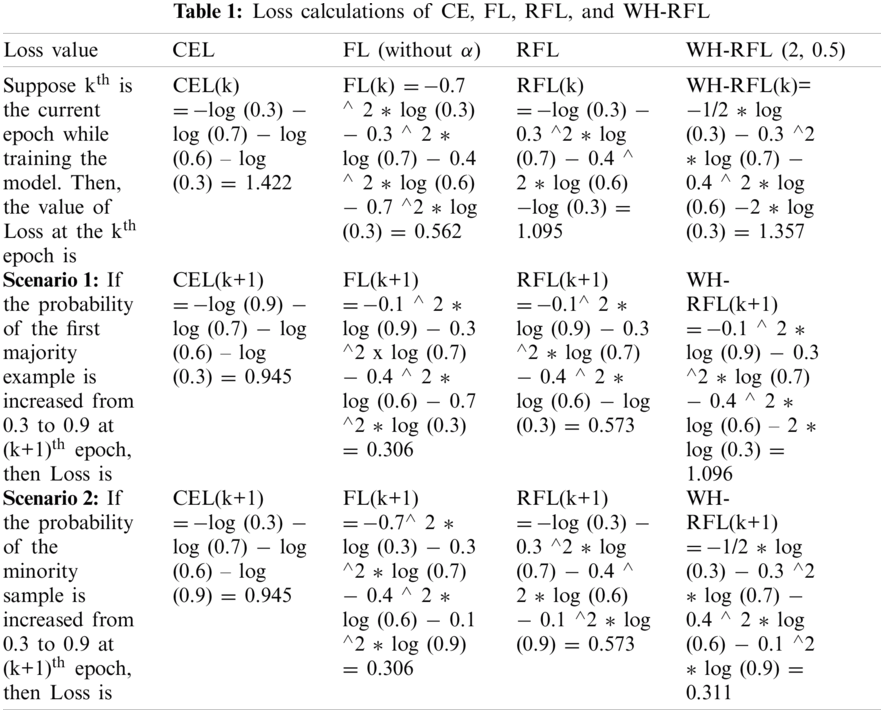
Different values of flat weights have been tested by multiplying with loss of hard positive examples and hard negative examples and the combination of 2 and 0.5 for weight1 and weight2 has achieved the best result in this research work. The comparison of the proposed loss function with other loss functions has been explained using the following example to show that WH-RFL loss function gives more priority to the less frequent fraud transactions and performs better than CEL, FL, and RFL.
Example: Let us assume that there are 3 majority examples and 1 minority example and, and their estimated class probabilities (i.e.,
Thresholding is performed to adjust the decision process to increase the importance of minority positive class i.e., frauds in our case and to reduce the bias of the model towards the majority negative class i.e., genuine transactions. Receiver Operating Characteristic (ROC) curve has been used for thresholding. The curve generated by plotting the TPR against FPR over a range of decision thresholds is known as ROC curve. The decision threshold has been optimized using the validation data which will be used to predict the probability of unseen test data. The level of class imbalance in the training data affects the range of probabilities generated by the neural network. Thus, selecting an optimal decision threshold using validation data is a crucial component of learning from class imbalanced data [15]. AUC-ROC score is the area under ROC curve which is used as a summary of a ROC curve. This performance metric is decision threshold independent [16]. Three ROC curve-based thresholding criteria have been considered for research work.
2.2.1 Closest to (0,1) Criterion
For each point on the ROC curve, the value of distance ‘D’ is calculated from point (0,1) as per the following formula [17,18]:
At this cut-off point, both TPR and TNR are maximized. This criterion gives equal importance to both TPR and TNR.
2.2.2 Youden Index (J) Criterion
Youden [19] suggested an index J called as Youden’s index in 1950 to summarize the performance of a diagnostic test. The formula of J is:
Thus, the difference between TPR and FPR is maximized to obtain the optimal decision threshold.
In this criterion, the value of G-Mean is maximized. Thus, the G-Mean value is checked over a range of decision thresholds to obtain maximum G-Mean.
The Formula of G-Mean is
Among these three criteria, the closest to (0,1) criterion has been selected since it is better in terms of TPR than other two methods and the same has been demonstrated by experimental results.
Data-level class imbalanced methods have been used by many researchers in which they have modified the data to handle class imbalance. Fu et al. [20] have combined the cost-based sampling method in characteristic space to balance the extremely imbalanced sample sets which ultimately increased the performance of the fraud detection system. Fiore et al. [21] have trained a Generative Adversarial Network (GAN) to output duplicate minority class transactions which were merged with the raw dataset to produce an extended training dataset. Heryadi et al. [22] have used an imbalanced dataset containing banking transactions of local Indonesian Bank. They have used undersampling technique to decrease the samples from the majority class by using the under-sampling ratio which is the ratio of the number of non-fraudulent transactions to the fraud transactions. Zheng et al. [23] have developed one class adversarial networks that consist of Long Short-Term Memory (LSTM), Autoencoder and complementary Generative Adversarial Network (GAN) for fraud detection using only benign users during the training phase. They have performed random undersampling for the selection of training and testing dataset. Wang et al. [24] have used random sampling for the selection of training and testing data. Both training and testing data samples were selected randomly having different ratios of normal and fraud transactions for different experiments and comparison of the proposed model with the remaining models. Zhang et al. [25] have extracted five million transaction data in which the majority samples are approx. 33 times that of the minority ones. Hence, they have used samples to construct a more balanced dataset. Jurgovsky et al. [26] have used under sampling on the sequential data. They have randomly picked genuine accounts with the probability of 0.9 and fraud accounts with the probability of 0.1 by using account-based sampling.
Limited research work has been done using the algorithm level class imbalance handling methods. Ghobadi et al. [27] have used cost-sensitive learning to address the class imbalance problem of credit card fraud detection problem. They have assigned misclassification costs to the false positives and negatives to modify the backpropagation learning of the neural network. Johnson et al. [15] have used max-G-Mean criteria to optimize the decision threshold using various loss functions by utilizing deep neural networks in their research work. Li et al. [28] have presented a deep representation learning framework by utilizing deep learning and also proposed a novel loss function which focus on angles and distances among features. Many researchers have used the hybrid methods to handle class imbalance by combining both data-level and algorithm-level methods [29–31].
The proposed methodology aims to build a model that can train well even in imbalanced data. Deep learning has been selected since it can learn extensively even with imbalanced data. The structure of the proposed methodology is shown in Fig. 2 and has been explained as following.
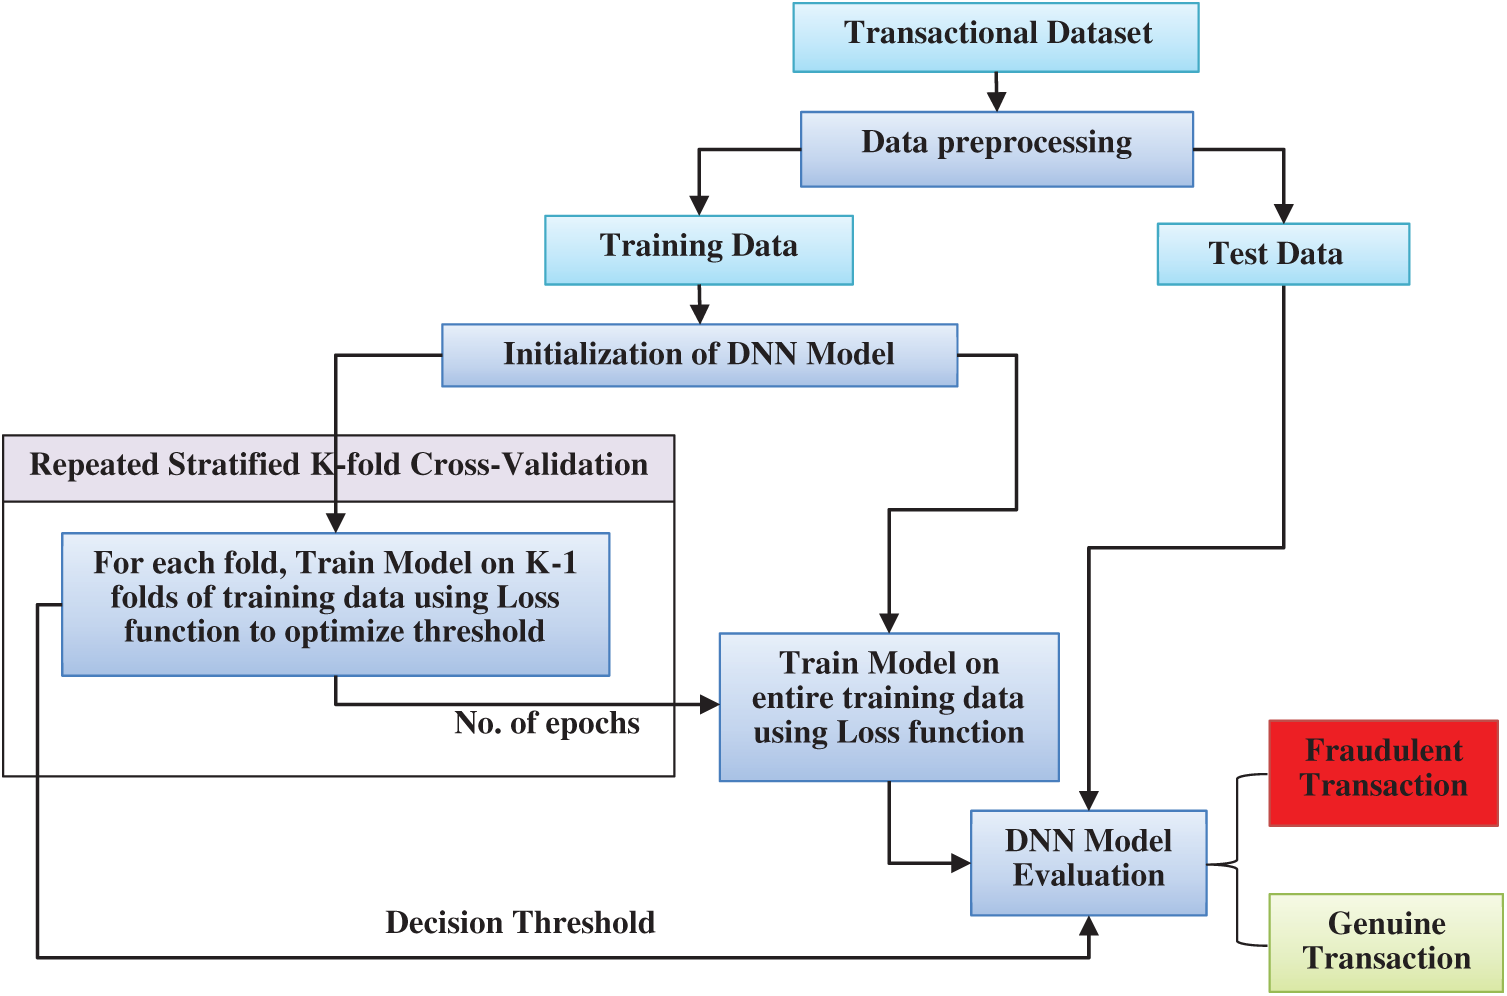
Figure 2: Structure of proposed methodology
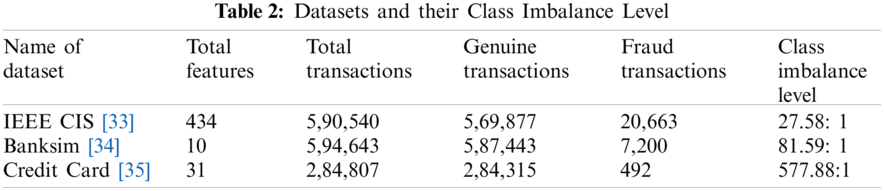
Three datasets containing transactional data have been used which contain genuine and fraud transactions in an imbalanced manner. Tab. 2 describes the datasets used, total transactions in datasets, genuine transactions (majority class), fraud transactions (minority class) and class imbalance level i.e., the majority to minority class ratio [32].
Preprocessing of all three datasets has been explained as following.
4.2.1 IEEE CIS Fraud Detection Dataset
IEEE CIS Dataset has been divided into two separate Tables. i.e., transaction table and identity table having one common feature TransactionID. Both transaction and identity tables have been merged using TransactionID feature. There is one binary target feature named isFraud which has 0 value for the legitimate transaction and 1 for fraud transaction. There are 434 features including transaction id and isFraud target feature in the dataset and most of them contain missing values and hence features having large missing values have been excluded. Thus, after excluding features based on their missing value percentage, 54 features have been selected out of which 32 are numerical features and 22 are categorical features. Some of the continuous features are right-skewed. For those continuous features, log transformation has been applied. After the log transformation of right-skewed features, standardization of all the numerical features has been performed. Missing values in numerical features have been imputed with 0 and missing indicators have been added to indicate numerical features that are missing and have been imputed. Thus, after handling missing values, the 32 numerical features increased to the count of 49. All categorical features have been converted into numerical. Thus, the cardinality of categorical features has been reduced by using only the most frequent categories. Missing values have been used as ‘nan’ category. The rest of the less frequent categories have been treated as ‘Other’. Then, all the categorical features have been converted into numerical using one-hot encoding [36]. 22 categorical features got converted into 509 numerical features. Hence, there is a total of 558 features after data pre-processing.
This dataset consists of synthetic data provided by a bank in Spain containing transactional data to be used for fraud detection research. It contains a total of 10 features. There are no duplicate transactions in the dataset. There are no missing values in the dataset. As the features, zipcodeOri and zipMerchant contain one constant value of zip code and hence, they have been removed. Step column is also not important and has been removed. Thus, only six features have been used as input as the fraud feature is the type of transaction. Categorical features have been converted into numerical by ordinal encoding [37] as there are too many categories of the features present in the dataset. There is a total of 4,109 unique customers and 50 unique merchants available in the dataset which will increase the dimensionality of the dataset a lot if the one-hot encoding is used.
4.2.3 Credit Card Fraud Detection Dataset
This dataset contains transactions made by credit cards in September 2013 by European cardholders. There are no duplicate transactions in the dataset. Also, there are no missing values in the dataset. There are 31 columns in the dataset and all the columns have been already transformed using PCA in the dataset except ‘Amount’, Time’, and Class. Class columns depicts whether a transaction is genuine or fraud. It has only two values i.e., 1 (in case of fraud) and 0 (in case of genuine transaction). Hence scaling of columns ‘Amount’ and Time’ has been performed. All features of the dataset have been used.
4.3 Splitting into Training and Test Data
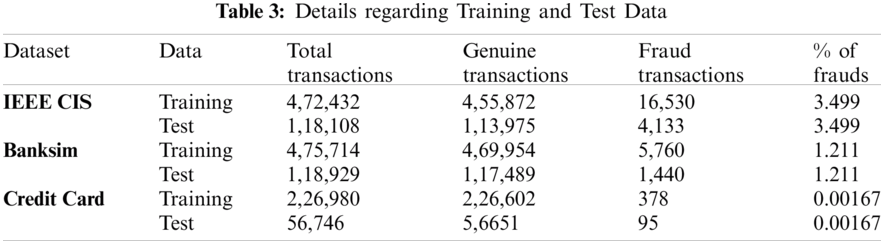
All datasets have been split in training and testing sets in stratified manner in the ratio of 80:20 as shown in Tab. 3.
4.4 Baseline Architecture of Deep Neural Network (DNN)
Random search approach has been used to finalize the baseline architecture of Deep Neural Network (DNN) for all three datasets and their hypermeters. 20% of validation data has been taken from the training data to evaluate the model performance and to select the best hyperparameters i.e., number of hidden layers, number of neurons per hidden layer, learning rate, batch normalization, dropout rate. Each set of hyperparametrs was evaluated by using five random 20% of validation data in stratified manner from the training data i.e., by training five models. TPR value was averaged for all five models and this avergae TPR value has been compared for all sets of hyperparameters to select the best set of hyperparameters having maximum average TPR value. Once the architectures of DNN models for all three datasets have been finalized, they have been fit to whole training data and then evaluated using test data. This approach has made sure that the hyperparameter tuning would not get influenced by test data.
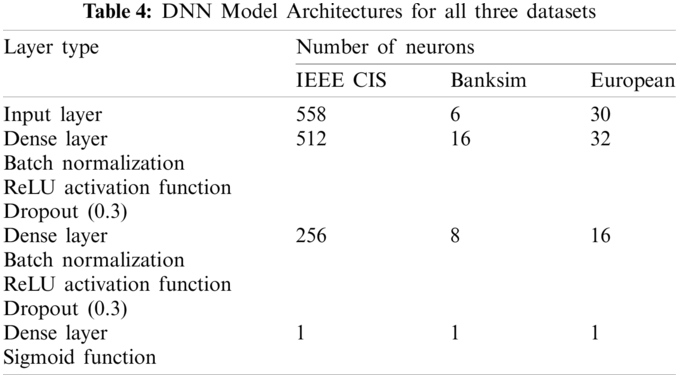
Tab. 4 describes the detailed architectures of DNNs used for IEEE CIS, Banksim, and European datasets showing number of neurons used in each layer. All results using various loss functions have been calculated using these baseline model architectures. All three baseline models have the same structure except the number of neurons in the different layers. Batch normalization [38] has also been applied before the activation function to normalize the inputs to hidden layers across each batch. ReLU activation function has been used in both hidden layers as its performance is quite good in terms of speed and he_uniform weight initialization method has been used to assign the initial weights [39]. In the output layer, the sigmoid activation function has been used to predict the probabilities [40]. The dropout rate of 0.3 has been used for randomly dropping neurons along with their connections and hence, preventing them from co-adapting too much [41]. Mini-batch size of 256 has been selected. The optimizer used is Adam [42] and the learning rate has been fixed at 0.0001.
The output bias weights have been initialized in the last layer of the model with prior probability
4.6 Selection of Thresholding Criterion
By default, the decision threshold of DNN model is 0.5. In the class imbalance scenario, the threshold needs to be adjusted. For demonstration purposes, the CEL function has been used to select the best thresholding criterion. The results have been obtained by all three thresholding criteria i.e., Closest to (0,1), Youden Index J, max-G-Mean, and default threshold after the first epoch for all three datasets and have been summarized in Tab. 5.
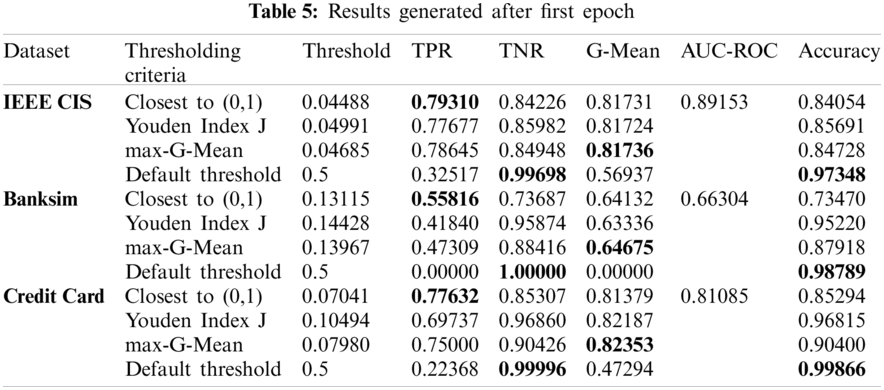
As per Tab. 5, for all three datasets used, the decision threshold optimized using Closest to (0,1) criterion has achieved maximum TPR as compared to other criteria as it gives equal weightage to both TPR and TNR as per Eq. (13). Youden Index J criterion tries to minimize the difference between TPR and FPR as per Eq. (14). G-Mean score is maximum for max-G-Mean criteria as it tries to maximize the value of G-Mean as per Eq. (15). For the default threshold, TNR is maximum and TPR is lowest. AUC-ROC score is the same for all criteria for a dataset since thresholds have been calculated using same ROC curve. Hence, a large value of G-Mean or AUC-ROC does not necessarily mean the high value of TPR. Also, accuracy is high when TNR is high i.e., for default threshold when maximum number of transactions are predicted as genuine. Thus, accuracy is not a good performance metric when data is imbalanced. As Closest to (0,1) crierion has produced maximum TPR, it has been selected to optimize the decision threshold.
4.7 Training and Evaluation of DNN Model
As the range of probabilities generated by the neural network gets affected by the class imbalance level in dataset. Hence, selection of an optimal decision threshold using validation data is important for learning from class imbalanced data. Optimal decision thresholds have been calculated using the Repeated Stratified K-fold cross validation where k is 5 and have been repeated 2 times with different randomization in each repetition. Thus, total 10 folds of validation data have been obtained. By using 5-folds cross validation, we have 20% of validation data in each fold. For each of the ten folds of validation data, the thresholding has been performed to optimize the threshold using the validation data probabilities calculated by the DNN model. For each model, the decision threshold optimized and number of epochs for which model has been trained are saved so that these values can be used to train the model on entire training data and then for evaluation.
Early stopping has been used to stop the training of model to avoid overfitting of model and hence, save the results of best model. Training of DNN model during cross validation is stopped when maximum value of TPR for validation data is achieved by optimizing decision threshold and in case if TPR stopped improving but TNR is improving, then training is stopped when TNR also stopped improving i.e., the results are saved for best TPR and TNR both.
The DNN model having same architecture used during cross-validation has been trained on the entire training dataset with the same number of epochs used for the optimization of decision threshold for each fold of validation data. The same procedure has been repeated for all ten fold results.
For implementation of neural networks, an open-source library named Keras written in python language has been used. Proposed methodology has been performed using all loss functions. The results for test data have been generated using optimal thresholds calculated using cross-validation and the best test data results have been selected among all folds. For FL, W-FL, and WH-RFL, the value of γ is fixed i.e., 2 as it gives the best results [11]. For focal loss function, the results have been checked for different values of balancing factor i.e., α (0.10, 0.25, 0.50, 0.75, 0.90) and without α as well. The results have been compiled in the following Tabs. 6–8 for all three datasets.
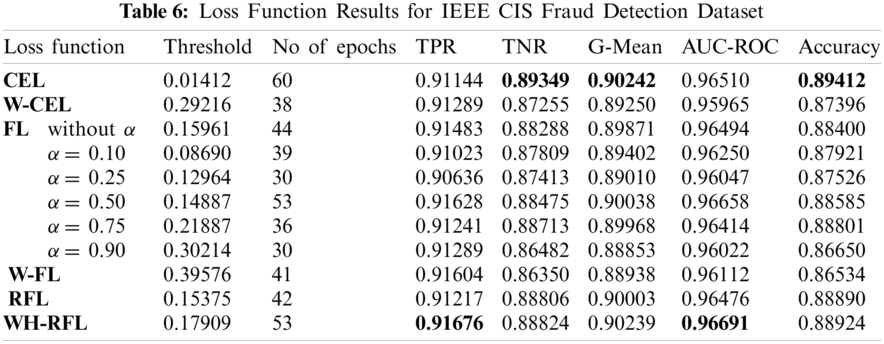
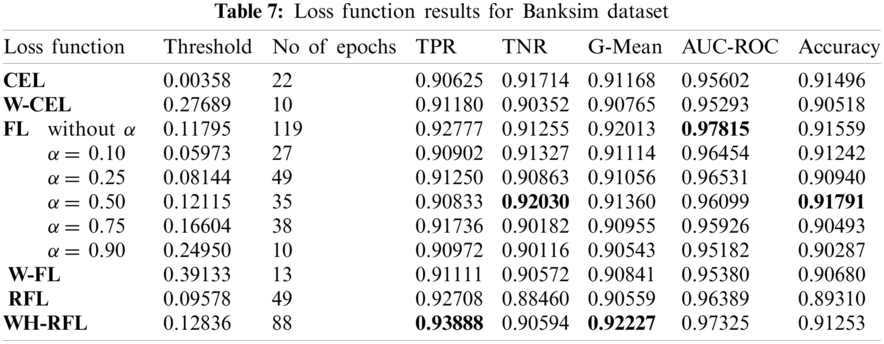
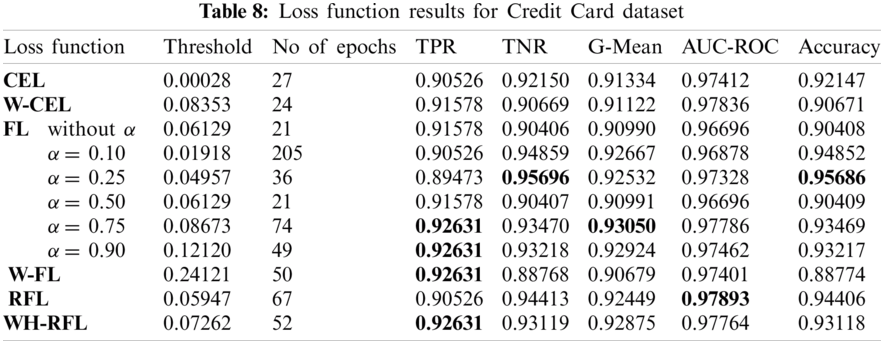
It has been found that for all three datasets, the decision thresholds optimized using all loss functions are dependent on the class imbalance level in dataset. As per Tab. 2, Credit Card dataset has high class imbalance, so the value of threshold generated is very low as compared to other two datasets for all loss functions. Hence, there is a relationship between the class imbalance level and the decision threshold. The higher is class imbalance level, low is the value of the decision threshold, and vice versa. Also, for α balanced focal loss (FL), it has been found that the value of the decision threshold is directly proportional to the value of balancing parameter α. Higher the value of α, the decision threshold value is also high. It has also been found that the decision threshold gets adjusted when the learning of the model is altered.
For all three datasets, the proposed loss function i.e., WH-RFL has achieved maximum TPR at the cost of a small decrease in TNR as compared to other loss functions. For the Credit Card dataset, W-FL and α balanced FL have also achieved equivalent TPR. CEL has achieved maximum TNR for IEEE CIS dataset and α balanced FL has achieved maximum TNR for Banksim and European datasets. CEL has achieved maximum G-Mean for the IEEE CIS dataset. WH-RFL has achieved maximum G-Mean for the Banksim dataset. α balanced FL has achieved maximum G-Mean for the European dataset. Thus, maximum G-Mean does not ensure maximum TPR. For the IEEE CIS dataset, WH-RFL has achieved the maximum AUC-ROC score. For the Banksim dataset, FL without α parameter has achieved maximum AUC-ROC score and for Credit Card dataset, RFL has achieved maximum AUC-ROC score. Hence, the large AUC-ROC score does not ensure a large TPR. Also, accuracy is high when TNR is high for all three datasets. Hence, a highly accurate model can not be considered better when the data is imbalanced.
From the experimental results, it is evident that the proposed loss function can detect maximum fraud transactions at the cost of misclassification of few genuine transactions as a high TPR is preferred over a high TNR in the fraud detection system. It has also been demonstrated that large value of threshold independent performance metric AUC-ROC score does not necessarily mean high TPR as ROC curve is sensitive towards class imbalance problem. It is also to be mentioned that this is the first-ever study that has optimized the decision threshold for maximizing the TPR as the previous research works have tried to maximize the threshold independent AUC-ROC score to evaluate the performance of their model.
In this research work, a methodology based on DNN has been proposed to detect frauds in online transactions by applying algorithm-level class imbalance techniques and further improving the fraud detection rate by optimizing the decision threshold on the validation data. Also, a novel focal loss function i.e., Reduced Focal Loss function (RFL) has been used and it has been demonstrated that the TPR achieved by modifying Reduced Focal Loss (RFL) i.e., by proposed loss function Weighted Hard-Reduce Focal Loss (WH-RFL) is superior to the CEL, FL and RFL loss functions. It has been demonstrated that selecting the optimal decision threshold yields better results with deep learning. Also, it is evident that by altering the learning of model, decision threshold gets adjusted automatically to achieve the desirable results. Thus, the proposed methodology used in this research can perform better with a large amount of data and able to address the class imbalance problem without modifying data.
The proposed methodology combined with proposed loss function can be applied in other domains like healthcare for disease detection, anomaly detection, etc. as the class imbalance is an inherent problem in these domains. The proposed methodology can also be explored using some other algorithm-level methods to handle the class imbalance problem by giving more priority to the minority class examples.
Funding Statement: This research was supported by Korea Institute for Advancement of Technology (KIAT) grant funded by the Korea Government (MOTIE) (P0012724, The Competency Development Program for Industry Specialist) and the Soonchunhyang University Research Fund.
Conflicts of Interest: The authors declare that they have no conflicts of interest to report regarding the present study.
1. T. J. Sejnowski, “Backpropagating errors,” in The Deep Learning Revolution, Cambridge, MA: The MIT Press, Chapter 8, pp. 109–126, 2018. [Google Scholar]
2. P. Danenas, “Intelligent financial fraud detection and analysis: A survey of recent patents,” Recent Patents on Computer Science, vol. 8, no. 1, pp. 13–23, 2015. [Google Scholar]
3. M. Arya and H. Sastry G, “DEAL–‘deep ensemble ALgorithm’ framework for credit card fraud detection in real-time data stream with google tensorFlow,” Smart Science, vol. 8, no. 2, pp. 71–83, 2020. [Google Scholar]
4. S. Pouyanfar, S. Sadiq, Y. Yan, H. Tian, Y. Tao et al., “A survey on deep learning: Algorithms, techniques, and applications,” ACM Computer Survey, vol. 51, no. 5, pp. 1–36, 2019. [Google Scholar]
5. J. Johnson and T. Khoshgoftaar, “Survey on deep learning with class imbalance,” Journal of Big Data, vol. 6, no. 27, pp. 1–54, 2019. [Google Scholar]
6. Kanika and J. Singla, “A survey of deep learning based online transactions fraud detection systems,” in Int. Conf. on Intelligent Engineering and Management, ICIEM, London, United Kingdom, pp. 130–136, 2020. [Google Scholar]
7. Y. Cui, M. Jia, T.-Y. Lin, Y. Song and S. Belongie, “Class-balanced loss based on effective number of samples,” in IEEE/CVF Conf. on Computer Vision and Pattern Recognition, Long Beach, CA, USA, pp. 9260–9269, 2019. [Google Scholar]
8. S. Fernández, M. García, R. C. P. B. Galar, F. Krawczyk and Herrera, “Cost-sensitive learning,” in Learning from Imbalanced Data Sets, Springer, Chapter 4, pp. 63–78, 2019. [Google Scholar]
9. J. M. Johnson and T. M. Khoshgoftaar, “Deep learning and thresholding with class-imbalanced big data,” in Int. Conf. on Machine Learning and Applications, ICMLA, Boca Raton, FL, USA, pp. 755–762, 2019. [Google Scholar]
10. M. Kukar and I. Kononenko, “Cost-sensitive learning with neural networks,” in European Conf. on Artificial Intelligence 13th Int. Conf. ECAI, Brighton, UK, 1998. [Google Scholar]
11. T. Lin, P. Goyal, R. Girshick, K. He and P. Dollár, “Focal loss for dense object detection,” in Int. Conf. on Computer Vision, ICCV, Venice, pp. 2999–3007, 2017. [Google Scholar]
12. X. Wang, Y. Peng, L. Lu, Z. Lu, M. Bagheri et al., “Chestx-Ray8: Hospital-scale chest X-Ray database and benchmarks on weakly-supervised classification and localization of common thorax diseases,” in Computer Vision and Pattern Recognition, CVPR, 2017. [Google Scholar]
13. R. Qin, K. Qiao, L. Wang, L. Zeng, J. Chen et al., “Weighted focal loss: An effective loss function to overcome unbalance problem of chest X-ray14,” in IOP Conf. Series: Materials Science and Engineering, vol. 428, pp. 12022, 2018. [Google Scholar]
14. N. Sergievskiy and A. Ponamarev, “Reduced focal loss: 1st place solution to xView object detection in satellite imagery,” arXiv, 2019, arXiv:1903.01347. [Google Scholar]
15. J. Johnson and T. Khoshgoftaar, “Medicare fraud detection using neural networks,” Journal of Big Data, vol. 6, no. 63, pp. 1–35, 2019. [Google Scholar]
16. T. Peterson, M. Papeş and J. Soberón, “Rethinking receiver operating characteristic analysis applications in ecological niche modeling,” Ecological Modelling, vol. 213, no. 1, pp. 63–72, 2008. [Google Scholar]
17. G. Z. Song, Zhang, W. Zhu and Z. Liang, “ROC operating point selection for classification of imbalanced data with application to computer-aided polyp detection in CT colonography,” International Journal of Computer Assisted Radiology and Surgery, vol. 9, no. 1, pp. 79–89, 2013. [Google Scholar]
18. I. Unal, “Defining an optimal cut-point value in ROC analysis: An alternative approach,” Computational and Mathematical Methods in Medicine, vol. 2017, pp. 1–14, 2017. [Google Scholar]
19. W. J. Youden, “Index for rating diagnostic tests,” Cancer, vol. 3, no. 1, pp. 32–35, 1950. [Google Scholar]
20. K. Fu, D. Cheng, Y. Tu and L. Zhang, “Credit card fraud detection using convolutional neural networks,” in Neural Information Processing Lecture Notes in Computer Science. Cham: Springer International Publishing, vol. 9949, pp. 483–490, 2016. [Google Scholar]
21. U. Fiore, A. D. Santis, F. Perla, P. Zanetti and F. Palmieri, “Using generative adversarial networks for improving classification effectiveness in credit card fraud detection,” Information Sciences, vol. 479, pp. 448–455, 2019. [Google Scholar]
22. Y. Heryadi and H. L. H. S. Warnars, “Learning temporal representation of transaction amount for fraudulent transaction recognition using CNN, Stacked LSTM, and CNN-LSTM,” in Int. Conf. on Cybernetics and Computational Intelligence, CyberneticsCom, Phuket, Thailand, pp. 84–89, 2017. [Google Scholar]
23. P. Zheng, S. Yuan, X. Wu, J. Li and A. Lu, “One-class adversarial nets for fraud detection,” in Proc. of the AAAI Conf. on Artificial Intelligence, vol. 33, pp. 1286–1293, 2019. [Google Scholar]
24. Y. Wang, Z. Wang, Ye, L. Yan, W. Cai and S. Pan, “Credit card fraud detection based on whale algorithm optimized BP neural network,” in Computer Science & Education, 13th Int. Conf., ICCSE, 2018. [Google Scholar]
25. Z. Zhang, X. Zhou, X. Zhang, L. Wang and P. Wang, “A model based on convolutional neural network for online transaction fraud detection,” Security and Communication Networks, vol. 2018, pp. 1–9, 2018. [Google Scholar]
26. J. Jurgovsky, M. Granitzer, K. Ziegler, S. Calabretto, P. -E. Portier et al., “Sequence classification for credit-card fraud detection,” Expert Systems with Applications, vol. 100, pp. 234–245, 2018. [Google Scholar]
27. F. Ghobadi and M. Rohani, “Cost sensitive modeling of credit card fraud using neural network strategy,” in Signal Processing and Intelligent Systems, 2nd Int. Conf., ICSPIS, Tehran, pp. 1–5, 2016. [Google Scholar]
28. Z. Li, G. Liu and C. Jiang, “Deep representation learning with full center loss for credit card fraud detection,” in IEEE Transactions on Computational Social Systems, vol. 7, no. 2, pp. 569–579, April 2020. [Google Scholar]
29. Y. Ando, H. Gomi and H. Tanaka, “Detecting fraudulent behavior using recurrent neural networks,” in Computer Security Symp., Japan, 2016. [Google Scholar]
30. S. Wang, C. Liu, X. Gao, H. Qu and W. Xu, “Session-based fraud detection in online E-commerce transactions using recurrent neural networks,” in Machine Learning and Knowledge Discovery in Databases,” Proc.: Lecture Notes in Computer Science (LNCS 10536New York City (NYCSpringer Cham, pp. 241–252, 2017. [Google Scholar]
31. J. A. Gómez, J. Arévalo, R. Paredes and J. Nin, “End-to-end neural network architecture for fraud scoring in card payments,” Pattern Recognition Letters, vol. 105, pp. 175–181, Apr 2018. [Google Scholar]
32. J. L. Leevy, T. M. Khoshgoftaar, R. A. Bauder and N. Seliya, “A survey on addressing high-class imbalance in big data,” Journal of Big Data, vol. 5, no. 42, pp. 1–30, 2018. [Google Scholar]
33. IEEE Computational Intelligence Society, “IEEE-CIS fraud detection data,” 2019. [Online]. Available: https://www.kaggle.com/c/ieee-fraud-detection/data. [Google Scholar]
34. NTNU Testimon, “Banksim: synthetic data from a financial payment system,” 2017. [Online]. Available: https://www.kaggle.com/ntnu-testimon/banksim1. [Google Scholar]
35. Machine Learning Group-ULB, “Credit card fraud detection dataset,” 2018. [Online]. Available: https://www.kaggle.com/mlg-ulb/creditcardfraud. [Google Scholar]
36. M. M. Suarez-Alvarez, D.-T. Pham, M. Y. Prostov and Y. I. Prostov, “Statistical approach to normalization of feature vectors and clustering of mixed datasets,” in Proc. of the Royal Society A: Mathematical Physical and Engineering Sciences, vol. 468, no. 2145, pp. 2630–2651, 2012. [Google Scholar]
37. K. Potdar, T. S. Pardawala and C. D. Pai, “A comparative study of categorical variable encoding techniques for neural network classifiers,” International Journal of Computer Applications, vol. 175, no. 4, pp. 7–9, 2017. [Google Scholar]
38. S. Ioffe and C. Szegedy, “Batch normalization: Accelerating deep network training by reducing internal covariate shift,” in Proc. of the Int. Conf. on Machine Learning, 32nd Int. Conf., ICML, vol. 37, pp. 448–56, 2015. [Google Scholar]
39. K. He, X. Zhang, S. Ren and J. Sun, in “Delving deep into rectifiers: Surpassing human-level performance on ImageNet classification,” in Int. Conf. on Computer Vision, pp. 1026–1034, 2015. [Google Scholar]
40. M. D. Richard and R. P. Lippmann, “Neural network classifiers estimate Bayesian probabilities,” Neural Computation, vol. 3, no. 4, pp. 461–483, 1991. [Google Scholar]
41. N. Srivastava, G. E. Hinton, A. Krizhevsky, I. Sutskever and R. Salakhutdinov, “Dropout: A simple way to prevent neural networks from overfitting,” Journal of Machine Learning Research, vol. 15, pp. 1929–1958, 2014. [Google Scholar]
42. D. P. Kingma and J. Ba, “A dam: A Method for Stochastic Optimization,” in Int. Conf. for Learning Representations, 3rd Int. Conf., ICLR, 2015, arXiv:1412.6980. [Google Scholar]
 | This work is licensed under a Creative Commons Attribution 4.0 International License, which permits unrestricted use, distribution, and reproduction in any medium, provided the original work is properly cited. |