DOI:10.32604/cmc.2022.020299
| Computers, Materials & Continua DOI:10.32604/cmc.2022.020299 | |
| Article |
Dorsal-Ventral Visual Pathways and Object Characteristics: Beamformer Source Analysis of EEG
1Department of Biosciences and Biomedical Engineering, Indian Institute of Technology Indore, Indore, 453552, India
2Department of Electrical Engineering, Indian Institute of Technology Indore, Indore, 453552, India
3Discipline of Psychology, Indian Institute of Technology Indore, Indore, 453552, India
4Center for Electric Vehicles and Intelligent Transport Systems, Indian Institute of Technology Indore, Indore, 453552, India
*Corresponding Author: Premjit Khanganba Sanjram. Email: sanjrampk@iiti.ac.in
Received: 17 May 2021; Accepted: 18 June 2021
Abstract: In performing a gaming task, mental rotation (MR) is one of the important aspects of visuospatial processing. MR involves dorsal-ventral pathways of the brain. Visual objects/models used in computer-games play a crucial role in gaming experience of the users. The visuospatial characteristics of the objects used in the computer-game influence the engagement of dorsal-ventral visual pathways. The current study investigates how the objects’ visuospatial characteristics (i.e., angular disparity and dimensionality) in an MR-based computer-game influence the cortical activities in dorsal-ventral visual pathways. Both the factors have two levels, angular disparity: convex angle (CA) vs. reflex angle (RA) and dimensionality: 2D vs. 3D. Sixty healthy adults, aged, 18–29 years (M = 21.6) were recruited for the study and randomly assigned to four gaming conditions i.e., 15 participants in each group. The multichannel electroencephalogram (EEG) data were recorded from 60 healthy adults while playing the game. The source reconstruction was done for ∼3000 sources inside the brain using the Dynamic Imaging of Coherent Sources (DICS) beamforming method for θ1(4–5.75), θ2(5.75–7.5), α1(7.5–9), α2(9–11), α3(11–13), β1(13–17.25), β2(17.25–21.5) Hz frequency sub-bands. The reconstructed neuronal sources were segmented into 68 functionally parcellated brain regions, and the percentage of active sources for each region was computed. Further, the differences across the 68 regions among the four gaming conditions were evaluated using the percentage of active sources. The differences in activation for the dorsal-ventral pathways and some additional brain regions were observed among the four groups. The game with 2D objects and CA showed higher activation than that with 3D objects and RA, respectively. The dorsal pathway was found to be more active in contrast to the ventral pathway. The findings suggest that angular disparity and dimensionality in MR influence the engagement of dorsal-ventral visual pathways in such a way that angular disparity has a greater impact on cortical activation across this region than dimensionality. Also, higher activation for CA as compared to RA irrespective of dimensionality reflects the complexity of spatial information processing under CA. Similarly, greater activation was seen for 2D objects than 3D, indicating difficulty in information processing due to deficient visual features.
Keywords: Mental rotation; EEG; source localization; DICS beamformer; dorsal-ventral pathway
The complexity of the human brain and its associated functions has been a great interest of neuroscientists over the years. Visuospatial processing is one of the key functions of the brain, which envelops perception, analysis, manipulation, and transformation of visual patterns/images. The transformation here refers to rotation, translation, zooming, and comparing the images during the visuospatial processing and usually encapsulated as MR. Shepard et al. [1] first studied the MR using their classic MR parity judgments task with pairs of rotated block stimuli/objects. They suggested an ‘inverted V’ plot between reaction time and angular differences between the objects. Then after several studies have been conducted to investigate various aspects of MR, using behavioral and neuroimaging methods [2–5]. MR facilitates fast spatial visualization to our brain in visuospatial processing during various tasks in day-to-day life, such as finding a place, reading a map, navigating.
In an MR process, one utilizes spatial and visual characteristics of the image, which requires both where and what information processing. Therefore, MR involves both the dorsal and ventral visual processing pathways in the brain [6,7]. The dorsal pathway primarily deals with the object's spatial features such as location, orientation, motion, whereas the ventral pathway processes the visual features such as color, size, dimension. When an individual processes ‘what’ information, usually an allocentric or object-centered approach is involved, whereas an egocentric or viewer-centered approach is utilized for ‘where’ information processing [8]. Though in an MR parity task, an individual needs to find a pair of the given object based on its visual features, the spatial information, i.e., the rotation between the objects, also plays a crucial role [1]. This rotation is usually known as angular disparity, and its effects in MR processing is often investigated [9,10]. Further, the objects’ various visual characteristics affect the MR process, such as the object's complexity, dimensionality [11]. The dimensionality holds the visual information defining objects’ dimensions in which they are visually perceived. Researchers have investigated the dorsal-ventral pathways using various neuroimaging techniques to study the visuospatial processing during the MR parity tasks [6,7]. The dorsal pathway starts from the primary visual cortex (V1) and goes to the posterior parietal cortex (PPC) via the secondary visual cortex (V2), dorsomedial area (DM/V6), and middle temporal area (MT/V5). On the other hand, the ventral pathway starts from V1 and goes to the inferior temporal cortex (IT) via V2 and V4 visual areas [12]. Fig. 1 shows the representation of dorsal-ventral processing in associated regions during MR.
Cortical activations associated with MR have been investigated using different task designs, and the association of several brain regions has been identified based on the object characteristics in MR tasks. Although the MR studies have been reporting active association of PPC and other subregions in dorsal and ventral pathways during MR tasks, the findings are not limited to these areas. Activities in other brain regions have also been often reported during MR depending on the tasks’ complexity and nature. Higher cortical activation with increasing angular disparity has been previously reported in the right dominating bilateral superior and inferior parietal lobules, superior temporal gyrus (STG), right medial frontal gyrus, and other higher-order prefrontal regions [13]. The other regions associated with the dorsal pathway, such as precuneus, supramarginal gyrus, calcarine, and precentral gyrus, were also found active in several MR studies [14]. Further, the ventral pathway's regions such as an occipital pole, extrastriate region (V2 and V4), lingual, and inferior temporal regions have been primarily reported active during MR tasks while processing objects’ features or their subsections [15]. The interactive activations across dorsal-ventral pathways and objects’ complexity depend on the visuospatial characteristics. The angular disparity between the stimuli has a greater impact on cortical activity than the dimensionality of stimuli in MR [16]. Activation in other brain regions such as higher-order premotor areas, anterior insula, and frontal regions has often been observed during MR [6,7]. Coactivation in anatomically connected cortical regions has also been reported in few MR studies due to their partial involvement in the task [17].

Figure 1: Representation of dorsal/where (yellow) and ventral/what (blue) pathways, and the associated regions Visual (V1–V6), MT (middle temporal), ITG (Inferior temporal gyrus), IPL/SPL (inferior/superior parietal lobules)
Besides investigating the effect of rotation angle in MR, studies have evaluated the effects of object dimensionality, e.g., two-dimensional vs. three-dimensional objects. However, these studies have utilized different sets of 2D and 3D objects in the task design, requiring additional processing networks. Also, the stimulus types and task design affect the strategy selection during the task, which further influences the processing network of the brain [18]. So far, many MR paradigms have been utilized, such as paper-pencil-based tasks, visual slides, and real-world situations [19]. Few recent studies have also investigated MR during computer-games [20]. The computer-games are growing their reach through hand-held devices. Various computer-games have been utilized for studying their effects on cognition, healthcare, education, etc., e.g., SuperMarioTM, Starcraft, and several other first-person shooter action games [21]. However, the findings are limited to explain how the information processing in the brain varies depending on the games’ visuospatial contents. Studying a computer-game focused on visuospatial processing would reveal how physiological and behavioral performances rely on its visual and spatial information. The easy-access and potential usage of computer-games in cognitive training motivated us to design a computer-game focused on MR processing, and studying how the brain responds to the changes in object characteristics during gameplay. Furthermore, advanced data science and machine learning techniques have the potential to be used for identifying the high-dimensional minute changes in brain response as a result of a specific parameter in computer-games [22–24]. Studying how the brain synergistically processes the visual (what) and spatial (where) information while mental rotation during a computer-game may aid in controlling and optimizing the information processing.
In this study, the two categories of angular disparity, i.e., CA and RA represent the spatial characteristics of the objects. The visual characteristics of these objects are described by their dimensionality, i.e., 2D and 3D. In the light of the above discussion, the current study hypothesizes that spatial information (angular disparity) plays a much influential role than the visual ones (dimensionality) while utilizing the dorsal-ventral pathways in MR, the dorsal pathway is expected to be more engaged than the ventral ones. Also, as CA and 2D are found more challenging than RA and 3D in the previous study [25], it is expected to reflect higher activation in dorsal-ventral pathway for CA and 2D in this study. As a result, the dorsal-ventral pathways are likely to be active while playing the MR computer-game, depending on objects’ angular disparity and dimensionality. Furthermore, the dorsal pathway should be more active than the ventral. Also, objects with a CA and 2D appearance are thought to have higher dorsal-ventral pathway activation than RA and 3D appearance.
A computer-game was designed in Unity3D gaming engine based on parity judgment tasks [25]. In contrast to previous studies, isomorphic 2D and 3D objects/models were utilized to examine the effects of dimensionality to avoid the confounding factor due to different object categories. In the gaming-task, the objects were mutually rotated at either a convex (0°–180°) or a reflex (180°–360°) angle. The dimensionality of the objects and the angular disparity were considered two independent characteristics for designing the computer-game. Four groups, each of fifteen healthy adults, participated in the study and played the game, where each group had a unique combination of angular disparity and dimensionality. EEG data were recorded for each participant before and during the gameplay using a 14-channel EEG system. We computed the cortical activations for each of the four groups using the DICS beamforming method and further parcellated the activation maps into sixty-eight functional brain regions. The regions associated with the dorsal-ventral visuospatial processing pathway and the other regions with significant activations were identified and compared.
2.1 Experimental Design and MR Gaming Task
The study design is a 2 (Angular disparity: Convex vs. Reflex) X 2(Dimensionality: 2D vs. 3D) between-groups factorial design. MR task was designed through the UNITY 3D game engine [26], and the isomorphic 2D and 3D multi-arms objects, like the previous studies [1,27], were designed using Blender's Python API (application programming interface) [28]. To use the same object in all sections, the same objects (used as 3D objects) have been used as 2D objects after eliminating their visual depth (see Fig. 2). There are four categories in the task, and each includes a specific angle range of rotation and a specific dimension of the object. In categories 1 and 2, the convex angle range (i.e., 0°–180°) of rotation has been used with 2D and 3D, respectively, called CA_2D and CA_3D. And in categories 3 and 4, reflex angle (i.e., 180°–320°) has been used in 2D and 3D, respectively, called RA_2D and RA_3D. Four angles (40°, 80°, 120°, 160°) have been taken in the convex angle range. Similarly, four angles (320°, 280°, 240°, 200°) are selected for the reflex angle range. The chosen angles in both categories are reflections of each other, i.e., 320° is the just reflection of 40° in the opposite orientation. Similarly, it is true for other angle combinations {i.e., (80°, 280°), (120°, 240°), (160°, 200°)}. Objects have 4–7 arms, and for each condition, two objects of 4 to 7 arms are used in a mixed way for each angle. Thus, there are 32 trials (8 trials for each angle of rotation) in each condition. There was no time limit for performing the task and ‘1 mark’ as the score was arranged for each correct response. All these four task conditions have been arranged in a single game paradigm for four different groups. The game was developed for the Windows platform. The gaming task had multiple successive trials, and in each trial, the player had to identify a multi-arms object presented on the left side of the monitor and from a group of five look-alike objects (distractors) on the right side. The distractors were rotated at a fixed angle. The presentation place of the correct answer on the screen was random and kept changing with each trial. To ensure the starting and ending time of the task in EEG data, markers were there in the task as a black screen, which was detectable by the stim tracker attached with the EEG setup unit to send markers. Fig. 2 shows the MR computer-game layout.

Figure 2: The MR based computer-game used in the study
2.2 Participants and Experimental Setup
Sixty healthy participants (51 male, 9 female, M = 21.6 years; SD = 3.13; range = 18–29 years) were recruited for the study and randomly assigned to four different groups, i.e., 15 participants in each group. They all reported no medical history of neurological or psychological disorders. Before starting the experiment, each of the participants gave informed consent in a format approved by the Institute Human Ethics Committee. The equal number of participants were randomly assigned to each of the four groups—CA_2D, CA_3D, RA_2D, and RA_3D each for one gaming section. All the participants received a token of thanks with a t-shirt for their voluntary participation in the study.
The experiment was conducted in an isolated and noise-free environment to avoid any possible distraction and noise to EEG. The participant was seated on a comfortable chair in front of a computer monitor with MR gaming tasks. The monitor size was 24 inches with a screen resolution of 1920 × 1080, and the distance between the monitor and the participant was approx. ∼65 cm. A 14-channel Emotiv Epoc headset with 128 Hz sampling frequency was used to acquire EEG data from 14 scalp positions—AF3, F7, F3, FC5, T7, P7, O1, O2, P8, T8, FC6, F4, F8, and AF4. Electrode placement was according to 10–20 international EEG standards. To synchronize the EEG along with the task, a Stim Tracker device from Cedrus was used.
2.3 Task Execution and Data Acquisition
All the participants voluntarily participated in the study. Participants were explained in detail about the task and the instructions of the experiment execution. Before starting the task, the placement of EEG electrodes on the participant's head was done by the experimenter. And resting-state EEG data for 5 min was recorded. All participants went through the trial session first and then executed the actual gaming task as per the group assignment. The tasks had four degrees of angular disparity in each session. Using the Stim Tracker and a photodiode pasted on display, TTL (transistor-transistor logic) triggers were generated as a marker to make the gaming synchronize with EEG recording. The task session was to be completed in a single run with a participant. There was no time limitation for the trials. However, the utilized time was shown continuously in the corner of the monitor. Fig. 3 shows the schematic diagram for experimental setup and data acquisition.

Figure 3: (a) The schematic diagram for experimental workflow, (b) setup for data acquisition
2.4 Group Design with Independent MR Parameters
For analyzing the EEG data, the recorded datasets were arranged into four groups based on the individual parameters used for the experimental design viz., angular disparity and dimensionality, as:
Group 1-CA: The participants who executed the tasks with CA with 2D/3D objects.
Group 2-RA: The participants who executed the tasks with RA with 2D/3D objects.
Group 3-2D: The participants who executed the tasks with 2D objects with CA/RA.
Group 4-3D: The participants who executed the tasks with 3D objects with CA/RA.
Each of the four groups (each with 30 subjects) was analyzed to investigate the effects of angular disparity and dimensionality conditions on EEG rhythms.
The EEG data were analyzed offline using the FieldTrip toolbox [22] and customized scripts in MATLAB® (version: 2010b). The data were first pre-processed, and the sensor level Fourier spectra were computed for all the channels. Further, a source analysis using the spectral information was applied to utilize the FieldTrip toolbox. Fig. 4 shows the analysis workflow used in the study.
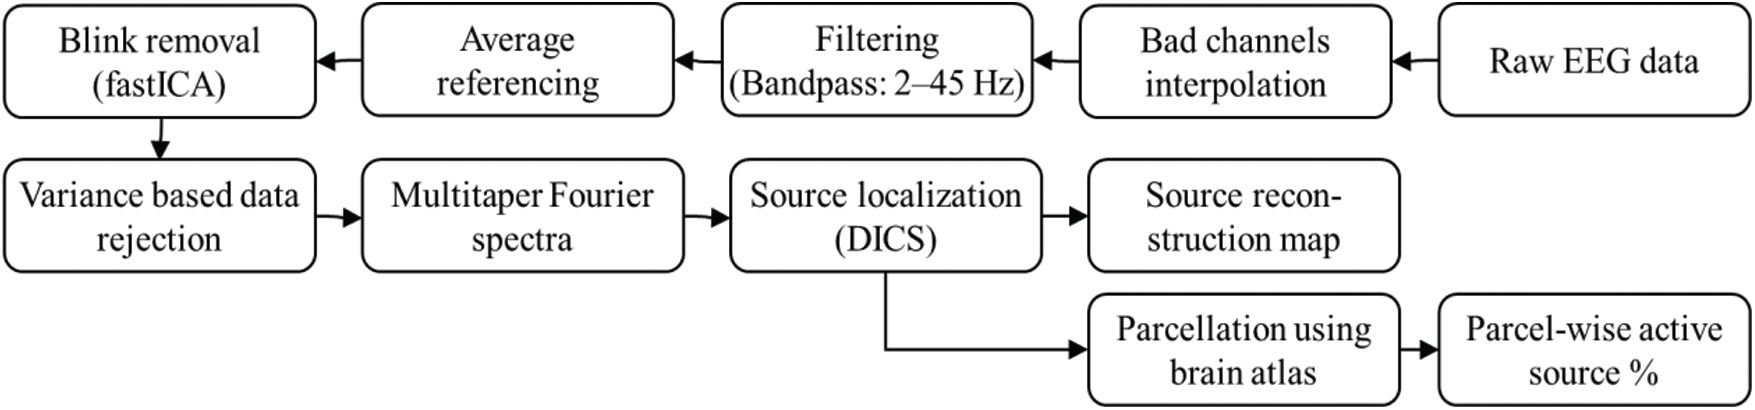
Figure 4: Analysis workflow used in the study
2.5.1 Pre-processing of the EEG Data
After reading the data, we manually checked for any existing bad EEG channels and corrected them. Since the 14-channels Emotiv EPOC system has no electrode in the parietal region, which is essential for MR studies [29,30], we interpolated EEG data for two additional positions in the centro-parietal region—CP3 and CP4; see Fig. 5a. These two positions were in very close vicinity of the recorded channels that minimize the possible interpolation error. The bad channel correction and interpolation were performed utilizing the spherical spline method [31]. It projects the sensor locations onto a unit sphere and interpolates the signals at the bad/missing sensor locations based on good quality signals at nearby locations. Thus, the data were transformed into a total of sixteen channels. The new EEG data sets were further detrended and filtered through a 2–45 Hz second-order bandpass finite impulse response (FIR) filter. The filtered data were then re-reference with the average of all the sixteen channels. We applied independent component analysis (ICA) [32] to remove the artifacts due to the eye blinks during the data acquisition. The data were decomposed into a number of individual components equal to the rank of the data. The eyeblink components were rejected based on coherence higher than 70% with AF3 and AF4 channels, and the clean signal was reconstructed using the rest of the components, which is shown in Fig. 5b. After that, the clean EEG data were segmented for baseline and gaming durations, utilizing the event markers/triggers saved during the data acquisition. Finally, the pre-processed and segmented (condition-specific) EEG data were saved for group-wise spectral analysis.
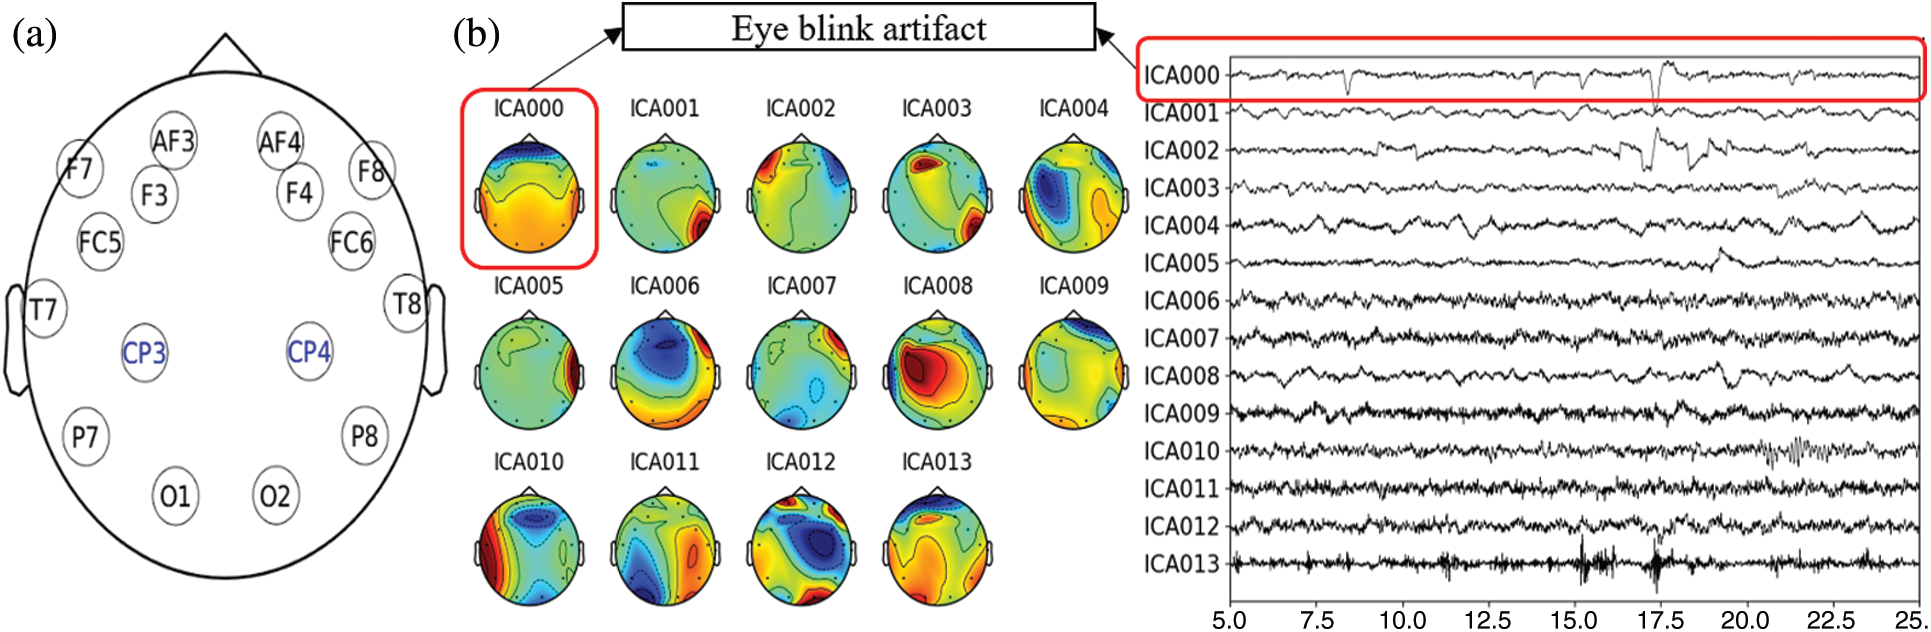
Figure 5: (a) EEG channel layout used in the study, (b) Illustration of the independent components and removed blink-artifact for arbitrarily selected data in the study
2.5.2 Computation of Sensor-Level Spectra
We computed the spectra for theta (4–7.5 Hz), alpha (7.5–13 Hz), beta (13–30 Hz), and lower gamma bands (30–45 Hz) for studying the spatio-spectral changes. An increase in frontal midline theta power with a decrease in parietal alpha power in mental rotation tasks suggests heightened visuospatial representation processing and working memory, respectively. The alpha rhythms power suppression usually reflects the higher engagement of the cortical network during mental rotation tasks [33]. The increased beta rhythm (13–30 Hz) usually indicates a reduction in mental activity. The gamma rhythm is faster than the bands mentioned above. Gamma desynchronization was previously reported during visual-perception tasks, such as perception and rotation of objects in MR [34]. The pre-processed EEG data for baseline and gaming sessions were used for spectral computation. Since the gaming session duration was for several minutes, the study is more like a resting-state recording. In such cases, the oscillatory signals are not necessarily phase-locked to the events (stimuli). Therefore, they would not be represented as event-related fields. In such resting-state studies, the power spectrum is usually considered stationary over time (during a gaming session in this study). Hence, investigators computed the spectral power for the entire duration of the gaming session and the baseline. For all the participants, spectral power density (PSD) was computed over 2–45 Hz with a frequency bin of 0.25 Hz and a sliding window length of 8 s with 50% overlapping. The multitaper method [35,36] with a single hanning taper was utilized for the frequency transformation using ft_freqanalysis. A variance-based automatic trial rejection method was used before the spectral computation to discard the windows with variance higher than the 95th percentile of the maximum variance across all the windows [37]. Thus, condition-specific (baseline and gaming session) PSD was computed for each subject's EEG data. The normalized spectra were computed by dividing the PSD from the gaming session by baseline PSD. It gives the relative change in power from the baseline to the gaming condition, usually known as relative power. Fig. 7 shows the distribution of band-specific relative power across brain regions for all four groups compared with the corresponding baseline.
To localize the sources underneath the oscillatory activity, we applied the DICS [38] beamformer techniques and represented the source reconstructed using the PCC method (Partial and Canonical Correlation; [39]). A standardized template head-model was utilized to define the volume conduction model using the boundary element method (BEM). Using the conductor model and source-model with a regular volumetric grid of approx. 3000 points fitting inside the inner skull, we further defined the forward solution [40]. The source-model and the EEG electrodes positions were aligned with the standardized colin27 template MRI [41] and further transformed to MNI (Montreal Neurological Institute) coordinate system before the forward model computation (Fig. 6). The forward model was further utilized for preparing the spatial filter in the source reconstruction.
In contrast to time-domain beamforming such as LCMV (Linearly Constrained Minimum Variance: [37,42,43]), DICS is a frequency domain beamforming method, which allows reconstruction of source activity using cross-spectral density matrix at a given frequency. The filter is based on minimizing the source power at a given location in source space, subject to ‘unit-gain constraint’. The beamforming methods generally assume that sources in different parts of the brain are temporally uncorrelated. For applying the DICS method, we first computed the Fourier spectra of 16-channels EEG for baseline and gaming session using the multitaper method with the DPSS (Discrete Prolate Spheroidal Sequences) taper. The spectra were computed over 8 s sliding window with 50% overlap. Further, the spectra for all the subjects within a group were concatenated separately for baseline and gaming sessions. The cross-spectral density C(f) was then computed using the complex Fourier spectra. Here, elements Ci,j(f) of the matrix C(f) represent the cross-spectral densities between the ith and jth channels. For a source dipole s, the DICS spatial filter Ws at frequency f is defined by Gross and colleagues [38], as:
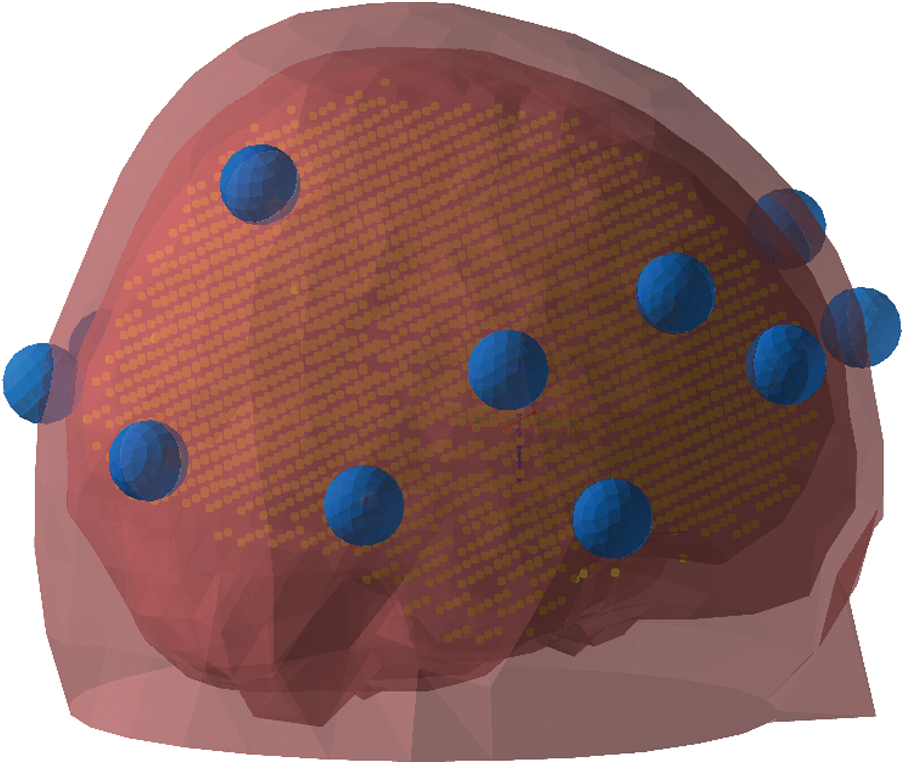
Figure 6: The volumetric source model (yellow-colored grid) and the head model (red surface) aligned with the sensor position (blue)
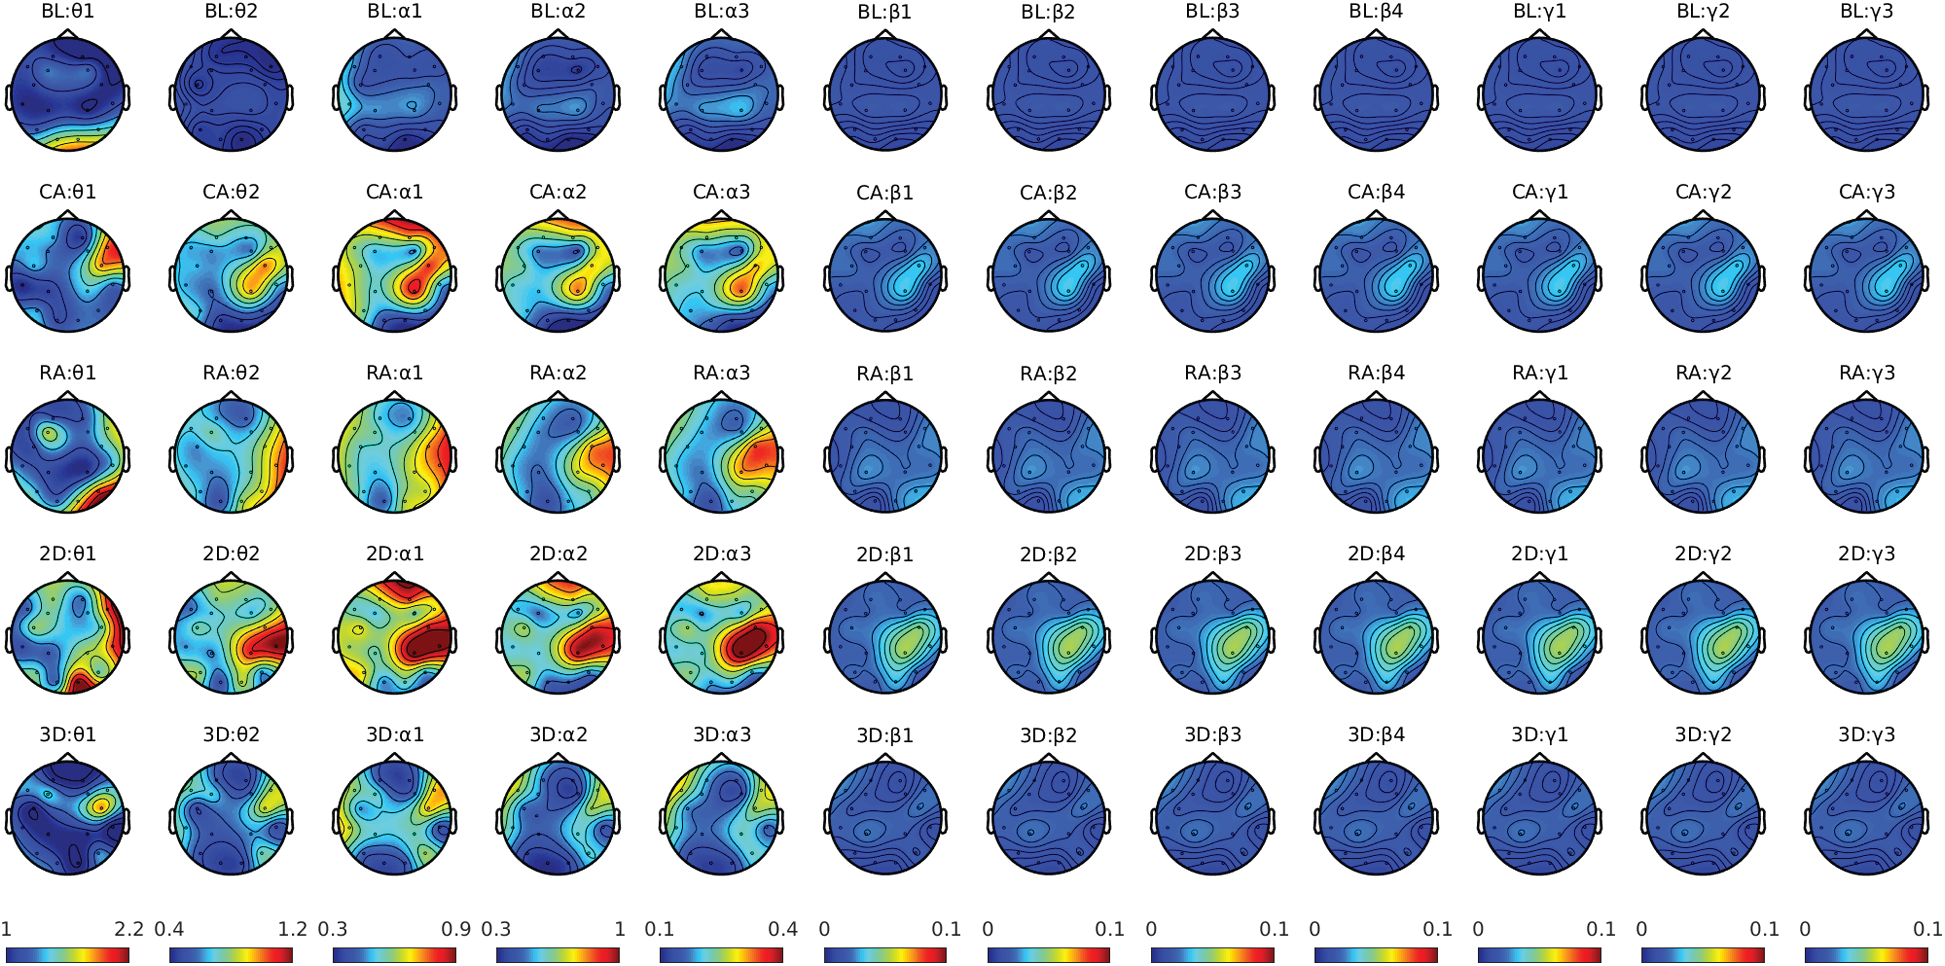
Figure 7: Condition-specific power Spectra plot for theta, alpha, beta, and gamma frequency bands
Here Ls represents the forward solution for the source s describing how it is sensed by the sensor array (EEG electrodes), and the superscript T represents its transpose. Since the spectral topography showed minimal change in the frequency range of β2 and onward (Fig. 7), we limited the source analysis to 5–17 Hz. Using the spatial filter in Eq. (1), the neural activities for each source s in the source-model were computed at θ1(4–5.75), θ2(5.75–7.5), α1(7.5–9), α2(9–11), α3(11–13), β1(13–17.25), and β2(17.25–21.5) frequency sub-bands. Thus, we produced the spatial distribution of the activations in the brain. This distribution is then interpolated with an inflated brain surface derived from colin27 template MRI and visualized. We further interpolated (mapped) the reconstructed sources over the Desikan-Kiliani atlas [44] into 68 brain regions [45]. Since the EEG data were recorded during the gaming session, which is like a resting-state, we expect quite a distributed source across the cortex rather than localized as in time-locked studies. Therefore, we fixed a threshold of 75th quantile of activities for each parcel and computed the number of sources with activity above the threshold. The percentage of active sources (voxels) in each parcel was further computed and compared for CA vs. RA and 2D vs. 3D groups.
3.1 Spectral Topographies for MR Groups
The condition-specific spectral changes from the corresponding baselines for each of the four groups were evaluated using the multitaper method. Since the DICS pipeline reconstructs the source at a single frequency (takes mean if a band is given), we first examined the power contained in the data at different frequencies. We separately plotted the PSDs for θ1(4–5.75), θ2(5.75–7.5), α1(7.5–9), α2(9–11), α3(11–13), β1(13–17.25), β2(17.25–21.5), β3(21.5–25.75), β4(25.75–30), γ1(30–35), γ2(35–40), and γ3(40–45). The figure shows significant changes only before 17 Hz; therefore, we constrained our analysis between 4–17 Hz. Fig. 8 shows the spectral changes over successive frequency bands.
Since the DICS method estimates the source activity at a single frequency, we applied it for narrower frequency bands. Fig. 8 shows the locations of reconstructed sources for different frequency sub-bands for all four groups. The reconstructed sources were plotted over the inflated cortical surface derived from the colin27 averaged brain. The figure shows only the sources with power higher than the 75th percentile. The figure shows both the left and right views for the reconstructed sources to illustrate the activation better. We further mapped the estimated sources with Desikan-Kiliani atlas and investigated each of the 68 parcels’ activities. Here we set the 75th quantile (Q3) of power as the threshold and evaluated the percentage of active sources above this threshold for each parcel. Fig. 9 shows the percentage of active sources (on Y-axis) for each of the sixty-eight parcels (on X-axis) for all four study groups. The legends/colors represent the seven frequency sub-bands.
In the study, we investigated the effects of angular disparity and dimensionality by utilizing the spatio-spectral source reconstruction from the EEG data recorded during the MR gameplay. The DICS method was used for the source reconstruction at θ, α, and β sub-bands for all the four analysis groups to evaluate the parametric effects on MR. Fig. 9 shows the percentage of the active number of sources/voxels in each of the sixty-eight brain regions at seven frequency sub-bands among the four groups. The figure shows a higher percentage of significantly active sources in the areas associated with dorsal and ventral visuospatial processing pathways. Besides the parietal region, which has been often referred in MR studies, several temporal and occipital regions associated with the dorsal-ventral pathway were also found significantly active. We also found significant activities in the frontal, central and other regions related to higher-order motor functions, planning, etc., which supports the previous findings [13,46]. The activations in these brain regions varied over frequency sub-bands.
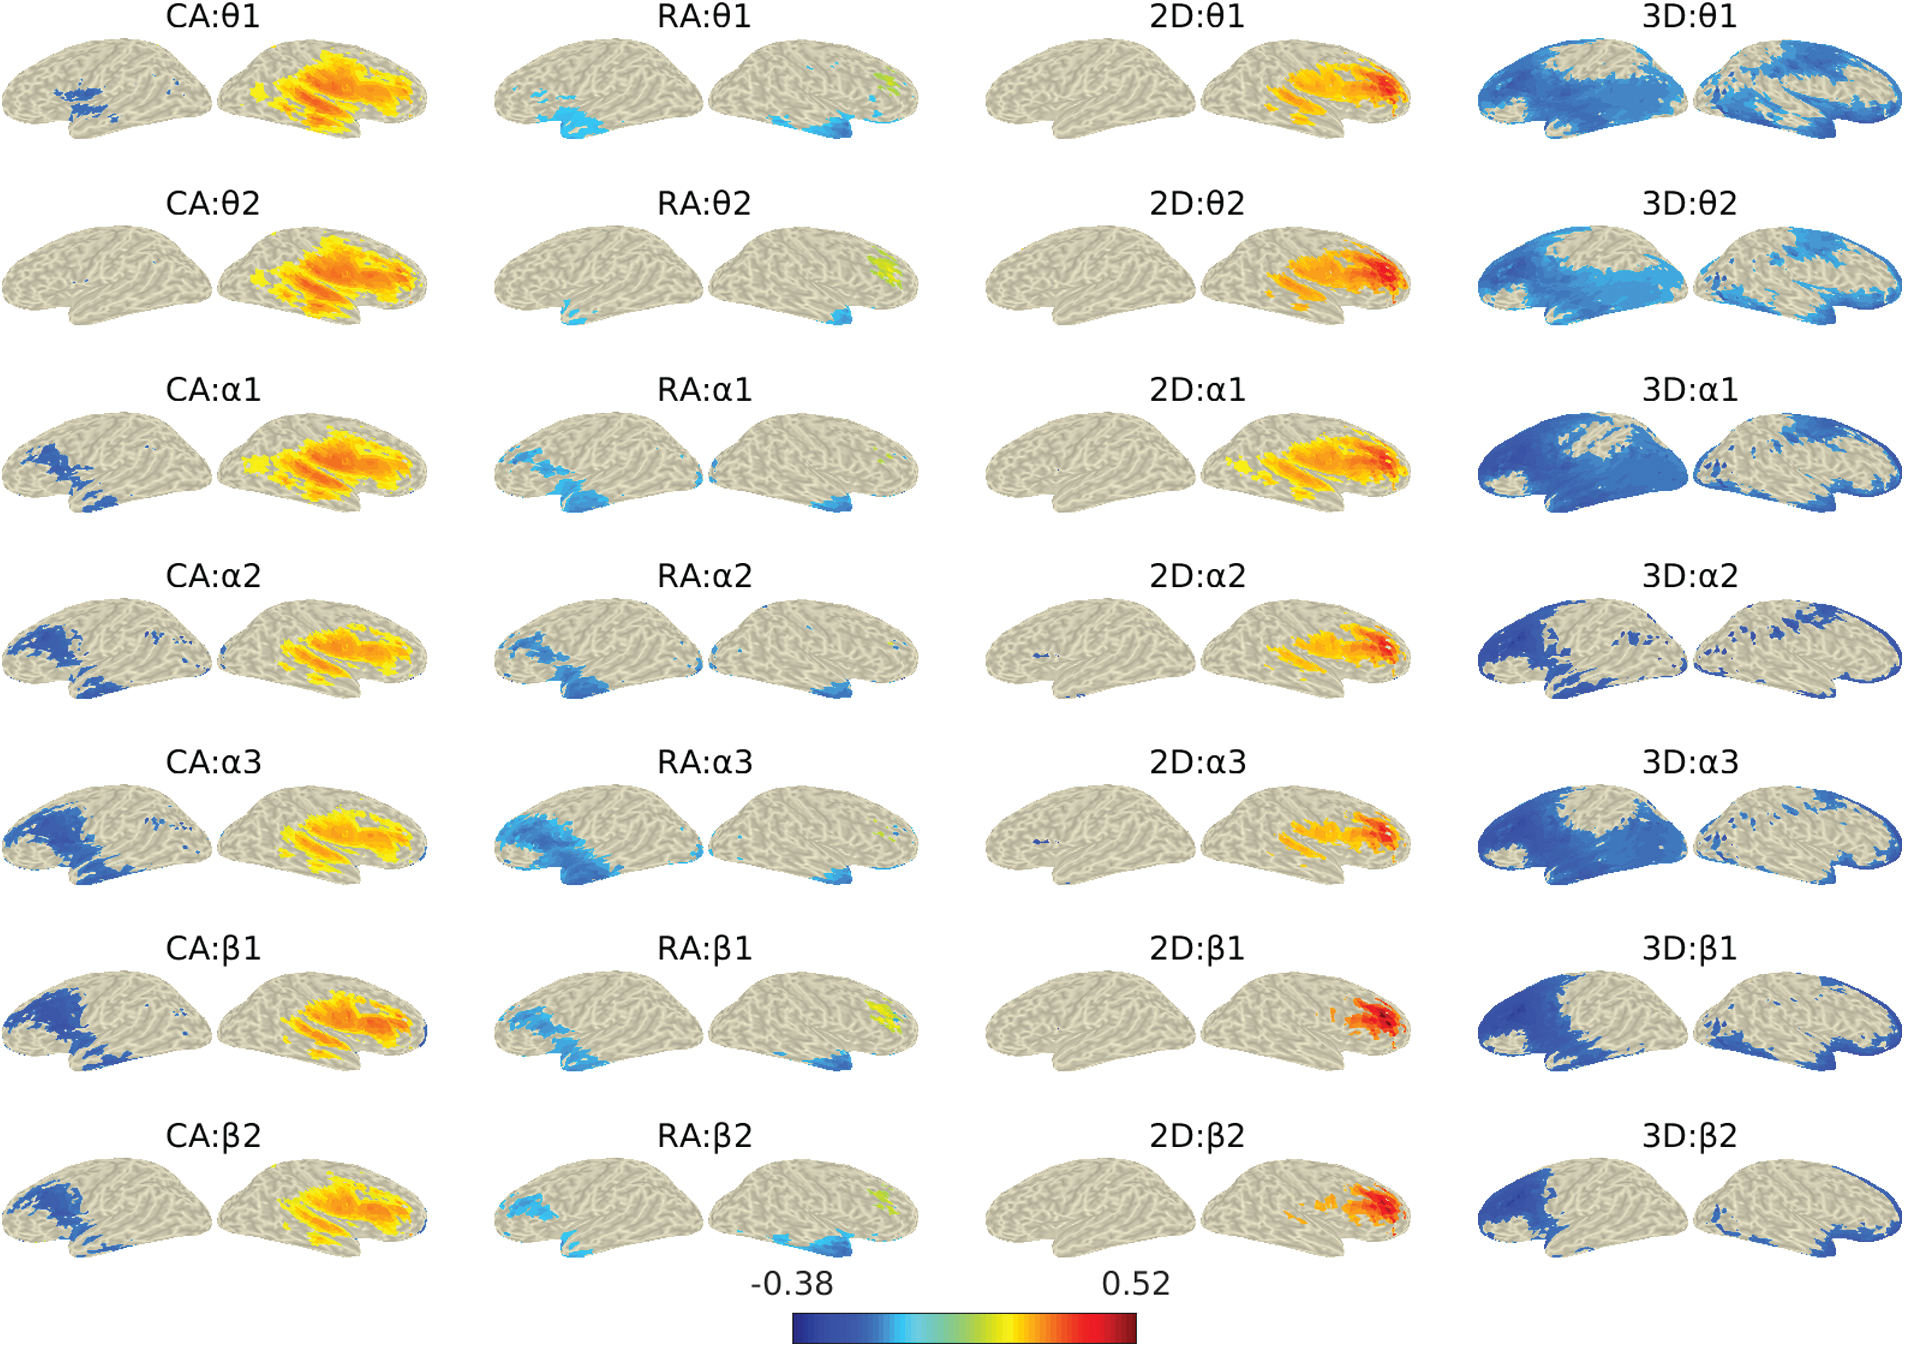
Figure 8: Neural activities for the four gaming groups during the computer-game for alpha and beta frequency sub-bands
In the dorsal pathway, activities were notable in occipital (lateral occipital cortex, cuneus), MT/V5, and parietal (precuneus, inferior and posterior parietal cortex) regions. In the occipital region, we found activations in the right lateral occipital lobule across the sub-bands, which indicate the response to encoding object parts and the spatial relationships among them [47,5]. These activations were higher in the case of CA and 2D groups compared to RA and 3D. The possible reasons could be a higher demand for encoding as 2D objects possess less spatial information to facilitate MR processing anticipation. We also observed less percentage of active sources in the left lateral occipital region at lower frequency sub-bands. The cuneus also showed a significant but a minimal number of active sources for RA and 3D groups. The middle temporal (MT/V5) region, commonly known as a higher-order visual area associated with motion-processing during visual stimuli [48], was more active for CA and 2D groups than that for the RA and 3D. The right posterior parietal cortex was found active across all four groups. However, relatively higher activations were observed in the superior lobule for the RA and 3D groups and inferior lobule for the CA and 2D groups, at all the frequency sub-bands. A comparatively lesser number of sources in the left parietal region were also found active for RA and 3D groups. While the activation in the right superior parietal lobule is associated with angular disparity [2,17], the inferior parietal activity is associated with the parity judgments in MR tasks [49]. We also observed activation in the right precuneus for RA and 3D compared to their respective counterparts. The precuneus is primarily responsible for intuitive imagery representation during MR processing [14]. Further, the bilateral supramarginal gyrus (SMG) showed significant activation for RA and 3D while the right lateral higher activation for CA and 2D groups. Here, the higher activity in SMG indicates the interaction with objects’ orientation in MR tasks. The pre-and post-central regions, previously referred for motor imagery [4,50], were found right dominating but bilaterally active for RA and 3D. These regions were observed highly right laterally active for CA and 2D groups compared to RA and 3D.

Figure 9: The labels/parcels with active sources at different frequency bands for the four groups of the MR computer-game. The labels/regions and the percentage of active sources for each parcel are shown at the X and Y-axis, respectively
The activities in lingual (occipital region), inferior temporal gyrus (temporal region) and the primary visual area indicate the engagement of the ventral pathway in the study. The lingual, also known as medial occipitotemporal gyrus, was found right laterally active for all groups with fewer active sources; however, the left lingual activity was also observed for the 3D group. The lingual activity usually refers to the encoding of complex images. Significant activities in the right inferior temporal region reflect the participation of the ventral pathway. The right laterality of this region has also been previously suggested by Carpenter and colleagues [51]. The results indicate a higher engagement in objects’ identification and processing of salient features for CA and 2D groups. Overall, the ventral pathway showed a lower number of active sources above the threshold than that of the dorsal pathway, reflecting comparatively higher engagement in spatial processing than the visual. It indicates that the participants put more effort into rotating the mental image during the MR than the object identification. The possible reason could be the images’ complexity, which required more effort to rotate their mental images.
Besides the dorsal-ventral pathway, several other brain regions were also observed active during MR parity judgment tasks. These regions were mainly associated with higher-level brain functions such as strategy selection, motor planning and decision-making. As MR utilizes different processing strategies (egocentric vs. allocentric approach or holistic vs. piecemeal approach) depending on the stimulus and task design, the active participation of the frontal region and associated motor areas has been reported in previous studies [29]. In this study, the frontal region activations were found dominantly in the right hemisphere for all the four groups, with minimal activation in the left hemisphere for RA and 3D groups. The right hemispheric middle frontal, superior frontal, and frontal pole was found active across the four groups. The middle frontal activation shows the involvement of motor areas during MR [29]. The rostral and caudal middle frontal gyri (in figure, rost middle frontal and caud middle frontal) that are associated with rotation and encoding of objects’ representation was also found active. These areas were observed higher active for CA and 2D compared to their respective counterparts, indicating that CA and 2D demand more motor processing during MR. The higher demand for processing 2D objects is due to a lack of anticipation in identification because of fewer visual features (depth). The right orbitofrontal cortices, known to be involved in decision-making [52], showed significant sources comparatively higher for CA and 2D groups, indicating more effort in decision-making. The right pars i.e., percularis, orbitalis, and triangularis (in figure, R Pars Percularis, R Pars Orbitalis and R Pars tranglrs) suggested for non-bodily stimuli were also highly active for all the groups. The pars regions in the left hemisphere were found notably active for the 3D group. The insula known to be a part of spatial processing networks in the MR tasks [50], was observed right lateral activity with higher values for CA and 2D groups. The increased anterior insula activation was also observed previously in parity judgment tasks by [3]. The superior temporal gyrus (STG) connected with the insula also showed higher activation for CA and 2D groups.
The study showed the activities in the brain areas associated with dorsal and ventral pathways for visuospatial processing during the MR computer-game. However, we found that the active sources in the regions associated with the dorsal pathway were higher than that of the ventral pathway. It indicates higher involvement of the dorsal pathway than the ventral; however, it is highly dependent on the objects/stimuli utilized. We observed that the difference in brain regions’ activities is notable among the four groups with unique visuospatial characteristics. In most active sources, the activation was higher for the groups with either CA or 2D objects. However, the recruitment of brain regions and the associated function is influenced by the strategy selected and visuospatial skill. The study showed right hemispheric dominance over θ, α, and β sub-bands; and the overall α-band activities were found more prominent among all groups. Though the study supports the previous MR studies’ findings, a higher number of EEG channels could undoubtedly reveal the findings with better spatial resolution.
The study investigated the effects of object characteristics on cortical activities in the MR process during a computer-game. The activation differences in dorsal-ventral pathways for visuospatial processing were primarily investigated along with few other higher-level processing regions. The reconstructed source activities for EEG sub-bands showed differences in several brain regions. The dorsal and ventral pathways were found active across the four groups with individual characteristics; however, the dorsal pathway was found notably more active than the ventral, indicating more spatial information processing than the visual ones. Higher activation was found for CA than RA, reflecting the complexity of information processing under CA. Similarly, as compared to 3D objects, higher activation was seen for 2D objects, indicating difficulty in information processing due to deficient visual features. The activations were observed right dominating bilateral in RA and 3D whereas almost entirely right lateral for the CA and 2D groups. Overall, a sizeable cortical network was observed involving the dorsal-ventral pathways and other regions associated with higher-order motor activities, planning, and decision-making. The findings suggest that angular disparity and dimensionality can influence the MR process in the computer-games, and the effects are also visible at the cortical level. The connection among MR object characteristics with the cortical activities also indicates their effects on cognitive skills associated with the respective brain regions. The findings may further help in developing/improving computer-games for several applications, e.g., MR training, brain entrainment. Since computer-games are becoming more and more ingrained in our daily lives, they can be used as a covert tool to entrain cognitive skills while providing entertainment. This study also has potential applicability in modelling human cognitive processes, especially visual and spatial features. It also suggests that such computer-games with individual controlled parameters may help as a therapeutic intervention for those with visuospatial deficits. Such a guided computer-game has potential for future remote gaming framework for cognitive enhancement assisted by the internet of medical things (IoMT). Furthermore, real-time physiological and performance feedback could be used to direct artificial intelligence-assisted training. Though the current study reveals several valuable insights, it also has some limitations due to fewer EEG channels and a low sampling rate. Further studies, including a larger sample size with more advanced neuroimaging methods, such as dense EEG or MEG, may help exploring a broader and more spatially resolved network associated with MR processing during computer-games.
Acknowledgement: The authors thank the participants who extended their support in performing the study. The authors would also like to thank Mr. Mrigank Krishan for his help in designing the MR gaming task used in the study.
Funding Statement: A.T. was supported by DST-INSPIRE Program sponsored by Department of Science & Technology, Government of India, Fellowship ID: IF150444, URL: https://www.online-inspire.gov.in/.
Conflicts of Interest: The authors declare that they have no conflicts of interest to report regarding the present study.
1. R. N. Shepard and J. Metzler, “Mental rotation of three-dimensional objects,” Science, vol. 171, no. 3972, pp. 701–703, 1971. [Google Scholar]
2. J. M. Zacks, “Neuroimaging studies of mental rotation: A meta-analysis and review,” Journal of Cognitive Neuroscience, vol. 20, no. 1, pp. 1–19, 2008. [Google Scholar]
3. B. Milivojevic, J. P. Hamm and M. C. Corballis, “Functional neuroanatomy of mental rotation,” Journal of Cognitive Neuroscience, vol. 21, no. 5, pp. 945–959, 2009. [Google Scholar]
4. B. Tomasino and M. Gremese, “Effects of stimulus type and strategy on mental rotation network: An activation likelihood estimation meta-analysis,” Frontiers in Human Neuroscience, vol. 9, no. 693, pp. 1–26, 2016. [Google Scholar]
5. K. C. Moen, M. R. Beck, S. M. Saltzmann, T. M. Cowan, L. M. Burleigh et al., “Strengthening spatial reasoning: Elucidating the attentional and neural mechanisms associated with mental rotation skill development,” Cognitive Research: Principles and Implications, vol. 5, no. 20, pp. 1–23, 2020. [Google Scholar]
6. H. Koshino, P. A. Carpenter, T. A. Keller and M. A. Just, “Interactions between the dorsal and the ventral pathways in mental rotation: An fMRI study,” Cognitive, Affective, & Behavioral Neuroscience, vol. 5, no. 1, pp. 54–66, 2005. [Google Scholar]
7. H. E. Schendan and C. E. Stern, “Mental rotation and object categorization share a common network of prefrontal and dorsal and ventral regions of posterior cortex,” NeuroImage, vol. 35, no. 3, pp. 1264–1277, 2007. [Google Scholar]
8. J. Norman, “Two visual systems and two theories of perception: An attempt to reconcile the constructivist and ecological approaches,” Behavioral and Brain Sciences, vol. 25, no. 1, pp. 73–144, 2002. [Google Scholar]
9. J. Metzler and R. N. Shepard, “Transformational studies of the internal representation of three-dimensional objects,” in Theories of Cognitive Psychology: The Loyola Symposium, 1st ed., United States: Lawrence Erlbaum Associates, pp. 147–201, 1974. [Google Scholar]
10. L. A. Cooper, “Mental rotation of random two-dimensional shapes,” Cognitive Psychology, vol. 7, no. 1, pp. 20–43, 1975. [Google Scholar]
11. B. Bałaj, “The influence of object complexity and rotation angle on eye movements during mental rotation,” Roczniki Psychologiczne, vol. 18, no. 4, pp. 485–503, 2015. [Google Scholar]
12. A. W. Bitar, M. M. Mansour and A. Chehab, “Algorithmic optimizations in the HMAX model targeted for efficient object recognition,” Computer Vision, Imaging and Computer Graphics Theory and Applications, Springer, vol. 598, pp. 374–395, 2016. [Google Scholar]
13. P. A. Carpenter, M. A. Just, T. A. Keller, W. Eddy and K. Thulborn, “Graded functional activation in the visuospatial system with the amount of task demand,” Journal of Cognitive Neuroscience, vol. 11, no. 1, pp. 9–24, 1999a. [Google Scholar]
14. B. Suchan, L. Yágüez, G. Wunderlich, A. G. Canavan and H. Herzog, “Neural correlates of visuospatial imagery,” Behavioral Brain Research, vol. 131, no. 1–2, pp. 163–168, 2002. [Google Scholar]
15. K. Jordan, T. Wüstenberg, H. J. Heinze, M. Peters and L. Jäncke, “Women and men exhibit different cortical activation patterns during mental rotation tasks,” Neuropsychologia, vol. 40, no. 13, pp. 2397–2408, 2002. [Google Scholar]
16. A. Nikolaev, “Brain rhythms related to mental rotation,” in Neuronal Bases and Psychological Aspects of Consciousness, vol. 8. Singapore: World Scientific Publishing Co. Pte Ltd., pp. 361–366, 1999. [Google Scholar]
17. C. Rorden and H. O. Karnath, “Using human brain lesions to infer function: A relic from a past era in the fMRI age?,” Nature Reviews Neuroscience, vol. 5, no. 10, pp. 812–819, 2004. [Google Scholar]
18. J. M. Zacks, J. M. Vettel and P. Michelon, “Imagined viewer and object rotations dissociated with event-related Fmri,” Journal of Cognitive Neuroscience, vol. 15, no. 7, pp. 1002–1018, 2003. [Google Scholar]
19. C. Quaiser-Pohl, S. Neuburger, M. Heil, P. Jansen and A. Schmelter, “Is the male advantage in mental-rotation performance task independent? on the usability of chronometric tests and paper-and-pencil tests in children,” International Journal of Testing, vol. 14, no. 2, pp. 122–142, 2014. [Google Scholar]
20. N. VanMeerten, K. Varma, M. Gravelle, N. Miller, E. Kraikul et al., “Evidence of a relationship between mental rotation skills and performance in a 3D puzzle game,” Frontiers in Education, vol. 4, no. 82, pp. 1–6, 2019. [Google Scholar]
21. A. C. Oei and M. D. Patterson, “Enhancing cognition with video games: A multiple game training study,” PLOS One, vol. 8, no. 3, pp. 1–16, 2013. [Google Scholar]
22. R. Oostenveld, P. Fries, E. Maris and J. M. Schoffelen, “Fieldtrip: Open-source software for advanced analysis of MEG, EEG, and invasive electrophysiological data,” Computational Intelligence and Neuroscience, vol. 2011, no. 156869, pp. 1–9, 2011. [Google Scholar]
23. S. Bhattacharya, P. K. R. Maddikunta, Q. V. Pham, T. R. Gadekallu, C. L. Chowdhary et al., “Deep learning and medical image processing for coronavirus (COVID-19) pandemic: A survey,” Sustainable Cities and Society, vol. 65, no. 102589, 2021. [Google Scholar]
24. T. R. Gadekallu, T. R. Gadekallu, D. S. Rajput, M. P. K. Reddy, K. Lakshmanna, S. Bhattacharya et al., “A novel PCA–whale optimization-based deep neural network model for classification of tomato plant diseases using GPU,” Journal of Real-Time Image Processing, In press, 2020. https://doi.org/10.1007/s11554-020-00987-8. [Google Scholar]
25. A. Tiwari, R. B. Pachori and P. K. Sanjram, “Isomorphic 2D/3D objects and saccadic characteristics in mental rotation,” Computers, Materials & Continua, in press, 2021. [Google Scholar]
26. J. Haas, “A history of the unity game engine,” Dissertation, Worcester Polytechnic Institute, United States, 2014. [Google Scholar]
27. S. G. Vandenberg and A. R. Kuse, “Mental rotations, a group test of three-dimensional spatial visualization,” Perceptual and Motor Skills, vol. 47, no. 2, pp. 599–604, 1978. [Google Scholar]
28. B. O. Community, “Blender—A 3D modelling and rendering package,” Stichting Blender Foundation, Amsterdam, 2018. [Online]. Available: http://www.blender.org. [Google Scholar]
29. M. S. Cohen, S. M. Kosslyn, H. C. Breiter, G. J. DiGirolamo, W. L. Thompson et al., “Changes in cortical activity during mental rotation a mapping study using functional MRI,” Brain, vol. 119, no. 1, pp. 89–100, 1996. [Google Scholar]
30. K. Jordan, H. J. Heinze, K. Lutz, M. Kanowski and L. Jäncke, “Cortical activations during the mental rotation of different visual objects,” NeuroImage, vol. 13, no. 1, pp. 143–152, 2001. [Google Scholar]
31. F. Perrin, J. Pernier, O. Bertrand and J. F. Echallier, “Spherical splines for scalp potential and current density mapping,” Electroencephalography and Clinical Neurophysiology, vol. 72, no. 2, pp. 184–187, 1989. [Google Scholar]
32. A. Hyvarinen, “Fast and robust fixed-point algorithms for independent component analysis,” IEEE Transactions on Neural Networks, vol. 10, no. 3, pp. 626–634, 1999. [Google Scholar]
33. A. L. Gardony, M. D. Eddy, T. T. Brunyé and H. A. Taylor, “Cognitive strategies in the mental rotation task revealed by EEG spectral power,” Brain and Cognition, vol. 118, pp. 1–18, 2017. [Google Scholar]
34. M. Thomas, M. Dalecki and V. Abeln, “EEG coherence during mental rotation of letters, hands and scenes,” International Journal of Psychophysiology, vol. 89, no. 1, pp. 128–135, 2013. [Google Scholar]
35. D. B. Percival and A. T. Walden, “Spectral Analysis for Physical Applications,” 1st ed., Cambridge, United Kingdom: Cambridge University Press, pp. 1–545, 1993. [Google Scholar]
36. P. P. Mitra and B. Pesaran, “Analysis of dynamic brain imaging data,” Biophysical Journal, vol. 76, no. 2, pp. 691–708, 1999. [Google Scholar]
37. A. Jaiswal, J. Nenonen, M. Stenroos, A. Gramfort, S. S. Dalal et al., “Comparison of beamformer implementations for MEG source localization,” NeuroImage, vol. 216, no. 116797, pp. 1–15, 2020. [Google Scholar]
38. J. Gross, J. Kujala, M. Hämäläinen, L. Timmermann, A. Schnitzler et al., “Dynamic imaging of coherent sources: Studying neural interactions in the human brain,” Proceedings of the National Academy of Sciences, vol. 98, no. 2, pp. 694–699, 2001. [Google Scholar]
39. J. M. Schoffelen and J. Gross, “Source connectivity analysis with MEG and EEG,” Human Brain Mapping, vol. 30, no. 6, pp. 1857–1865, 2009. [Google Scholar]
40. M. Fuchs, J. Kastner, M. Wagner, S. Hawes and J. S. Ebersole, “A standardized boundary element method volume conductor model,” Clinical Neurophysiology, vol. 113, no. 5, pp. 702–712, 2002. [Google Scholar]
41. C. J. Holmes, R. Hoge, L. Collins, R. Woods, A. W. Toga et al., “Enhancement of MR images using registration for signal averaging,” Journal of Computer Assisted Tomography, vol. 22, no. 2, pp. 324–333, 1998. [Google Scholar]
42. B. D. Van Veen, W. Van Drongelen, M. Yuchtman and A. Suzuki, “Localization of brain electrical activity via linearly constrained minimum variance spatial filtering,” IEEE Transactions on Biomedical Engineering, vol. 44, no. 9, pp. 867–880, 1997. [Google Scholar]
43. K. Sekihara, K. E. Hild and S. S. Nagarajan, “A novel adaptive beamformer for MEG source reconstruction effective when large background brain activities exist,” IEEE Transactions on Biomedical Engineering, vol. 53, no. 9, pp. 1755–1764, 2006. [Google Scholar]
44. R. S. Desikan, F. Ségonne, B. Fischl, B. T. Quinn, B. C. Dickerson et al., “An automated labeling system for subdividing the human cerebral cortex on MRI scans into gyral based regions of interest,” NeuroImage, vol. 31, no. 3, pp. 968–980, 2006. [Google Scholar]
45. M. Senden, N. Reuter, M. P. van den Heuvel, R. Goebel, G. Deco et al., “Task-related effective connectivity reveals that the cortical rich club gates cortex-wide communication,” Human Brain Mapping, vol. 39, no. 3, pp. 1246–1262, 2018. [Google Scholar]
46. E. C. Leek, K. S. Yuen and S. J. Johnston, “Domain general sequence operations contribute to pre-sMA involvement in visuo-spatial processing,” Frontiers in Human Neuroscience, vol. 10, no. 9, pp. 1–13, 2016. [Google Scholar]
47. G. Erdogan, Q. Chen, F. E. Garcea, B. Z. Mahon and R. A. Jacobs, “Multisensory part-based representations of objects in human lateral occipital cortex,” Journal of Cognitive Neuroscience, vol. 28, no. 6, pp. 869–881, 2016. [Google Scholar]
48. J. Gao, M. Zeng, X. Dai, X. Yang, H. Yu et al., “Functional segregation of the middle temporal visual motion area revealed with coactivation-based parcellation,” Frontiers in Neuroscience, vol. 14, no. 427, pp. 1–14, 2020. [Google Scholar]
49. B. Alivisatos and M. Petrides, “Functional activation of the human brain during mental rotation,” Neuropsychologia, vol. 35, no. 2, pp. 111–118, 1997. [Google Scholar]
50. G. Cona and C. Scarpazza, “Where is the “where” in the brain? a meta-analysis of neuroimaging studies on spatial cognition,” Human Brain Mapping, vol. 40, no. 6, pp. 1867–1886, 2019. [Google Scholar]
51. P. A. Carpenter, M. A. Just, T. A. Keller, W. F. Eddy and K. R. Thulborn, “Time course of fMRI-activation in language and spatial networks during sentence comprehension,” NeuroImage, vol. 10, no. 2, pp. 216–224, 1999. [Google Scholar]
52. M. L. Kringelbach, “The human orbitofrontal cortex: Linking reward to hedonic experience,” Nature Reviews Neuroscience, vol. 6, no. 9, pp. 691–702, 2005. [Google Scholar]
 | This work is licensed under a Creative Commons Attribution 4.0 International License, which permits unrestricted use, distribution, and reproduction in any medium, provided the original work is properly cited. |