DOI:10.32604/cmc.2022.020336
| Computers, Materials & Continua DOI:10.32604/cmc.2022.020336 | |
| Article |
Earthquake Risk Assessment Approach Using Multiple Spatial Parameters for Shelter Demands
1Big Data Research Center, Jeju National University, Jeju, 63243, Korea
2Department of Computer Engineering, Jeju National University, Jeju, 63243, Korea
3Infomind, Jeju, 63243, Korea
*Corresponding Author: Dohyeun Kim. Email: kimdh@jejunu.ac.kr
Received: 20 May 2021; Accepted: 23 June 2021
Abstract: The earthquake is considered one of the most devastating disasters in any area of the world due to its potentially destructive force. Based on the various earthquake-related parameters, the risk assessment is enabled in advance to prevent future earthquake disasters. In this paper, for providing the shelter space demands to reduce the damage level and prevention costs, an earthquake risk assessment approach is proposed for deriving the risk index based on multiple spatial parameters in the gridded map. The proposed assessment approach is comprised of pre-processing, methodology model, and data visualization. The risk index model derives the earthquake risk index by multiple spatial parameters including indexes of earthquake, danger, shelter, and building for blocks in the quantitative gridded map. The parameters are provided based on mathematical models and combined with the risk index that presents the earthquake risk assessment result for each block. Therefore, the gridding approach is proposed to provide the elements of the risk assessment area that are used in the spatial parameters. The gridded map is developed for the selected area to visualize risk index parameters associated with each risk zone. Based on the derived result of the proposed earthquake risk index model, emergency shelter requirements are provided according to the risk index for each location, which supports safety measures in advance to prevent future earthquake disasters.
Keywords: Risk analysis; risk index; earthquake; shelter demand; data analysis
In recent years, reducing earthquake risk and improving capacities is one of the main concerns of the global disaster management authorities to respond to the potential impacts of earthquakes [1–3]. The impacts of earthquake disasters continue to increase all around the world, so most experts are agreed to focus on post-event response, which has become more effective and efficient to plan safety measures [4]. The earthquake activity suddenly occurred, where residents are not alerted to prevent a natural disaster. Hence, it often causes huge damage to buildings, fatalities, and economic loss. Different strategies can be considered into account to mitigate earthquake disasters based on risk assessment models. The risk mitigation measures and planning of safety measures for the earthquake disasters in advance have gained interest in both scientific and practitioner communities to prevent earthquake disasters. The Risk Index (RI) analysis model is an important way to reduce fatalities and economic loss. Both risk analysis and management are used to analyze and survey the effects caused by the earthquake and also propose estimation approaches to reduce human causalities and economic losses [5–7]. The initial estimation of the emergency shelter demands, building damages, potential fatalities based on the earthquake capacity, and the area is one of the major pre-requisites for the administration and ensuring safety measures. Because all these estimation indexes are used as important tools in earthquake disaster rescue operations, which can be effective and useful for an immediate response and long-term measures [8,9]. The approach is effective to plan and estimates the earthquake shelter index in advance to reduce the damage caused by the earthquake disasters and also ensure safety measures to prevent residents [10]. Before, the disasters unfold, identification and provision of the areas for emergency shelter and the population capacity are important to improve response processes [11–13]. Nevertheless, most of the disasters are difficult to prevent although a huge amount of data is available.
Different analysis and estimation models have been developed to estimate the earthquake risk in advance to prevent the natural disaster based on the vulnerability of building and post-earthquake data to assess and estimate human life losses [14–17]. A vulnerability index-based model was developed to estimate damages caused by the earthquake disaster, such as social and economic damages [18]. An earthquake fatalities assessment method developed to analyze and estimate the potential fatalities based on affected parameters [19]. Another study presented in [20], that proposes a model to plan shelter demands based on the historical earthquake data to prevent the earthquake disaster. The proposed approach is focused on developing an earthquake risk index model based on multiple parameters to estimate Risk Index (RI) in advance to reduce fatalities and economic loss. Earthquake formation is one of the most complex geological phenomena, which occurs on the surface of the earth due to the following parameters, such as tectonic movements inside the earth's crust, volcanic eruptions, and the change of soil [21]. All of these earthquake causes can damage buildings or collapse of buildings, loss of human life or human injuries, and extensive economic loss, etc. The earthquake disaster also affects natural environmental conditions, known as earthquake environmental effects (EEEs) [22]. Considering all these effects caused by the earthquake disaster can damage property, loss of life, and also alter the natural environment as well [23]. Therefore, it is required to develop a risk index model to estimate the earthquake risk index, which would enable the administration and local communities to ensure safety measures in advance to prevent earthquake disasters.
In this paper, we propose an earthquake risk assessment approach to derive the earthquake risk index based on multiple parameters, such as earthquake index, danger index, shelter index, and building index for providing the shelter space demands to reduce the damage level and prevention costs. The earthquake dataset contains post-earthquake data, such as earthquake, shelter, damage, and danger data. The main objective of the proposed model is to define four different parameters to estimate the risk index associated with each parameter according to its high related hazards to plan shelter requirements. First, the earthquake index is defined to assess the risk index of the earthquake occurrences in advance based on historical data of the local province. Second, the danger index is defined to assess tremendous damage and potential fatalities caused by the extreme earthquake occurrences in the selected area in the past, which allows administration and communities to prepare safety measures in advance. Third, the shelter index is defined based on the following parameters, such as area and capacity to estimate the demand for shelters provided by the earthquake administration. Fourth, the building index is defined to assess the damage capacity of the buildings caused by earthquake disasters to estimate economic loss and shelter capacity. Based on the proposed model, the risk index associated with each parameter can be assessed, estimated, and visualized. The quantitative gridded map in the study area was developed to visualize risk zones and also visualize risk index parameters based on risk zones to estimate the risk index for each risk zone.
The rest of the paper is structured as follows. Section 2 presents the introduction of existing works and background information related to the proposed earthquake risk index model. Section 3 presents the proposed earthquake risk index model data preprocessing, parameters definition and details of the risk index model. Section 4 presents the earthquake dataset and its parameters. Section 5 presents the implementation and experimental results of the proposed earthquake risk index model based on multiple parameters using the gridded map. Section 6 concludes the proposed model and future directions are also discussed.
In this section, we present the literature review and background study for the assessment of the earthquake risk index based on the historical earthquake dataset. Different analyses and estimations models have been developed for the assessment of earthquake risk. Most research studies used empirical analysis methods to estimate and assess the risk for the earthquake data [24–26]. In this study, our main focus is to analyze earthquake data for risk index based on multiple risk index parameters, i.e., earthquake index, danger index, shelter index, and building index. In [27], the authors proposed an earthquake model to assess the earthquake risk of the Blida city (Algeria) using a Graphical Information System (GIS). The author used the Vulnerability Index (VI) method to calculate vulnerability indexes of the buildings using software known as the Vulnerability Index Program (VIP) [28]. The rates of damage are also determined and calculated for the defined scenario, which emphasizes VI of the selected cities [29]. The damages caused by the earthquake were assessed using seismic vulnerability functions. Also, the authors performed a spatial analysis to visualize highly vulnerable zones to locate the following parameters geographically, i.e., building structures and their topology, the total number of floors, and rates of damage. In another similar study presented in [30], the authors developed several models for earthquake data analysis and estimation of earthquake damage rates and also investigated vulnerability for the limited area of Iran through statistical methods.
In [31], the authors developed a GIS-based multicriteria analysis model to assess and analyze urban vulnerability index to earthquakes through a spatial analysis method. In this work, areas with high vulnerability zones were located and then found differences between high vulnerability and other areas within a defined urban region. Based on these differences, the relative importance of the ecological factors improved. In another similar study presented in [32], the authors developed a holistic model for assessing earthquake risk and determining safety measures for risk reduction to support decision-makers and risk disaster management in urban areas. In this work, the authors introduced a new indicator known as the Integrated Earthquake Safety Index (IESI) to measure the safety level of the earthquake and then analyze and assess the impacts of the applicable intervention on risk. To evaluate the safety level for defined urban regions, the authors assessed and analyzed all contributing elements or parameters such as hazard, vulnerability, and response time based on defined local conditions and IESI values are determined for each urban region zone. Also, many earthquake risk assessment solutions are proposed such as Earthquake Disaster Risk Index (EDRI) [33] that is used for estimating risk based on seismic hazards and vulnerability, and SYNER-G project [34] that considers vulnerability and loss as well as socio-economic parameters to deliver the risk assessment. ith sufficient data, the relevant software packages, such as Risk-UE [35] and SELENA [36] are enabled for estimating the seismic risk and its impacts. Yeh et al. [37] proposed an approach to provide the determinants of the earthquake risk based on seismic hazard, exposure of population and fragile buildings, and demographic and socioeconomic vulnerability that result in all components have an explicit impact on the specific dimension for the earthquake risk.
Moreover, in further work, the authors proposed a comprehensive methodology to estimate the relative seismic risk among urban zones using less data and information through the definition of new evaluation approaches [38]. In [39], the authors proposed an earthquake disaster risk index that can be considered as a pioneer model to apply to all major seismically active cities of the world. The model is comprised of comprehensive approaches based on multiple perspectives of risk and vulnerability. However, in [40], the proposed model is not sufficient for reflecting the real seismic potential of a city fully because various parameters are not considered such as capacity. However, the parameter capacity is addressed in [41–44] for the earthquake risk assessment based on resiliency parameters. In another study presented in [45], the authors presented a model to assess the factors influencing levels of potential fatalities from various types of natural hazards using the Disaster Risk Index (DRI) to monitor the evolution of risk and also assessing and classifying countries based on high risk. The authors also used GIS to model all four natural hazards, such as floods, earthquakes, cyclones, and droughts, with the population distribution model to extract human exposure. The ML-based framework is proposed to assess and analyze post-earthquake structural safety. In this work, the authors introduced the concept of response and damaged patterns to generate robust data in a systematic way for post-earthquake building analysis. The authors used the incremental dynamic analysis to evaluate the damage capacity of the buildings. The authors used ML techniques to map the patterns to the structural safety state of the building based on defined threshold values.
3 Proposed Earthquake Risk Index Model
This section presents the proposed methodology of the earthquake risk index model. For providing the earthquake risk index, a novel earthquake risk index model is developed to estimate the risk index based on multiple parameters using a gridded map. The following parameters are considered and evaluated to estimate the earthquake risk index, such as earthquake index, danger index, shelter index, and building index. The proposed earthquake RI model is provided through the steps including the collection of earthquake dataset, data preprocessing, modeling risk index based on parameters, and data visualization. The hierarchical architecture of the proposed earthquake RI model is presented in Fig. 1.

Figure 1: Hierarchical architecture for the proposed earthquake data analysis
The main objective of the proposed model is to assess and estimate the earthquake risk index based on historical data to allow administration and communities to prepare safety measures in advance to prevent damages (e.g., potential fatalities, economic loss, buildings collapse, etc.) caused by the earthquake disasters. It would also allow the administration authorities to estimate emergency shelter requirements in advance, which aims to minimize construction costs and maximize the coverage area to prevent potential fatalities and other damages caused by earthquake disasters. The quantitative gridded map in the study area is also developed to visualize risk zones and also visualize risk index parameters based on risk zones to estimate risk index for each risk zone.
After the collection of the earthquake dataset, it is required to preprocess the raw dataset into an appropriate form for further processing [46–48]. In this work, we identified and re-moved outliers and other encoded strings to clean the dataset for further processing. We performed the following steps to clean and remove irrelevant data features to increase the reliability of the data set. For the data preprocessing, we removed all irrelevant and static features from the raw data to include only the most promising features of the dataset. We identified and removed duplicate records from the dataset. Also, missing values attributes are identified and used central tendency (mean, median) as a standard measure to fill missing values [49]. All irrelevant and static attributes (features) are removed to reduce processing costs and increase the reliability of the dataset.
Data fusion is an important process to retrieve and combine data from multiple heterogeneous data sources to produce accurate, consistent, and valuable information than that provided by any single data source [50]. The complete integration of the data from different sources provides trusted and unified data. The main objective of the data fusion process is to integrate data from multiple sources to produce consistent and unified data. In this work, we integrated data (data fusion) from multiple sources to increase the accuracy and consistency of the dataset. The following data are integrated, such as earthquake, building, danger, and shelter data, to prepare a unified dataset for further processing. This work focuses on investigating and developing data fusion of features and decision levels for earthquake risk index models.
To select approximate risk zone coordinates, all those earthquake records are removed, which don't have location coordinates values. Finally, the approximate location coordinates are selected to visualize the RI through risk zones based on a developed gridded map.
3.2 Parameters for Risk Index Model
After the preprocessing of the earthquake dataset, it is required to define and analyze RI parameters such as earthquake index, danger index, shelter index, and building index. The proposed earthquake model estimates the RI associated with each parameter according to its high related hazards.
Fig. 2 shows the proposed gridded map for the earthquake risk index that evaluates the risk of a block in the gridded map. The proposed model used the Local province of the Republic of Korea as an example to develop a scenario. Therefore, we develop a quantitative gridded map for the selected area to visualize risk zones and risk index parameters associated with each risk zone on the map. The cartesian coordinates are used to define locations in gridded maps. Gridlines are used to assign a unique number to each grid (location) on a map based on location coordinates. In this work, we developed a gridded map to visualize risk zones and also associated risk index parameters on the map. The following points

Figure 2: Proposed gridded map for earthquake risk index
Eq. (1) presents parameters of scale and indexes for elements of the gridded map. The gridded map is divided into 1000 blocks, which cover the entire experimental area. In vertical, the map is divided into 20 parts and divided into 50 parts in horizontal.
where
For calculating points of the blocks in the gridded map,
where “
For calculating the center of a block, “C” is calculated based on P. The center C is defined through Eqs. (7) and (8). Each center of a block is calculated through Eqs. (9) and (10).
where n is an integer and given a value between 0 and
Fig. 3 depicts the risk index model structure. The risk index model structure consists of the following four indexes, such as earthquake index, danger index, shelter index, and building index. The earthquake index model is used to define earthquake index based on the following two parameters, such as earthquake level and

Figure 3: Proposed risk index model structure
For calculating risk index multiple elements including earthquake, danger, shelter, and building, Eqs. (11)–(15), are proposed based on parameters of proposed elements.
Eq. (11) is used for calculating earthquake index where the location of the earthquake and block centers are used with the level of earthquake. Earthquake Index is calculated as the sum of distance and seismic intensity from one point to several earthquake points near Local Island. Here, the earthquake index is inversely proportional to the distance to the earthquake location and is directly proportional to the seismic intensity. The higher level of the earthquake and the smaller distance of block center and earthquake locations affect the earthquake index to be increased. Therefore, the equation of earthquake index is defined through the divine of earthquake level and distance. The total sum of the divined values is given to the earthquake index of a block.
Eq. (12) is used for calculating the danger index that is given by the count of danger locations. The Danger Index is the number of risk points included in a particular area. Here, the more risk points included within a zone, the larger the risk index and the smaller each risk. Here, the danger point refers to a place to be a risk factor in case of an earthquake such as an LPG dealer, a gas station, or a hazardous substance office, and the raw data of the risk point index is converted into a value between 0 and 1 through normalization.
Eq. (13) is used for calculating the shelter index which is given by the total sum of area and capacity. The Shelter Index is calculated by summing the total area and capacity of all shelters contained within a specific area. The area and capacity of the shelter are proportional to the shelter index, and the raw data of the shelter index are converted from 0 to 1 through normalization.
Eq. (14) is used for calculating the building index, which is derived by summing up the total area of the evaluable buildings and the capacity of human resources in the event of an earthquake within a certain area. Here, the area of the evacuated building and the number of people is proportional to the evacuated building index, and the raw data of the evacuated building index are converted from 0 to 1 through normalization.
Eq. (15) is used for calculating the risk index that is comprised of indexes of earthquake, danger, shelter, and building. The earthquake risk index can be calculated by adding the earthquake index and the risk point index, which are negative factors to the earthquake, and then adding the positive shelter index and the evacuation building index. The larger the earthquake risk index, the higher the risk of an earthquake, and the lower, the lower the earthquake risk. Therefore, for the safety of citizens in the event of an earthquake, it is possible to determine whether to add evacuation in a specific area through the earthquake risk index. The higher values of earthquake and danger indexes affect the risk index to be increased. Instead, higher values of shelter and building indexes affect the risk index to be decreased.
4 Data Presentation of Parameters
This section presents data processing and presentation phases. For developing earthquake risk index model, we collected the earthquake dataset from the Local province, the Republic of Korea. The following dataset contains earthquake data from 2000 to 2019. The map is processed into a grided map that include blocks to represent the locations. Each block center is comprised of location coordinates, such as latitude and longitude. The location coordinates are used to represents each defined block center in the gridded map. The block centers are used along with earthquake levels to calculate the earthquake index. The location coordinates are also used to calculate the distance between defined block centers. A block with a small distance can affect the earthquake index to be increased.
Fig. 4 presents coordinates data of earthquake locations. The earthquake and center of the block are defined based on location coordinates, such as latitude and longitude. The red circle indicates the location of the earthquake, and the black circle indicates the center of the block. It can be observed that earthquake locations have the highest frequency in the selected area. Both locations of earthquake and center of block values are used to calculate earthquake index. The earthquake locations and smaller distance of the center of the block affect the earthquake index to be increased. The earthquake level (magnitude scale) is defined based on two different criteria, such as potential fatalities and economic loss. In this work, the following statistical measures are used, such as minimum, maximum, and average. The minimum level of the earthquake for the proposed earthquake risk index is 1.1, and the maximum level of the earthquake is 5.8. In our collected dataset, the average value of the earthquake level is 2.6.
Fig. 5 presents coordinates data of dangerous locations. Each danger location is defined based on location coordinates. The dot is used to represents the center of the block. The danger index is calculated by counting all danger locations in the selected area. The overall count of the danger locations in the selected area leads to calculating the danger index to prevent future earthquake disasters in advance.

Figure 4: Coordinates data of earthquake locations

Figure 5: Coordinates data of dangerous locations
Fig. 6 presents the coordinates data of shelter locations. Each shelter location is visualized based on the location coordinates, such as latitude and longitude. The higher values of the shelter index affect the overall risk index to be decreased. In the shelter area dataset, the minimum value of the shelter area is 500-meter square, and the maximum value is 485,643-meter square. The average value of the shelter area is 18,408-meter square. These values are used to provide a statistical representation of the shelter area values, which can help in a better understanding of the dataset. We identified and removed all outliers from the dataset for increasing the reliability of the dataset. Based on statistical measures, it is found that the minimum, maximum, and average values of the shelter area are 500-meter square, 50000-meter square, and 10,868-meter square, respectively. These values are used to provide a statistical representation of the shelter area values, which can help in a better understanding of the raw and preprocessed dataset. The shelter capacity is defined according to the total area occupied by the population. The presented statistical measures are utilized, such as minimum, maximum, and average. The minimum, maximum, and average values of shelter capacity are 152, 147165, and 5577, respectively. The shelter capacity is defined according to the total area occupied by the population. In this work, we used statistical measures to analyze shelter capacity values based on preprocessed data for removing outliers from the data. The minimum, maximum, and average values of the shelter capacity are 152, 15152, and 3293, respectively.

Figure 6: Coordinates data of shelter locations
Fig. 7 presents the coordinates data of building locations. Each building location is visualized based on the location coordinates, such as latitude and longitude. The higher values of the building index effect and decrease the overall risk index. In our collected dataset, the minimum, maximum, and average values of the building area are 132, 1962, and 638-meter square, respectively. The building capacity values are defined based on the total number of people. Based on statistical analysis, it is found that the minimum, maximum, and average values of the building capacity are 40, 594, and 197, respectively.

Figure 7: Coordinates data of building locations
5 Implementation and Experimental Results
This section presents experimental results, experimental and implementation environment for the proposed earthquake risk index model. We performed different analyses on the earthquake dataset to analyze and estimate the risk index to prevent the earthquake disaster. The real dataset is considered and examined to estimate the risk index based on multiple parameters using the gridded map to visualize each location with associated risk. The following risk index model parameters are evaluated based on the historical earthquake data, such as earthquake index, danger index, shelter index, and building index. Based on these parameters, we calculated the risk index in advance to ensure safety measures to prevent future earthquake disasters.
Each earthquake-affected location of the selected area is visualized on Google map using location coordinates, such as latitude and longitude. All these locations are classified and categorized into three different groups based on the earthquake frequency (total number of occurrences), such as the most dangerous, medium, and low. It can be observed that the most dangerous locations and their associated frequency are highlighted with the red marker, while the yellow marker indicates the medium level of the earthquake locations and their respective frequency values. All the nearby earthquake locations of the selected city are marked according to the risk associated with them. It can be seen that most earthquake locations are situated in the nearby ocean.
For providing the risk index, a gridded map is presented for the selected city to visualize risk zones based on location coordinates, such as latitude and longitude. Fig. 8 presents the implementation result of risk zones based on a gridded map. The developed gridded map consists of 1000 grids, where each grid represents a risk zone location and also risk parameters (such as earthquake risk, danger risk, building, and shelter risk) associated with it. It can be very useful for earthquake management to analyze and visualize risk parameters associated with each grid (a location) to ensure safety measures to prevent future earthquake disasters. The seismic risk index ranges from −0.8 to 1.33 in a total of 1000 small districts of 20x50 on the map. The top six earthquake risk areas are among the center of the map and right-side areas.
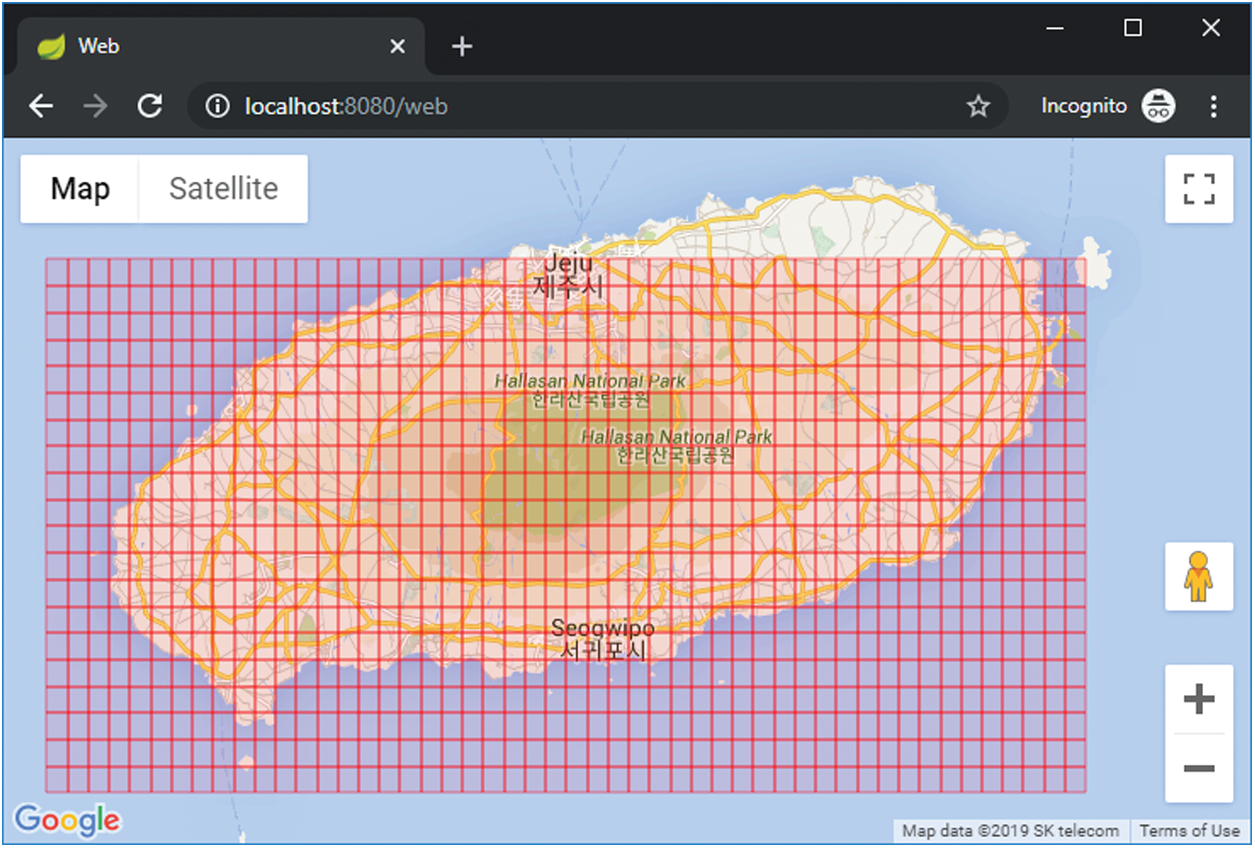
Figure 8: Implementation result of risk zones based on a gridded map
The EI is used to assess the risk index of earthquake occurrence based on previous data of the particular area. We defined EI to assess earthquake occurrences based on historical data of the local province for ensuring safety measures in advance. Fig. 9 presents the experimental results of the earthquake index. It can be observed that the EI value for each sequence number has greater than 725. As the sequence number increases, the value of the EI also increases. There is a strong relationship exists between sequence numbers and EI values.
The DI is developed to assess the extreme earthquake occurrences that caused tremendous damage, potential fatalities, and building collapse can be mapped ahead of time, which allows communities to prepare for potentially dangerous conditions. Fig. 10 presents the experimental results of the DI. The DI is defined as the overall count of the dangerous locations in the selected area. It can be observed that some sequence numbers have the highest DI value as compared to others. The higher values of the DI affect the risk index to be increased.

Figure 9: Experimental results of earthquake index (EI)

Figure 10: Experimental results of danger index (DI)
The SI is used to assess the requirements of shelters provided by the government. Fig. 11 presents the experimental results of the SI. The SI is defined based on the following two parameters, such as area and capacity. The higher values of the shelter index affect the risk index to be decreased.

Figure 11: Experimental results of the shelter index (SI)
The building index is defined to assess the damage capacity of the buildings caused by earthquake disasters to estimate economic loss and shelter capacity to prevent earthquake disasters. Fig. 12 presents the experimental results of the BI. The higher values of the BI affect the risk index to be decreased. The smaller values of the BI effect and increase the risk index.

Figure 12: Experimental results of building index (BI)
Fig. 13 describes the experimental results of the RI. The proposed approach estimates the risk index based on all four defined parameters. It can be seen that the risk index value is very low for the initial sequence numbers. It can also be observed that some sequence numbers, such as 528th to 559th, have higher values of the risk index. Based on risk index results, administration authorities can plan and ensure safety measures to prevent damages caused by the earthquake. The higher value of the risk index is expected to require additional shelter as compared to the smaller value of the risk index. The higher value of the risk index alarmed the administration and local population to ensure safety measures in advance to prevent future damages caused by the natural phenomena. The risk index can be utilized to plan and optimize emergency shelter requirements to facilitates the affected population effectively.
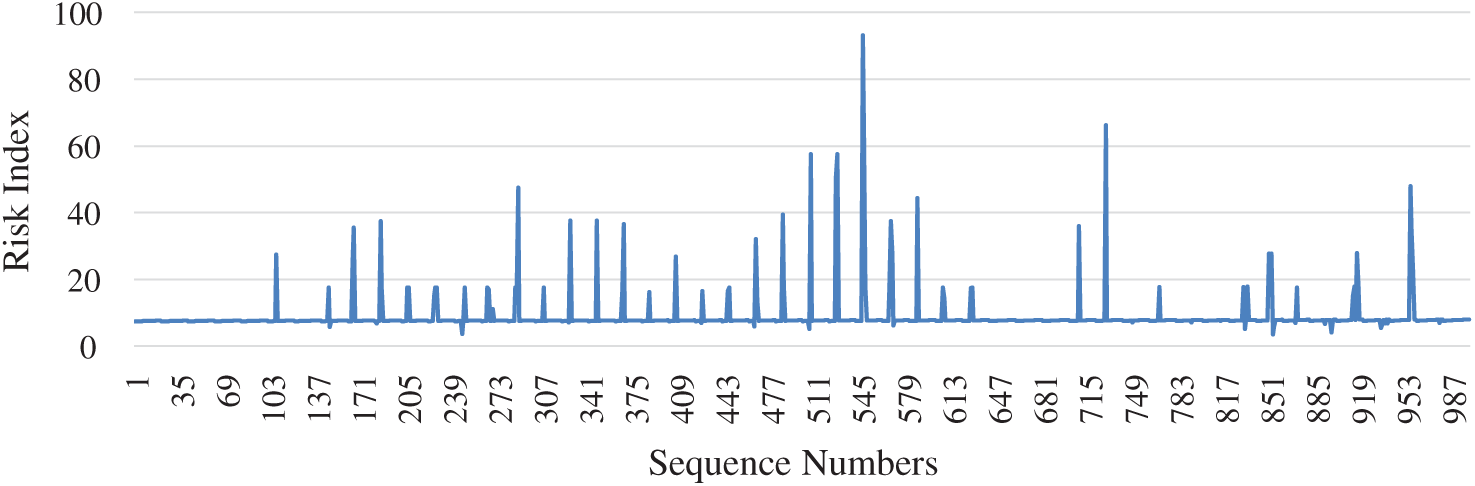
Figure 13: Experimental results of the risk index (RI)
6 Conclusions and Future Directions
This paper proposes a novel earthquake risk index model for estimating risk index based on multiple parameters, such as earthquake index, danger index, shelter index, and building index using a gridded map. This work used and analyzed a real earthquake dataset of the Jeju island, the Republic of Korea, to estimate the earthquake risk index to help government authorities and local communities to ensure safety measures to prevent future earthquake disasters. In this paper, we also developed a gridded map to visualize risk zones and risk index parameters associated with each risk zone. Based on analysis results, it is found that a higher level of the earthquake, a smaller distance of block center and earthquake locations affect the earthquake index to be increased. It is also found that higher values of earthquake and danger indexes affect the risk index to be increased. Whereas; higher values of shelter and building indexes affect the risk index to be decreased. The higher value of the risk index alarmed the administration and local population to ensure safety measures to prevent earthquake disasters. The proposed model allows the meteorological administration to plan shelter requirements and other safety measures to prevent earthquake disasters. It also helps visitors to identify all risky locations in advance using tremendous damage caused by the earthquake in the past.
As the future directions, the performance of the proposed model can be enhanced by considering more datasets and features. This work can be extended by integrating machine learning techniques to predict the future occurrences of the earthquake to plan safety measures to prevent earthquake disasters. We consider deep learning approaches to derive the risk index for satisfying the shelter demands to prevent future earthquake disasters.
Acknowledgement: This research was supported in part by the Energy Cloud R&D Program through the National Research Foundation of Korea (NRF) funded by the Ministry of Science, ICT (2019M3F2A1073387), in part by the Basic Science Research Program through the NRF funded by the Ministry of Education (NRF-2019R1I1A1A01062456), Any correspondence related to this paper should be addressed to Dohyeun Kim.
Funding Statement: The authors received no specific funding for this study.
Conflicts of Interest: The authors declare that they have no conflicts of interest to report regarding the present study.
1. Z. Jianqi, J. Peng, X. Zhu and W. Huang, “Scenario-based risk assessment of earthquake disaster using slope displacement PGA and population density in the guyuan region China,” ISPRS International Journal of Geo-Information, vol. 8, no. 2, pp. 85, 2019. [Google Scholar]
2. A. John, G. Rogers, S. Halchuk, D. McCormack and J. Cassidy, “The case for an advanced national earthquake monitoring system for Canada's cities at risk,” in Proceedings of the 7th us National Conference on Earthquake Engineering, Boston, United States, vol. 42, 2002. [Google Scholar]
3. M. Zoe, G. P. Roberts, P. Walker and F. Iezzi, “Coulomb stress transfer and fault interaction over millennia on non-planar active normal faults: The M w 6.5–5.0 seismic sequence of 2016–2017 central Italy,” Geophysical Journal International, vol. 210, no. 2, pp. 1206–1218, 2017. [Google Scholar]
4. M. Robat, K. Hosseini and O. Izadkhah, “Developing a holistic model for earthquake risk assessment and disaster management interventions in urban fabrics,” International Journal of Disaster Risk Reduction, vol. 27, pp. 355–365, 2018. [Google Scholar]
5. K. Elco, M. Bočkarjova, H. Moel and J. Aerts, “Integrated direct and indirect flood risk modeling: Development and sensitivity analysis,” Risk Analysis, vol. 35, no. 5, pp. 882–900, 2015. [Google Scholar]
6. H. Toon, G. Husby, W. J. Botzen and J. Aerts, “The safe development paradox: An agent-based model for flood risk under climate change in the european union,” Global Environmental Change, vol. 60, pp. 102009–102020, 2020. [Google Scholar]
7. K. Elco and M. Thissen, “A multiregional impact assessment model for disaster analysis,” Economic Systems Research, vol. 28, no. 4, pp. 429–449, 2016. [Google Scholar]
8. F. P. Galarce, L. J. Canales, C. Vergara and A. C. Vejar, “An optimization model for the location of disaster refuges,” Socio-Economic Planning Sciences, vol. 59, pp. 56–66, 2017. [Google Scholar]
9. S. Yijun, G. Zhai, L. Xu, Q. Zhu and J. Deng, “Planning emergency shelters for urban disasters: A multi-level location–allocation modeling approach,” Sustainability, vol. 11, no. 16, pp. 4285, 2019. [Google Scholar]
10. G. Gina and R. Batta, “Review of recent developments in or/MS research in disaster operations management,” European Journal of Operational Research, vol. 230, no. 2, pp. 201–211, 2013. [Google Scholar]
11. Z. Chen, C. Shi, T. Li and Y. Yuan, “Damage characteristics and influence factors of mountain tunnels under strong earthquakes,” Natural Hazards, vol. 61, no. 2, pp. 387–401, 2012. [Google Scholar]
12. C. Johnson, “Strategic planning for post-disaster temporary housing,” Disasters, vol. 31, no. 4, pp. 435–458, 2007. [Google Scholar]
13. C. Tai, Y. Lee and C. Lin, “Urban disaster prevention shelter location and evacuation behavior analysis,” Journal of Asian Architecture and Building Engineering, vol. 9, no. 1, pp. 215–220, 2010. [Google Scholar]
14. U. Marco, F., Nadim, S. Lacasse and A. Kaynia, “A conceptual framework for quantitative estimation of physical vulnerability to landslides,” Engineering Geology, vol. 102, no. 3–4, pp. 251–256, 2008. [Google Scholar]
15. K. Sadra, M. Miyajima, R. Hassanzadeh, R. Amiraslanzadeh and B. Kamel, “A GIS-based seismic hazard, building vulnerability and human loss assessment for the earthquake scenario in tabriz,” Soil Dynamics and Earthquake Engineering, vol. 66, pp. 263–280, 2014. [Google Scholar]
16. H. Mahdi and A. Asghar, “A GIS-based earthquake damage assessment and settlement methodology,” Soil Dynamics and Earthquake Engineering, vol. 31, no. 11, pp. 1607–1617, 2011. [Google Scholar]
17. W. Zhang, J. Lin, J. Peng and Q. Lu, “Estimating wenchuan earthquake induced landslides based on remote sensing,” International Journal of Remote Sensing, vol. 31, no. 13, pp. 3495–3508, 2010. [Google Scholar]
18. A. Vecere, R. Monteiro, W. J. Ammann, S. Giovinazzi and R. H. Santos, “Predictive models for post disaster shelter needs assessment,” International Journal of Disaster Risk Reduction, vol. 21, pp. 44–62, 2017. [Google Scholar]
19. H. Jia, J. Lin and J. Liu, “An earthquake fatalities assessment method based on feature importance with deep learning and random forest models,” Sustainability, vol. 11, no. 10, pp. 2727–2747, 2019. [Google Scholar]
20. Q. Liu, X. Ruan and P. Shi, “Selection of emergency shelter sites for seismic disasters in mountainous regions: Lessons from the 2008 wenchuan Ms 8.0 earthquake, China,” Journal of Asian Earth Sciences, vol. 40, no. 4, pp. 926–934, 2011. [Google Scholar]
21. F. Kulahci, M. Inceoz, M. Dogru, E. Aksoy and O. Baykara, “Artificial neural network model for earthquake prediction with radon monitoring,” Applied Radiation and Isotopes, vol. 67, no. 1, pp. 212–219, 2009. [Google Scholar]
22. L. Serva, E. Vittori, V. Comerci, E. Esposito and G. Eliana et al., “Earthquake hazard and the environmental seismic intensity (ESI) scale,” Pure and Applied Geophysics, vol. 173, no. 5, pp. 1479–1515, 2016. [Google Scholar]
23. W. Bradley and T. Paradise, “Assessing the impact of Syrian refugees on earthquake fatality estimations in southeast Turkey,” Natural Hazards and Earth System Sciences, vol. 18, no. 1, pp. 257–269, 2018. [Google Scholar]
24. J. Kishor and D. Wald, “An empirical model for global earthquake fatality estimation,” Earthquake Spectra, vol. 26, no. 4, pp. 1017–1037, 2010. [Google Scholar]
25. S. Emily and R. Spence, “Estimating shaking-induced casualties and building damage for global earthquake events: A proposed modelling approach,” Bulletin of Earthquake Engineering, vol. 11, no. 1, pp. 347–363, 2013. [Google Scholar]
26. T. Khalida and M. Bensaibi, “Earthquake risk assessment of blida (Algeria) using GIS,” Energy Procedia, vol. 139, pp. 645–650, 2017. [Google Scholar]
27. J. Ortega, G. Vasconcelos, H. Rodrigues and M. Correia, “A vulnerability index formulation for the seismic vulnerability assessment of vernacular architecture,” Engineering Structures, vol. 197, pp. 109381–109400, 2011. [Google Scholar]
28. Y. Nacim and M. Bensaibi, “Weighting assessment of vulnerability index parameters for reinforced masonry structures,” Structural Engineering International, vol. 27, no. 1, pp. 79–87, 2017. [Google Scholar]
29. S. Hooshang, J. Amini and M. L. Poor, “Assessment of risk caused by earthquake in region 1 of Tehran using the combination of RADIUS, TOPSIS and AHP models,” Journal of Civil Engineering and Urbanism, vol. 1, no. 1, pp. 39–48, 2011. [Google Scholar]
30. R. Tarek and J. Weeks, “Assessing vulnerability to earthquake hazards through spatial multicriteria analysis of urban areas,” International Journal of Geographical Information Science, vol. 17, no. 6, pp. 547–576, 2003. [Google Scholar]
31. T. C. Davies, “Urban geology of african megacities,” Journal of African Earth Sciences, vol. 110, pp. 188–226, 2015. [Google Scholar]
32. R. Maio, T. M. Ferreira and R. Vicente, “A critical discussion on the earthquake risk mitigation of urban cultural heritage assets,” International Journal of Disaster Risk Reduction, vol. 27, pp. 239–247, 2018. [Google Scholar]
33. K. Pitilakis, S. Argyroudis, K. Kakderi and J. Selva, “Systemic vulnerability and risk assessment of transportation systems under natural hazards towards more resilient and robust infrastructures,” Transportation Research Procedia, vol. 14, pp. 1335–1344, 2016. [Google Scholar]
34. M. Pierre and B. Brun, “Presentation of RISK-uE project,” Bulletin of Earthquake Engineering, vol. 4, no. 4, pp. 323–339, 2006. [Google Scholar]
35. A. Ansal, A. Akinci, G. Cultrera, M. Erdik and V. Pessina et al., “Loss estimation in istanbul based on deterministic earthquake scenarios of the marmara Sea region (Turkey),” Soil Dynamics and Earthquake Engineering, vol. 29, no. 4, pp. 699–709, 2009. [Google Scholar]
36. S. Molina, D. H. Lang and C. D. Lindholm, “SELENA–an open-source tool for seismic risk and loss assessment using a logic tree computation procedure,” Computers & Geosciences, vol. 36, no. 3, pp. 257–269, 2010. [Google Scholar]
37. M. Hajibabaee, K. A. Hosseini and M. Reza, “Assessing the risk of earthquake in urban areas (Case study: Tehran city),” Second European Conference on Earthquake Engineering and Sesmiology, vol. 15, pp. 2229–2250, 2015. [Google Scholar]
38. L. Zhou, W. Wang and R. Ma, “Application of method of entropy proportion to urban earthquake disaster risk index,” Journal of Earthquake Engineering and Engineering Vibration, vol. 30, no. 1, pp. 93–97, 2010. [Google Scholar]
39. A. Edrissi, H. Poorzahedy, H. Nassiri and N. M. Habibollah, “A multi-agent optimization formulation of earthquake disaster prevention and management,” European Journal of Operational Research, vol. 229, no. 1, pp. 261–275, 2013. [Google Scholar]
40. S. J. Jensen, S. F. Jensen, D. M. Johnston and N. A. Nancy, “The emergence of a globalized system for disaster risk management and challenges for appropriate governance,” International Journal of Disaster Risk Science, vol. 6, no. 1, pp. 87–93, 2015. [Google Scholar]
41. M. Carreño, O. D. Cardona and A. H. Barbat, “Urban seismic risk evaluation: A holistic approach,” Natural Hazards, vol. 40, no. 1, pp. 137–172, 2007. [Google Scholar]
42. A. Lavell and A. Maskrey, “The future of disaster risk management,” Environmental Hazards, vol. 13, no. 4, pp. 267–280, 2008. [Google Scholar]
43. N. I. Frolova, V. I. Larionov, S. P. Suschev and J. Bonnin, “Estimation of loss caused by earthquakes and secondary technological hazards,” Natural Hazards and Earth System Sciences, vol. 11, no. 11, pp. 3025–3033, 2011. [Google Scholar]
44. P. Peduzzi, H. Dao, C. Herold and F. Mouton, “Assessing global exposure and vulnerability towards natural hazards: The disaster risk index,” Natural Hazards and Earth System Sciences, vol. 9, no. 4, pp. 1149–1159, 2009. [Google Scholar]
45. Y. Zhang, V. Burton, H. Sun and M. Shokrabadi, “A machine learning framework for assessing post-earthquake structural safety,” Structural Safety, vol. 72, pp. 1–16, 2018. [Google Scholar]
46. S. Ahmad, I. Jamal, F. Jamil, N. Iqbal and D. H. Kim, “Optimal route recommendation for waste carrier vehicles for efficient waste collection: A step forward towards sustainable cities,” IEEE Access, vol. 8, pp. 77875–77887, 2020. [Google Scholar]
47. N. Iqbal, R. Ahmad, F. Jamil and D. H. Kim, “Hybrid features prediction model of movie quality using multi-machine learning techniques for effective business resource planning,” Journal of Intelligent & Fuzzy Systems, vol. 40, no. 5, pp. 1–22, 2021. [Google Scholar]
48. S. Ahmad, I. Jamal, N. Iqbal, F. Jamil and D. H. Kim, “Optimal policy-making for municipal waste management based on predictive model optimization,” IEEE Access, vol. 8, pp. 218458–218469, 2020. [Google Scholar]
49. N. Iqbal, F. Jamil, S. Ahmad and D. H. Kim, “Toward effective planning and management using predictive analytics based on rental book data of academic librarie,” IEEE Access, vol. 8, pp. 81978–81996, 2020. [Google Scholar]
50. A. N. Khan, N. Iqbal, A. Rizwan, R. Ahmad and D. H. Kim, “An ensemble energy consumption forecasting model based on spatial-temporal clustering analysis in residential buildings,” Energies, vol. 14, no. 11, pp. 3020–3044, 2021. [Google Scholar]
 | This work is licensed under a Creative Commons Attribution 4.0 International License, which permits unrestricted use, distribution, and reproduction in any medium, provided the original work is properly cited. |