DOI:10.32604/cmc.2022.020376
| Computers, Materials & Continua DOI:10.32604/cmc.2022.020376 | |
| Article |
Speech Recognition-Based Automated Visual Acuity Testing with Adaptive Mel Filter Bank
1Department of Electrical Engineering, National University of Sciences and Technology (NUST), Islamabad, 44000, Pakistan
2Hamdard Institute of Engineering & Technology, Islamabad, 44000, Pakistan
3College of Computing and Information Technology, University of Bisha, Bisha, Saudi Arabia
4Institute of Computing, Kohat University of Science and Technology, Kohat, Pakistan
*Corresponding Author: Muhammad Asghar Khan. Email: khayyam2302@gmail.com
Received: 21 May 2021; Accepted: 23 June 2021
Abstract: One of the most commonly reported disabilities is vision loss, which can be diagnosed by an ophthalmologist in order to determine the visual system of a patient. This procedure, however, usually requires an appointment with an ophthalmologist, which is both time-consuming and expensive process. Other issues that can arise include a lack of appropriate equipment and trained practitioners, especially in rural areas. Centered on a cognitively motivated attribute extraction and speech recognition approach, this paper proposes a novel idea that immediately determines the eyesight deficiency. The proposed system uses an adaptive filter bank with weighted mel frequency cepstral coefficients for feature extraction. The adaptive filter bank implementation is inspired by the principle of spectrum sensing in cognitive radio that is aware of its environment and adapts to statistical variations in the input stimuli by learning from the environment. Comparative performance evaluation demonstrates the potential of our automated visual acuity test method to achieve comparable results to the clinical ground truth, established by the expert ophthalmologist’s tests. The overall accuracy achieved by the proposed model when compared with the expert ophthalmologist test is 91.875%. The proposed method potentially offers a second opinion to ophthalmologists, and serves as a cost-effective pre-screening test to predict eyesight loss at an early stage.
Keywords: Eyesight test; speech recognition; HMM; SVM; feature extraction
Eyes are one of the extremely sensitive and complex sensory organs. Different Surveys show that more than one billion people have distance or near vision loss [1]. Vision loss may be either complete (including both eyes) or partial including only one eye or even certain portions of view field [2–4]. The visual acuity is required to be done for many reasons as part of preventive health care, eye injury or some kind of eye condition like sore eye or red eye. Being able to check the visual acuity in a careful controlled way can really help to understand what kind of disease you might have or just in general how the vision is. The key thing is doing it in the right way so that it is reliable and it may help to track the improvements of the eye health. Timely assessment of eyesight can help prevent this vision loss.
The doctors or health practitioners generally perform visual acuity tests to asses a patient’s visual health. The problem with this kind of methods is that these tests are economically expensive since it involves cost of a specialist or consultant hired by the patient, cost of apparatus such as ophthalmoscope and special settings provided for the tests. Additional problems include time consuming appointments, inaccessibility of equipment and specialists in the remote areas and long test sessions. To avoid these problems, an idea has been proposed that automatically identifies the eyesight impairment, eliminating the need of a doctor completely. The main objective of this paper is to automate the process of visual acuity based on speech recognition.
Automatic visual acuity testing is a hot topic of research these days. Different authors have proposed different algorithms and solutions to make the visual acuity testing automated [5–8], mainly focusing on maximizing the accuracy by minimizing the error rate. However, low accuracy and comparison of the proposed models with the ground realities has always been remained a challenge. It has been found out that most of the aforementioned proposed algorithms for automation of visual acuity testing suffered from ambient noise. Moreover, due to absence of comparison with the ground truths, most of the proposed models have low accuracy and reliability. Herein, we propose a novel visual acuity testing model by addressing the aforementioned limitations by conducting the tests in a noise proof cabin to minimize the effect of ambient noise. Furthermore, we carryout alphabets recognition using cognitively inspired feature extraction technique (for improving the accuracy), while the reliability is improved by comparing the results obtained from the proposed method with that of ground truth results. Another limitation of the presently proposed techniques is that these only incorporate Snellen chart which contains only Latin letters. Our proposed paper also incorporates Tumbling-E eye chart for the non-readers.
The rest of the paper is organized as follows: “proposed Methodology” discusses the proposed model. Material and experimental setup is covered in “Material Section”. Classifiers used in this work are covered in “Classifier Section”. “Results” discusses results obtained from the proposed model and comparison with state-of-the art techniques. Conclusive remarks and future directions are covered in “Conclusion Section”.
This paper presents a novel idea that will automatically identify the eyesight test based on speech recognition. The proposed model will be able to conduct eyesight test automatically, which could potentially replace as well as aid the practitioner. In visual acuity test, an ophthalmologist displays familiar words to the patient and then observes the response of the subject through speech. The main idea is to project different alphabets of Snellen chart in a predefined manner which is shown in Fig. 1. The test subject will have to utter the displayed letter into a microphone. Speech recognition system is then used to correctly recognize the word uttered by the test subject. If the subject taking test utters the displayed alphabets correctly then the system will decrease the word size until the subject achieves minimum font size or uttering the word wrongly. On the contrary, the system will display another alphabet from the snellen chart by keeping the font size intact. If the subject failed to recognize a letter more than the predefined threshold then the system will record it as eyesight threshold. The complete algorithm of proposed visual acuity testing based on speech recognition is listed in Algorithm 1. Algorithm 1 explains the overall working of visual acuity testing.

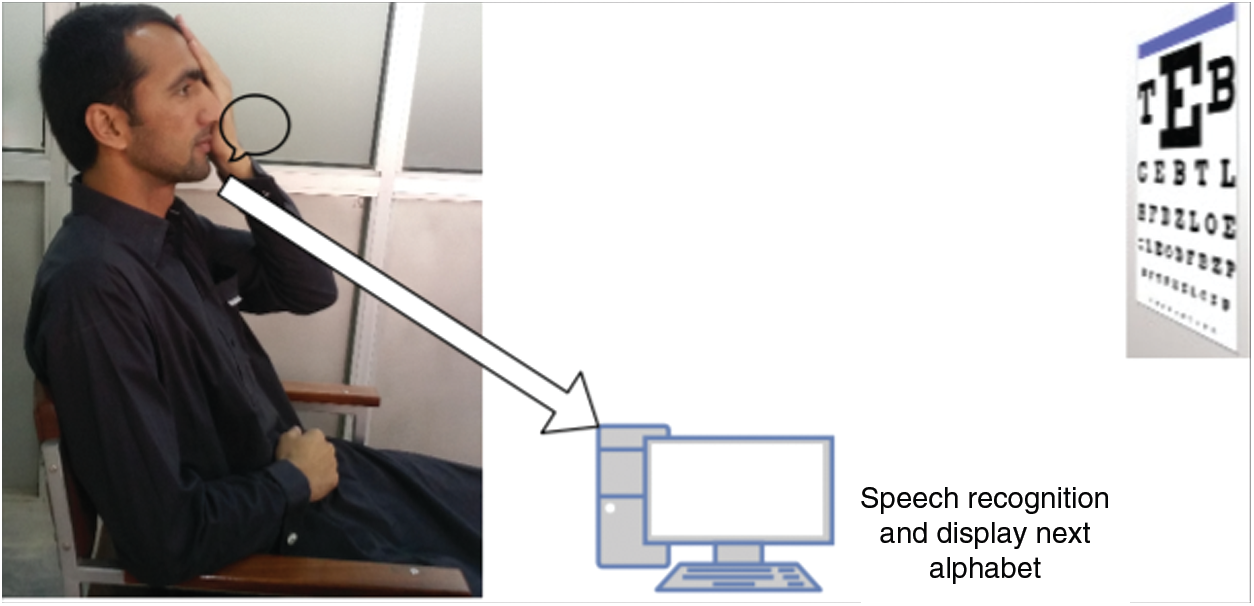
Figure 1: Schematic diagram of the proposed model for automated eye testing
For the presented model, it is required to accurately recognize and classify speech for the acuity test. For this purpose, the proposed system incorporates an adaptive filter bank as a feature extraction method with weighted mel frequency cepstral coefficients (MFCCs) as features.
Speech recognition consists of two important steps; feature extraction and classification. Feature extraction is the core module in any front-end part of the automated speech recognition (ASR) system. Number of feature extraction techniques have been introduced in the recent years, which have substantially improved the recognition such as PCA [10], LDA [11], ICA [9], LPC [12], MFCC [13], RASTA [14] and wavelet-based feature extraction [15]. Among these, one of the most widely used techniques for feature extraction is MFCC. In MFCC, the spectrum of speech signal is obtained after taking Fourier transform. The spectrum power, using the mel-scale, is approximated and scaled to response of the human ear. In traditional MFCC, static mel filter bank is used to extract features from speech signal. Since spectrum of speech varies with utterance of different words, therefore, static mel filter bank is not a suitable choice [16]. In this paper, an adaptive filter bank is used that constitute after sensing the spectrum of input speech signal, therefore, the traditional MFCC model as shown in Fig. 2 is replaced with the adaptive mel filter bank as shown in Fig. 3 [16–19].

Figure 2: Block diagram of traditional MFCC
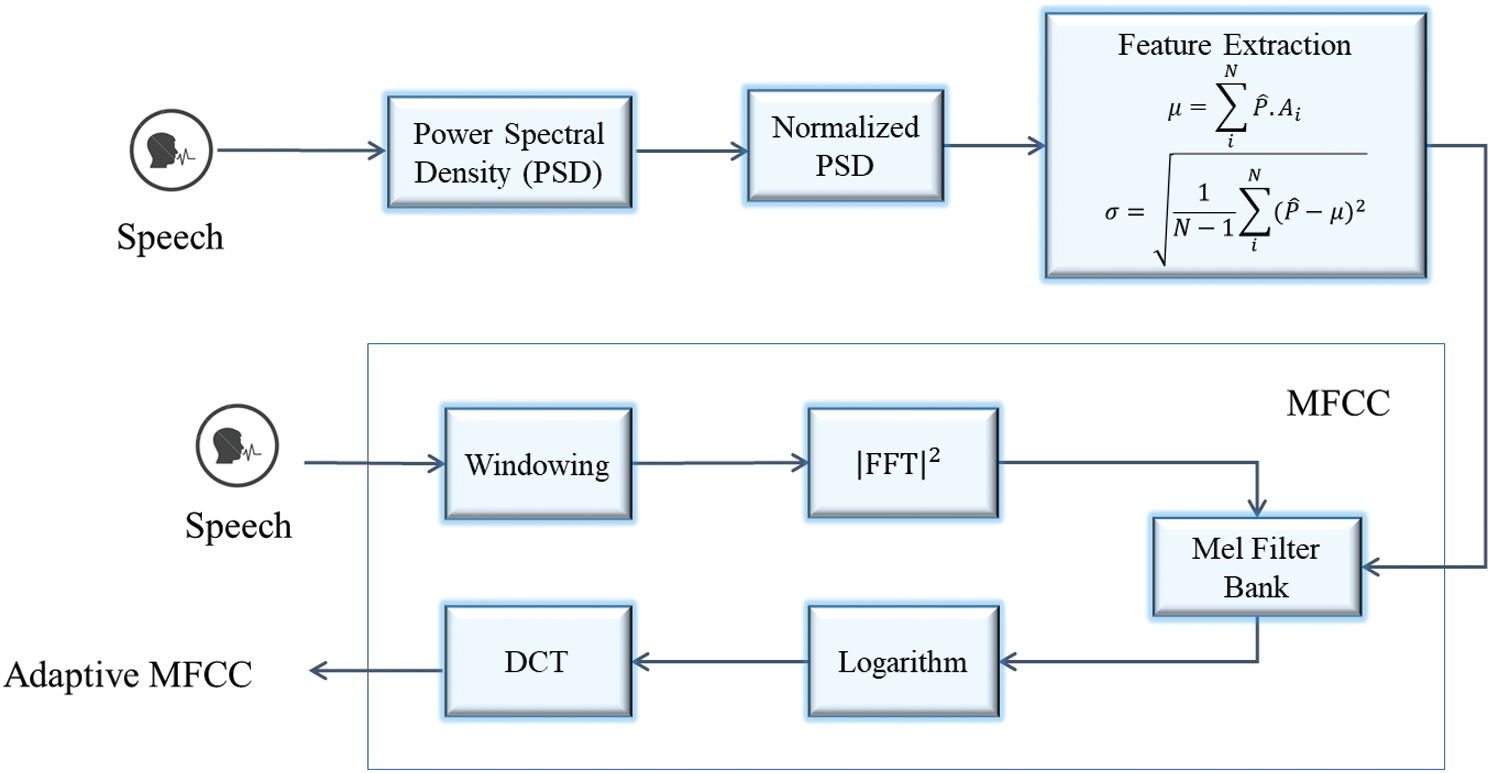
Figure 3: Block diagram of adaptive mel filter bank
The method of calculating weighted adaptive filter bank coefficients is as follow:
• First step is to find the DFT of the time-domain signal x:
where N is the length of frame and w is the Hamming window can be written as:
• Now, the next step is to calculate power spectrum:
In adaptive weighted MFCC, Mel-filter bank is constructed after observing the spectrum of input audio signal. The spectrum observing is required to find the orientation on the spectrum of the signal which is done achieved by incorporating normalized power spectral density P. Expectation μ, Standard deviation σ and Power Spectral Density P are calculated as:
While working on audio signals, it is considered that audio signals follow the Gaussian distribution. With this assumption that almost all of the signal lies within the range μ ± 3σ. Therefore, Mel-filter bank is constructed such that the spectrum from μ ± 3σ is only covered. The Mel spectrum can be found out using the following equation:
where l = 0,…,L − 1, and L being the Mel-weighted filters.In order to achieve adaptive filter bank coefficients, Discrete Cosine Transform (DCT) is used on the natural logarithm of the Mel spectrum. Now, taking the derivative and double derivative of these adaptive weighted MFCC will generate delta and double delta features which will increase the efficiency of audio speech recognition system. A drawback of this approach is increased dimensions of feature vector which ultimately leads to high computational costs. To mitigate this problem, weighted Mel frequency cepstral coefficient swc(n) are used which are defined as:
Here c(n), a and b are the coefficients of adaptive MFCC, delta and double delta features, respectively. In the above equation, first term from left has more contribution than the other derivative terms. Hence, the coefficients a and b have values bounded below one i.e., b < a < 1. The resultant feature vector is reduced dimensional vector with dimensions 13. Thereby decreasing the computational complexity at recognition phase. The entire process of adaptive filter bank with weighted MFCC is listed in Algorithm 2.

Generally, Snellen test is used to measure the visual acuity which is performed with the help of Snellen chart. The Snellen chart consists of eleven lines of block letters called optotypes. Out of 26 alphabets only nine are used as optotype letters which are: C, D, E, F, L, O, P, T and Z. The font of these optotypes has a particular geometry with following rules:
1. Snellen optotypes are designed on 5
2. The thickness or weight of a line is equals to the negative space between the lines and the thickness of the gap in optotype letter ’C’. The formulaof optotype height or width is:
where ω is the height of optotype, d is the distance between eye and chart and θ is the angle subtended by the optotype which is equal to 5 arcminutes as defined by Howett, G L [20].

Figure 4: Size of Snellen chart alphabets
The first line is printed with only one large letter (e.g., E, H or N). The subsequent row contains letters with decreased size and one letter more than the preceded row. The row number and the number of letters present on that row are equal making the eleventh row containing eleven letters (as shown in Fig. 5. In standard procedures, patient stands at a distance of 6 m or 20 feet away from the Snellen chart and tries to read the letters from the top to bottom with left eye covered. Each row is assigned a ratio which indicates the required visual acuity to read it. For example, the ratio of 20/200 at first line shows that the person can see at 20 feet what a person with normal vision can see at 200 feet. The row till which the patient reads the letters accurately becomes the visual acuity for that specific eye. According to metric system, normal vision is defined as “6/6” (m) while in United States, it is “20/20” (ft). Now, if the patient reaches at a line where he reads one character wrong then his score is calculated as:
where scorei is the score assigned to the patient at line i where i = {1, 2 …11}, ratio is the ratio assigned to line i and n is the number of characters wrongly read out by the person. The value of n must be less than or equal to two which means that at each line, at most two mistakes are allowed and if someone makes more than two mistakes in reading optotypes present on a line then he will be assigned the preceded line score and there is no need to go any further. If somebody reads till line 8 without making any error in reading all letters at that line, he gets 20/20. The same procedure is repeated for the other eye with right eye covered. The Tab. 1. shows the different classifications of loss based on WHO and International council of Ophthalmologists standards [21].
4.2 Acuity Chart for Non-Readers
The Tumbling E eye chart is used for the patients who are not familiar with Latin letters. This chart contains only one letter “E” arranged in up, down, right and left directions with the same rule as Snellen that the sizes getsmaller with each row. The patient is then asked to tell the direction or faceof each Tumbling E as shown in Fig. 5.

Figure 5: Snellen and Tumbling E eye chart

For the proposed speech recognition for automated visual acuity test (SRAVAT), first the system will ask the patient to stand at marked line at 20 ft. distance and to cover left eye. The system will then ask to select for either Tumbling E eye chart or Snellen eye chart. The patient will be guided to speak through microphones to say ‘YES’ or ‘NO’ based on his choice. If the person chooses Snellen chart, he will be played a different set of instruction from recorded machine. Each line will be playing one by one starting from the large optotypes. The machine will ask the person to utter characters of the displayed line on screen starting from left. There will be three choices for the patient: Correct optotype pronounced, incorrect pronounced optotype or say “PASS” if he cannot read. The score will be calculated by the method as mentioned in Section 1.1. The analysis for the current eye will be terminated on two conditions: If he makes more than two mistakes or the patient utters no word in 10 s. In any case, the system will announce the score of that eye. If only right eye is done then the person will be instructed to cover left eye to check for left eye acuity and same procedure will be followed If the person chooses Tumbling E chart, he will be guided to utter the directions for each optotype. In this case, the person will have five choices to utter: ‘UP’, ‘DOWN’, ‘LEFT’, ‘RIGHT’ or ‘PASS’ if he cannot read. Rest of the procedure is same for Tumbling E chart.
Speech recognition-based system requires an environment which is noise proof and well equipped. For the structure, authentication and evaluation of speech recognition tests, a special noise proof room is established in National University Systems and Simulation (NUSyS) Lab. All the tests were performed and analyzed in that noise proof room.
The audio from the patients were taken through the microphone of Sony PCM-M10 recorder. The sampling rate of the input audio signals were set to 44.1 KHz. The audio input was saved in .WAV format. The database consists of the utterances of the optotypes letters present on Snellen chart and also the words used to follow the procedure such as: ‘YES’, ‘NO’ or ‘PASS’.
The visual acuity test was conducted on one hundred sixty participants with ages ranging between 25–60 years. The participants in this test were chosen in a way to cover different vision impairments problem e.g., the individuals with near-or far-sighted problems or those with partial or complete visual losses. By taking into account, the mentioned impairment problems, there exists a total of six different categories as mentioned in Tab. 1. Twenty number of participants are chosen from each category for analyzing the accuracy of the system. The visual acuity of the participants was initially examined by the presented automated approach performed in noise proof setup as described in the previous section followed by the verification from trained ophthalmologists to find the accuracy of the system.
Since the proposed SRAVAT system requires speech recognition in which extracted features from the uttered speech will be compared with the features acquired during the training phase. Hence, the classifiers are required for the matching purpose. In literature, many classifiers are being studied for speech recognition and among them the most widely used classifiers are: SVM, KNN and HMM. This work includes the analysis of proposed system by these three classifiers. In many research works, SVM has been applied to acoustic model of speech recognition systems for feature matching and classification. The basic principle of SVM is structure risk minimization. It has various applications in pattern recognition area. It estimates the decision function by building up linear model based upon support vectors. It finds the optimal hyper plane that separates the data without error provided that the training data is linearly separable [22,23]. In machine learning, KNN has been used in pattern recognition as statistical estimation. It is considered to be a simple algorithm that classifies on the basis of similarity measure (e.g., Euclidean distance). Euclidean Distance is used to get the similarity of the training and testing data. KNN has a high accuracy provided the data is normalized, but it shows lower accuracy in the presence of outliers [24,25].
HMM is considered as one of the most widely used statistical tool in speech since it has rich mathematical structure and can form the theoretical basis for its use in wide range of applications including speech processing. It has gained popularity because of its computational feasibility and simplicity of networks that generates a sequence of vectors using number of states. In speech recognition, HMM would output a sequence of n-dimensional real-valued vectors (with n < 10) which consist of cepstral coefficients. It will have a statistical distribution consisting of a mixture of diagonal covariance Gaussians in each state that helps to find a likelihood for each observed vector. For each word or phoneme, there will be a different output distribution. Model parameters are usually the state transition and emission probabilities, number of states and observations etc. [26,27].
To analyze the accuracy of the proposed system, twenty participants from each visual impairment category were selected to take part in the study and testing of presented SRAVAT system making a total of 160 participants. A confusion matrix for the classifier HMM is shown in Tab. 3. Following the vision impairment categories from Tab. 1, the first category 20/200 falls under severe vision loss and the system accuracy for this category is found to be 100%. Similarly, categories 20/100 and 20/70 of Tab. 3 which belong to moderate vision loss are identified perfectly with an accuracy value of 100. One participant has been incorrectly identified in the next category 20/50 which comes under mild vision loss lowering down the accuracy to 95%. For the mild vision loss of 20/40, the accuracy rate is further decreased to 90%. The participants with vision impairment scores of 20/30 and 20/20 belonging to mild and normal vision loss respectively have same accuracy rate of 85. The lowest accuracy rate i.e., 80% has been found for the acuity score of 20/25. The average accuracy of the system is more than 90%. The confusion matrix of the classifier SVM is shown in Tab. 4. For the first three categories i.e., 20/200, 20/100 and 20/70, HMM and SVM have same accuracy rate of 100. The next three categories 20/50, 20/40 and 20/20, which come under mild and normal vision loss have 5% lesser accuracies than the respective categories from HMM. The participants with vision impairment scores of 20/30 and 20/25 belonging to mild and normal vision loss respectively have same accuracy rate of 70 with the lowest performance. The average accuracy of the proposed system with SVM classifier is 86.875%. Tab. 5 shows confusion matrix for the classifier KNN. Similar to HMM and SVM, KNN also has 100% performance for the first three categories i.e., 20/200, 20/100 and 20/70. The next three categories 20/50, 20/40 and 20/20 that come under mild and normal vision loss have 10% lesser accuracies than the respective categories from HMM. The participants with vision impairment scores of 20/30 and 20/25 belonging to mild and normal vision loss respectively have same accuracy rate of 65 with the lowest performance as compared to the classes from the classifier itself and the other classifiers. The average accuracy of the proposed system with KNN classifier is 83.75% which is the least accuracy amongst three mentioned classifiers. With 20 patients from each vision impairment category, the average achieved accuracy for the proposed system by different classifiers is summarized in Tab. 2. The Tab. 2 compares the performance of SVM, KNN and HMM based on achieving accuracy in terms of classifying speech correctly. By comparing the class accuracy for each classifier, HMM outperformed the other classifier with highest accuracy rate of 91.875%. The detailed accuracy of HMM classifier for each class is shown in Tab. 3 in confusion matrix form.


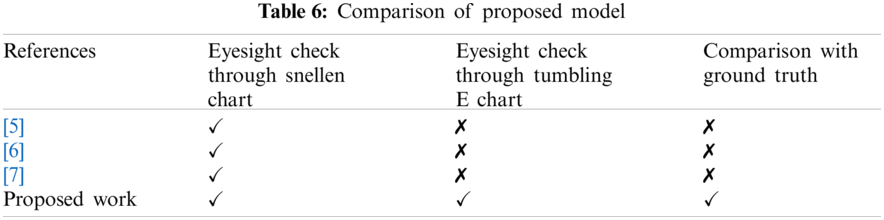
In recent years, some promising works have been reported for automating the visual acuity test. However, low accuracy and comparison of proposed models with ground truth is always remained a challenge. It is to be noted that most of the aforementioned automated methods suffer from problems such as ambient noise, low accuracy and low reliability due to the absence of comparison with the ground truth. The proposed automated visual acuity testing approach presented in this paper has addressed the aforementioned limitations by conducting tests in a noise proof cabin (minimizing the effect of ambient noise), carryout alphabets recognition using cognitively inspired feature extraction technique (for improving the accuracy), while the reliability is improved by comparing the results obtained from the proposed method with that of ground truth results. Tab. 6 summarized the comparison between the proposed model with the most robust models recently reported in the literature.

Generally, visual acuity test is carried out by ophthalmologists to assess the patient’s acuity system. However, there are major limitations in such visual acuity test systems which are time-consuming appointments, ophthalmologist’s fee, inaccessibility of equipment and specialists in the remote areas and long test sessions and long test sessions. In this paper, a novel idea is presented that automatically assesses the visual impairment based on cognitively inspired feature extraction and speech recognition. The proposed system not only incorporates Snellen chart but also Tumbling E chart for the non-readers which is the first attempt in speech based automatic visual acuity testing to our knowledge. The underlying system for the speech processing consists of an adaptive Mel frequency filter bank with weighted MFCCs and a classifier. The filter banks are used for feature extraction from speech based on the principle of spectrum sensing in cognitive radio. For classification purpose, HMM, SVM and KNN have been employed where HMM outperformed the rest of the algorithms. The performance analysis of the proposed system has been done in terms of correctly identifying different vision impairment categories. Comparative performance evaluation demonstrates the potential of our automated visual acuity test method to achieve comparable results to the clinical ground truth, established by the expert ophthalmologist’s tests. The overall accuracy achieved by the proposed model when compared with the expert ophthalmologist test is 91.875%. Therefore, it can be concluded that the presented approach can be effectively used as a cost-effective solution to visual acuity analysis as to check eye condition or for preventive health care at an early stage. In future, the authors are planning to perform the visual acuity test with more realistic scenarios such as background noise or imperfect datasets, employing more advanced machine learning algorithms and optimization approaches with multimodal techniques to further enhance the performance.
Acknowledgement: The authors would like to acknowledge the support of Dr. Muhammad Arsalan Khan from Peshawar medical college Pakistan, for his kind support and for inviting the participants (patients).
Availability of Data and Materials: The data used for the findings of this study is available upon request from the corresponding authors.
Funding Statement: The authors received no specific funding for this study.
Conflicts of Interest: The authors declare that they have no conflicts of interest to report regarding the present study.
1. R. R. Bourne, S. R. Flaxman, T. Braithwaite, M. V. Cicinelli, A. Das et al., “Magnitude, temporal trends, and projections of the global prevalence of blindness and distance and near vision impairment: A systematic review and meta-analysis,” The Lancet Global Health, vol. 5, no. 9, pp. 888–897, 2017. [Google Scholar]
2. W. O. Chan and J. S. Gilhotra, “Eye problems in the oldest old,” Advanced Age Geriatric Care, vol. 2019, no. 1, pp. 159–166, 2019. [Google Scholar]
3. S. Hopkins, S. Narayanasamy, S. J. Vincent, G. P. Sampson and J. M. Wood, “Do reduced visual acuity and refractive error affect classroom performance,” Clinical and Experimental Optometry, vol. 103, no. 3, pp. 278–289, 2020. [Google Scholar]
4. A. A. Kazakova, S. Rychkova, M. Gracheva, I. Senko, H. Tahchidi et al., “Visual acuity and visual performance in children with ophthalmopathology,” PERCEPTION, vol. 48, no. 2, pp. 206, 2019. [Google Scholar]
5. S. Khan and K. Ullah, “Visual acuity test for isolated words using speech recognition,” Int. Conf. on Innovations in Electrical Engineering and Computational Technologies, vol. 2017, no. 1, pp. 1–6, 2017. [Google Scholar]
6. K. Ganesan and D. Shalini, “Design of customizable automated low-cost eye testing system,” Journal of Clinical and Diagnostic Research, vol. 8, no. 3, pp. 85–87, 2014. [Google Scholar]
7. M. Priya, “Voice recognition eye test,” International Research Journal of Engineering and Technology, vol. 4, no. 2, pp. 1671–1673, 2017. [Google Scholar]
8. J. Lazaro, R. Garcia, A. Generalo, M. Halili and M. Montebon, “Speech recognition for control of optotype characters of the snellen chart using logmar transformation,” AIP Conf. Proc., vol. 2045, no. 1, pp. 200551–200555, 2018. [Google Scholar]
9. J. T. Chien and B.-C. Chen, “A new independent component analysis for speech recognition and separation,” IEEE Transactions on Audio, Speech, and Language Processing, vol. 14, no. 4, pp. 1245–1254, 2006. [Google Scholar]
10. S. Shabani and Y. Norouzi, “Speech recognition using principal components analysis and neural networks,” in IEEE 8th Int. Conf. on Intelligent Systems, vol. 2016, no. 1, pp. 90–95, 2016. [Google Scholar]
11. S. Zeiler, R. Nicheli, N. Ma, G. J. Brown and D. Kolossa, “Robust audiovisual speech recognition using noise-adaptive linear discriminant analysis,” IEEE Int. Conf. on Acoustics, Speech and Signal Processing, vol. 2016, no. 1, pp. 2797–2801, 2016. [Google Scholar]
12. S. Wijoyo and S. Wijoyo, “Speech recognition using linear predictive coding and artificial neural network for controlling movement of mobile robot,” Int. Conf. on Information and Electronics Engineering, vol. 2011, no. 1, pp. 28–29, 2011. [Google Scholar]
13. S. D. Dhingra, G. Nijhawan and P. Pandit, “Isolated speech recognition using MFCC and DTW,” International Journal of Advanced Research in Electrical, Electronics and Instrumentation Engineering, vol. 2, no. 8, pp. 4085–4092, 2013. [Google Scholar]
14. H. Hermansky and N. Morgan, “Rasta processing of speech,” IEEE Transactions on Speech and Audio Processing, vol. 2, no. 4, pp. 578–589, 1994. [Google Scholar]
15. N. Trivedi, V. Kumar, S. Singh, S. Ahuja and R. Chadha, “Speech recognition by wavelet analysis,” Journal of Computer Applications, vol. 15, no. 8, pp. 975–8887, 2011. [Google Scholar]
16. S. Nisar, O. U. Khan and M. Tariq, “An efficient adaptive window size selection method for improving spectrogram visualization,” Computational Intelligence and Neuroscience, vol. 2016, no. 1, pp. 1–13, 2016. [Google Scholar]
17. S. Nisar, M. Tariq, A. Adeel, M. Gogate and A. Hussain, “Cognitively inspired feature extraction and speech recognition for automated hearing loss testing,” Cognitive Computation, vol. 11, no. 1, pp. 1–14, 2019. [Google Scholar]
18. S. Nisar and M. Tariq, “Dialect recognition for low resource language using an adaptive filter bank,” International Journal of Wavelets, Multiresolution and Information Processing, vol. 16, no. 4, pp. 1–17, 2018. [Google Scholar]
19. S. Nisar, I. Shahzad, M. A. Khan and M. Tariq, “Pashto spoken digits recognition using spectral and prosodic based feature extraction,” Ninth Int. Conf. on Advanced Computational Intelligence, vol. 2017, no. 1, pp. 74–78, 2017. [Google Scholar]
20. G. L. Howett, “Size of letters required for visibility as a function of viewing distance and observer visual acuity,” Forgotten Books, vol. 1, no. 1, pp. 1–78, 2019. [Google Scholar]
21. L. Dandona and R. Dandona, “Revision of visual impairment definitions in the international statistical classification of diseases,” BMC Medicine, vol. 4, no. 1, pp. 1–7, 2006. [Google Scholar]
22. A. Ben-Hur and J. Weston, “A user’s guide to support vector machines,” Data Mining Techniques for the Life Sciences, vol. 2009, no. 1, pp. 223–239, 2009. [Google Scholar]
23. W. A. Pradana and U. N. Wisesty, “March. Implementation of support vector machine for classification of speech marked hijaiyah letters based on Mel frequency cepstrum coefficient feature extraction,” Journal of Physics: Conference Series, vol. 971, no. 1, pp. 1–6, 2018. [Google Scholar]
24. T. L. Priya, N. Raajan, N. Raju, P. Preethi and S. Mathini, “Speech and non-speech identification and classification using KNN algorithm,” Procedia Engineering, vol. 38, no. 1, pp. 952–958, 2012. [Google Scholar]
25. N. Bhatia and Vandana, “Survey of nearest neighbor techniques,” International Journal of Computer Science and Information Security, vol. 8, no. 2, pp. 302–305, 2010. [Google Scholar]
26. L. R. Rabiner, “A tutorial on hidden markov models and selected applications in speech recognition,” Proceedings of the IEEE, vol. 77, no. 2, pp. 257–286, 1989. [Google Scholar]
27. B. H. Juang and L. R. Rabiner, “Hidden markov models for speech recognition,” Technometrics, vol. 33, no. 3, pp. 251–272, 1991. [Google Scholar]
 | This work is licensed under a Creative Commons Attribution 4.0 International License, which permits unrestricted use, distribution, and reproduction in any medium, provided the original work is properly cited. |