DOI:10.32604/cmc.2022.020493
| Computers, Materials & Continua DOI:10.32604/cmc.2022.020493 | |
| Article |
A Deep Learning-Based Continuous Blood Pressure Measurement by Dual Photoplethysmography Signals
1Department of Electrical Engineering, National Taiwan Ocean University, Keelung, 202301, Taiwan
2Department of Internal Medicine, National Taiwan University, Yun-Lin Branch, Dou-Liu, 640, Taiwan
3Department of Electrical Engineering, National Formosa University, Yunlin, 632, Taiwan
*Corresponding Author: Chih-Ta Yen. Email: chihtayen@gmail.com
Received: 26 May 2021; Accepted: 27 June 2021
Abstract: This study proposed a measurement platform for continuous blood pressure estimation based on dual photoplethysmography (PPG) sensors and a deep learning (DL) that can be used for continuous and rapid measurement of blood pressure and analysis of cardiovascular-related indicators. The proposed platform measured the signal changes in PPG and converted them into physiological indicators, such as pulse transit time (PTT), pulse wave velocity (PWV), perfusion index (PI) and heart rate (HR); these indicators were then fed into the DL to calculate blood pressure. The hardware of the experiment comprised 2 PPG components (i.e., Raspberry Pi 3 Model B and analog-to-digital converter [MCP3008]), which were connected using a serial peripheral interface. The DL algorithm converted the stable dual PPG signals acquired from the strictly standardized experimental process into various physiological indicators as input parameters and finally obtained the systolic blood pressure (SBP), diastolic blood pressure (DBP) and mean arterial pressure (MAP). To increase the robustness of the DL model, this study input data of 100 Asian participants into the training database, including those with and without cardiovascular disease, each with a proportion of approximately 50%. The experimental results revealed that the mean absolute error and standard deviation of SBP was 0.17 ± 0.46 mmHg. The mean absolute error and standard deviation of DBP was 0.27 ± 0.52 mmHg. The mean absolute error and standard deviation of MAP was 0.16 ± 0.40 mmHg.
Keywords: Deep learning (DL); blood pressure; continuous non-invasive blood pressure measurement; photoplethysmography (PGG)
Hypertension has long been considered a main problem in cardiovascular disease. Abnormal changes in blood pressure, a critical indicator of normal cardiac function, can seriously harm the human body. Blood pressure also provides crucial information regarding cardiovascular status. Lifestyle changes, including changes in food culture (e.g., the rise in consumption of refined foods high in oil, sugar, and salt), increased life stress, and lack of regular exercise are responsible for the annual increases in the number of patients with hypertension. Moreover, this condition is developing in younger adults. In addition, Uncontrolled abnormal blood pressure can lead to various serious complications. Therefore, blood pressure monitoring is essential for the early detection and treatment of hypertension, which is often difficult because it has no obvious symptoms and is thus easily overlooked.
Blood pressure measurement methods can be classified as invasive and noninvasive. Invasive blood pressure measurement is usually performed on critically ill patients or patients undergoing operations. The advantage is that the blood pressure of each heartbeat can be measured in real time. However, measurement can only be conducted after physician evaluation and only in the hospital environment. Noninvasive blood pressure measurement typically involves oscillometry and auscultation, through which blood pressure can only be determined at intervals. The interval between two measurements must be at least 2 min; this is not conducive to continuous blood pressure estimation and monitoring. Furthermore, the inflatable arm cuff used in noninvasive measurement compresses the artery, causing discomfort to the patient.
Photoplethysmography (PPG), which has been widely used in medical research in recent years [1,2], is a low-cost, noninvasive continuous measurement approach in which heart beat signals are obtained from the fingertips, earlobes, and toes. Taking into account the existing invasive or cuff-type technologies for blood pressure measurement in clinical settings, researchers have outlined the advantages of noninvasive and cuffless blood pressure measurement methods that use PPG signals. Chakraborty et al. applied PPG signals to nonparametric regression in order to estimate systolic blood pressure (SBP), diastolic blood pressure (DBP), and mean arterial pressure (MAP) in150 participants. The mean absolute error ± standard deviation for SBP, DBP, and MAP were 2.50 ± 2.07, 2.12 ± 1.79, and 2.69 ± 1.71 mmHg, respectively [3]. Chen et al. used 1060 PPG and electrocardiography (ECG) signals to estimate blood pressure, normalizing related physiological signals such as age, height, weight, and body fat. Reduction of parametric dimensionality was achieved through principal component analysis, with the results used as the training data for support vector machine and random forest regression models. Moreover, the genetic algorithm approach and grid search method were also used to determine the parameter combinations. Random forest regression yielded the lowest mean absolute errors of 4.45 and 3.95 mmHg for SBP and DBP, respectively [4]. In a study on 22 individuals, Liu et al. proposed a strategy for combining principal component analysis and multi-wavelength PPG. Through principal component analysis, signal noise and motion artifacts were removed to obtain more satisfactory features, and the least squares method was adopted for blood pressure estimation. The mean absolute error and standard deviation for SBP and DBP were 5.51 ± 6.89 and 5.57 ± 6.71 mmHg, respectively [5]. Kyriacou et al. applied a bidirectional recurrent neural network and attention mechanism to PPG signals, which were in turn used as signals in the Multiparameter Intelligent Monitoring in Intensive Care (MIMIC) II Databases to estimate blood pressure. A total of 500 items from the database were segmented using a 7-second window, and 22 time–domain features were analyzed and extracted from the PPG waveforms. Dimensionality reduction and preprocessing were conducted to eliminate noise and reduce computational complexity. The mean absolute error and standard deviation of the two-way gated recurrent unit and the first sublayer of attention mechanism for SDP and DBP were 2.58 ± 3.35 and 1.26 ± 1.63 mmHg, respectively [6]. Hajj et al. retrieved data on 500 PPG waveforms from the MIMIC II databases and segmented the data 3-second and 7-second windows. They also selected seven time–domain features, normalized them, and passed them through the gated recurrent unit for training. The mean absolute error and standard deviation for SBP and DBP were 3.25 ± 4.76 and 1.43 ± 1.77 mmHg [7]. Dal et al. retrieved data from the database of Guilin University of Electronic Technology in China, which contains 657 single PPG waveforms and the SBP and DBP data of 219 participants. A moving average filter was used to eliminate noise and high-frequency signals. Five features were then selected from the PPG waveforms. The optimal results were obtained through support vector regression, which revealed that the mean absolute error and standard deviation of SBP and DBP were 13.57 ± 3.23 and 8.30 ± 1.88 mmHg, respectively [8]. Nath et al. retrieved 20 sets of PPG signals from the MIMIC Critical Care database, extracted 10 features, and used adaptive boosting decision tree learning for blood pressure estimation. The mean absolute error and standard deviation of SBP and DBP were 2.07 ± 5.97 and 1.15 ± 4.05 mmHg, respectively [9]. Baek et al. used the heart rate sensor in Samsung Galaxy Note8 smartphones to obtain multi-wavelength PPG signals for matching various combinations. The participants comprised 26 individuals. The PPG signal was resampled at 250 Hz, a 0.4-Hz to 8-Hz band-pass filter was used to remove the noise, and fast Fourier transform was performed to obtain the frequency domain signal. Finally, a convolutional neural network model was employed to estimate blood pressure, with the green light as the most accurate indicator. The mean absolute error and standard deviation of SBP and DBP were 5.28 ± 1.80 and 4.92 ± 2.42 mmHg, respectively [10]. Panwar et al. proposed PP-Net, a deep learning framework that combines a convolutional neural network with a long short-term memory network to estimate SBP, DBP, and heart rate. PPG data selected from the MIMIC II databases were used for training. The mean absolute error and standard deviation of SBP and DBP were 3.97 ± 5.41 and 2.30 ± 5.65 mmHg, respectively [11]. Schlesinger et al. proposed a preprocessing method that added physiological features to the PPG spectrogram, combining a convolutional neural network with a Siamese neural network to train and test the PPG signals from the MIMIC II databases. The mean absolute error and standard deviation for SBP and DBP were 5.95 ± 6.69 and 3.41 ± 3.97 mmHg, respectively [12]. Singla et al. processed and normalized 137 PPG and ECG signals, using wavelet transform as a feature of multiple linear regression. The mean absolute error and standard deviation of SBP and DBP were 5.62 ± 6.39 and 2.56 ± 3.28 mmHg, respectively [13]. Chatterjee et al. used dual PPG sensors to measure PPG signals from the left and right index fingers. The time interval between the two PPG wave crests was obtained and then divided by the crest time value to the crest of left index finger signal. A moving average filter was used to eliminate data noise. Subsequently, multiple linear regression was employed to estimate the SBP [14]. Using PPG and ECG signals from the MIMIC II databases, Yan et al. obtained the SBP and DBP of 604 participants after screening from their arterial blood pressure. After using a moving average filter to eliminate the motion artifacts and noise, training was performed through the proposed Deep-BP. The mean absolute error and standard deviation for SBP and DBP were 3.09 ± 2.76 and 2.11 ± 2 mmHg, respectively [15]. Shimazaki et al. analyzed and processed the PPG signals of 78 participants, using convolutional neural networks to automatically extract features from the waveforms and input physiological parameters such as age, height, weight, and sex into the fully connected layer for training to estimate the SBP. The standard deviation of the SBP was 11.40 mmHg [16].
In sum, most relevant studies used the MIMIC databases and self-measured single PPG signals. Only a few studies have used dual PPG signals. The pulse transit time (PTT) can be more readily obtained from dual PPG signals than from single PPG signals, which is dependent on a synchronized ECG signal. The acquisition of this EG signal involves a relatively complex measurement procedure. Therefore, the PTT and other blood pressure–related features were obtained by using dual PPG sensors in the present study. This was followed by noninvasive continuous blood pressure estimation through deep learning.
2 Physiological Parameters Extracted from Experiments
Physiological parameters are crucial indicators for judging the condition of the human body. The use of diverse physiological parameters can assist physicians in judging the condition of their patients. This study mainly discussed the physiological indicators related to blood pressure, including Heart Rate (HR), pulse wave analysis (PWA), Pulse Transit Time (PTT), Pulse Wave Velocity (PWV), and Perfusion index (PI) as the training parameters of deep learning to devise a noninvasive continuous blood pressure measurement system.
The most common method to estimate HR is by using ECG to extract the R peaks in the QRS complex generated during each heartbeat (the QRS complex is regarded as the criterion of a heartbeat); the heartbeat interval, called the RR interval, occurs after two successive R peaks. According to relevant literature, the PPG signal has the same characteristics [17,18], and it can also extract P waves, which exhibit the same characteristics as the ECG and form peak–peak intervals (Fig. 1). A peak–peak interval in PPG is extracted by identifying the peak of each complete PPG signal; the time generated between each peak is the peak-peak interval. After averaging the value, it is converted to beats/min; the calculation formula of Eq. (1) is as follows:
where HR is heart rate and
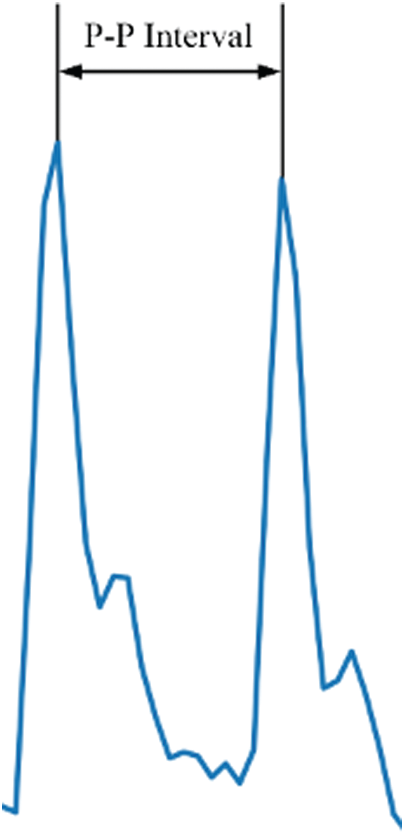
Figure 1: Peak–peak interval diagram
2.2 Pulse Transit Time (PTT) and Pulse Wave Velocity (PWV)
PTT and PWV refer to the time and flow rate of blood in the blood vessel, respectively. The harder the vascular wall is, the faster the blood flow becomes. By contrast, softer blood vessels can absorb the effect of blood flow and, thus, reduce the flow rate [19]. Therefore, a larger PWV indicates a harder vascular wall, which means arteriosclerosis is ongoing [20,21]. According to related studies, PTT is highly correlated with the incidence of cardiovascular disease. A higher PTT suggests a higher possibility of coronary artery disease [22–31]. The calculation formula of PTT is as follows [24]:
where PTT is the pulse transit time, and D is the distance between the two sensors (its definition differs in other methods). According to (2), PTT must be measured before calculating PWV.
PI represents the ratio of the AC to the DC component in the PPG signal. Physiologically, this index represents the change in blood volume at the measurement location, which can be used to predict the change in stroke volume caused by blood arterial circulation. Faster pulsating blood flow can result in a greater pulsating component and PI value. The PPG signal obtains the AC and DC. Physiologically, AC relates to artery compliance, which is proportional to the change in tissue blood pulsation; DC (e.g., skin and veins) is related to the smallest end-diastolic volume of blood pulsating in physiological tissues. The change in blood volume of all sections in the tissue is proportional to the DC component. The AC is obtained by subtracting the trough value (V) from the peak value (P), and the DC component is acquired from V (Fig. 2). Therefore, the formula for PI of Eq. (3) is as follows:
where PI is Perfusion index, AC is alternating current of PPG and DC is direct current of PPG, respectively.
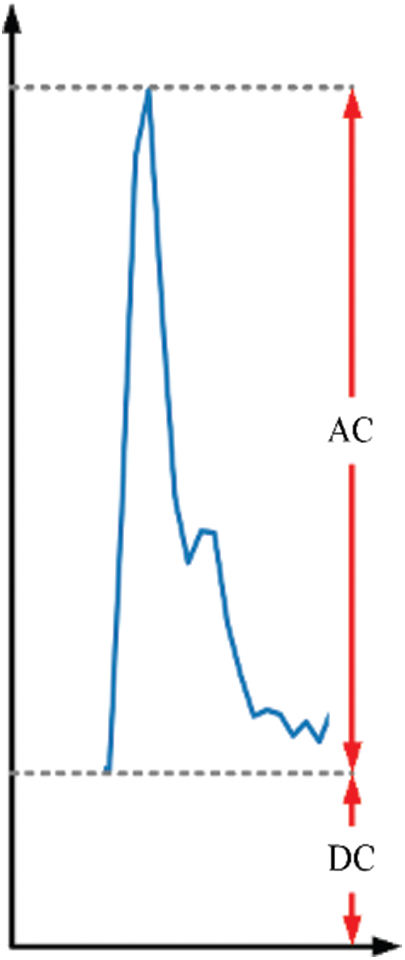
Figure 2: Pulse AC and DC component in PPG
2.4 Evalution of Objective Value
The target values for deep learning were obtained by using the Omron HEM-7070 blood pressure monitor, which can measure SBP, DBP, and MAP as targets for model training. To facilitate the subsequent development of deep learning algorithms, achieve continuous noninvasive blood pressure estimation, and mitigate the discomfort and discontinuity of conventional blood pressure monitors with cuffs, MAP was estimated as follows [32]:
3 Experiments and System Setups
The data source is cooperated with physicians from National Taiwan University Hospital, Yun-Lin Branch, to conduct a clinical trial after being granted approval by the relevant institutional review board. A total of 100 people participated in this study, including 57 outpatients from the cardiovascular disease department and 43 students from the National Formosa University. A large sample was desirable for increasing the number of data in the experimental database and improving the robustness of the BPNN algorithm model when measuring SBP and DBP.
1.The inclusion criteria for this study were as follows:
•Inpatients or outpatients with cardiovascular diseases who routinely undergo general physiological parameter examinations;
•Students with normal blood pressure;
•Patients over 20 years of age.
2.The exclusion criteria were as follows:
•Pregnant women;
•Children or minors (under 20 years old);
•People with mental disorders.
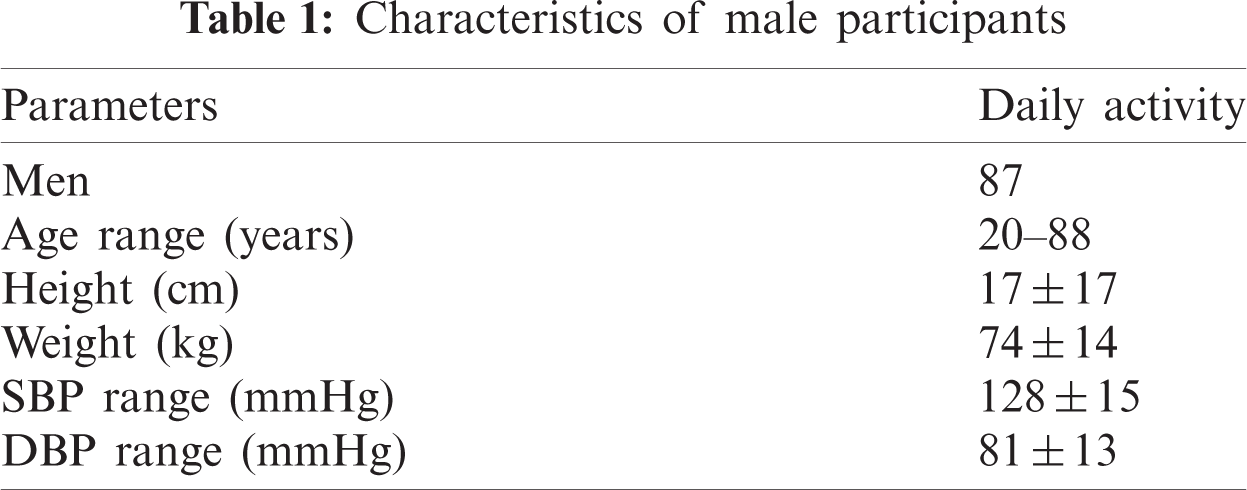
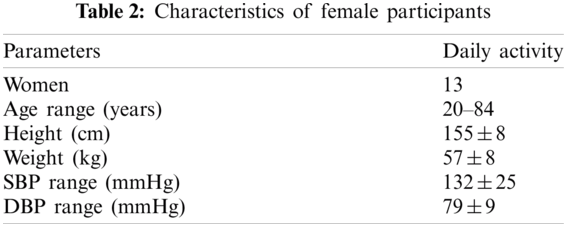
This study used the dual PPG measurement method to capture waveform signals of the human body. The number of male participants was 87, and their SBP and DBP ranged from 98–179 and 32–121, respectively. The SBP and DBP of the 13 female participants ranged from 99–193 and 57–102, respectively. The participants’ age range, average height, average weight, SBP, and DBP are presented in Tabs. 1 and 2.
The experimental location was a quiet empty room next to the physician’s office; the experimental environment is depicted in Fig. 3. During the experiment, the participants did not have any contact or interaction with the physician. At the beginning of the experiment, the participants were provided with detailed information on the process and purpose of the experiment. The experiment started after patients signed the consent form [33,34]. The crucial elements of the experiment are as follows:
1.Informed consent form;
2.Dual PPG system;
3.Raspberry Pi 3;
4.Omron HEM-7070 (Omron Corporation, Kyoto, Japan) electronic blood pressure monitor;
5.Lay participant’s hands flat on a table, aligned with the position of the heart;
6.Quiet environment;
7.Basic information of experimental participants.
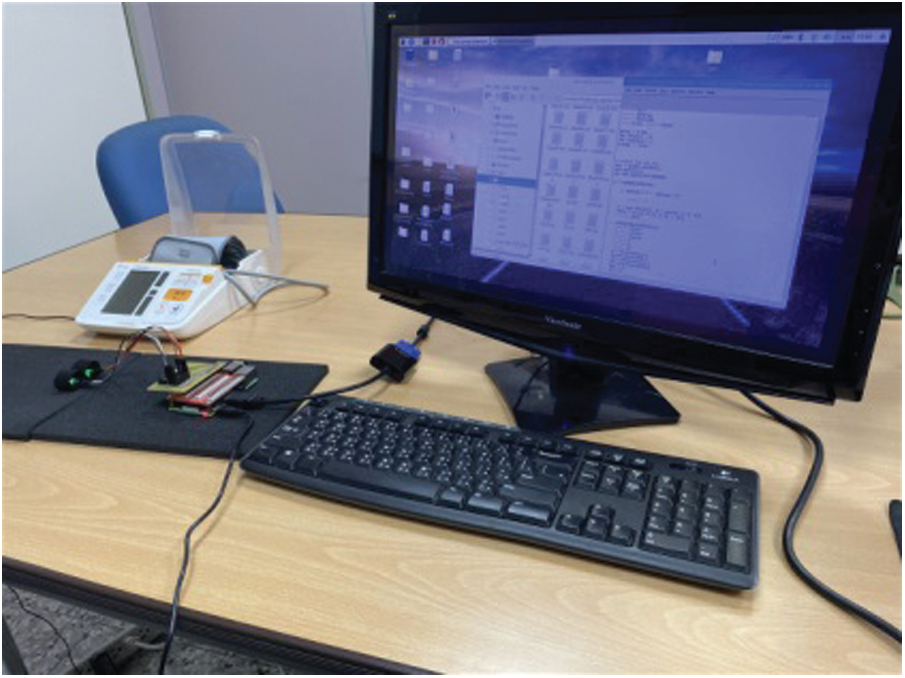
Figure 3: Experimental environment and apparatus layout
The study explored the use of noninvasive PPG for measuring human photoelectric signals and obtained relevant waveforms to identify the characteristics related to blood pressure. The data of the participants were collected through the following procedure:
1.Male and female volunteers with and without cardiovascular disease were invited to participate in this study. All participants were informed regarding the research objective and experimental methods, and they subsequently signed an informed consent form.
2.The participants placed both their hands at the same height as the heart and sat quietly (without talking) for 5 min; this enabled the researchers to obtain a stable PPG waveform and blood pressure.
3.The inflatable sleeve (Omron) was wrapped around the left upper arm and compressed once every 2 min for a total of three times. The dual PPG was fixed on the index and middle fingers to measure the PPG signal waveform, and the waveform and conversion parameters were continuously recorded for approximately 5 min. The experiment had a duration of 10 min per person, and the collected data were used as the training data set of the deep learning network.
4.The age, height, and weight of the participants were obtained after the experiment.
The experimental measurement process, deep learning training framework is illustrated in Fig. 4.
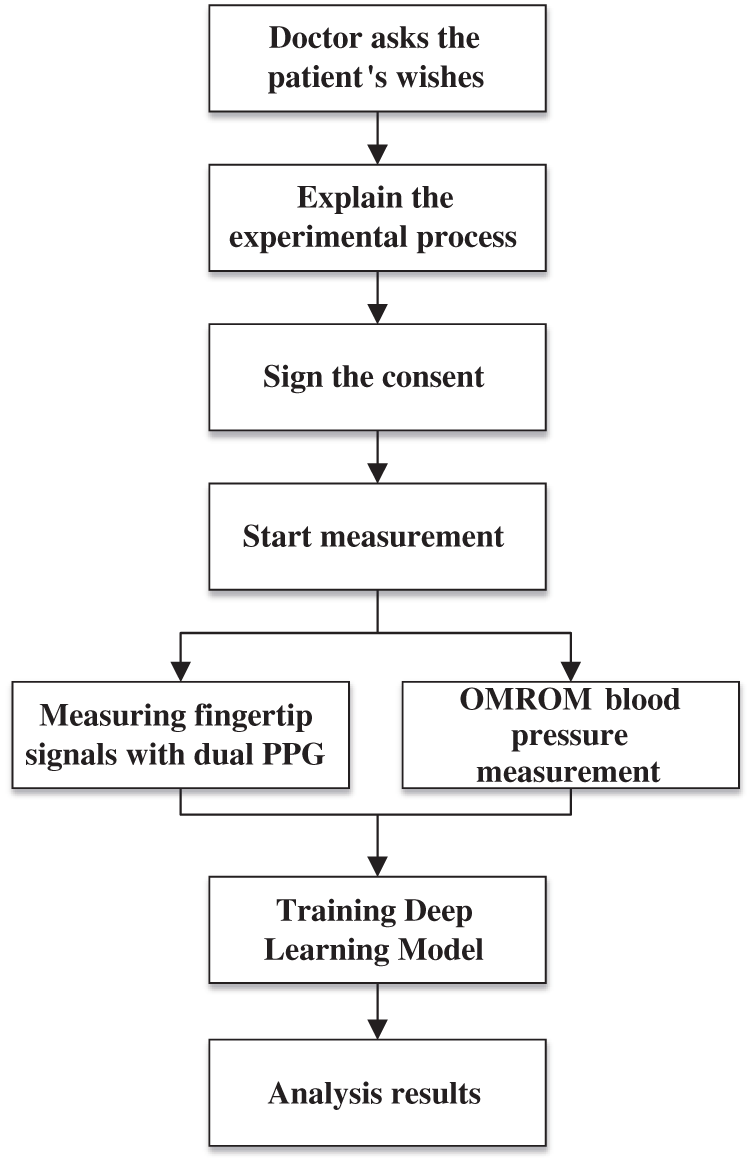
Figure 4: Flowchart of the clinical experiment
This study implemented a continuous blood pressure measurement platform, the hardware models are as following. The system included two green-light PPG sensors (SEN-11574), a Raspberry Pi 3, an MCP3008, and an Omron blood pressure monitor (HEM-7070). The two PPGs were clipped onto the index and middle fingers and were connected to the Raspberry Pi 3 through the serial peripheral interface (SPI). The MCP3008 was used to convert analog signals to digital signals, and Python syntax was used to process PPG signals to obtain signal waveforms and extract the characteristics. Finally, the Omron blood pressure monitor was used to measure blood pressure simultaneously on the same hand. After algorithm analysis and calculation, the researchers conducted conversion to obtain the HR, PTT, PWV, PI, and blood pressure–related data, and the SBP, DBP and MAP were calculated. The system structure is illustrated in Fig. 5.
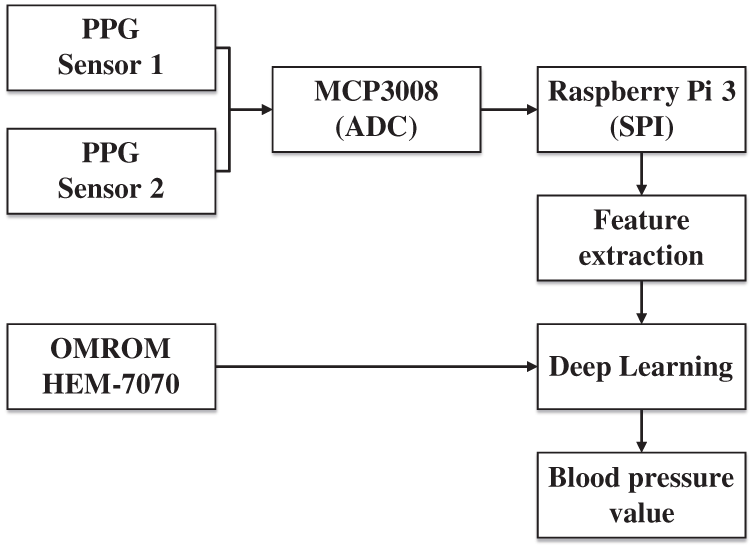
Figure 5: System structure diagram
3.3 The Design Issue of Deep Learning Network
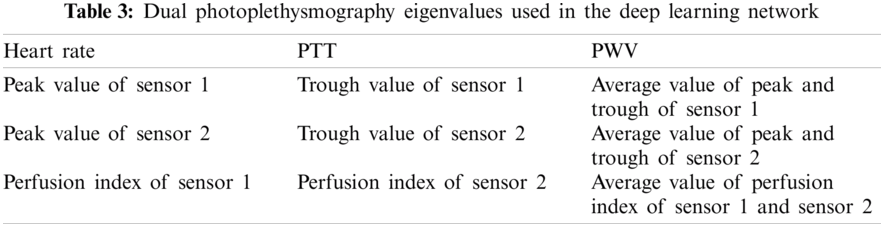
The network architecture is presented in Fig. 6. The input format was set as matrix, measuring 12 × 1, that included the features described in Tab. 3. First, feature extraction was performed by setting the first layer of the convolution filter to 256 neurons and the convolution kernel size to 3 × 1. The maximum pooling layer was then used to reduce the computational complexity and extract the most salient features. The pooling window was set to 2 × 1. Next, the second layer of the convolution filter was set to 128 neurons and the convolution kernel size was set to 3 × 1 for another round of feature extraction. Feature dimensionality was then reduced by using a flattening layer to facilitate the subsequent training of the fully connected layers. The first fully connected layer was set to 512 neurons. To prevent overfitting, dropout of 20% of the neurons in this layer was applied. Next, 256 neurons were set up through the second fully connected layer for computation. Finally, three values of SBP, DBP, and MAP were output through the output layer (Tab. 4). The activation functions of the convolutional and fully connected layers used rectified linear units to strengthen the nonlinear relationship between the neural network layers. This caused the initial negative output to become 0, which can prevent overfitting to a certain extent, as well as prevent the vanishing gradient problem. The spans of the convolutional and maximum pooling layers were both set to 1, and both were padded. The input and output were converted to within the range of 0 to 1 through minimum–maximum normalization.
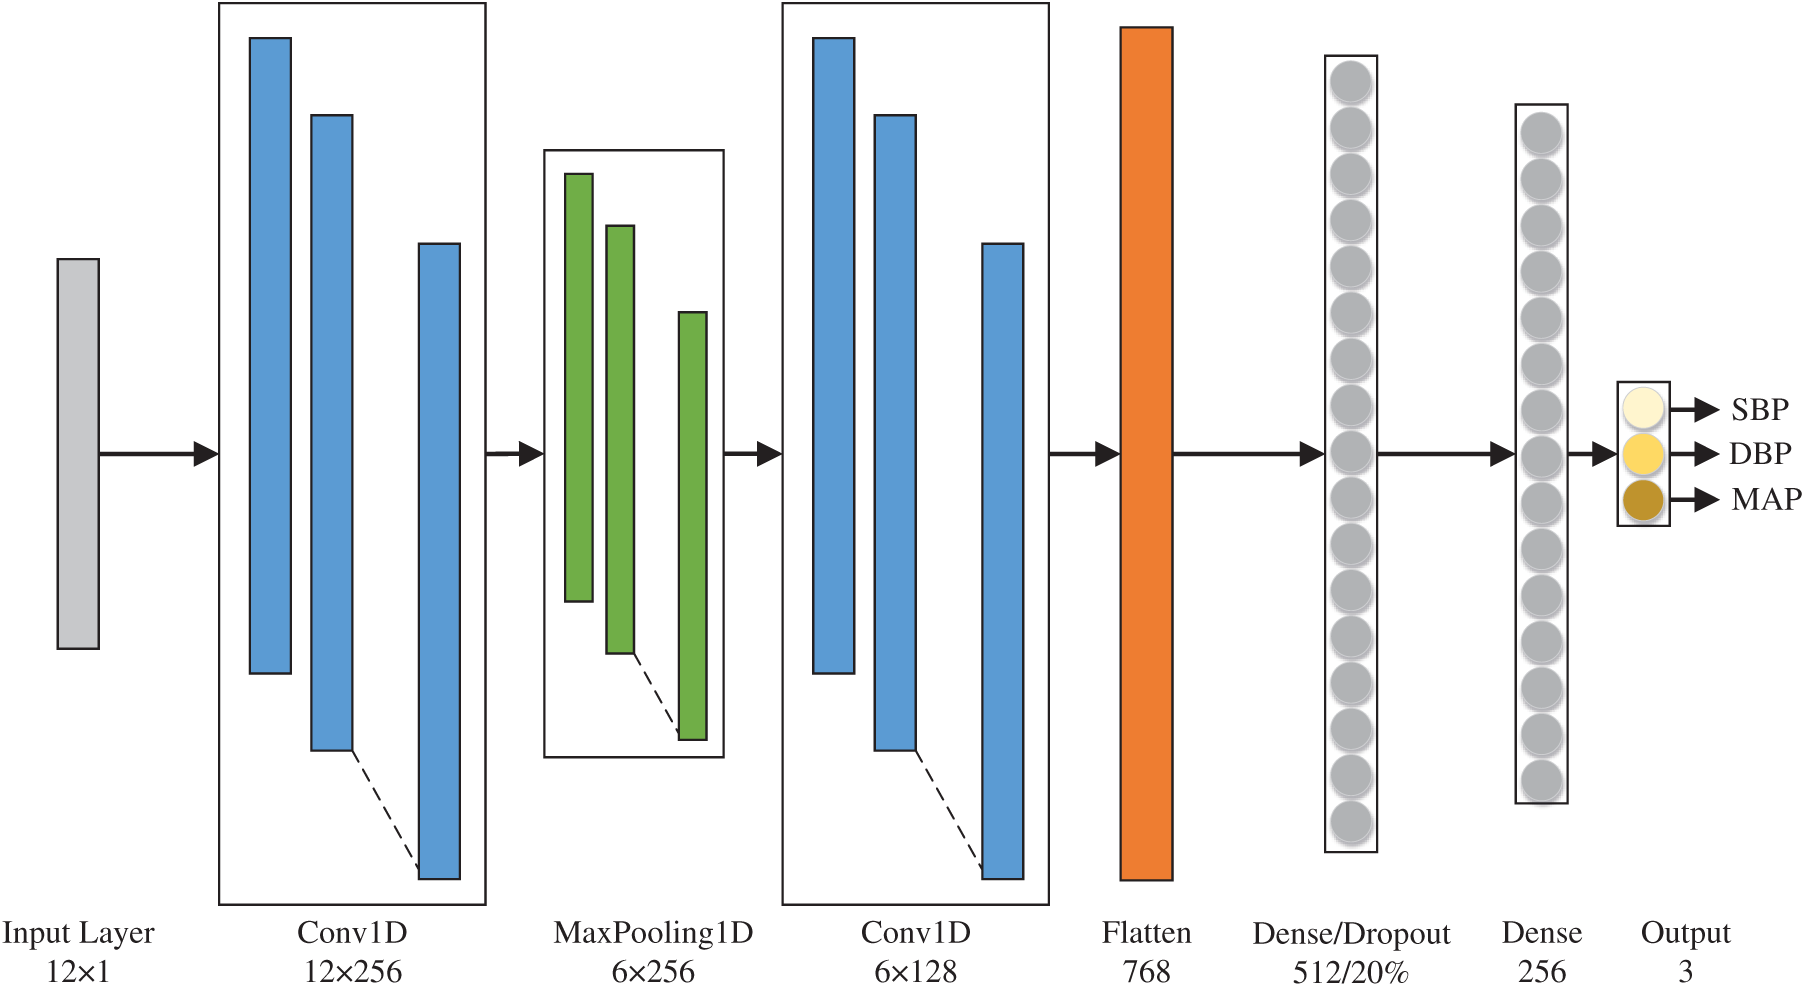
Figure 6: Deep learning network architecture

The number of epochs was set to 2000, and the early stopping method was used. Specifically, when the model loss function did not exhibit obvious changes, training was stopped and the training model was stored. The batch size was set to 64, the Adam optimizer learning rate was set to 0.001, and the mean squared error, calculated as shown in Eq. (5), was used in the loss function. The loss function was smaller when the estimated value was closer to the actual value, but it was larger when the difference between the actual and estimated values was larger.
where
Regarding model evaluation, mean absolute error, calculated as in Eq. (6), was used to better reflect the actual situation of the estimated values. The standard deviation constituted as measure of dispersion, as shown in Eq. (7).
where
where
A total of 100 participants were recruited, and three sets of experimental data were collected from each participant, totaling 300 sets, each of which had 12 eigenvalues collected using dual PPG sensors. The proposed deep learning network was trained. As shown in the training convergence curve in Fig. 7, the training loss curve fell rapidly before 250 epochs. Less fluctuation and gradual stabilization are observable later on. The curve indicates that the proposed deep learning model was able to converge the sensor-collected data in a stable manner. The early stopping method was used to prevent the overfitting of the model, which converged to 1931 epochs, with a loss of less than 0.0001.
The present experiments were conducted with reference to [13] and [14]. The mean absolute error and standard deviation of SBP, DBP, and MAP, as estimated by deep learning model, were 0.17 ± 0.46, 0.27 ± 0.52, and 0.16 ± 0.40 mmHg, respectively.
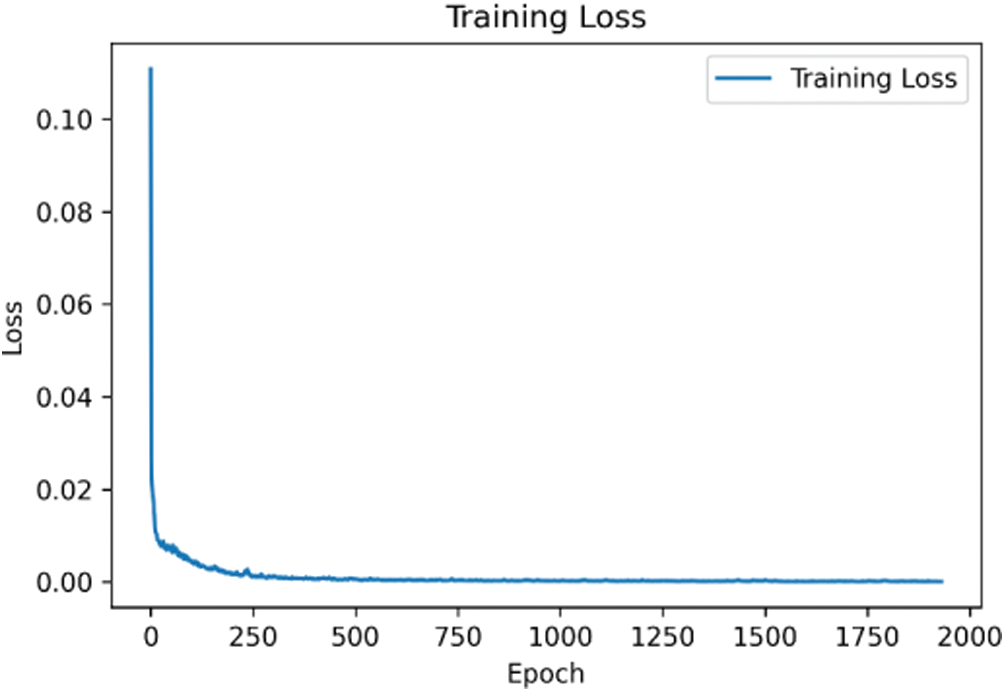
Figure 7: Training convergence curve
The scatter plots and trend lines of the actual measurement and the estimation results from the deep learning model for SBP, DBP, and MAP are presented in Figs. 8–10, respectively. The estimates were close to the trend lines, and the
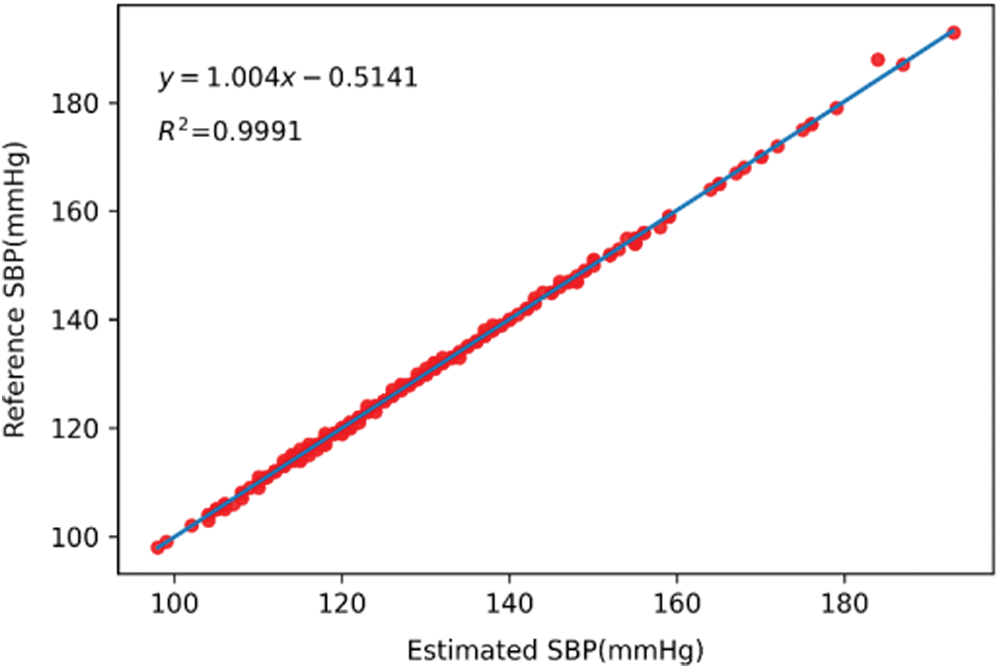
Figure 8: Scatter plot and trend line of systolic blood pressure
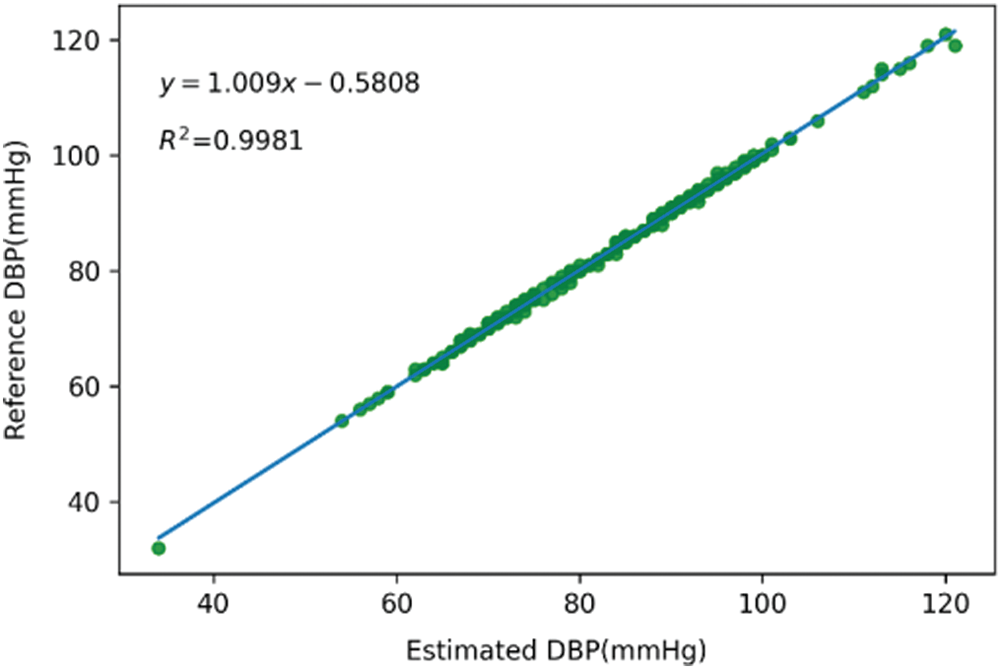
Figure 9: Scatter plot and trend line of diastolic blood pressure
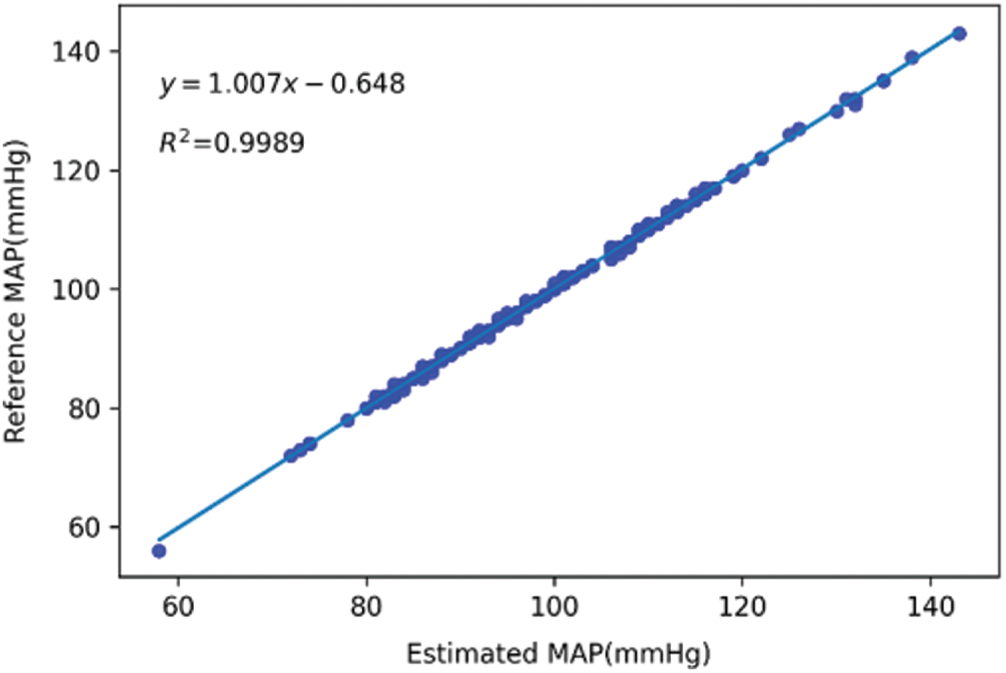
Figure 10: Scatter plot and trend line of mean arterial pressure
The line charts of the actual measurement and the estimation results of the deep learning model for SBP, DBP, and MAP are shown in Figs. 11–13, respectively. The values that were determined using the Omron monitor were similar to the estimations of the deep learning model. Overall, the estimations were somewhat accurate.
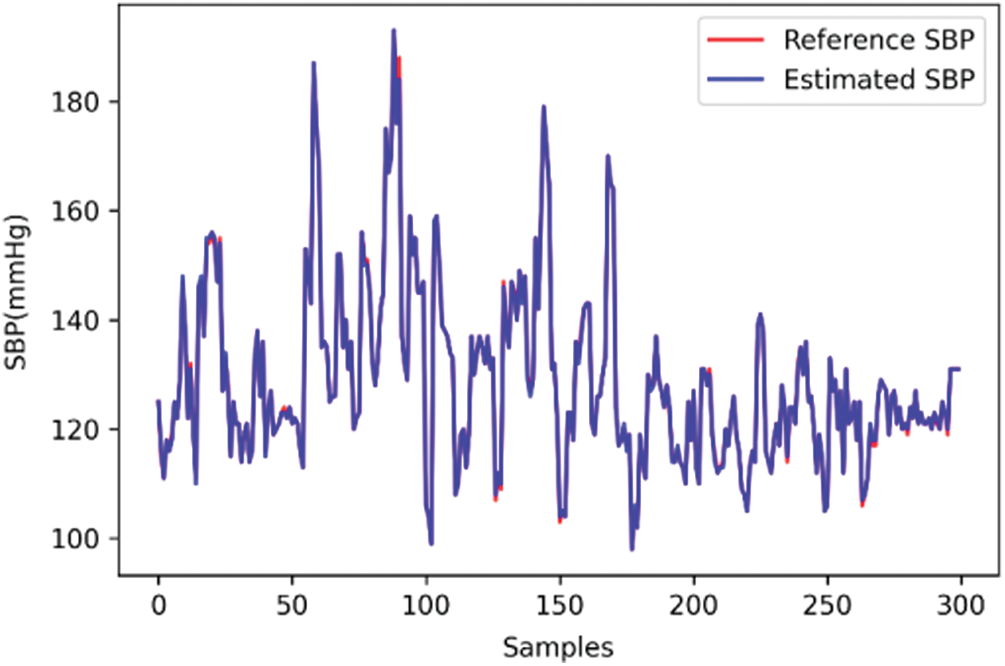
Figure 11: Line chart of systolic blood pressure
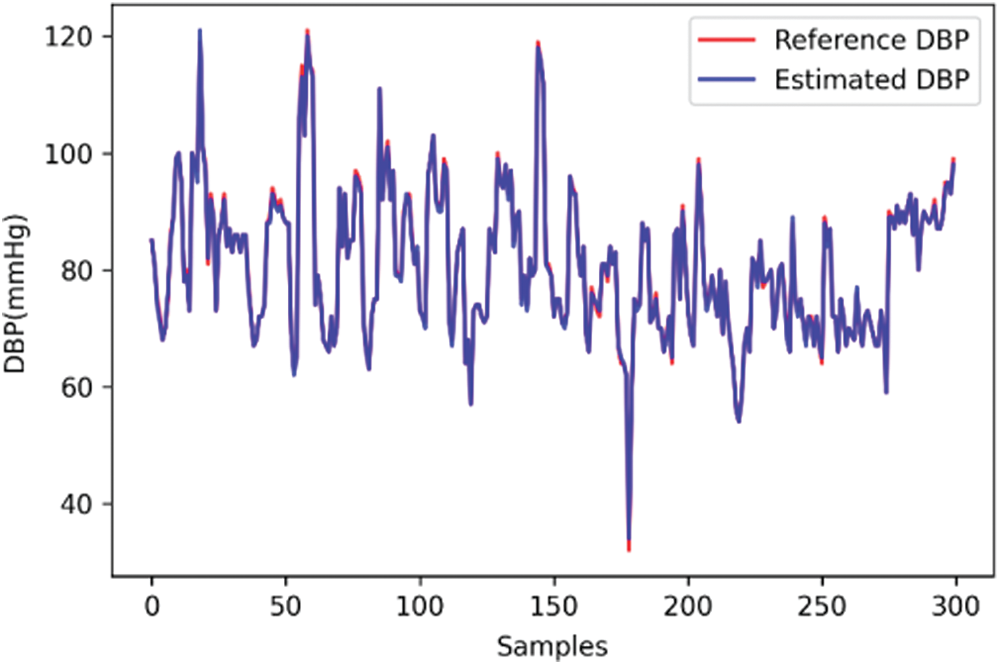
Figure 12: Line chart of diastolic blood pressure
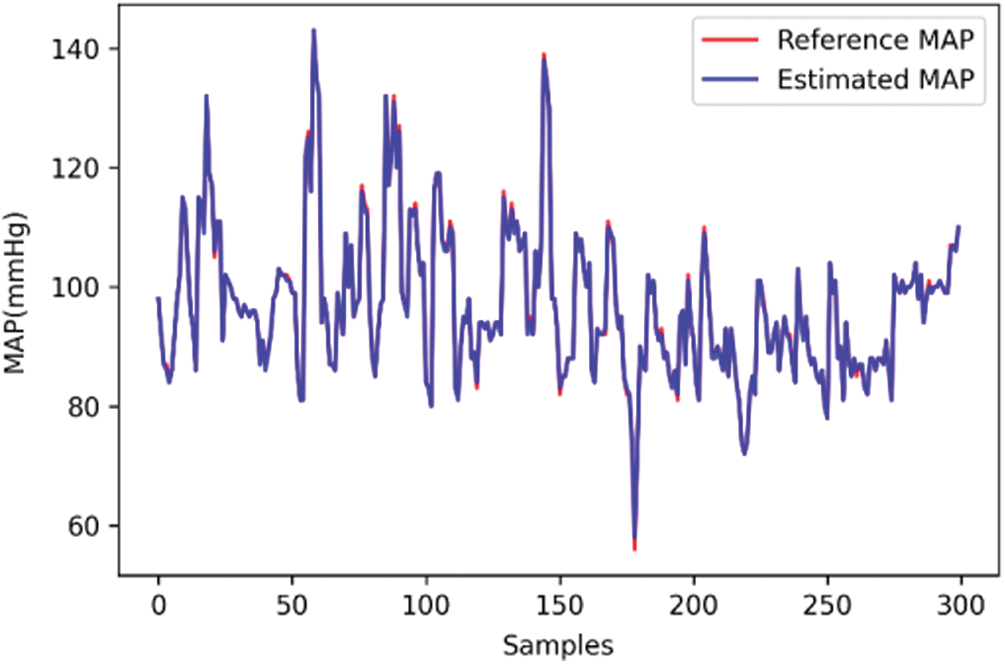
Figure 13: Line chart of mean arterial pressure
Results from the comparison of SBP and DBP, which was performed according to the evaluation method presented in [13], are shown in Tab. 5.
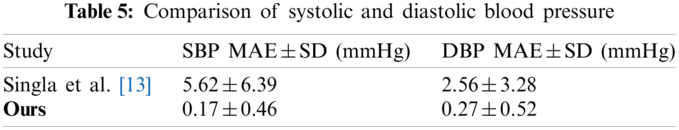
Under the proposed blood pressure monitoring method, dual PPG sensors were placed on the index and middle fingers of the same hand. The signals were captured at the same time as the peak and trough values, heart rate, perfusion index, PTT, and pulse wave velocity were recorded. A deep learning algorithm was used to calculate the SBP, DBP, and MAP. To increase the robustness of the network model, the data of 100 Asian individuals were input into the network training database, with the data of participants with and without cardiovascular disease, each with a proportion of approximately 50%. The mean absolute error and standard deviation of the SBP, DBP, and MAP estimated by the model were 0.17 ± 0.46, 0.27 ± 0.52, and 0.16 ± 0.40 mmHg, respectively. The present method differed from the conventional blood pressure estimation method, through which the ECG and PPG signals must be simultaneously obtained to measure the PTT. In this study, dual PPG signals were used for blood pressure estimation, and deep learning was applied to obtain more favorable results.
Funding Statement: This study was supported in part by the Ministry of Science and Technology MOST 108-2221-E-150-022-MY3 and National Taiwan Ocean University.
Conflicts of Interest: The authors declare that they have no conflicts of interest to report regarding the present study.
1. A. Avolio, “The finger volume pulse and assessment of arterial properties,” Journal of Hypertension, vol. 20, no. 12, pp. 2341–2343, 2002. [Google Scholar]
2. J. Allen, “Photoplethysmography and its application in clinical physiological measurement,” Physiological Measurement, vol. 28, no. 3, pp. R1–39, 2007. [Google Scholar]
3. A. Chakraborty, D. Goswami, J. Mukhopadhyay and S. Chakrabarti, “Measurement of arterial blood pressure through single-site acquisition of photoplethysmograph signal,” IEEE Transactions on Instrumentation and Measurement, vol. 70, pp. 1–10, 2021. [Google Scholar]
4. X. Chen, S. Yu, Y. Zhang, F. Chu and B. Sun, “Machine learning method for continuous noninvasive blood pressure detection based on random forest,” IEEE Access. vol. 9, pp. 34112–34118, 2021. [Google Scholar]
5. J. Liu, S. Qiu, N. Luo, S.-K. Lau, H. Yu et al., “PCA-based multi-wavelength photoplethysmography algorithm for cuffless blood pressure measurement on elderly subjects,” IEEE Journal of Biomedical and Health Informatics, vol. 25, no. 3, pp. 663–673, 2021. [Google Scholar]
6. C. El-Hajj and P. A. Kyriacou, “Deep learning models for cuffless blood pressure monitoring from PPG signals using attention mechanism,” Biomedical Signal Processing and Control, vol. 65, pp. 102301, 2021. [Google Scholar]
7. C. El Hajj and P. A. Kyriacou, “Cuffless and continuous blood pressure estimation from PPG signals using recurrent neural networks,” in 2020 42nd Annual Int. Conf. of the IEEE Engineering in Medicine & Biology Society, Montreal, QC, Canada, pp. 4269–4272, 2020. [Google Scholar]
8. S. Kılıçkaya, A. Güner and B. Dal, “Comparison of different machine learning techniques for the cuffless estimation of blood pressure using PPG signals,” in 2020 International Congress on Human-Computer Interaction, Optimization and Robotic Applications, Ankara, Turkey, pp. 1–6, 2020. [Google Scholar]
9. R. K. Nath and H. Thapliyal, “PPG based continuous blood pressure monitoring framework for smart home environment,” in 2020 IEEE 6th World Forum on Internet of Things, New Orleans, LA, USA, pp. 1–6, 2020. [Google Scholar]
10. S. Baek, J. Jang, S.-H. Cho, J. M. Choi and S. Yoon, “Blood pressure prediction by a smartphone sensor using fully convolutional networks,” in 2020 42nd Annual Int. Conf. of the IEEE Engineering in Medicine & Biology Society, Montreal, QC, Canada, pp. 188–191, 2020. [Google Scholar]
11. M. Panwar, A. Gautam, D. Biswas and A. Acharyya, “PP-net: A deep learning framework for PPG-based blood pressure and heart rate estimation,” IEEE Sensors Journal, vol. 20, no. 17, pp. 10000–10011, 2020. [Google Scholar]
12. O. Schlesinger, N. Vigderhouse, D. Eytan and Y. Moshe, “Blood pressure estimation from PPG signals using convolutional neural networks and siamese network,” in ICASSP, 2020—2020 IEEE Int. Conf. on Acoustics, Speech and Signal Processing, Barcelona, Spain, pp. 1135–1139, 2020. [Google Scholar]
13. M. Singla, P. Sistla and S. Azeemuddin, “Cuff-less blood pressure measurement using supplementary ECG and PPG features extracted through wavelet transformation,” in 2019 41st Annual Int. Conf. of the IEEE Engineering in Medicine and Biology Society, Berlin, Germany, pp. 4628–4631, 2019. [Google Scholar]
14. A. Chatterjee, M. Mitra and S. Pal, “Cuffless systolic blood pressure estimation using photoplethysmography signal,” in 2019 Int. Conf. on Computing, Power and Communication Technologies, New Delhi, India, pp. 424–427, 2019. [Google Scholar]
15. C. Yan, Z. Li, W. Zhao, J. Hu, D. Jia et al., “Novel deep convolutional neural network for cuff-less blood pressure measurement using ECG and PPG signals,” in 2019 41st Annual Int. Conf. of the IEEE Engineering in Medicine and Biology Society, Berlin, Germany, pp. 1917–1920, 2019. [Google Scholar]
16. S. Shimazaki, H. Kawanaka, H. Ishikawa, K. Inoue and K. Oguri, “Cuffless blood pressure estimation from only the waveform of photoplethysmography using CNN,” in 2019 41st Annual Int. Conf. of the IEEE Engineering in Medicine and Biology Society, Berlin, Germany, pp. 5042–5045, 2019. [Google Scholar]
17. K. Nakajima, T. Tamura and H. Miike, “Monitoring of heart and respiratory rates by photoplethysmography using a digital filtering technique,” Medical Engineering & Physics, vol. 18, no. 5, pp. 365–372, 1996. [Google Scholar]
18. T. Vandenberk, J. Stans, C. Mortelmans, R. Van Haelst, G. V. Schelvergem et al., “Clinical validation of heart rate apps: Mixed-methods evaluation study,” JMIR MHealth UHealth, vol. 5, no. 8, pp. e129, 2017. [Google Scholar]
19. R. Shriram, A. Wakankar, N. Daimiwal and D. Ramdasi, “Continuous cuffless blood pressure monitoring based on PTT,” in 2010 Int. Conf. on Bioinformatics and Biomedical Technology, Chengdu, China, pp. 51–55, 2010. [Google Scholar]
20. D. B. McCombie, A. T. Reisner and H. H. Asada, “Adaptive blood pressure estimation from wearable PPG sensors using peripheral artery pulse wave velocity measurements and multi-channel blind identification of local arterial dynamics,” in 2006 Int. Conf. of the IEEE Engineering in Medicine and Biology Society, New York, NY, USA, pp. 3521–3524, 2006. [Google Scholar]
21. L. Peter, N. Noury and M. Cerny, “A review of methods for non-invasive and continuous blood pressure monitoring: Pulse transit time method is promising?,” IRBM, vol. 35, no. 5, pp. 271–282, 2014. [Google Scholar]
22. L. A. Geddes, M. H. Voelz, C. F. Babbs, J. D. Bourland and W. A. Tacker, “Pulse transit time as an indicator of arterial blood pressure,” Psychophysiology, vol. 18, no. 1, pp. 71–74, 1981. [Google Scholar]
23. R. A. Allen, J. A. Schneider, D. M. Davidson, M. A. Winchester and C. B. Taylor, “The covariation of blood pressure and pulse transit time in hypertensive patients,” Psychophysiology, vol. 18, no. 3, pp. 301–306, 1981. [Google Scholar]
24. J. Kerola, V. Kontra and R. Sepponen, “Non-invasive blood pressure data acquisition employing pulse transit time detection,” in Proc. of 18th Annual Int. Conf. of the IEEE Engineering in Medicine and Biology Society, Amsterdam, Netherlands, pp. 1308–1309, 1996. [Google Scholar]
25. K. Meigas, R. Kattai and J. Lass, “Continuous blood pressure monitoring using pulse wave delay,” in 2001 Conf. Proc. of the 23rd Annual Int. Conf. of the IEEE Engineering in Medicine and Biology Society, Istanbul, Turkey, pp. 3171–3174, 2001. [Google Scholar]
26. A. Rasool, M. Rafiq, A. Nasir and F. M. Kashif, “Continuous and noninvasive blood pressure estimation by two-sensor measurement of pulse transit time,” in 2018 14th Int. Conf. on Emerging Technologies, Islamabad, Pakistan, pp. 1–5, 2018. [Google Scholar]
27. W. Lin, H. Wang, O. W. Samuel and G. Li, “Using a new PPG indicator to increase the accuracy of PTT-based continuous cuffless blood pressure estimation,” in 2017 39th Annual Int. Conf. of the IEEE Engineering in Medicine and Biology Society, Jeju, Korea (Southpp. 738–741, 2017. [Google Scholar]
28. S. Puke, T. Suzuki, K. Nakayama, H. Tanaka and S. Minami, “Blood pressure estimation from pulse wave velocity measured on the chest,” in 2013 35th Annual Int. Conf. of the IEEE Engineering in Medicine and Biology Society, Osaka, Japan, pp. 6107–6110, 2013. [Google Scholar]
29. X. Ding, B. P. Yan, Y. T. Zhang, J. Liu, N. Zhao et al., “Pulse transit time based continuous cuffless blood pressure estimation: A new extension and a comprehensive evaluation,” Scientific Reports, vol. 7, no. 1, pp. 1–11, 2017. [Google Scholar]
30. K. J. B. Noche, J. F. Villaverde and J. Lazaro, “Portable non-invasive blood pressure measurement using pulse transmit time,” in 2017 IEEE 9th Int. Conf. on Humanoid, Nanotechnology, Information Technology, Communication and Control, Environment and Management, Manila, Philippines, pp. 1–4, 2017. [Google Scholar]
31. J. Q. Li, R. Li, Z. Z. Chen, G. Q. Deng, H. Wang et al., “Design of a continuous blood pressure measurement system based on pulse wave and ECG signals,” IEEE Journal of Translational Engineering in Health and Medicine, vol. 6, pp. 1–14, 2018. [Google Scholar]
32. D. DeMers and D. Wachs, Physiology, Mean Arterial Pressure, StatPearls [Internet], 2021. [Online]. Available:https://www.ncbi.nlm.nih.gov/books/NBK538226/. [Google Scholar]
33. J. Liu, Y. Ou, B. P. Yan, C. Sodini and N. Zhao, “Comparisons of oscillometric blood pressure measurements at different sites of the upper limb,” in 2018 40th Annual Int. Conf. of the IEEE Engineering in Medicine and Biology Society, Honolulu, HI, USA, pp. 1168–1171, 2018. [Google Scholar]
34. J. Baek, J. Kim, N. Kim, D. Lee and S. Park, “Validation of cuffless blood pressure monitoring using wearable device,” in TENCON, 2018—2018 IEEE Region 10 Conf., Jeju, Korea (Southpp. 416–419, 2018. [Google Scholar]
 | This work is licensed under a Creative Commons Attribution 4.0 International License, which permits unrestricted use, distribution, and reproduction in any medium, provided the original work is properly cited. |