DOI:10.32604/cmc.2022.019823
| Computers, Materials & Continua DOI:10.32604/cmc.2022.019823 | |
| Article |
Indoor Electromagnetic Radiation Intensity Relationship to Total Energy of Household Appliances
1Department of Electrical Engineering–Communication Engineering, Sana’a University, Yemen
2Department of Electrical Engineering, College of Engineering, Princess Nourah bint Abdulrahman University, Saudi Arabia
3Department of Computer Science, King Khalid University, Muhayel Aseer, Saudi Arabia & Faculty of Computer and IT, Sana’a University, Sana’a, Yemen
4Department of Information Systems, King Khalid University, Mayahel Aseer, KSA
5Department of Computer and Self Development, Preparatory Year Deanship, Prince Sattam bin Abdulaziz University, AlKharj, Saudi Arabia
*Corresponding Author: Fahd N. Al-Wesabi. Email: falwesabi@kku.edu.sa
Received: 26 April 2021; Accepted: 16 July 2021
Abstract: The rapid technological developments in the modern era have led to increased electrical equipment in our daily lives, work, and homes. From this standpoint, the main objective of this study is to evaluate the potential relationship between the intensity of electromagnetic radiation and the total energy of household appliances in the living environment within the building by measuring and analyzing the strength of the electric field and the entire electromagnetic radiation flux density of electrical devices operating at frequencies (5 Hz to 1 kHz). The living room was chosen as a center for measurement at 15 homes in three different environmental regions (urban, suburbs, and open areas). The three measurement methods are (Mode 1: people in a sitting position with electrical appliances on. Mode 2: People in a standing position with electrical appliances on. Mode 3: People are in the upright position while turning off the electrical devices) in the living room. These measurement methods and their results reinforce the importance of this research. The results showed that the average electric field strength measured in Mode 2 is much greater than the two methods, and we also found less electromagnetic radiation in Mode 3 than in the two modes. All results remain within the recommended overall exposure developed by the International Committee for the Prevention of Non-Ionizing Radiation and the International Electrotechnical Commission.
Keywords: Exposure assessment; electromagnetic field; household appliances; indoor various environments; epidemiology
The rapid progress and growth of technology in the field of electronic devices and technologies, and their developments in our personal and business lives and those around us have led to make electrical appliances indispensable in our lives [1]. At the same time, the public is exposed to increasing numbers of several sources of electromagnetic fields (EMF) (transmission lines, power supplies, transformers, and other electronic and electrical technologies), which may have potential health effects [2–4]. Many epidemiological studies explain the possible relationship between human health and electromagnetic fields [5–7], and some studies have found shallow frequency (ELF) considered being a carcinogen [8,9]. As the devices emit electric fields (EF) and magnetic fields (MF), which increases the importance of knowing the public’s exposure to EMF emissions, what is its effect? Is there a comprehensive relationship between the (cumulative) frequencies between them? Thus, we find new questions that must be asked, which need more practical and varied studies.
Electromagnetic fields are generally subject to restrictions according to the type of frequencies from international commissions, bodies, etc., to protect the public from adverse effects that may affect potential human health. For example, electromagnetic fields for household appliances (i.e., less than 1 MHz) are subject to restrictions based on recommendations of the international authorities as (ICNIRP) [10]. There are varying efforts according to frequency type (typical, limited, rare, and dominant) in terms of studies to determine the public’s exposure to electromagnetic fields of different frequencies in many countries and especially developing countries in several different ways over the past three decades [11,12]. In this panorama, the International Non-Ionizing Radiation Protection Committee (ICNIRP) also published proposed guidelines for exposure limits for ELF-EMF fields in 1998 [13] and updated them in 2020 [14].
We find that there are relatively few public exposure studies to intermediate frequencies (IF) and (EMF). What is meant here is new equipment, or in the sense of electronic monitoring, energy-saving lamps, cooking ovens, monitoring systems, and electronic article monitoring systems (EAS) with all its various and complex applications. It has shown the results of the study exceeded the reference levels for most of the spatial locations of the network [15], and this is what our research concerns, because most devices operate at a frequency of 50 Hz to 60 Hz, which is the frequency (5 Hz to 1 kHz), which is part of the intermediate frequencies.
In this paper, we are interested in this problem and the questions raised. From this point, our research aims to measure the strength of the electric field in real estate covering 15 homes with home appliances (5 Hz to 1 kHz) and different environmental regions (urban, suburban and open areas) to describe audience exposure to these frequencies. The measurement was made in the living room, which represents most of the appliances at home.
As part of our human and scientific mission, conducting this research will fill essential gaps in science and request more studies to answer the questions. This research’s importance lies in two main points, namely whether there is a comprehensive (cumulative) relationship for the different frequency bands. The second point is summarized by the three measurement methods, which are almost non-existent in other studies. Our research results posed many essential questions that enhance our research and request more reviews on this topic.
The rest of this paper has more six sections. Section 2 provides the proposed system model. Theoretical background and formulation are provided in Section 3. Section 4 provides the materials and methods. Results discussion and comparison are provided in Section 5. Special and rare cases are provided in Section 6. Finally, section 7 concludes the article.
Suppose the proposed system model has four core parts are measurement devices, measuring site, analysis and statistics, and results and comparison.
The first part is focusing on measuring devices based on three areas which are urban area, suburban area, and open area. Each of those areas will be measured in five houses. The second part is focusing on measuring the site (living rooms) based on different three modes. The parameters of the first mode are electric appliances (5 Hz to 1 KHz), turned off, and people in the standing case. Though, the factors of the second mode are electric appliances (5 Hz to 1 KHz), turned on, and people in the standing case. However, the factors of the third mode are electric appliances (5 Hz to 1 KHz), turned on, and people in the sitting case. The third part provides analysis and statistics, and the fourth part provides an evaluation of the proposed system model and comparison as illustrated in Fig. 1.
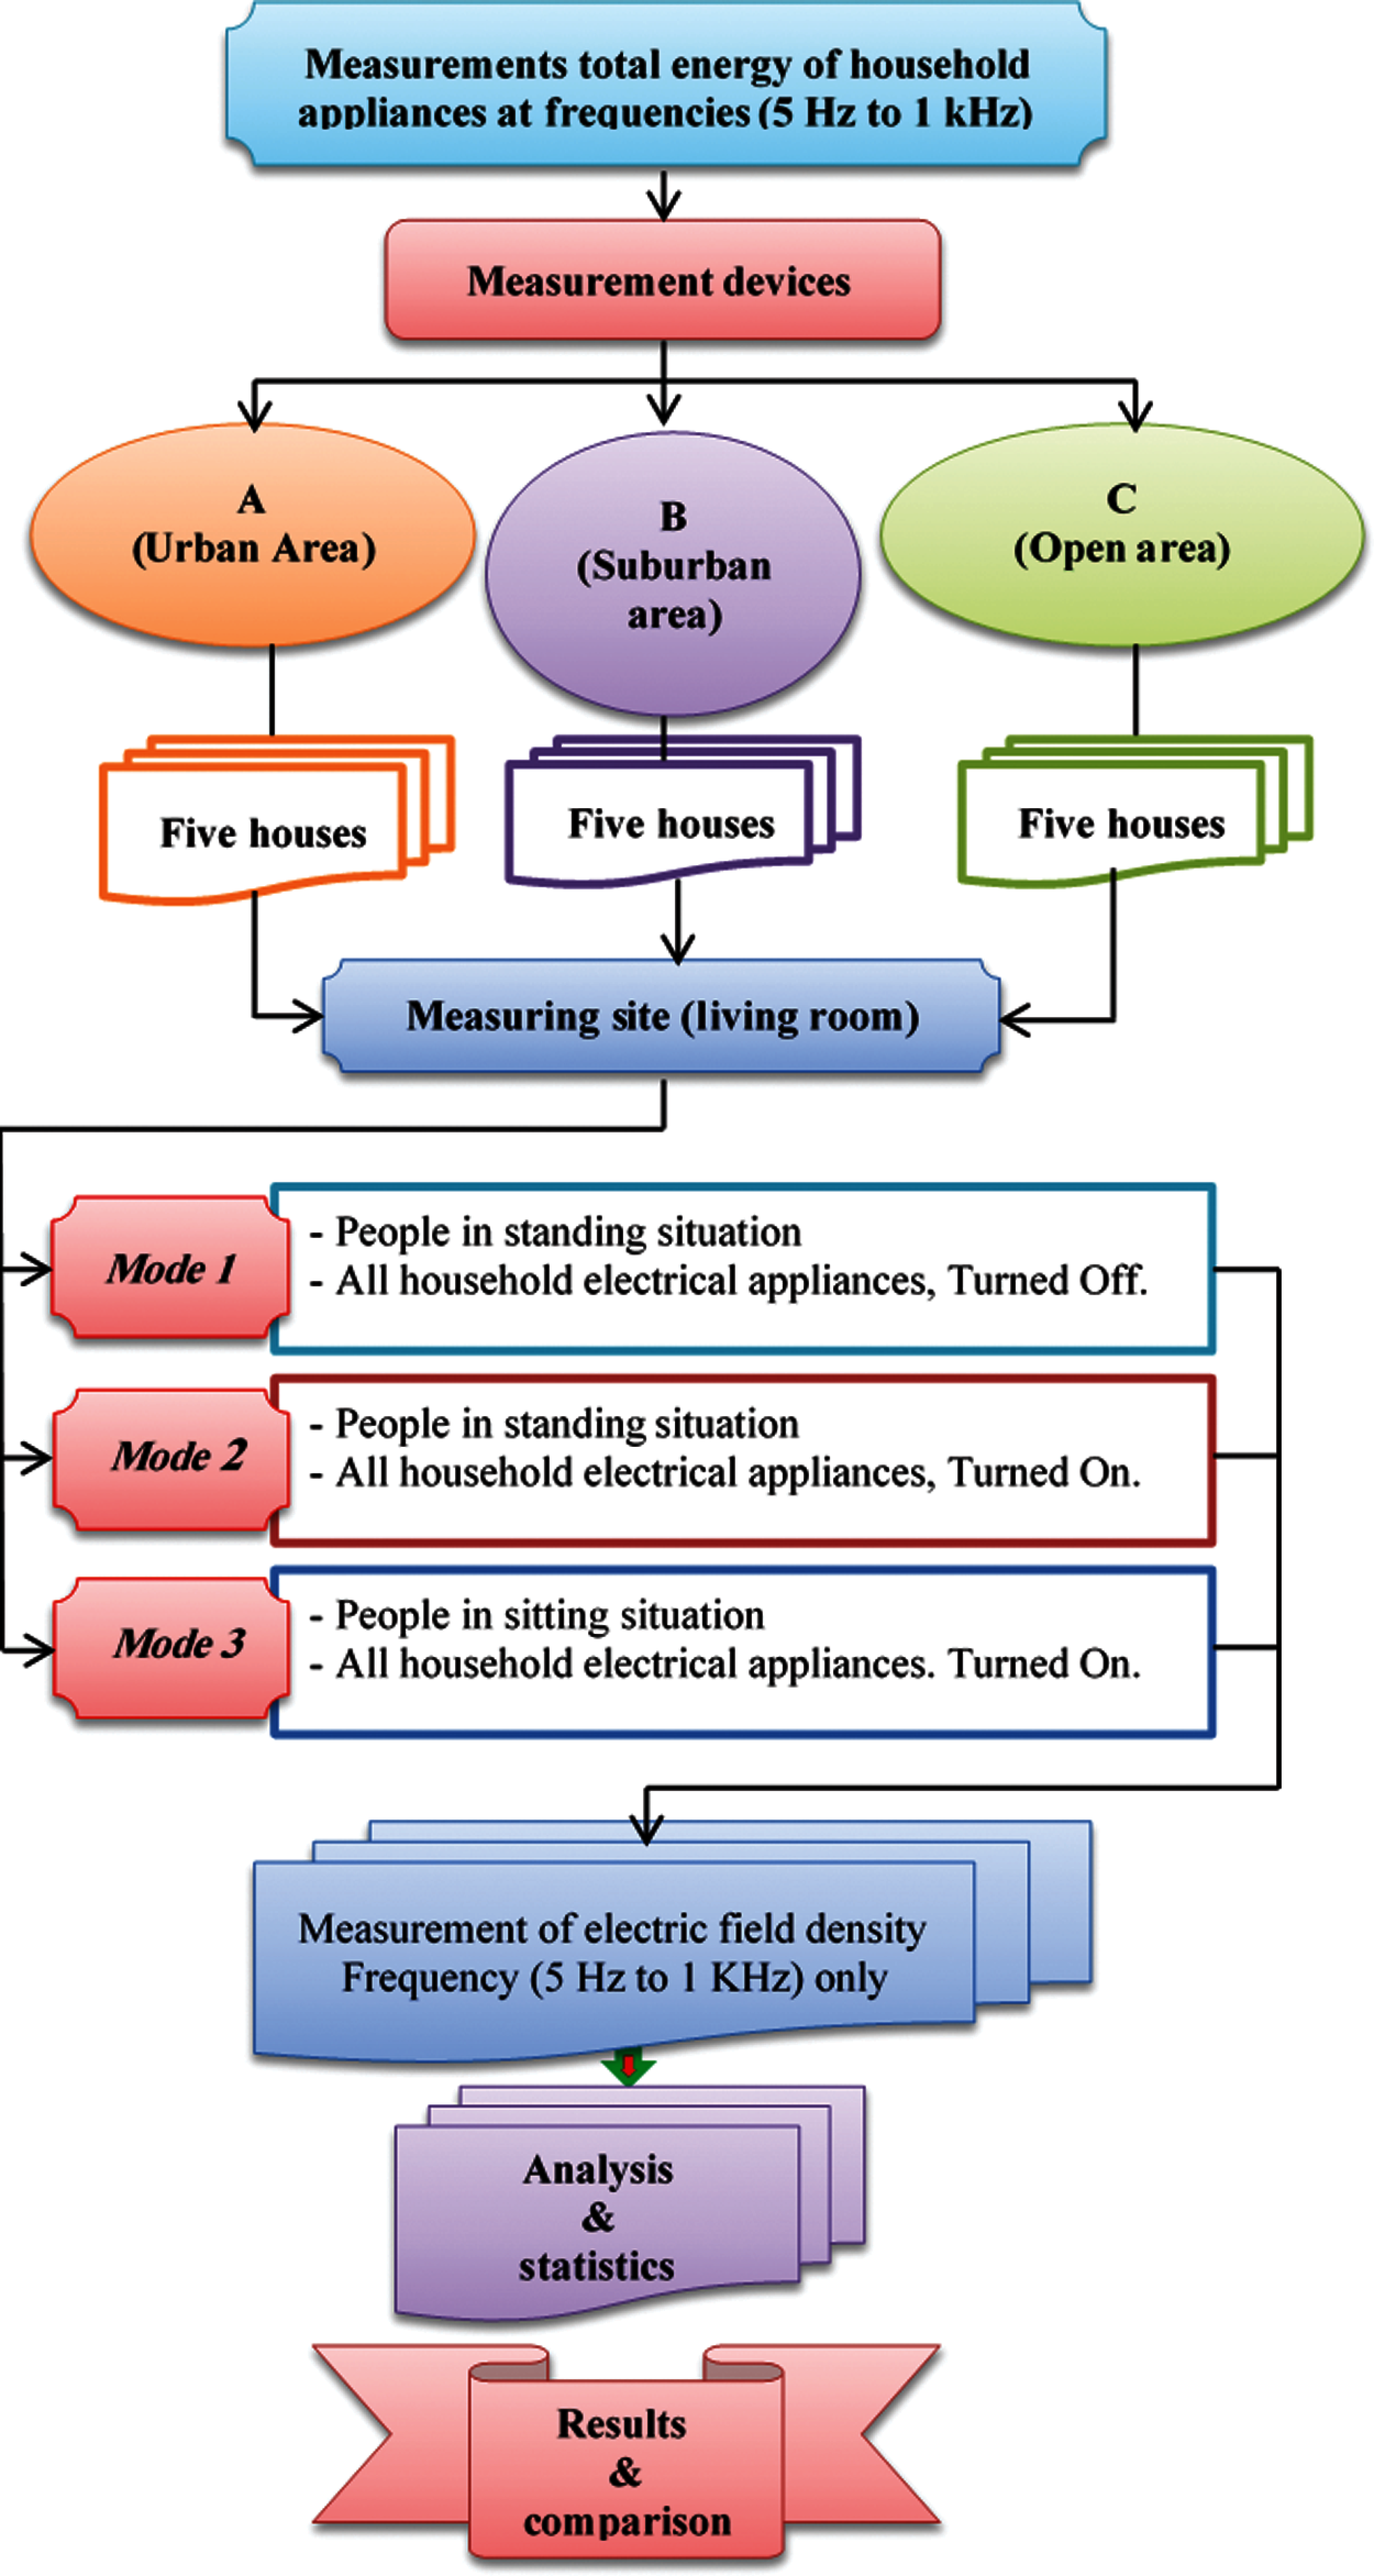
Figure 1: Core parts of the proposed system model
There are similar works to the topic that we have discussed in general [11,12]. Still, they are few compared to the rapid progress and growth of technology, the increase in electronic devices and technologies, and at the same time, the considerable time lag that relates to updating the proposed guidelines for exposure limits to areas developed by International Commission on Non-Ionizing Radiation Protection (ICNIRP). However, regarding the three measurement methods that we will use in the measurement process in our research, and more importantly, is there a comprehensive relationship between the different frequencies? Through this, it becomes apparent that these topics and methods are virtually non-existent which enhances and distinguishes this paper as shown in Fig. 1 (Mode 1, 2, and 3). The results of the research and its questions support this.
However, this research was limited to measuring the amount of the electric field for household appliances that operate with frequency limits (5 Hz to 1 kHz), for fifteen homes distributed over three different environments.
Our hypotheses in this paper include that the results of the electromagnetic field radiation will be massive that may exceed the limits of field exposure from ICNIRP. On the other hand, we are sure that there will be unexpected results because we are confident that the diversity of different frequencies surrounding us affects the unknown. We assume that the results of measurement in crowded areas will differ from the ones in open areas by a massive difference.
3 Theoretical Background and Formulation
The electromagnetic waves are invisible, odorless, and can penetrate any substance, including humans. According to statistics, the results showed that more than one billion people are infected with indoor electromagnetic pollution [16]. The electromagnetic radiation indoors has two primary sources. The first source is the open-air that is widespread and mainly concentrated in the radio frequencies (30 MHz–300 GHz) that pass through the windows to form multiple paths (between the sender and the receiver) to reach our personal and household appliances [17,18]. The second source is the electromagnetic radiation of extremely low-frequency ELF (0 Hz–100 Hz) frequencies emitted from our modern household electrical appliances and electrical wires. Fig. 2 shows the range of devices that are connected to the wireless [19].
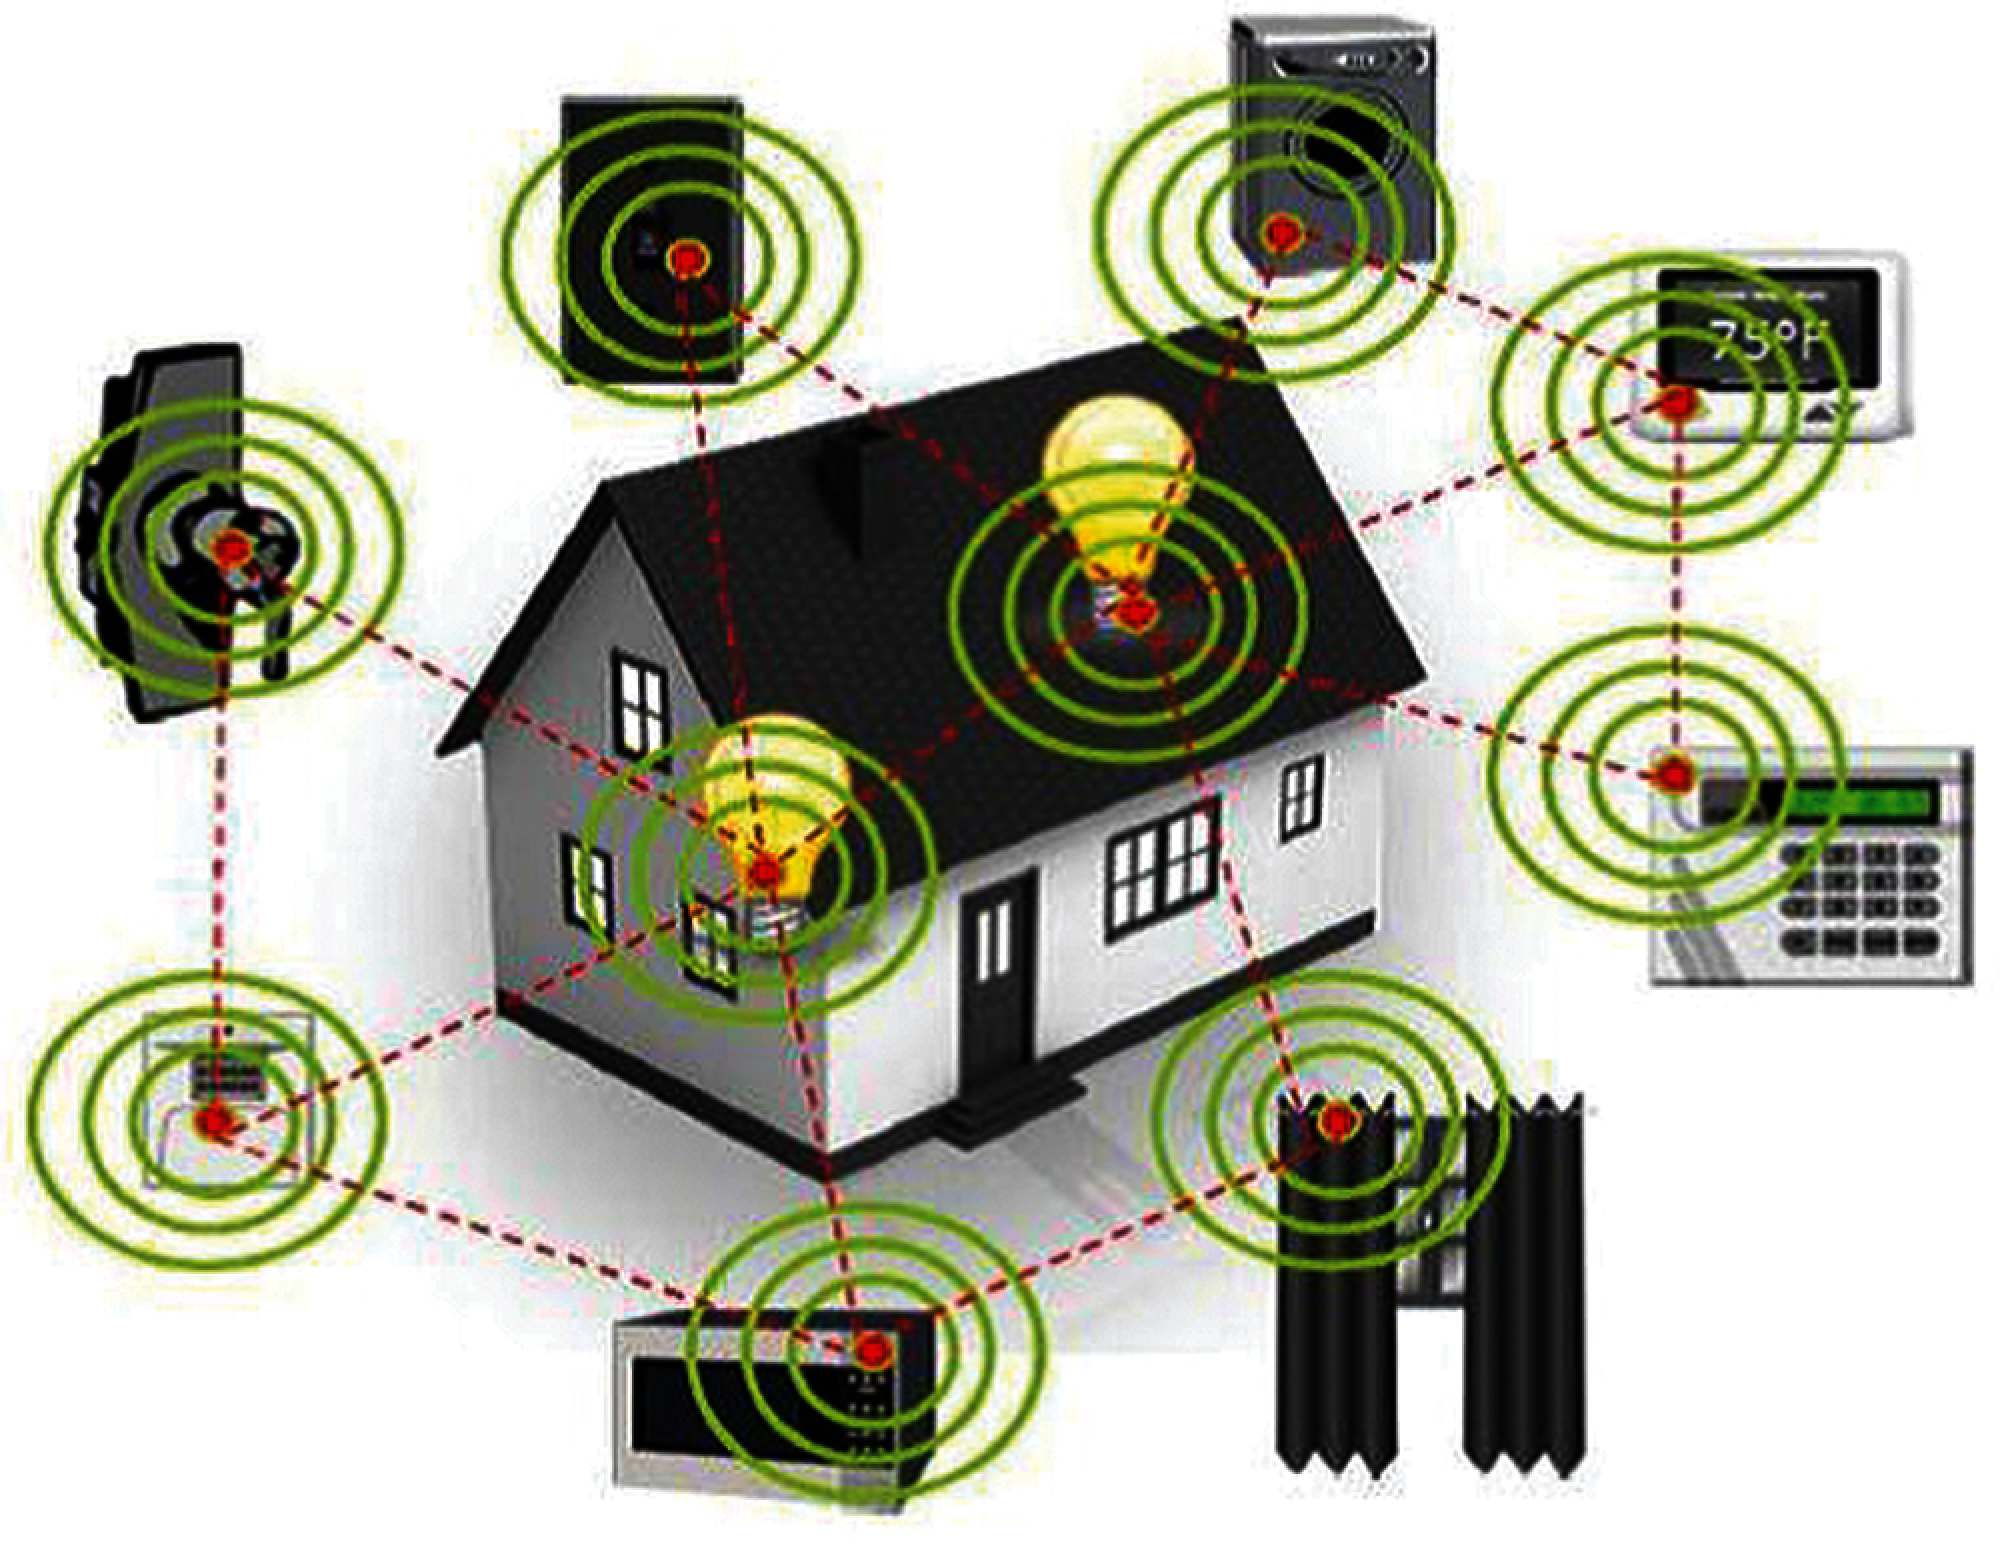
Figure 2: The range of connected devices
The most common sources of exposure are shown in Tab. 1 [16].
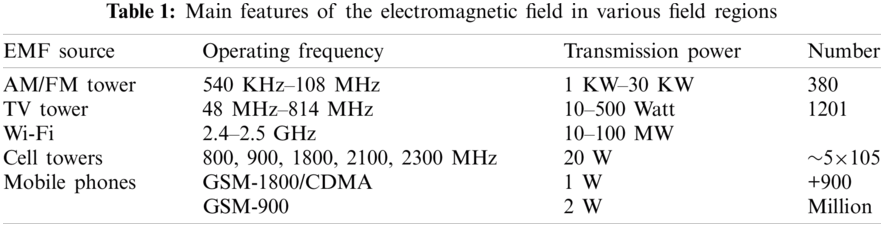
Fig. 3 illustrates the limitations and exposure level to safe exposure.
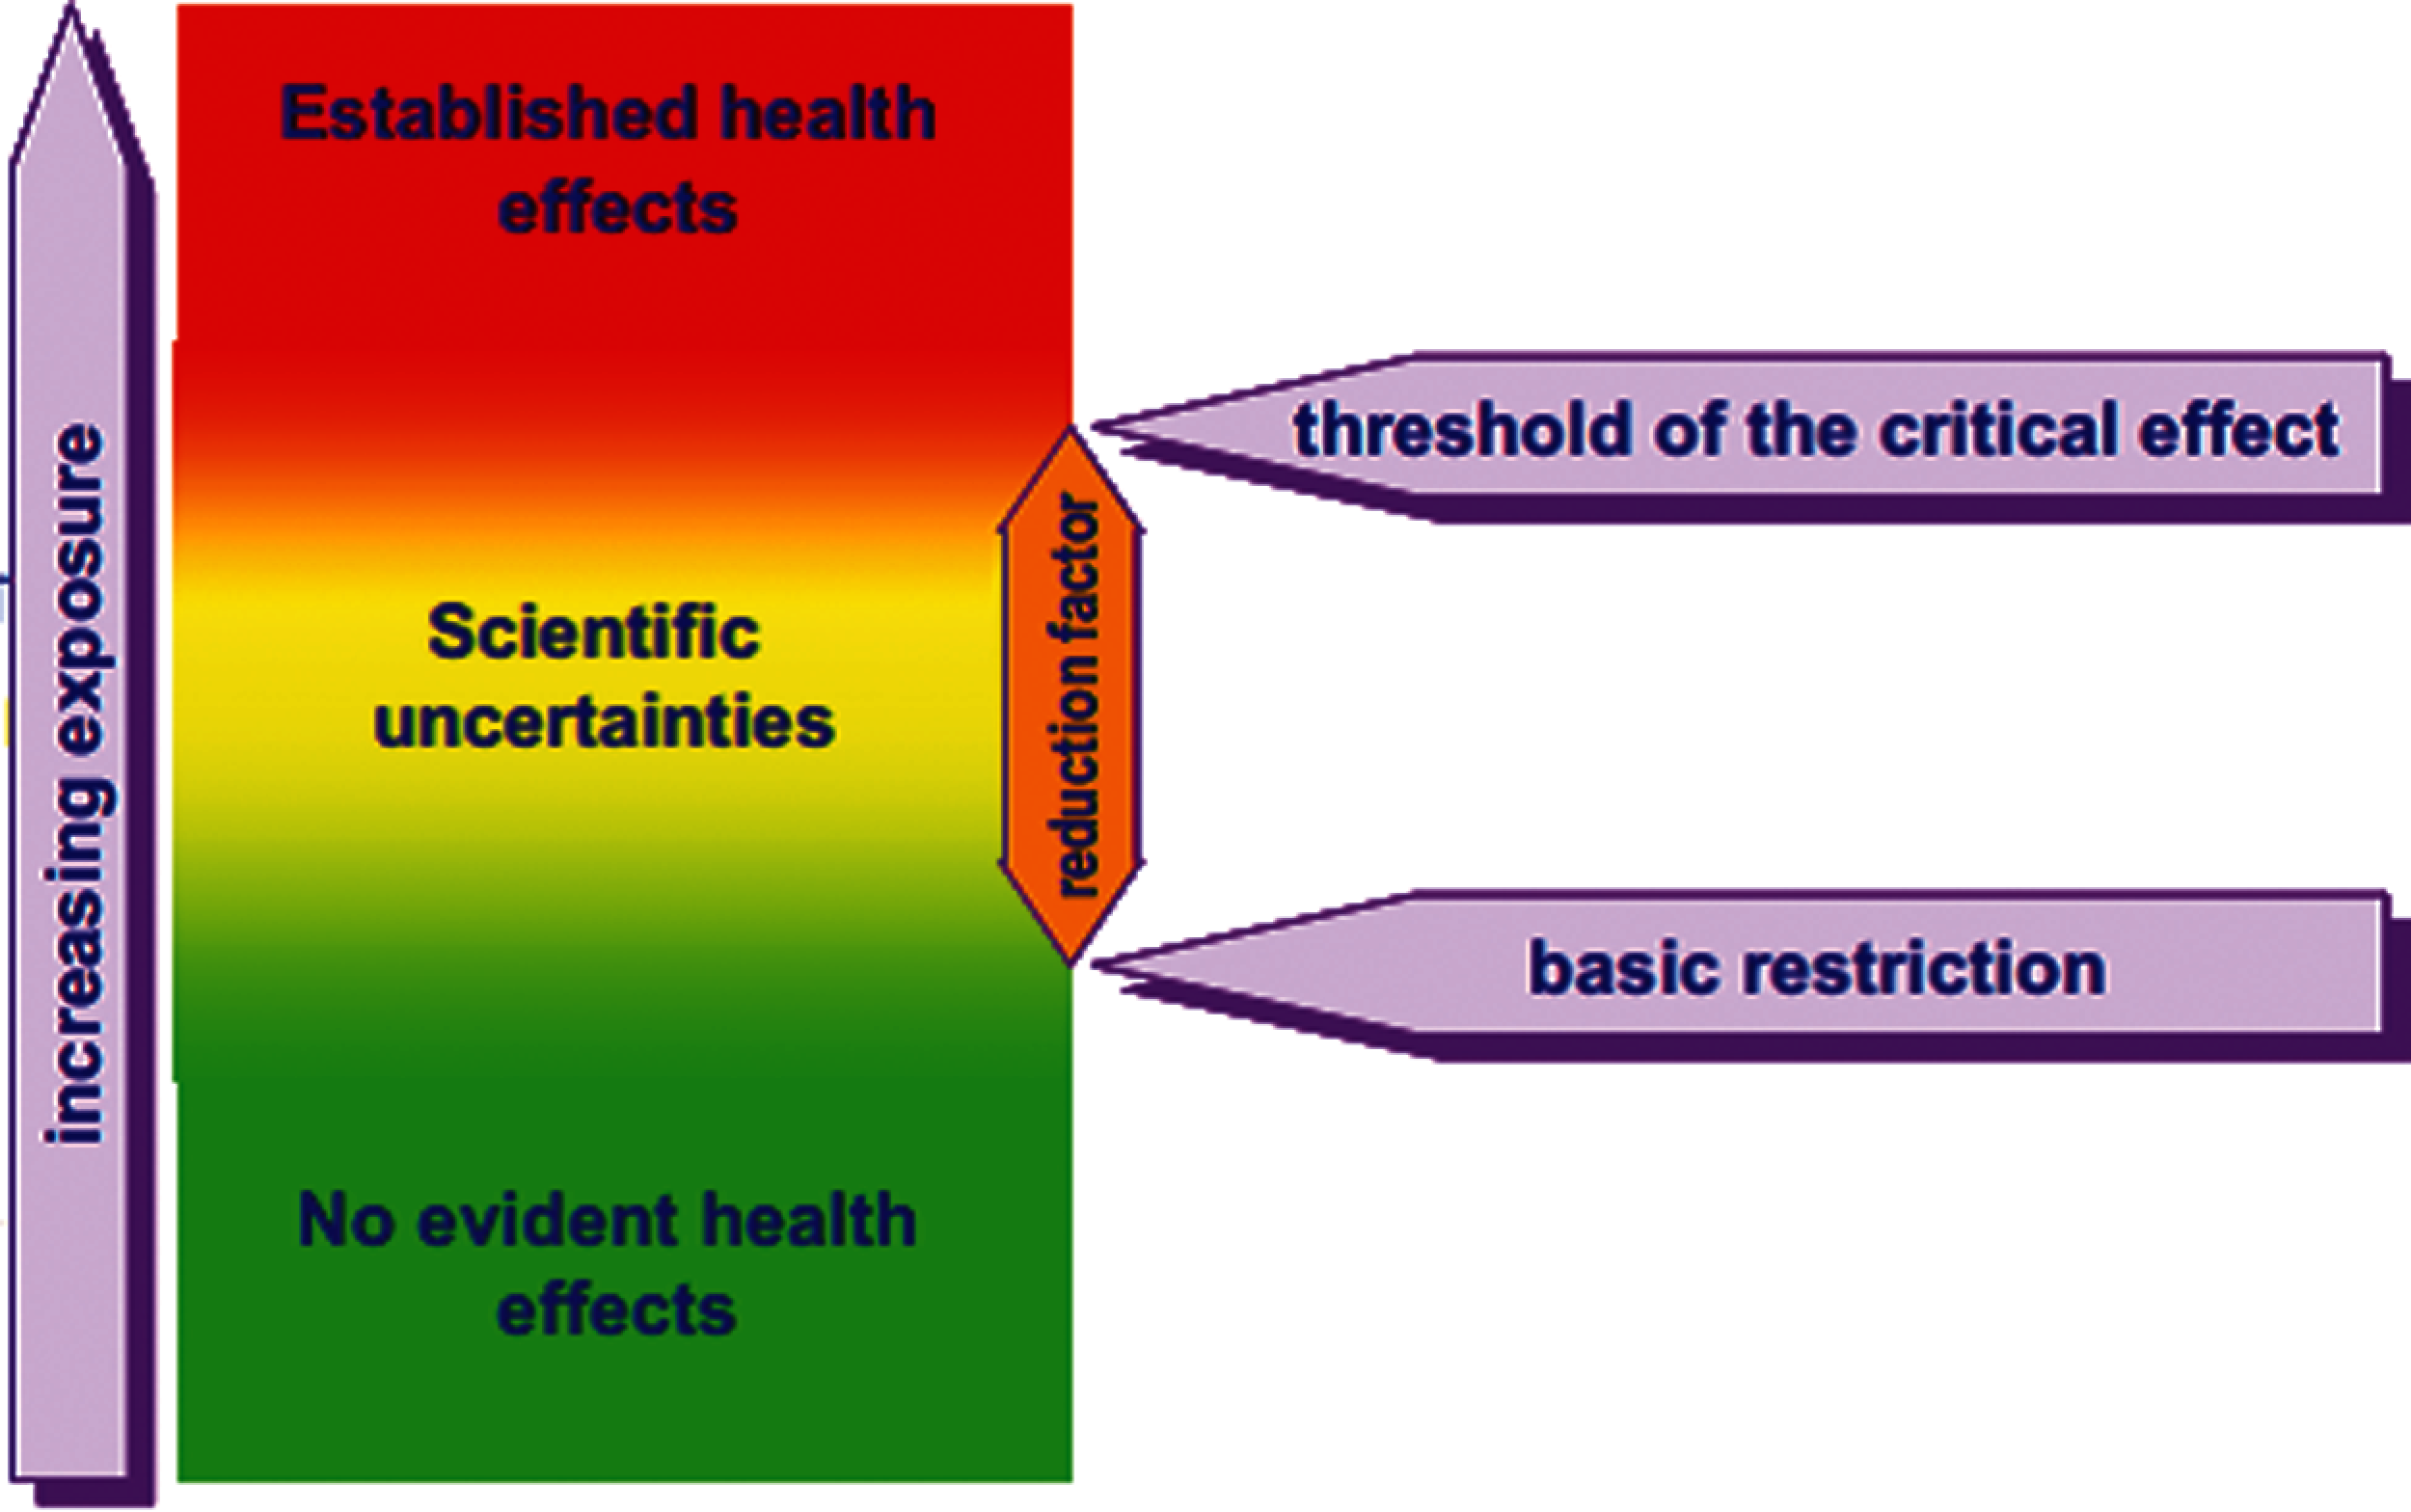
Figure 3: EMF safety guidelines for ICNIRP
The International Electrotechnical Commission (IEC) and ICNIRP guidelines on comparing electric- (EF) and magnetic-field (MF) measurements at different frequencies lower than 10 MHz with reference levels [10] are as follows:
Eq. (1) is ICNIRP guidelines, where frequency-weighted sum restricted to N peaks (Fpeak,) is not defined,
Fpeak is a spectral peak in the EF (F = E) or MF (F = H) at frequency fi, and FR is the corresponding reference level [10].
Eq. (2) is IEC guidelines, where the square root of the quadratic sum is restricted to N spectral peaks, with FPeak,>0.05 × FR.
Tab. 2 shows the main instructions of measurement and numerical prediction of electromagnetic fields for telecommunication installations general information concerning measurement and calculation [16].
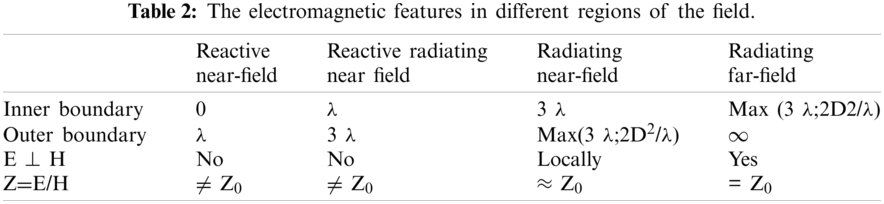
Power density reactive near field and reactive radiating near field are shown in Eq. (3) and radiating near and far-field are given by Eq. (4).
where
• S refers to power density [W/m2].
• E refers to electric field [W/m2].
• H is the magnetic field [W/m2].
• Λ is the wave length [W/m2].
• D is the distance [W/m2].
• Z0 refer to the characteristic impedance ratio [W/m2].
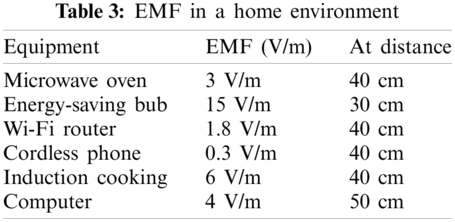
The levels of exposure in typical electronic and electric equipment are shown in Tab. 3 below [16].
4.1 Device Measurement Specification
To describe the electric field levels of the frequency (5 Hz to 1000 Hz) in housing from home appliances, the devices are shown in Tab. 4 were used.
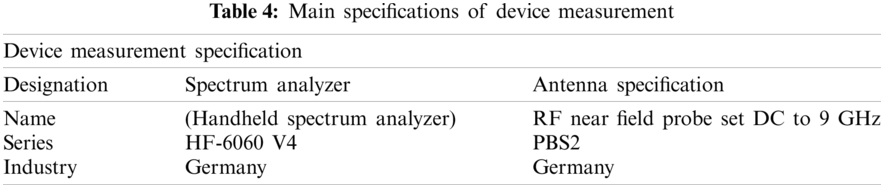
The spectrum analyzer (HF-6060 V4) has also been set up with the maximum retention (maximum preservation values) for reading stability with a rough thirty-second period.
The power of all household electrical appliances (50 Hz/60 Hz) ranges in the frequency from 5 Hz to 1 kHz.
Three different environments (urban area, suburban area, and open area) have been chosen and divided into three groups (A, B, C).
• Open area: is a sparsely populated undeveloped or partially developed countryside with traditional modest homes and barns.
• Suburban area: contains a mix of residential and clean industrial uses, such as warehouses, shopping malls, and light industry, as well as moderate vehicular traffic.
• The urban area: is primarily business and industrial, with a large number of high-rise residential buildings. Many huge structures characterize business districts. Almost all of the time, there is a lot of traffic.
To be far apart, group A is from the urban areas and located in the city center and group B is from the suburban areas and located northwest of the city, whereas group C is an open area situated to the south of the town. Also, five residential houses were designated in each group, bringing the total number of dwellings to fifteen.
4.2.2 Methods of Analysis and Measurement
The electric field density frequency (5 Hz to 1 KHz) will be measured out of all the frequencies operating in the house that include the frequencies (0 Hz–100 Hz) with which the household appliances operate.
The living room was designated as the center of measurement and three methods for measuring the electric field strength (V/m) were set, therefore, each process consists of two modes. The first mode is related to the position (sitting or standing) of people. The second mode is concerned with the equipment position (working or extinguishing).
The first method of measurement is when people are in a standing position while the internal electrical appliances are turned off.
The second method of measurement is when people are standing while operating internal electrical devices.
The third method of measurement is when people are in a sitting position while operating the internal electrical appliances.
The measurement was carried out on two heights. The first height was 1.65 meters above the ground when people were standing, and the second height was 1.4 meters above the ground when people were sitting. Microsoft software (XML) has been used with its related functions to find the average values of the electric field.
5 Results Discussion and Comparison
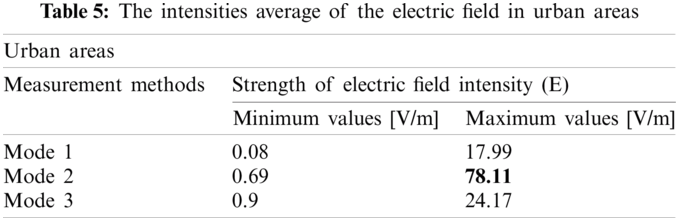
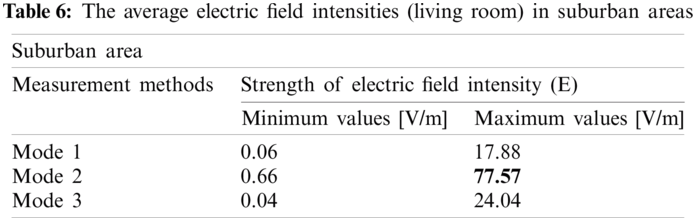
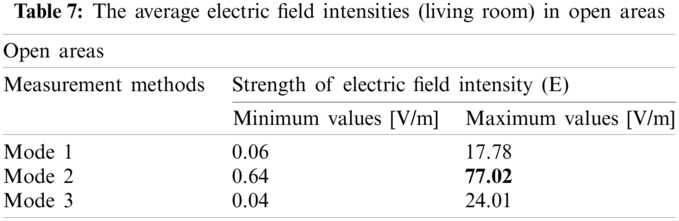
The results of our obtained measurements are shown in Tabs. 5–7 and illustrated in Fig. 4 below which are in the first measurement method when people were standing compared to Fig. 4. Electrical appliances in the living room were turned off, in urban areas 17.99 V/m, suburbs 17.88 V/m, and open areas 17.78 V/m. In Mode 1 there is a value for the electric field’s intensity which is strange because all electrical appliances are closed, although we have checked the equipment in the rooms, kitchen, and bedroom. Meanwhile, we closed the windows. Some very low-frequency electromagnetic waves may generate a specific density.
In the second method of measurement when people were standing and electrical appliances were turned on in the living room, the results showed in urban areas are 78.11 V/m, its environs were 77.57 V/m, and 77.02 V/m in open regions. Likewise, it appears that the average electric field density as measured was much more significant than method 1 and method 3. We should also point out that we have re-measured several times and we have also removed the devices and many things from the living room. When the radiation value has changed in each order, we have been convinced of the same as it was repeated at other homes and our homes.
The second method is based on our research and interest and to understand why this country’s value differs from the values of other countries. We must focus and know that the electromagnetic radiation inside it are two primary sources. The first source is the diffuse open-air mainly focused on radio frequency (30 MHz–300 GHz) that passes through windows to form multiple paths (between the transmitter and the receiver) to reach our personal and home devices. The second source is the electromagnetic radiation of ELF frequencies (0 Hz–100 Hz) from household electrical appliances and modern electrical wires. We have the same environment and within multiple groups of frequency bands that produce different density capabilities with long-term exposure to the resulting total capacitance. When standing with the operation of internal electrical appliances, it forms a barrier and a mediator between the emission of external radiation and the radiation reception from and near home appliances. More importantly, we are in a closed area (the living room). That is, we are exposed to several reflections while the intensity of the waves. Electromagnetism decreases dramatically with increasing distance which is the property of electromagnetic waves as this was proven by the results shown above.
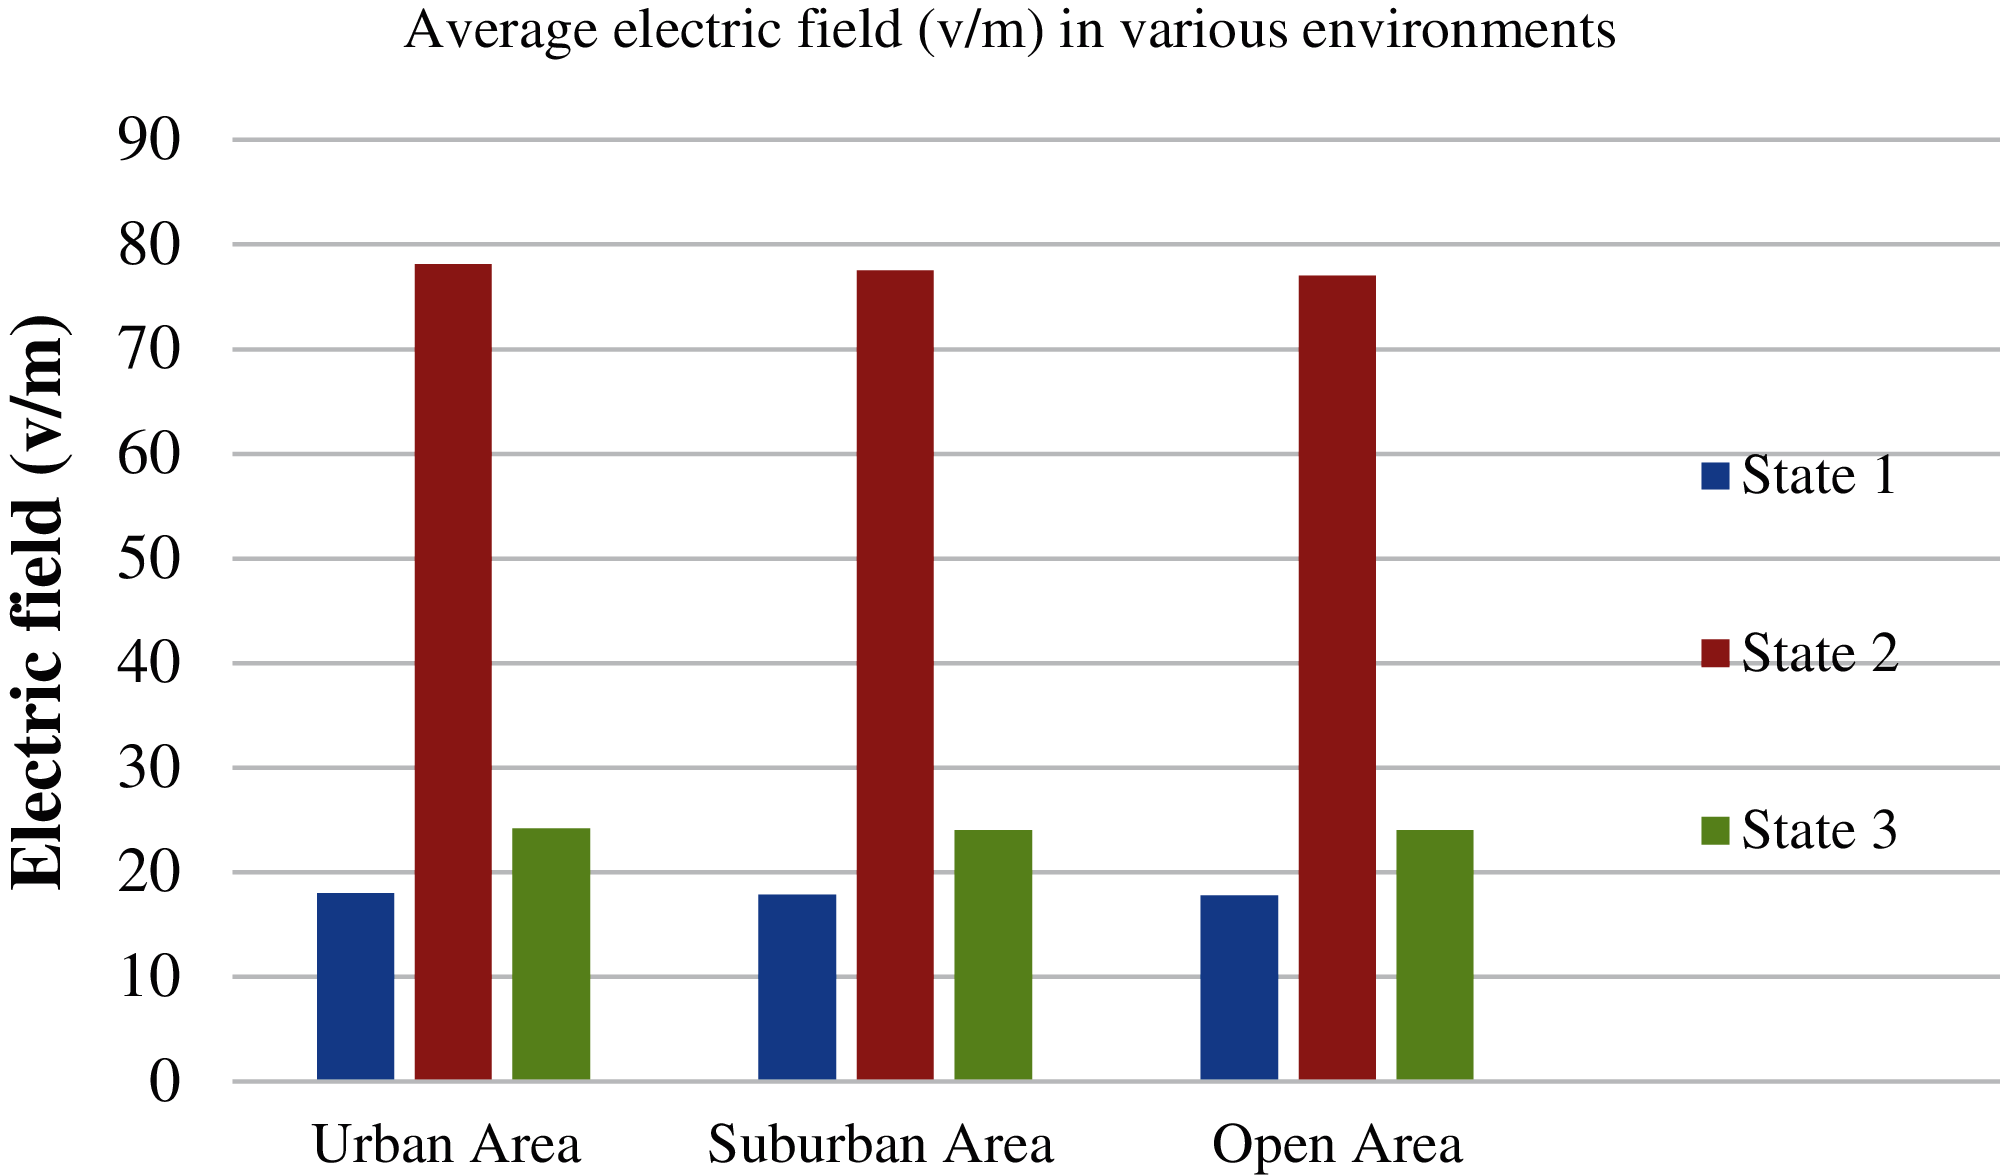
Figure 4: Average electric field (V/m)
In the third method of measurement, when people were sitting and electrical appliances were turned on in the living room, urban areas are 24.17 V/m, suburbs are 24.04 V/m, and the open regions are 24.01 V/m. We note that the value of the field strength of the electric field got a slight increase compared to the first mode. Theoretically, it can be first said that there should be no change. Second, according to electromagnetic waves’ environmental health standards, there are no standards for electromagnetic waves below the frequency (100 kHz). Third, there must be a difference in the electric field values between the three environments. Fourth, the results obtained in Mode 2 are close to the limited values in the CNIRP guidelines (87/f1/2, f’s unit is MHz) [10]. Therefore, there must be protective standards for electromagnetic radiation for this internal frequency.
However, the results confirm theoretically and practically that high-energy radiation sources increase the intensity of the resulting electromagnetic radiation in different environments. Moreover, we find that the difference in manufacturing technology and its materials can increase or decrease electromagnetic radiation value.
During the measuring procedure, we came across an instance where the house had inside antennae, which were measured to be the accurate results of our measurements within the dwellings. This scenario accounted for 0.9 percent of all residences (15 houses) and has been taken into account by the limits of safety limits in the design of mobile phone stations (Indoor) [20].
• Low-gain antennas should be used for 7.5 dB.
• The maximum density of electromagnetic power exposed to humans must be about 0.4 mW/Cm2
• The height of the building should be at least 2.5 meters from the ground surface inside or outside the building.
• The distance between man and stations shall not be less than half a meter.
• The installation of antennas (small antennas for cellular stations) is prohibited in hospitals and school buildings in full.
To calculate the total capacity resulting from the indoor antenna where the gain of the antenna is 2 dB, (Indoor cellular & LTE omnidirectional antenna (CMS69273-30NF)).
6.1 Mathematical Analysis and Results
Path loss is the attenuation of a signal radiated from a transmitter due to the distance traveled and characteristics of the propagation channel. Signal coverage and power constraint aspects are two main issues for engineers who want to get involved in the design and deployment of a wireless communication network. Both of them require being able to model the path loss as realistic as possible. This is an experimental study of path loss for indoor wireless sensor networks. The main goal is to validate some of the related literature and to contribute to it if possible.
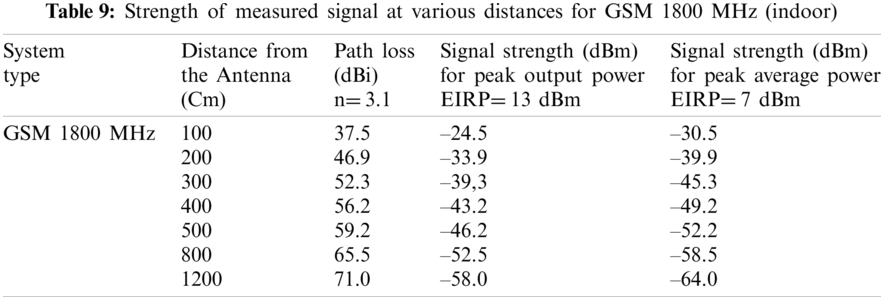
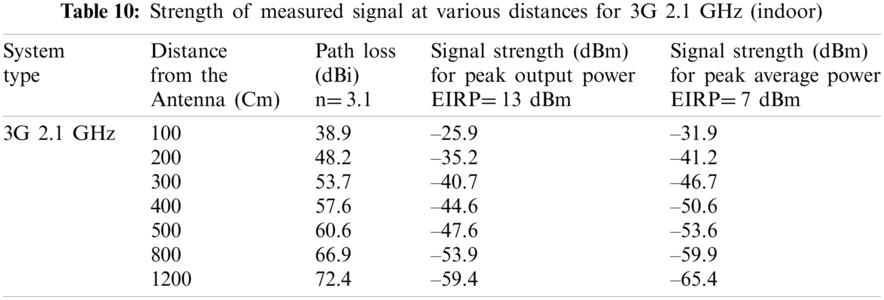
The electrical field strength is given by Eq. (5), whereas the signal strength = EIRP – Path Loss [20].
where,
• EIRP refers to an effective isotropic radiated power.
• D refers to the distance from the antenna (Cm).
• A = 31.52 for GSM 900 MHz, 37.52 for GSM 1800 MHz and 38.9 for 3G 2.1GHz.
• n is the path loss exponent (n = 2 for free space and n = 3.1 for indoor in average).
• L refers to extra losses, L= 0 for indoor.
Tabs. 8–10 show the signal strength measured indoors at different distances for the three links (GSM 900 MHz, GSM 1800 MHz, and 3G 2.1 GHz).
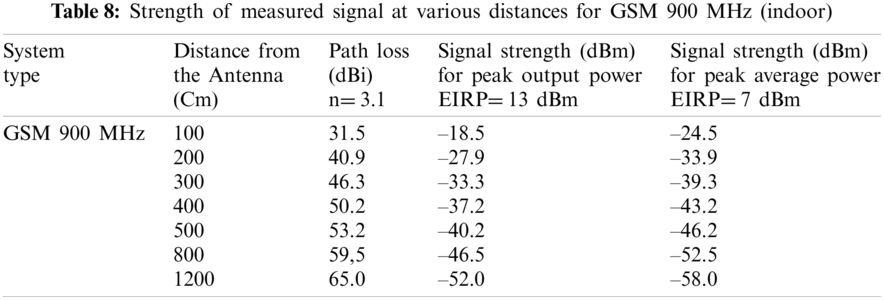
Now we will compare the communication links (GSM 900 MHz, GSM 1800 MHz, and 3G 2.1 GHz), as shown in Figs. 5–7 below.
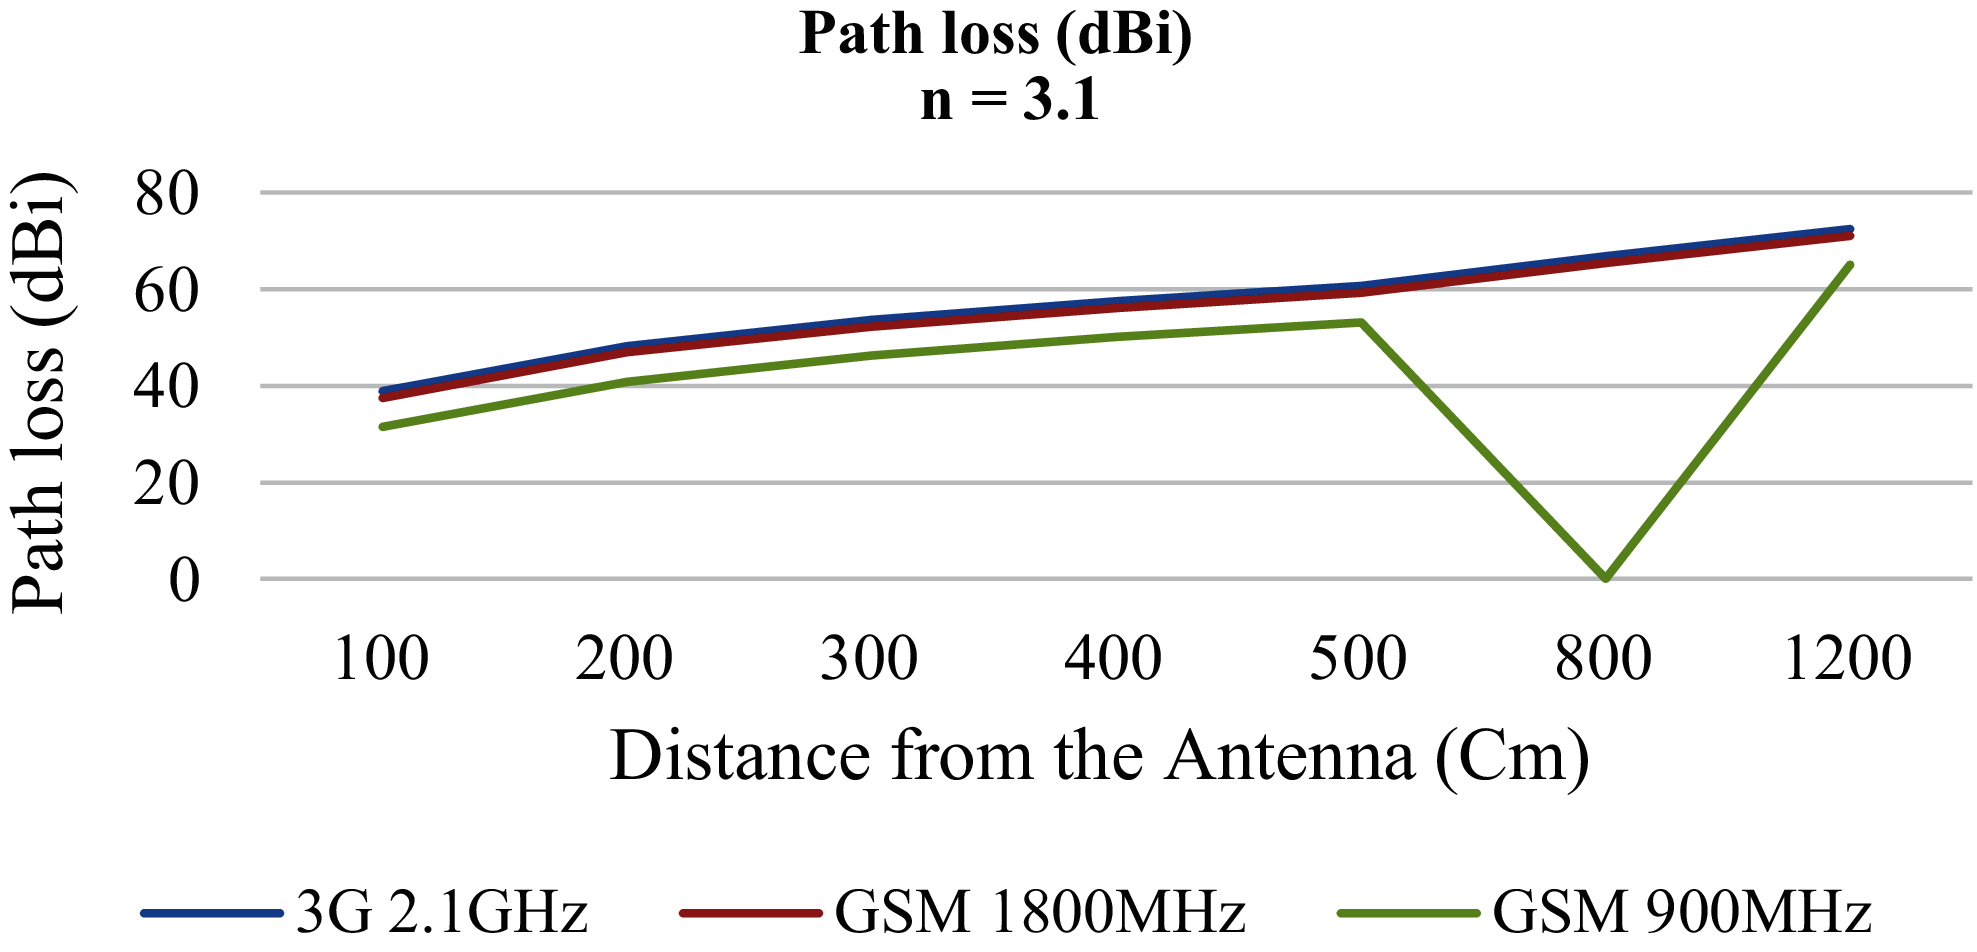
Figure 5: Comparison of indoor route loss for (GSM 900 MHz, GSM 1800 MHz, and 3G 2.1 GHz) at various distances
The measured results for (Path loss and Signal strength) for the three systems (GSM900 MHz, GSM1800 MHz, and 3G 2.1 GHz) showed no electromagnetic radiation indoors. When comparing the three cellular networks, 3G 2.1 GHz is the best.
For several reasons, the results are the most important of which the criteria were mentioned at the beginning of this section of the research and ascertain them. There are standards for the installation of stations with international specifications for the density of the electromagnetic power emitted from the antennas according to the conditions and specifications of each of the following: World Health Organization (WHO), American National Standards Institute (ANSI), International Electrotechnical Commission (IEC), International Commission on Non-Ionizing Radiation (ICNIRP), and International Society of Electrical and Electronics Engineers (IEEE). Another reason is the quality of coverage factor, which is a critical factor for cellular phone companies, and at the same time, a key factor for technological development in cellular communications. Modern technologies, such as third-generation (3G), allow more significant number of communication channels. Each of the third-generation stations serves about 178 subscribers at the same time. The second-generation serves about 61 subscribers simultaneously in each station to provide the appropriate number of communication channels. It increases the number of base stations in the cellular communication networks that serve each region [20]. We will not diverge about this section because it is a particular case and not based on the research as shown in the study's name and purpose.
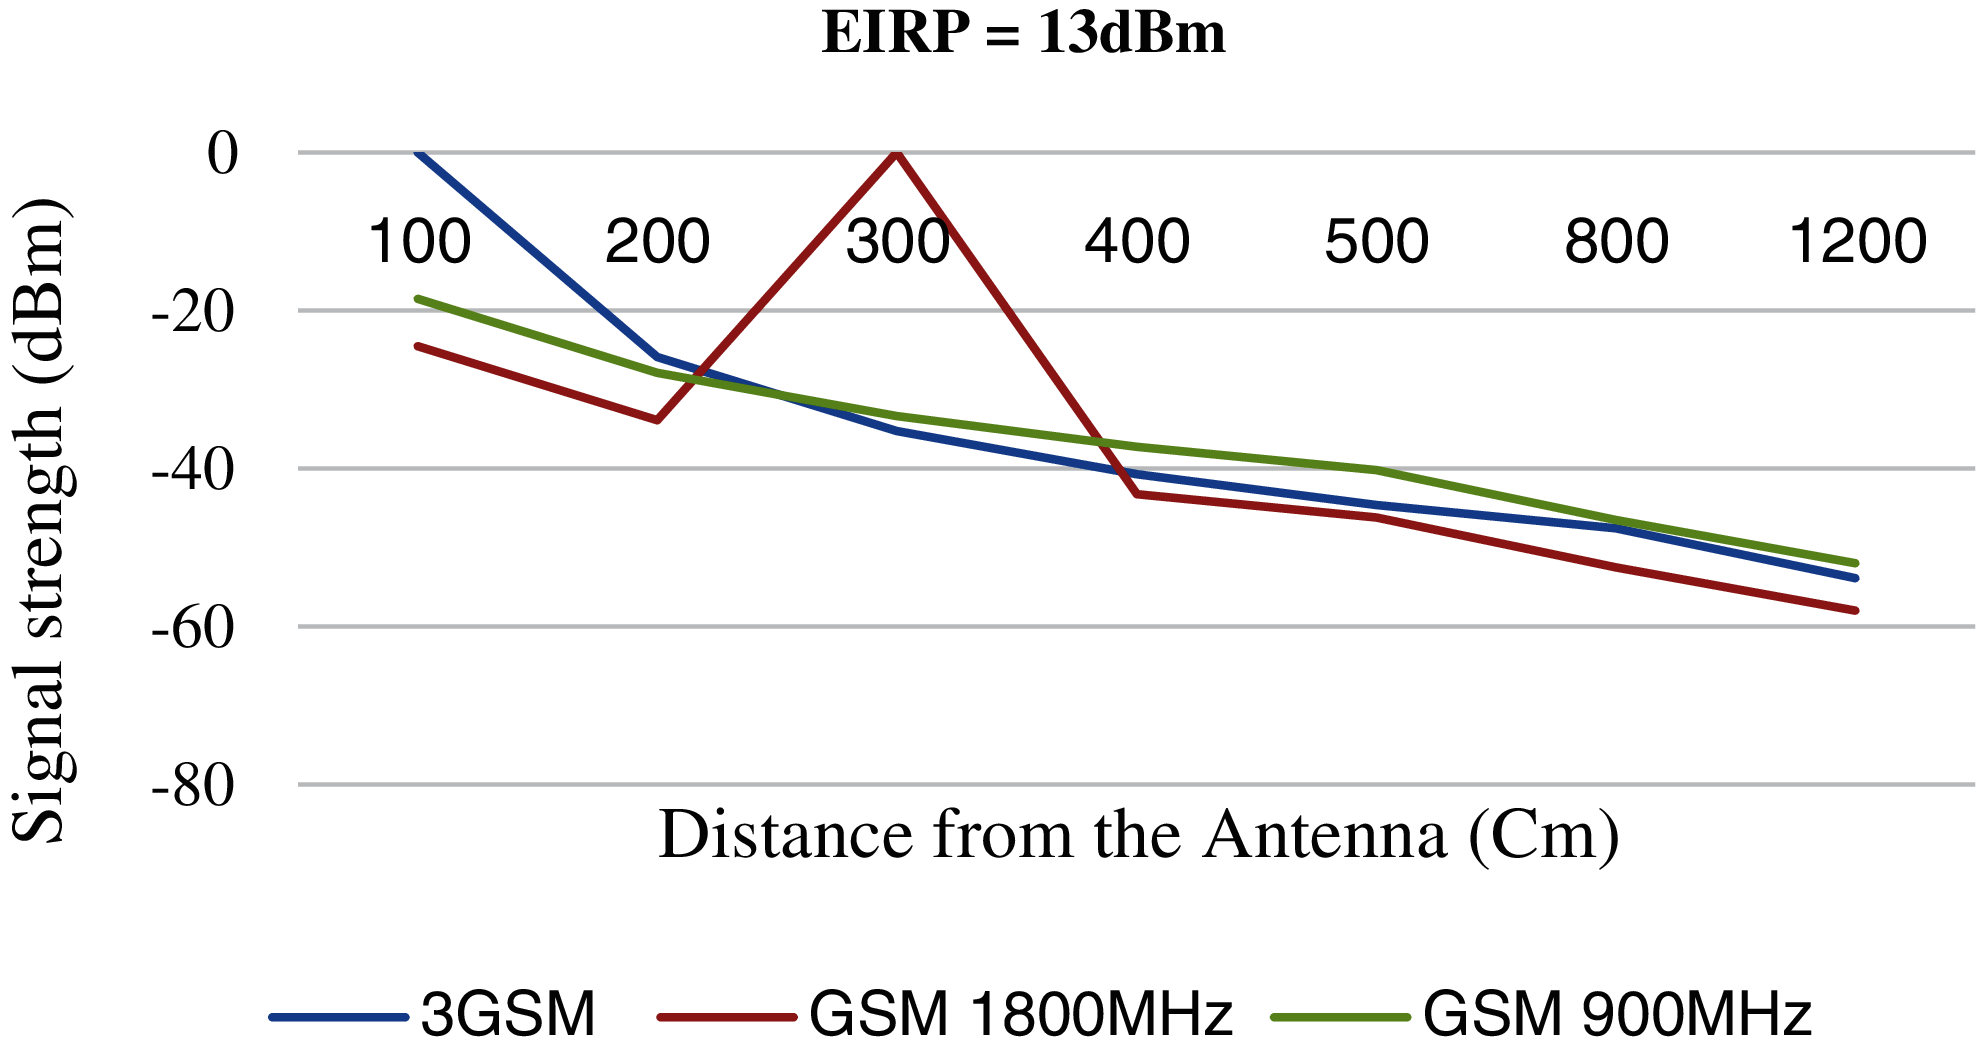
Figure 6: Comparison of peak output power (EIRP=13 dBm) at various distances for (GSM 900 MHz, GSM 1800 MHz, and 3G 2.1 GHz) indoor
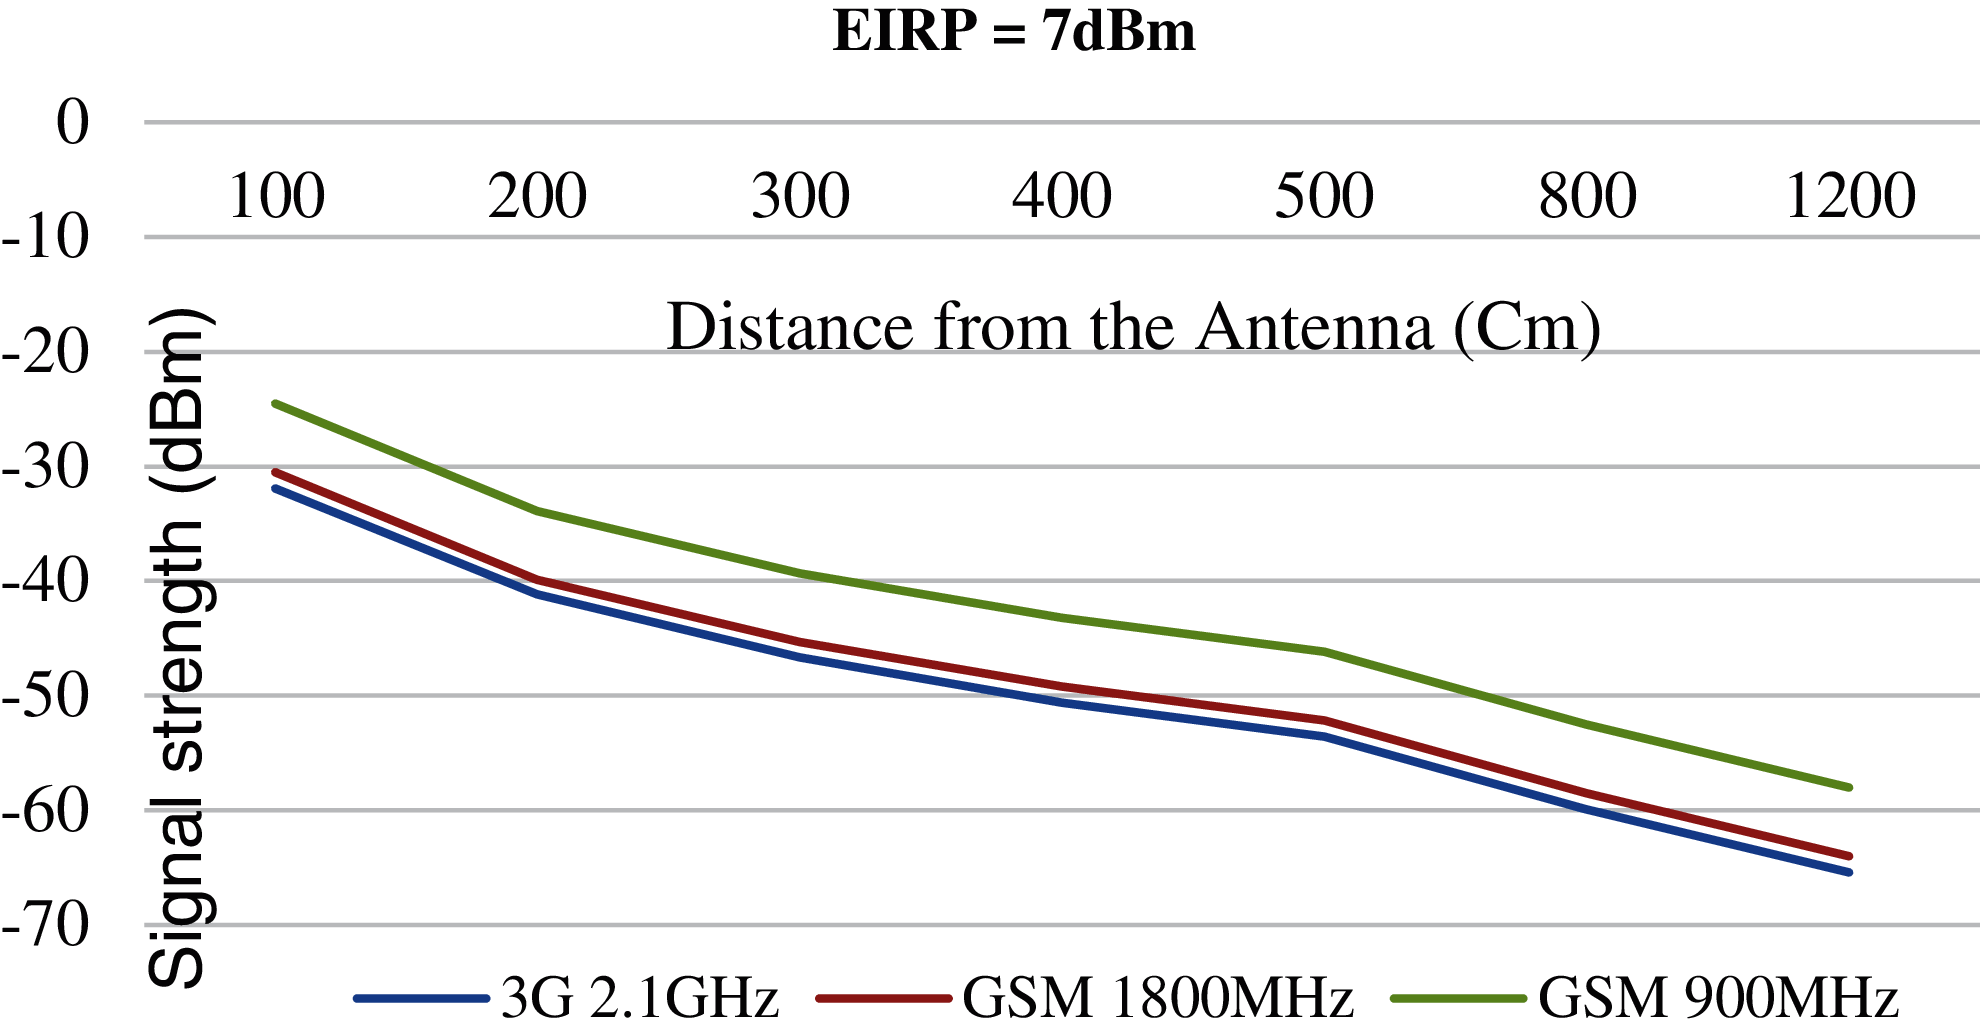
Figure 7: Comparison of peak output power (EIRP=7 dBm) at various distances for (GSM 900 MHz, GSM 1800 MHz, and 3G 2.1 GHz) indoor
This research has shown the measuring results of indoor electric field and the total density of the magnetic flow of electrical devices operating at frequencies from (5 Hz to 1 kHz) in living rooms in different environments. Using three measurement methods, Mode 2 in which people were in a standing position and electrical appliances were turned on in the living room had 78.11 V/m in urban, 77.57 V/m in suburban, and 77.02 V/m in open areas. likewise, it shows that the average electric field intensity measured was much more significant than Mode 1 and Mode 3. The calculated results of Path loss and signal strength for the three systems (GSM900 MHz, GSM1800 MHz, 3G2.1 GHz) showed no electromagnetic radiation indoor in some houses. When comparing the three cellular networks, 3G 2.1 GHz is the best.
All the results of the internal electromagnetic radiation obtained in 15 houses from various environments in Sana’a city and other different states remain within the limits of the recommended public exposure developed by (ICNIRP) and (IEC) guidelines (87/f1/2, f’s) with unit in MHz.
The practical results in this paper show that there is no relationship between the intensity of indoor electromagnetic radiation and the total energy of household appliances surrounding us; simultaneously, the results confirm, in theory, and practice, that high-energy radiation sources increase the intensity of electromagnetic radiation. Some proposals that work to prevent electromagnetic radiation and other submissions from solving the problems and questions shown in this study have been put forward. The results presented here may be an additional resource for epidemiological and other tasks that analyze the potential relationship between health effects and exposure to electromagnetic fields in a range of (5 Hz to 1 kHz).
Funding Statement: The authors extend their appreciation to the Deanship of Scientific Research at King Khalid University for funding this work under grant number (RGP.3/53/42), www.kku.edu.sa. This research was funded by the Deanship of Scientific Research at Princess Nourah bint Abdulrahman University through the Fast-Track Path of Research Funding Program.
Conflicts of Interest: The authors declare that they have no conflicts of interest to report regarding the present study.
1. I. Calvente, C. Dávila, O. Hernández, R. Pérez and R. Ramos, “Characterization of indoor extremely low frequency and low frequency electromagnetic fields in the INMA-Granada Cohort,” PLoS One, vol. 9, no. 9, pp. e106666, 2014. [Google Scholar]
2. P. Dunbabin, N. Terry and J. Palmer, “Electricity use by domestic appliances in English households,” European Council for an Energy Efficient Economy At: Toulon, France, vol. 7, no. 9, pp. 1439–1450, 2015. [Google Scholar]
3. F. Tingting, “Preliminary report on the indoor electromagnetic radiation in a municipality of western P.R. China: up-to-now still within the range,” Journal of Electromagnetic Analysis and Applications, vol. 4, no. 5, pp. 199–205, 2012. [Google Scholar]
4. M. A. A. Almekhlafi, “Analytical study for measuring the electromagnetic radiation of the GSM system in urban areas,” International Journal of Computer Networks & Communications (IJCNC), vol. 9, no. 1, pp. 39–53, 2017. [Google Scholar]
5. A. Peyman, M. Khalid, C. Calderon, D. Addison, T. Mee et al., “Assessment of exposure to electromagnetic fields from wireless computer networks (Wi-Fi) in schools, results of laboratory measurements,” Health Physics, vol. 100, no. 6, pp. 594–612, 2011. [Google Scholar]
6. K. Foster, “Radiofrequency exposure from wireless LANs utilizing Wi-Fi technology,” Health Physics, vol. 92, no. 3, pp. 280–289, 2007. [Google Scholar]
7. G. Schmid, P. Preiner, D. Lager, R. Uberbacher and R. Georg, “Exposure of the general public due to wireless LAN applications in public places,” Radiation Protection Dosimetry, vol. 124, no. 1, pp. 48–52, 2007. [Google Scholar]
8. P. Lopez, S. Miguel, E. Aguirre, L. Azpilicueta, F. Falcone et al., “Estimation of radiofrequency power leakage from microwave ovens for dosimetric assessment at nonionizing radiation exposure levels,” BioMed Research International, vol. 2015, pp. 1–14, 2015. https://doi.org/10.1155/2015/603260. [Google Scholar]
9. M. Repacholi, “Concern that EMF magnetic fields from power lines cause cancer,” Science of The Total Environment, vol. 426, no. 5, pp. 454–458, 2012. [Google Scholar]
10. W. Kluwer, “Guidelines for limiting exposure to time-varying electric and magnetic fields (1 HZ–100 KHZ),” International Commission on Non-Ionizing Radiation Protection (ICNIRP), vol. 118, no. 5, pp. 483–524, 2020. [Google Scholar]
11. M. Mannan, Y. Weldu and S. Al-Ghamd, “Health impact of energy use in buildings: Radiation propagation assessment in indoor environment,” Elsevier 6th Int. Conf. on Energy and Environment Research, Portugal, ICEER, University of Aveiro, vol.6, pp. 915–920, 2019. [Google Scholar]
12. P. Ravazzani, J. Grellier, T. Samaras, J. Bakos and G. Thuróczy, “Review of studies concerning electromagnetic field (emf) exposure assessment in Europe: Low frequency fields (50 Hz–100 kHz) MDPI,” Int. Journal of Environment Research, Public Health, vol. 13, no. 9, pp. 1–14, 2016. [Google Scholar]
13. E. Palmquist, A. Claeson, G. Neely, B. Stenberg and S. Nordin, “Overlap in prevalence between various types of environmental intolerance,” Int. Journal of Hygiene and Environmental Health, vol. 217, no. 4–5, pp. 427–434, 2014. [Google Scholar]
14. BIO Intelligent Services, “Promoting healthy environments with a focus on the impact of actions on electromagnetic fields,” Final Report for Executive Agency for Health and Consumers, 2016. [Online]. Available: https://op.europa.eu/en/publication-detail/-/publication/f851e88d-e22a-48f7-8282-3adef8a1aac1. [Google Scholar]
15. J. Bakos, N. Nagy, P. Juhász and G. Thuróczy, “Spot measurements of intermediate frequency electric fields in the vicinity of compact fluorescent lamps,” Radiation Protection Dosimetry, vol. 142, no. 2–4, pp. 354–357, 2010. [Google Scholar]
16. ICNIRP, “Guidelines for limiting exposure to time-varying electric and magnetic fields (1 HZ–100 KHZ),” Health Physics, vol. 118, no. 5, pp. 533–542, 2020. [Google Scholar]
17. M. Mannan, Y. W. Weldu and S. Al-Ghamdi, “Health impact of energy use in buildings: Radiation propagation assessment in indoor environment,” in 6th Int. Conf. on Energy and Environment Research, Portugal, ICEER, University of Aveiro, 2019. [Google Scholar]
18. I. Calvente, M. Fernández, R. Lobato, C. Arias, O. Ocón et al., “Outdoor characterization of radio frequency electromagnetic fields in a Spanish birth cohort,” Environmental Research, vol. 138, no. 9, pp. 136–143, 2015. [Google Scholar]
19. N. Neskovic, M. Koprivica, A. Neskovic and G. Paunovic, “Improving the efficiency of measurement procedures for assessing human exposure in the vicinity of mobile phone (GSM/DCS/UMTS) base stations,” Radiation Protection Dosimetry, vol. 149, no. 3, pp. 238–244, 2012. [Google Scholar]
20. M. Gallastegi, A. Zabala, L. Marina, J. Aurrekoetxea, M. Ayerdi et al., “Exposure to extremely low and intermediate-frequency magnetic and electric fields among children from the INMA-Gipuzkoa cohort,” Environmental Research, vol. 157, pp. 190–197, 2017. [Google Scholar]
 | This work is licensed under a Creative Commons Attribution 4.0 International License, which permits unrestricted use, distribution, and reproduction in any medium, provided the original work is properly cited. |