DOI:10.32604/cmc.2022.020316
| Computers, Materials & Continua DOI:10.32604/cmc.2022.020316 | |
| Article |
Error Detection and Pattern Prediction Through Phase II Process Monitoring
1Government Graduate College of Science, Wahdat Road, Lahore, Pakistan
2COMSATS University Islamabad, Lahore Campus, Lahore, Pakistan
3Institute of Business & Management, University of Engineering and Technology, Lahore, Pakistan
*Corresponding Author: Riffat Jabeen. Email: drriffatjabeen@cuilahore.edu.pk
Received: 19 May 2021; Accepted: 29 July 2021
Abstract: The continuous monitoring of the machine is beneficial in improving its process reliability through reflected power function distribution. It is substantial for identifying and removing errors at the early stages of production that ultimately benefit the firms in cost-saving and quality improvement. The current study introduces control charts that help the manufacturing concerns to keep the production process in control. It presents an exponentially weighted moving average and extended exponentially weighted moving average and then compared their performance. The percentiles estimator and the modified maximum likelihood estimator are used to constructing the control charts. The findings suggest that an extended exponentially weighted moving average control chart based on the percentiles estimator performs better than exponentially weighted moving average control charts based on the percentiles estimator and modified maximum likelihood estimator. Further, these results will help the firms in the early detection of errors that enhance the process reliability of the telecommunications and financing industry.
Keywords: Reflected power function distribution; exponentially weighted moving average; extended exponentially weighted moving averages; modified maximum likelihood estimator; percentile estimator
The scholars are anxious to know about the error tendency during the entire manufacturing process to validate the pre-production testing results. It was expected during the machine installation process that the pre-testing results remain valid in the practical life, and also errors remain in control for instance, laptop manufacturing, which passes through several processes. The final product should be error-free when it is delivered to the market for sale as the complaints from distributors and customers can harm the firm’s reputation. Therefore, companies follow a rigorous monitoring procedure to identify and handle faults at the early stages. An efficient monitoring system can minimize the likelihood of product failure and improves its quality. That is why organizations paid attention to develop a system that can identify errors at an initial stage and keep them in control overtimes. In this way, it not only increases the efficiency of the product but also enhances its productivity.
However, the underlying situation of the production process may not be as normal in practical life as expected. That is why the error distribution of the manufacturing concerns is not normal and often follows a reflected power function distribution (RPFD). Therefore, there is a need to apply the RPFD under such real-life situations, where normal distribution failed to assess the error patterns. The current study used the RPFD from Zaka et al. [1] in process analysis, reliability testing, and error predicting. We also introduce control charts based on the assumptions that if the number of errors follows the RPFD and there exists a non-random variation in the distribution, then errors can be determined and handled at the initial stage. These control charts make the monitoring process of a machine more reliable and also provides persistent results.
Previously scholars constructed control charts based on the normality assumption. However, few studies like Roberts [2] recommended including exponentially weighted moving average (EWMA). Some studies currently discussed different control charts for real-life situations where normality assumptions do not fulfil [3–15]. These real-life applications of the control charts motivate scholars to explore them in non-normal cases where error patterns are unpredictable, particularly in manufacturing concerns. It helps the practitioners in the early solution to the errors that further lead to continuing the process without any interval, ultimately saving time and cost. It also develops the customers' confidence in the corporations through a continuous quality improvement process.
Generally, statisticians deal with two types of data processing. The first type provides the complete information about the variable of interest, while the second one often depicts misleading or sometimes based on basic details about the study variables. The present study is conducted in the first type of data when the process yields all the observations and follows the RPFD. However, the second type of data is more appropriate for neutrosophic statistics and is used in the literature to make the control charts. The scholars Aslam et al. [9,10,11], Aslam 12], Aslam et al. [13], and Khan et al. [14,15] have provided empirical support to these arguments.
This study has an added advantage over existing papers on control charts; first, it is applicable in most situations when the normality of any process is in doubt. We have found limited literature [2–15] discussing practical life scenarios. Thus, the current work may be a valuable addition to the literature. Second, it can be extended to neutrosophic statistics by providing the control charts when the process provides indeterminate data without assuming the normality of the process distribution.
We have the following breakage of the manuscript: Section 2.1 provides us with the RPFD and its estimators. Then, we have constructed an EWMA chart and presented it in Section 2.2, and the EEWMA chart is developed in Section 2.6. Simulation study and real-life application are discussed in Section 3, and then finally conclusion is drawn in Section 4.
2.1 Proposed Process Monitoring for Reflected Power Function Distribution
Using Zaka et al. [1] and assuming
and
where “
and
where H = maximum percentile, L = minimum percentile and P = percentile
2.2 EWMA Control Chart Using PE
Using
where
where
Using Zaka et al. [16], we get
Alternatively, we get
The control limits are,
where
2.3 EWMA Control Chart Using MMLM
We define the EWMA statisticas
where
2.4 Algorithm Used for EWMA Control Charts Using PE and MMLM
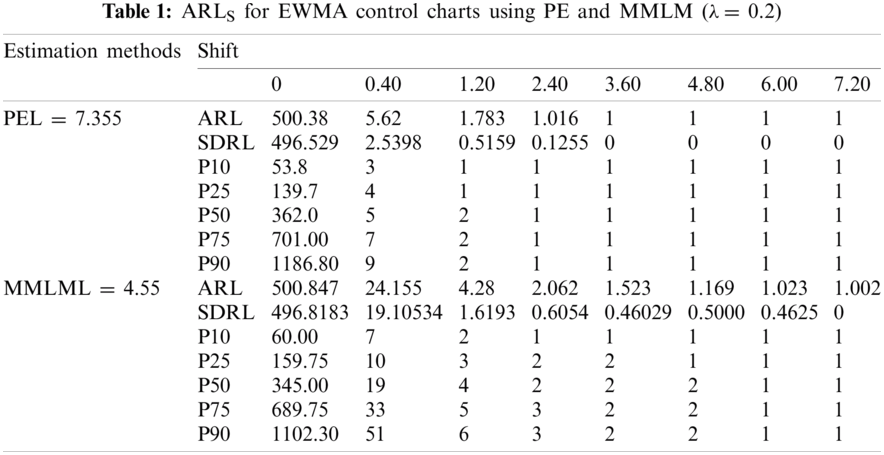
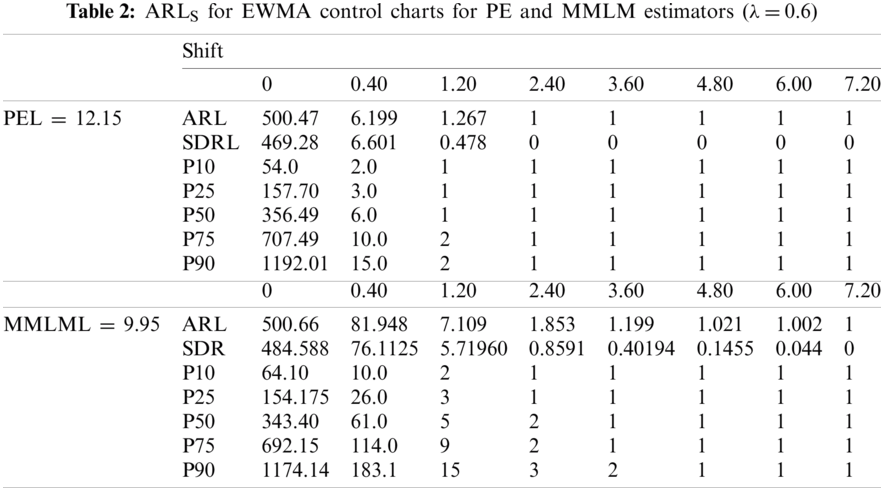
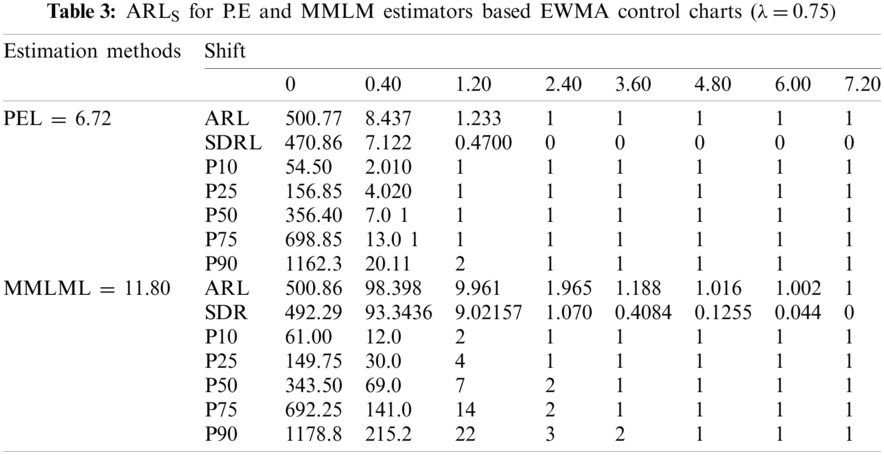
We generate a random sample from the process following RPFD using the sample size of 150. We then compute the estimate of the shape parameter using PE and MMLM alternatively and get their means and variances. Finally, the control limits using PE and MMLM are computed, and ARL is computed. We have fixed ARL0 = 500. Now we assume that the process parameter is shifted from its true value. We take different shifts and computed ARL for shifted process and called it ARL1. We have repeated this process 5000 times. Using the algorithm approach above, it is observed that the EWMA chart is helpful in the detection of small shifts at the early stage of the distribution. Here, we apply ARL criteria to compare the efficiency of an EWMA and EEWMA for both estimation methods.
From Tabs. 1–3 and Figs. 1–3, we observe an increasing behavior in ARL for the EWMA control chart with an increase in the value of
2.5 The Traditional Extended Exponentially Weighted Moving Averages (EEWMA) Control Chart
When the distribution of the process is normal, the EEWMA control chart was introduced by Naveed et al. [17]. The EEWMA control chart by Naveed et al. [17] is given as
where
The mean and variance are given as
And
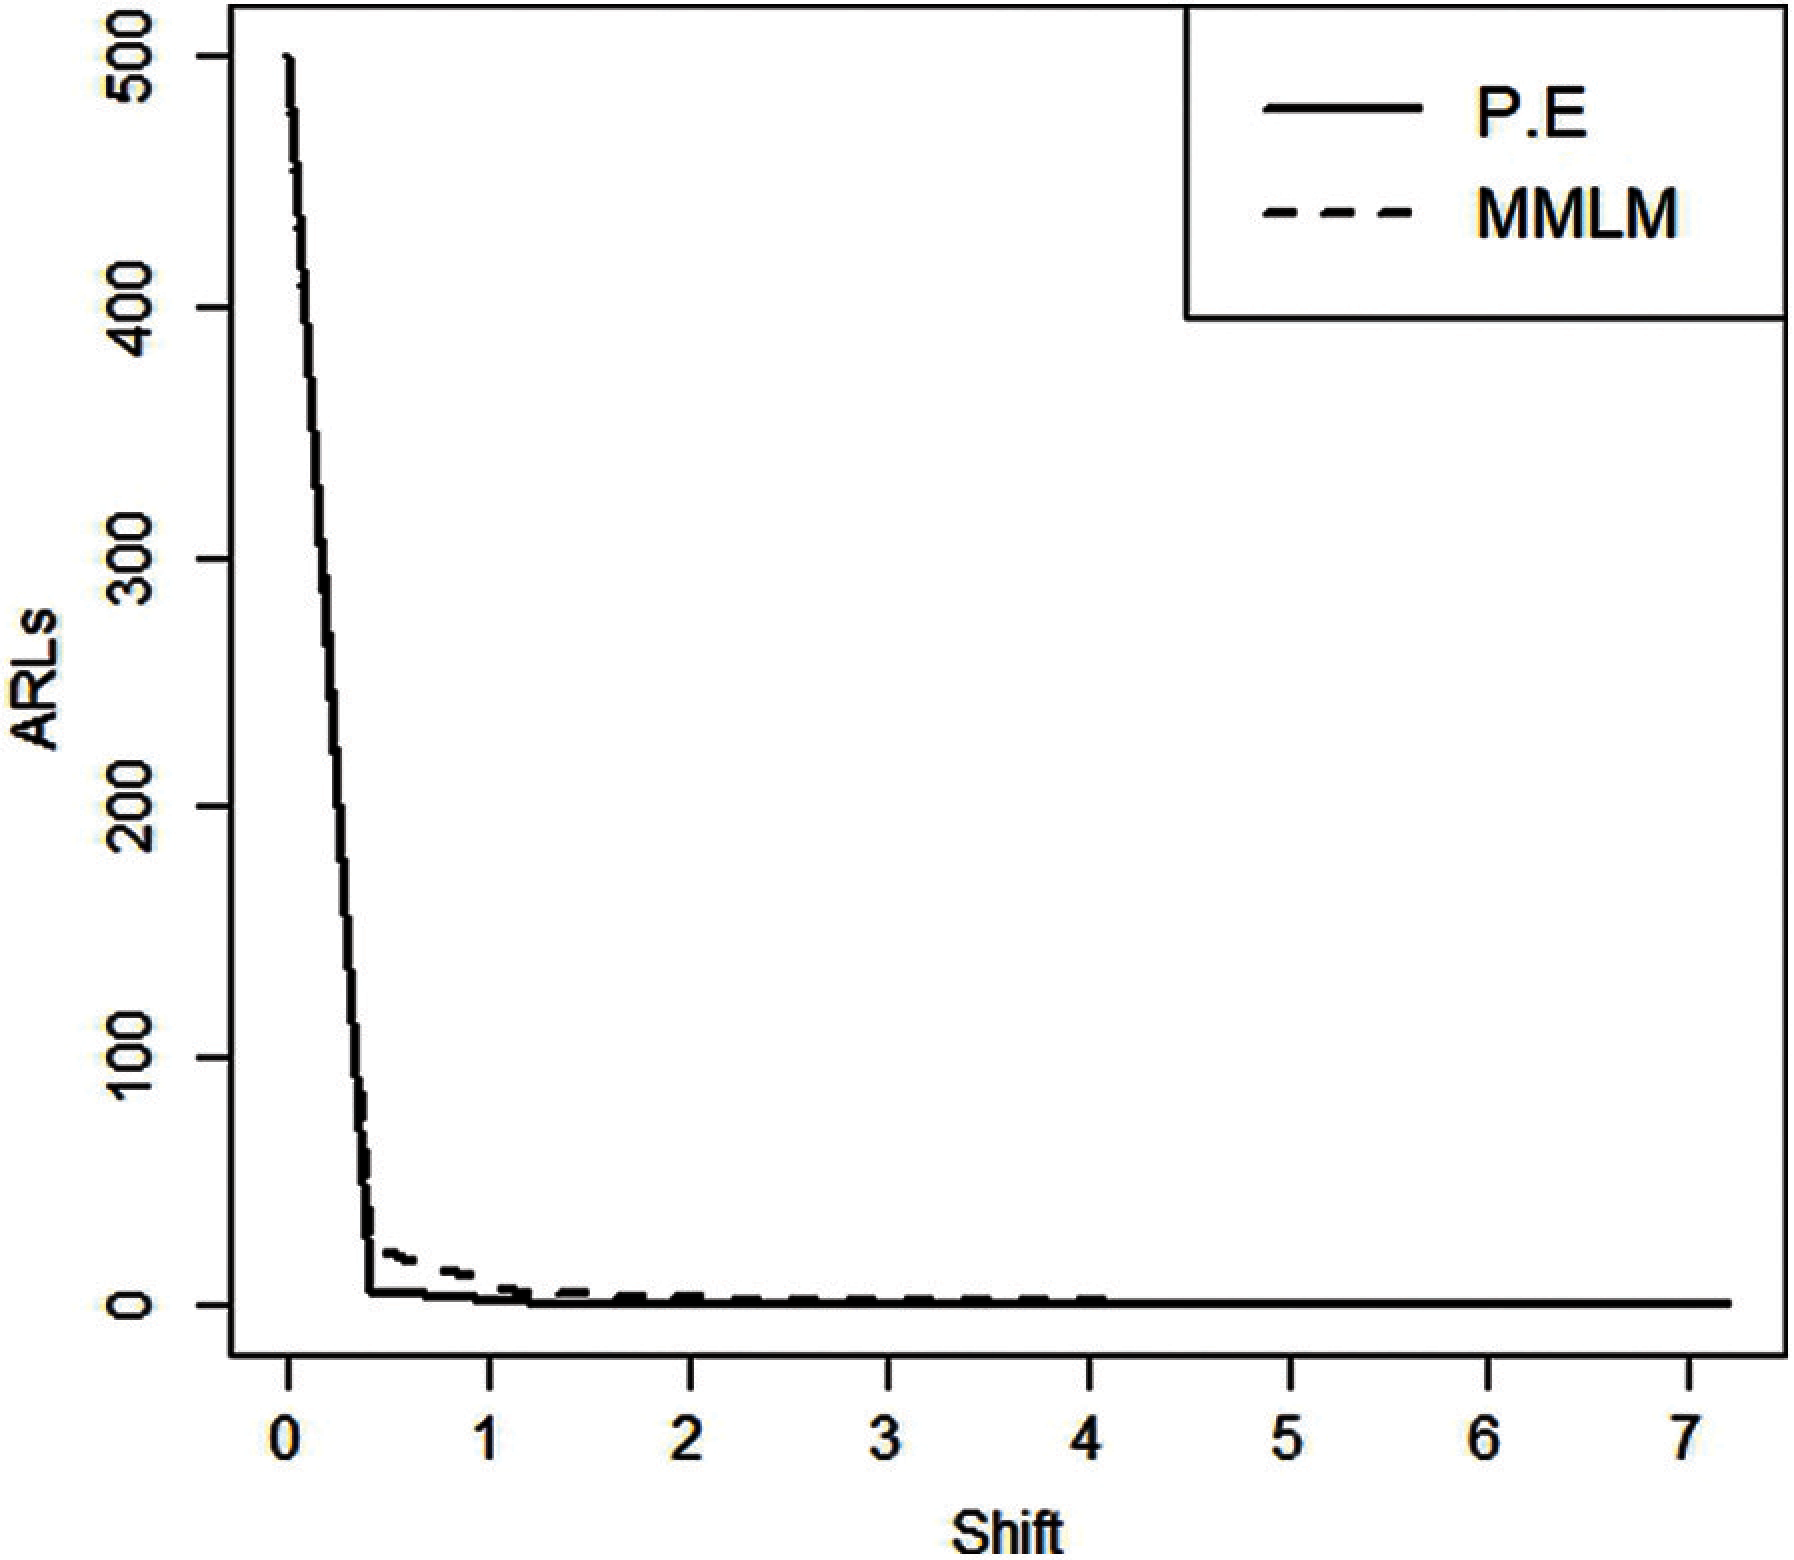
Figure 1: ARLS for EWMA control charts (
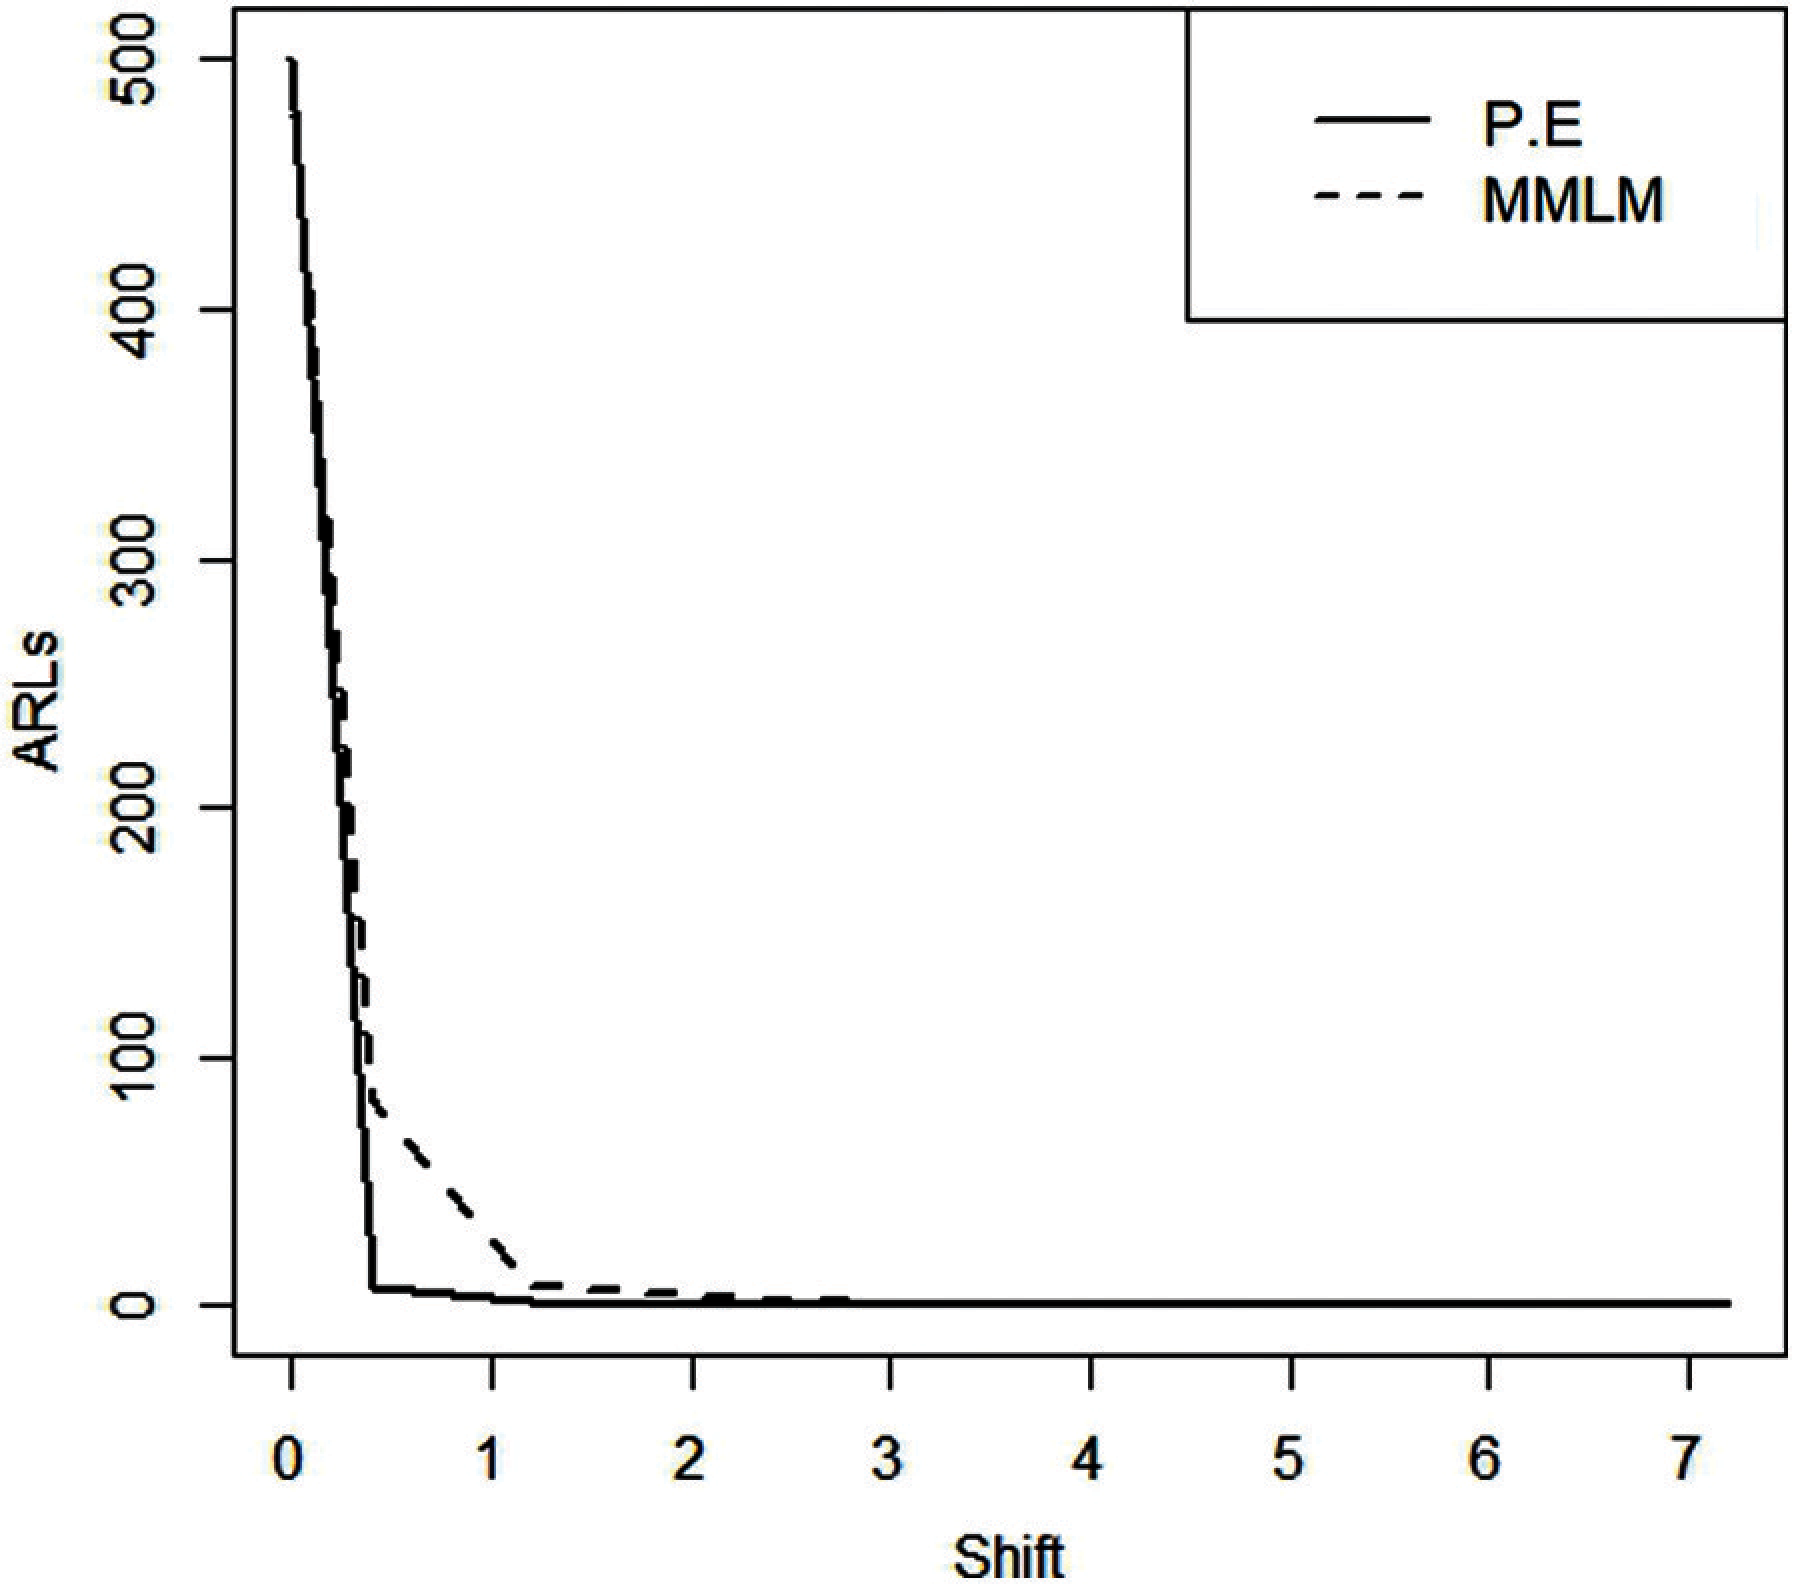
Figure 2: ARLS for EWMA control charts taking
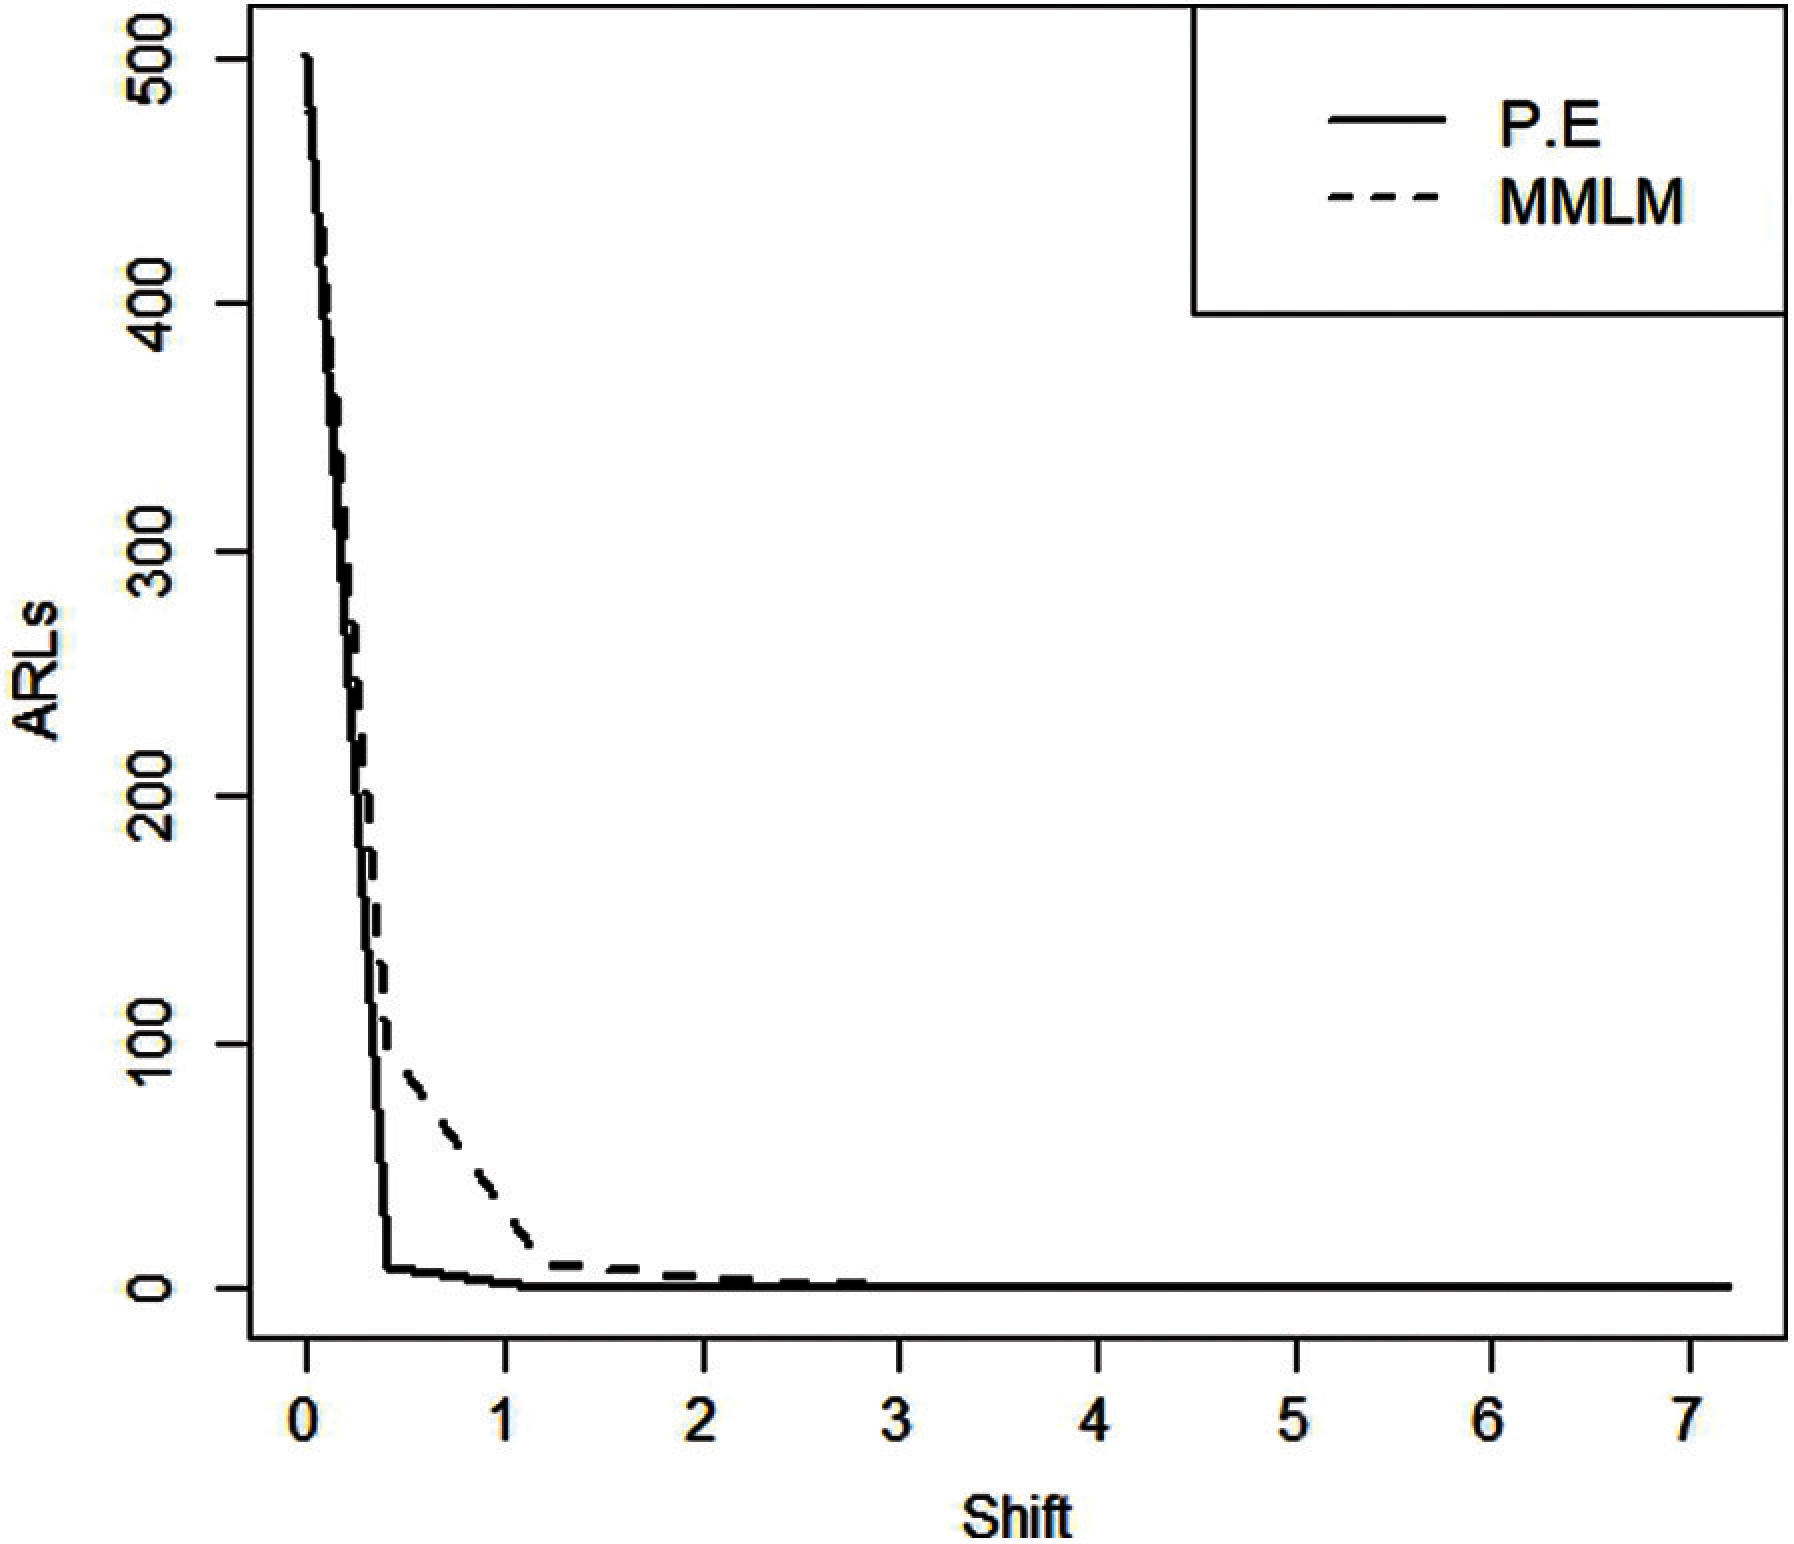
Figure 3: ARLS for EWMA control charts (

Figure 4: ARLS for MMLM and PE-based EEWMA control charts taking
2.6 Proposed EEWMA Control Chart Using PE
The EEWMA statistic using PE of the shape parameter of the RPFD using Zaka et al. [1] and Naveed et al. [17] is stated by
taking t = 1, 2 and
Let
On generalizing above, we get
By taking expectation and Replacing
By using geometric series, we get
So,
We know
The control limits are given as
2.7 Proposed EEWMA Control Chart Using MMLM
Assuming
The EEWMA statistic using the mean and variance given in (13) and (14). The control limits are given as
2.8 Algorithm for EEWMA Control Charts Under PE and MMLM
We generate a random sample from the process following RPFD using the sample size of 150. We then compute the estimate of the shape parameter using PE and MMLM alternatively and get their means and variances. Finally, the control limits using PE and MMLM are computed, and ARL is computed. We have fixed ARL0 = 500. we take different shifts and computed ARL for shifted process and called it ARL1. We have repeated this process 5000 times.
Using the above algorithm, we observe the clear efficiency of EEWMA over EWMA using PE and MMLM. The ARLs are presented in Tabs. 4 and 5 for both PE and MMLM. We observe that for larger
The 50 observations are generated using RPFD. Half of which is generated for the process to be in control and the other half are created by a shift of 0.40. We presented the estimates for the shape parameter of RPFD using MMLM and PE are calculated in Tab. 6, Figs. 7 and 8, illustrate the estimates from EEWMA. We see that PE-based on the EEWMA control chart detects an out-of-control state earlier than MMLM.
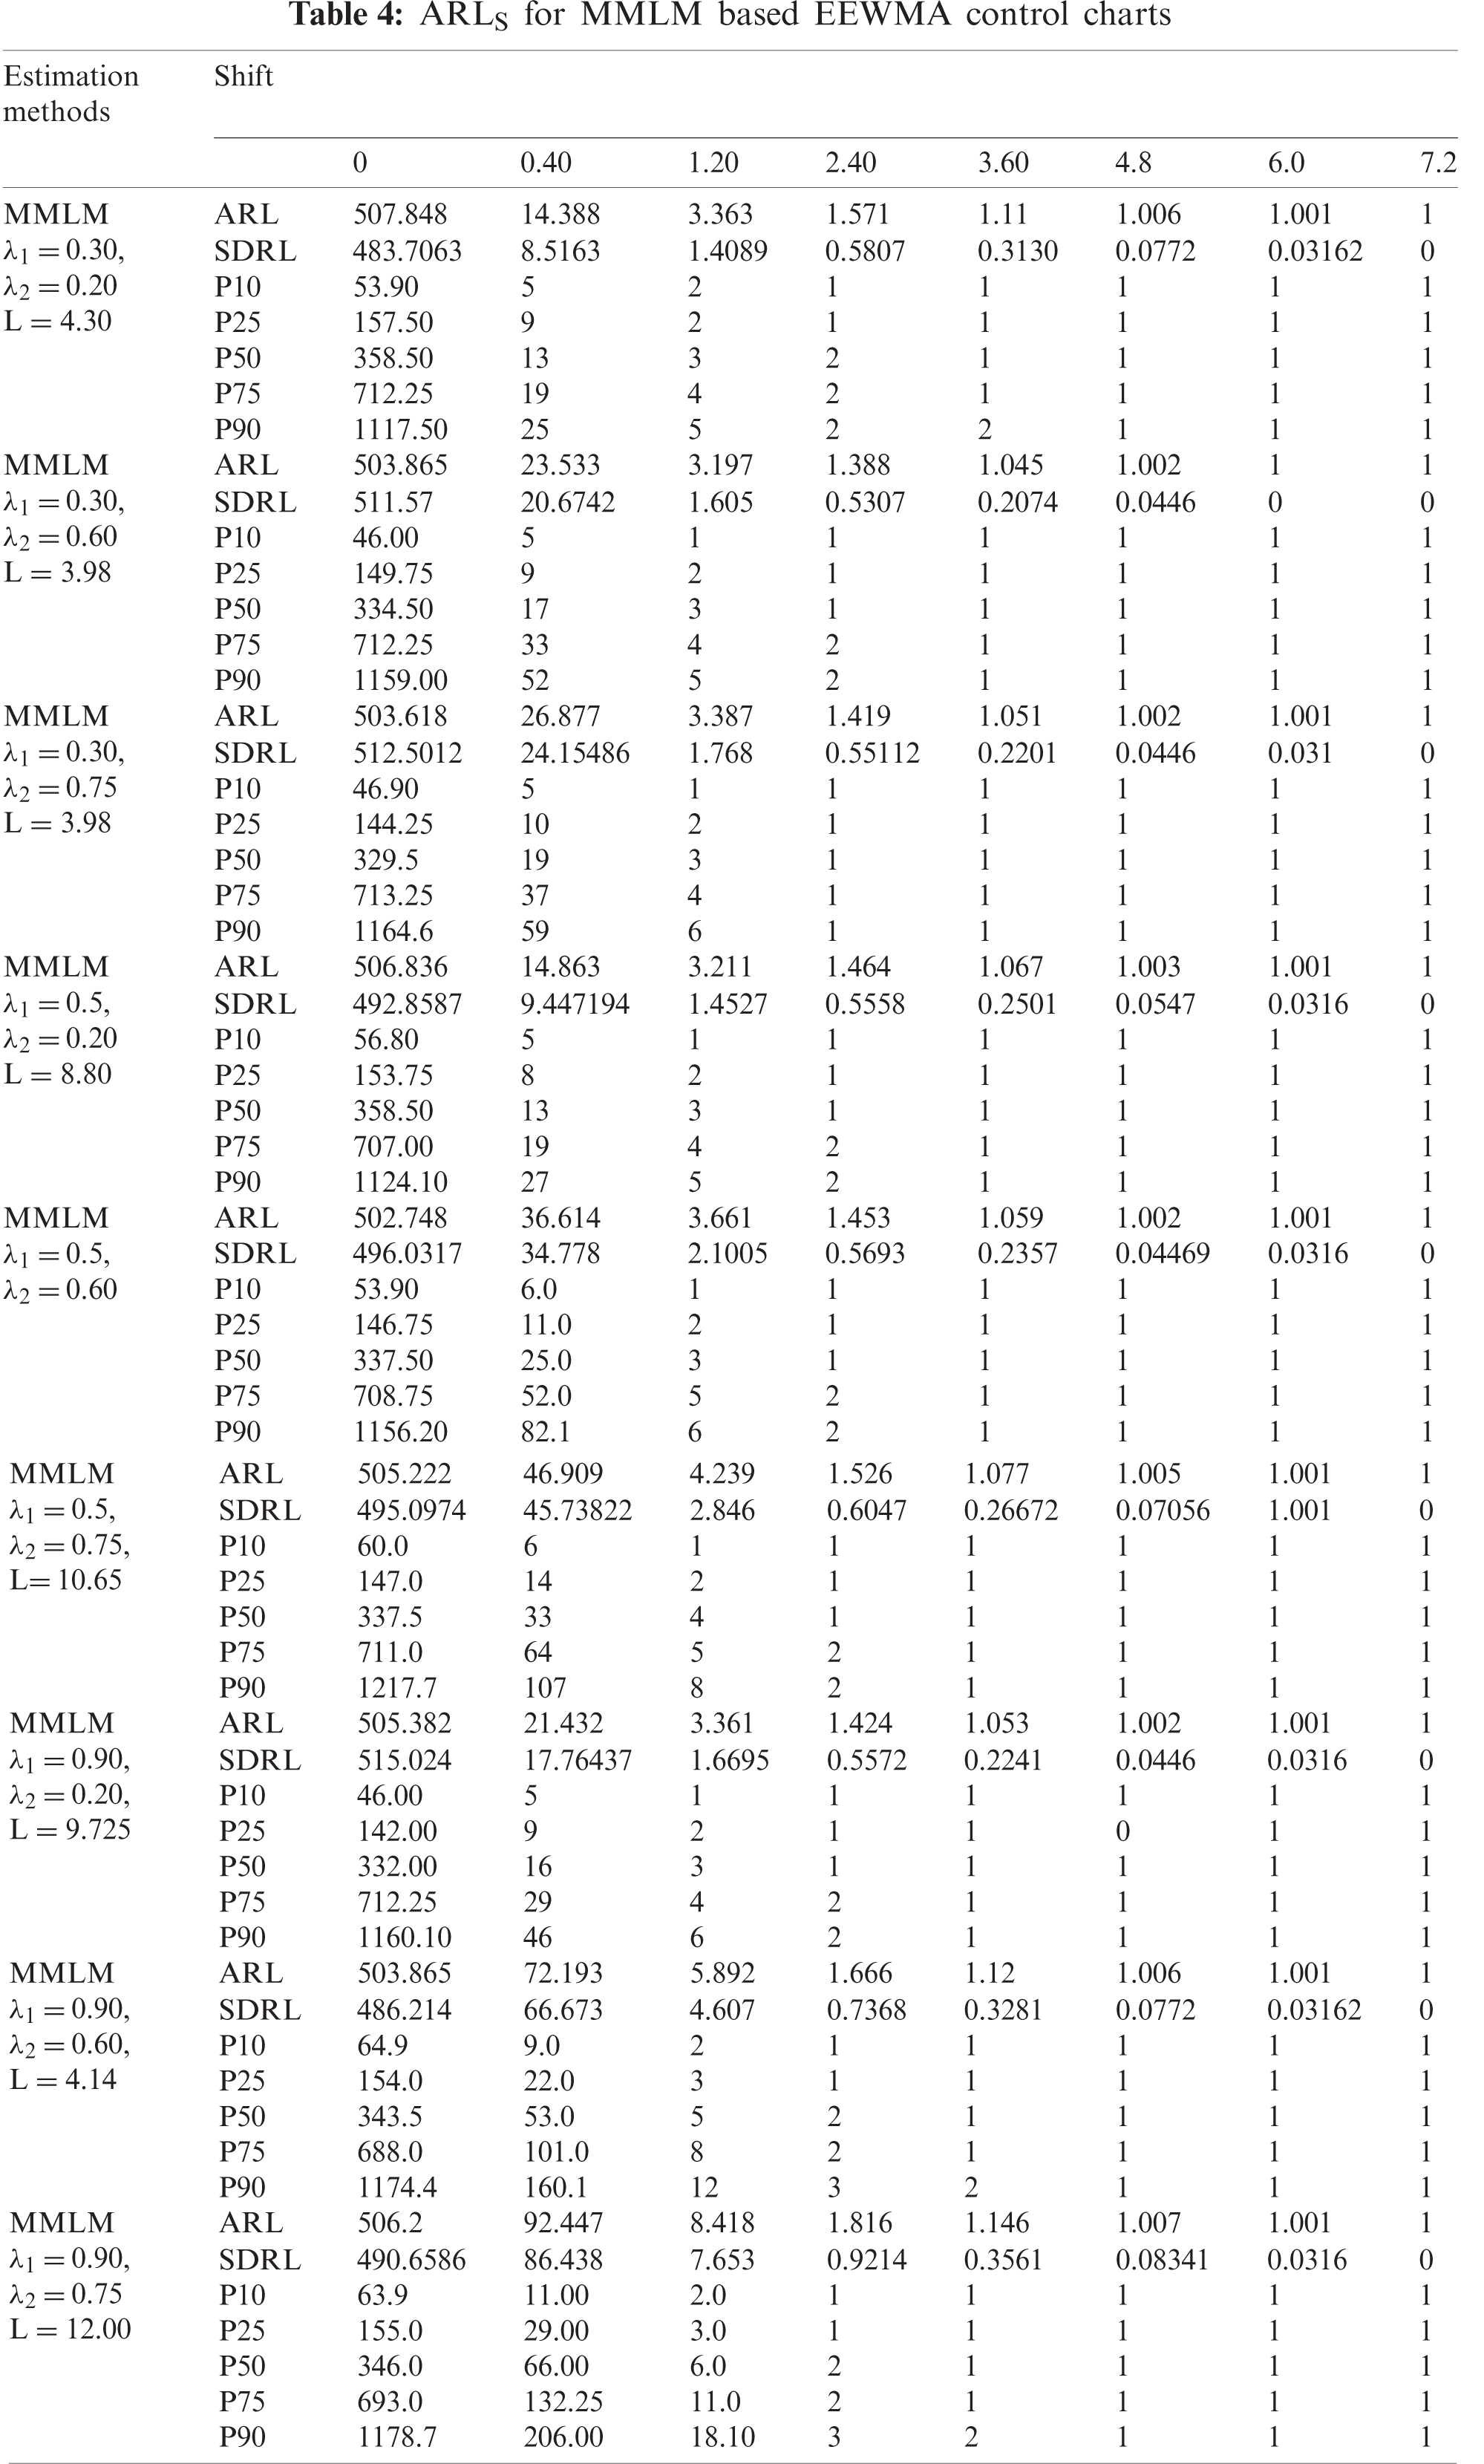
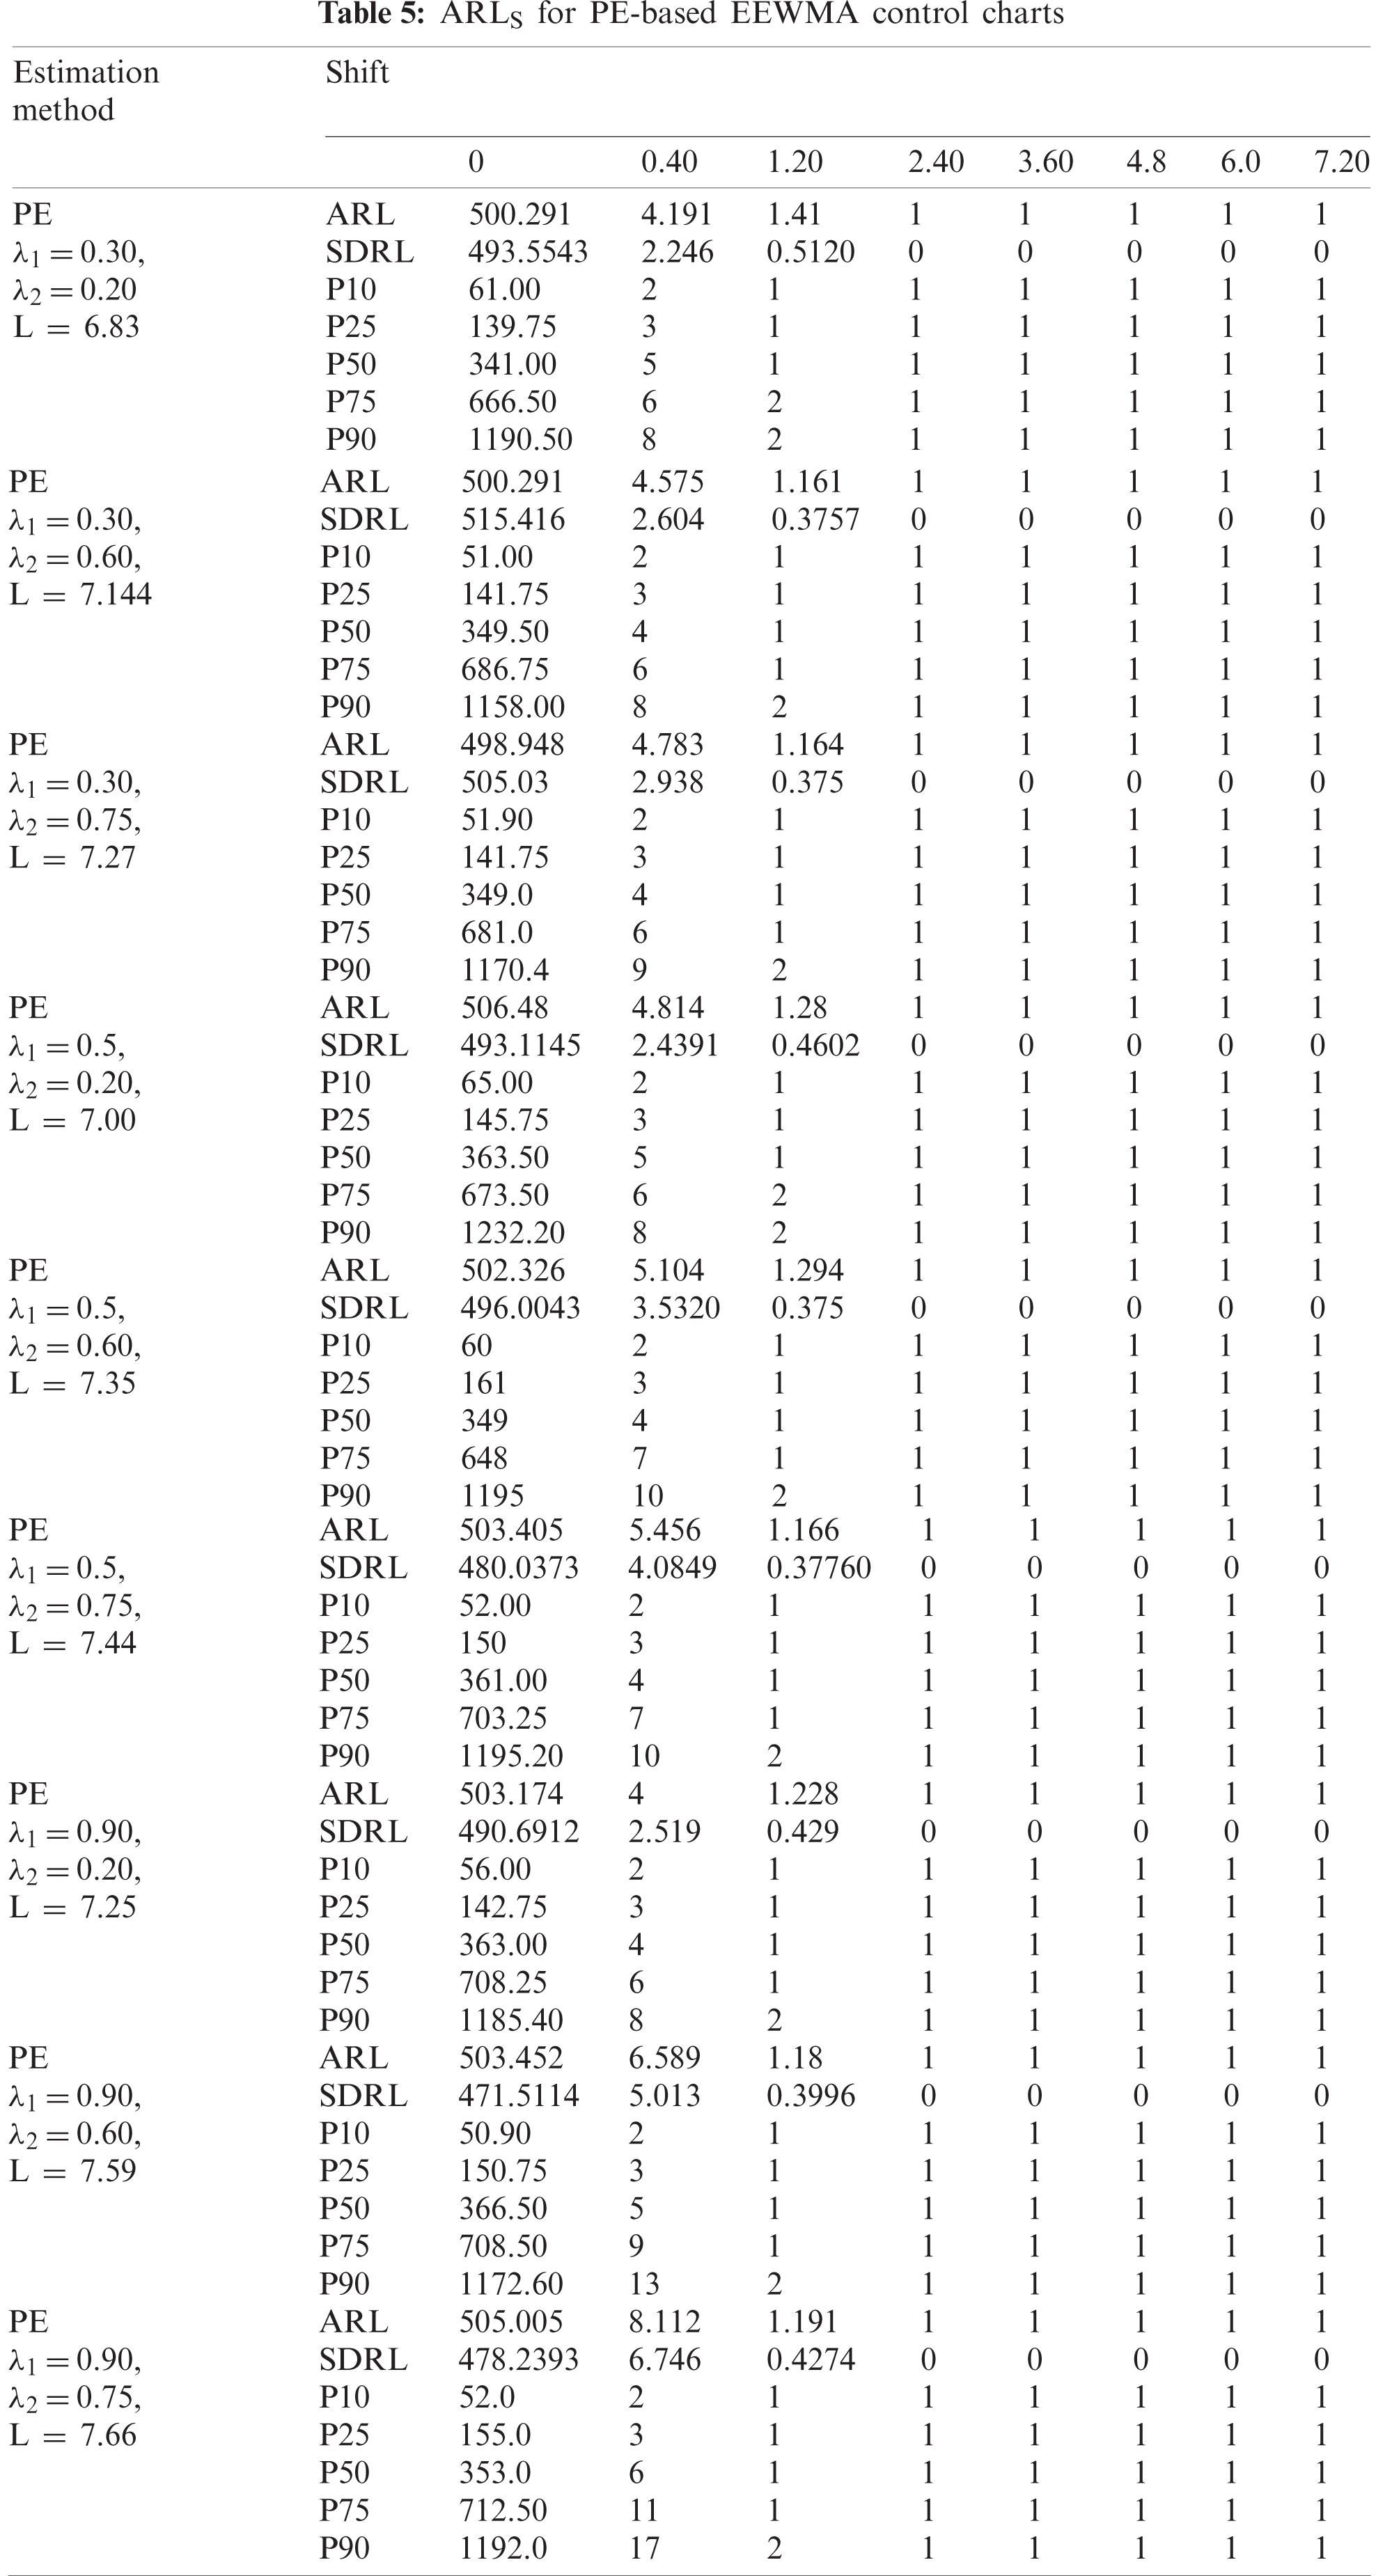

Figure 5: ARLS EEWMA control charts

Figure 6: ARLS EEWMA control charts (


Figure 7: Proposed EEWMA control chart using MMLM (L = 12,
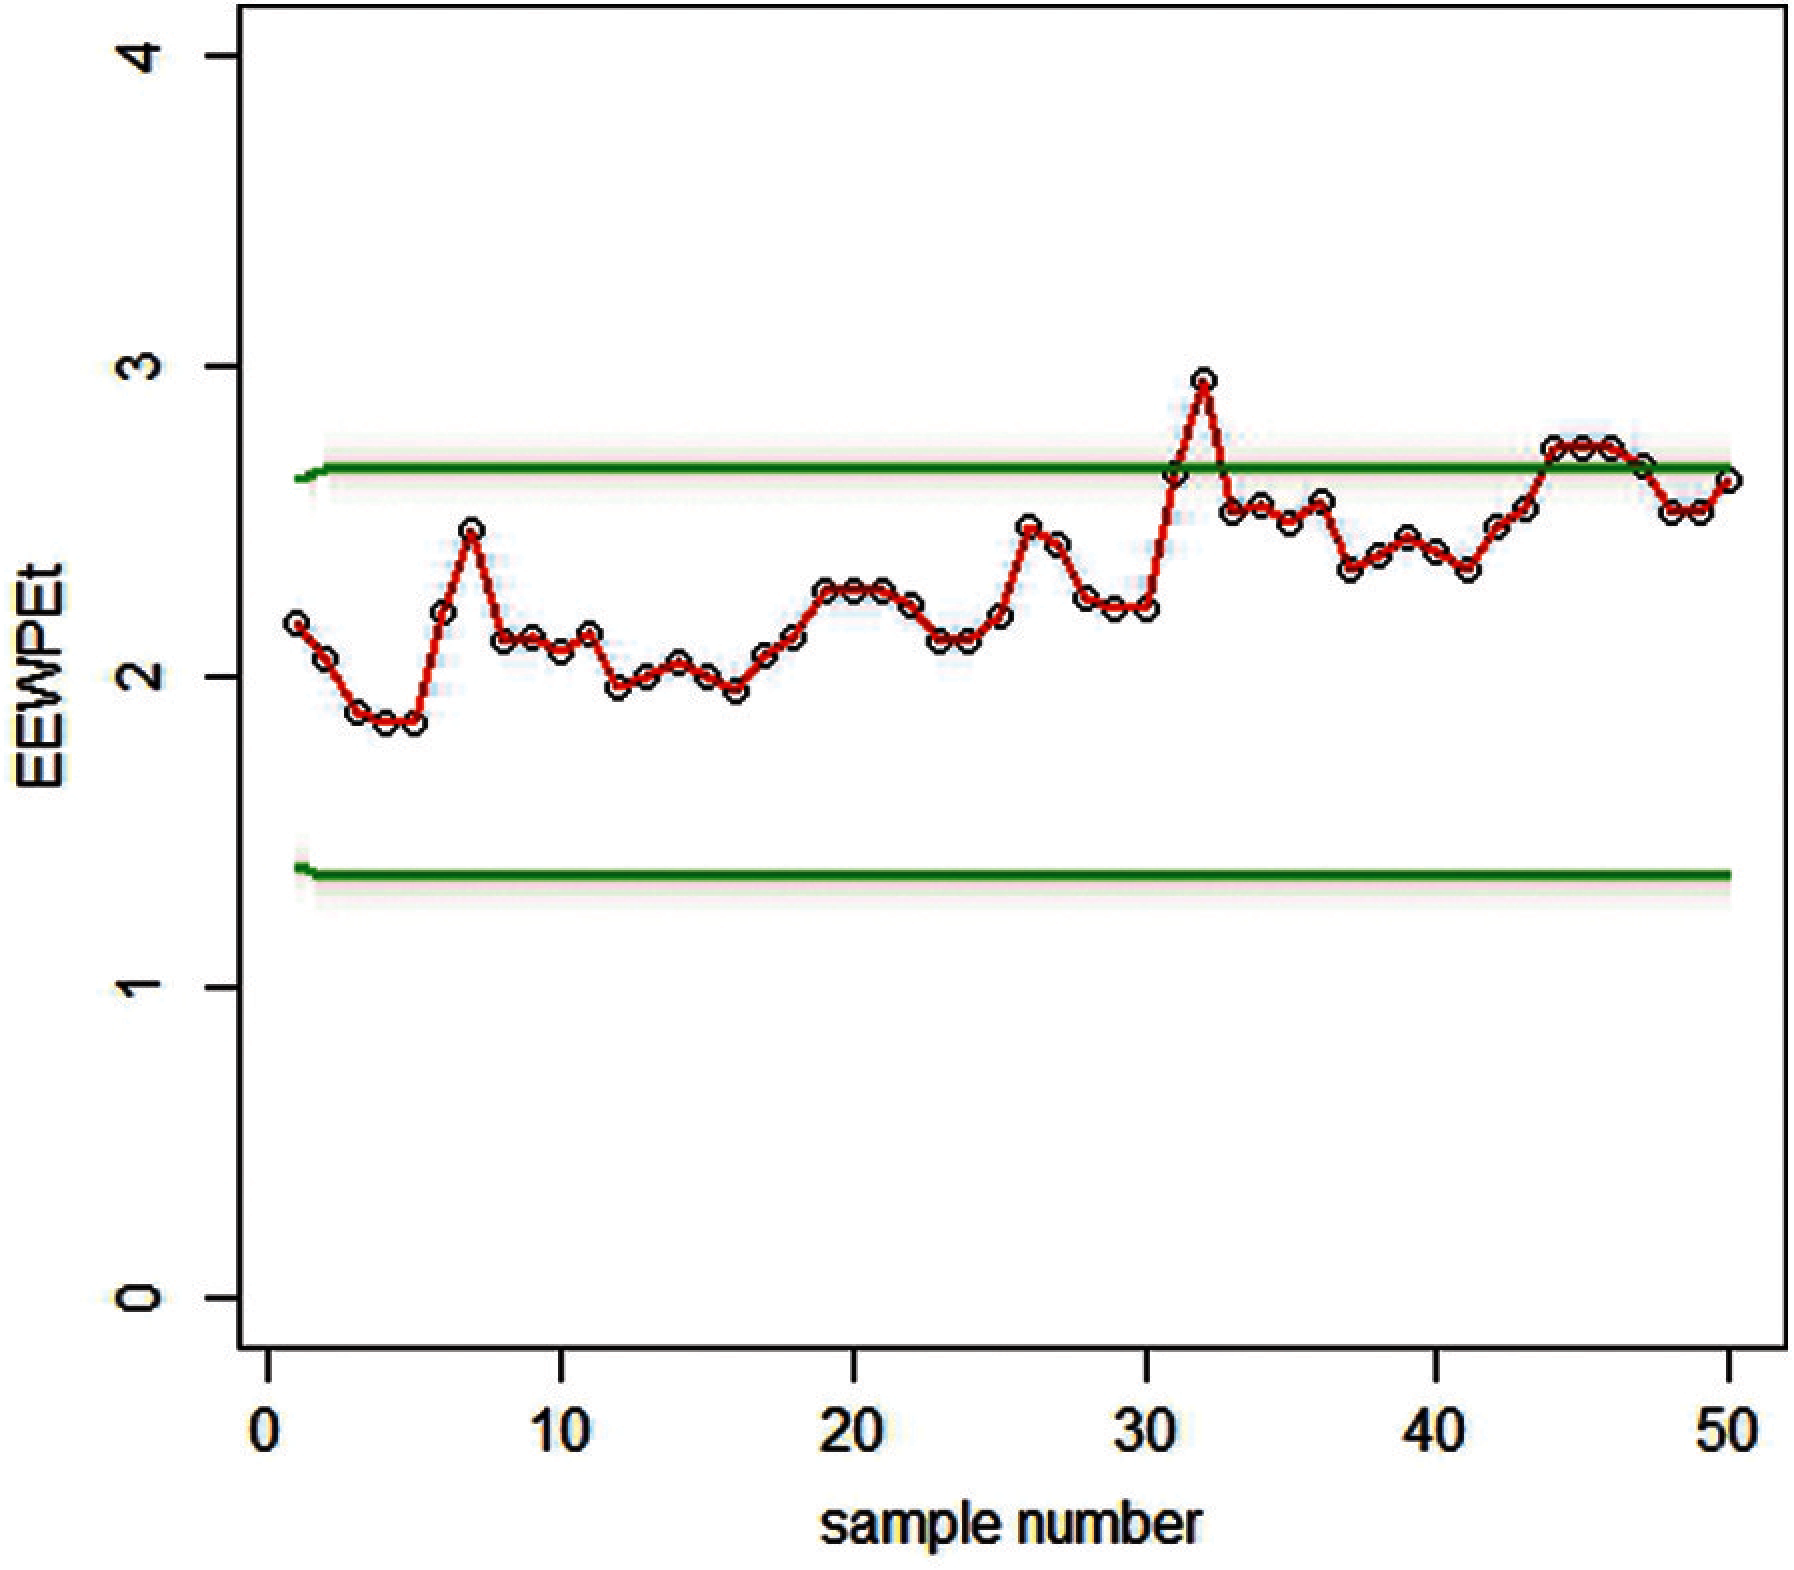
Figure 8: Proposed EEWMA control chart using PE (L = 7.66,
The Real-life data is taken from the operation side of the telecommunication industry, where errors in the software frequently occurred regarding the billing amount, dispatch issue, contact and login details. The per-day frequency of errors in the software is reported below: 1124, 1013, 1187, 1153, 1141, 1051, 1178, 1145, 1124, 1132, 1141, 1136, 1241,1301, 1214, 1421, 1258, 1109, 1321, 1121,1114, 1021, 1131, 1142, 1165, 1184. The data followed the RPFD and plotted for EEWMA control charts under MMLM and PE, as shown in Figs. 9 and 10.

Figure 9: Graph of real data of the EEWMA control chart under MMLM when L = 12,
We have constructed EEWMA control charts on real-life data under MMLM and PE. For example, in Figs. 9 and 10, we see that EEWMA under PE predicts the process shift at early levels compared to EEWMA under MMLM, which indicates that EEWMA under PE provides a better explanation of the distributions when the underlying process is based on RPFD.
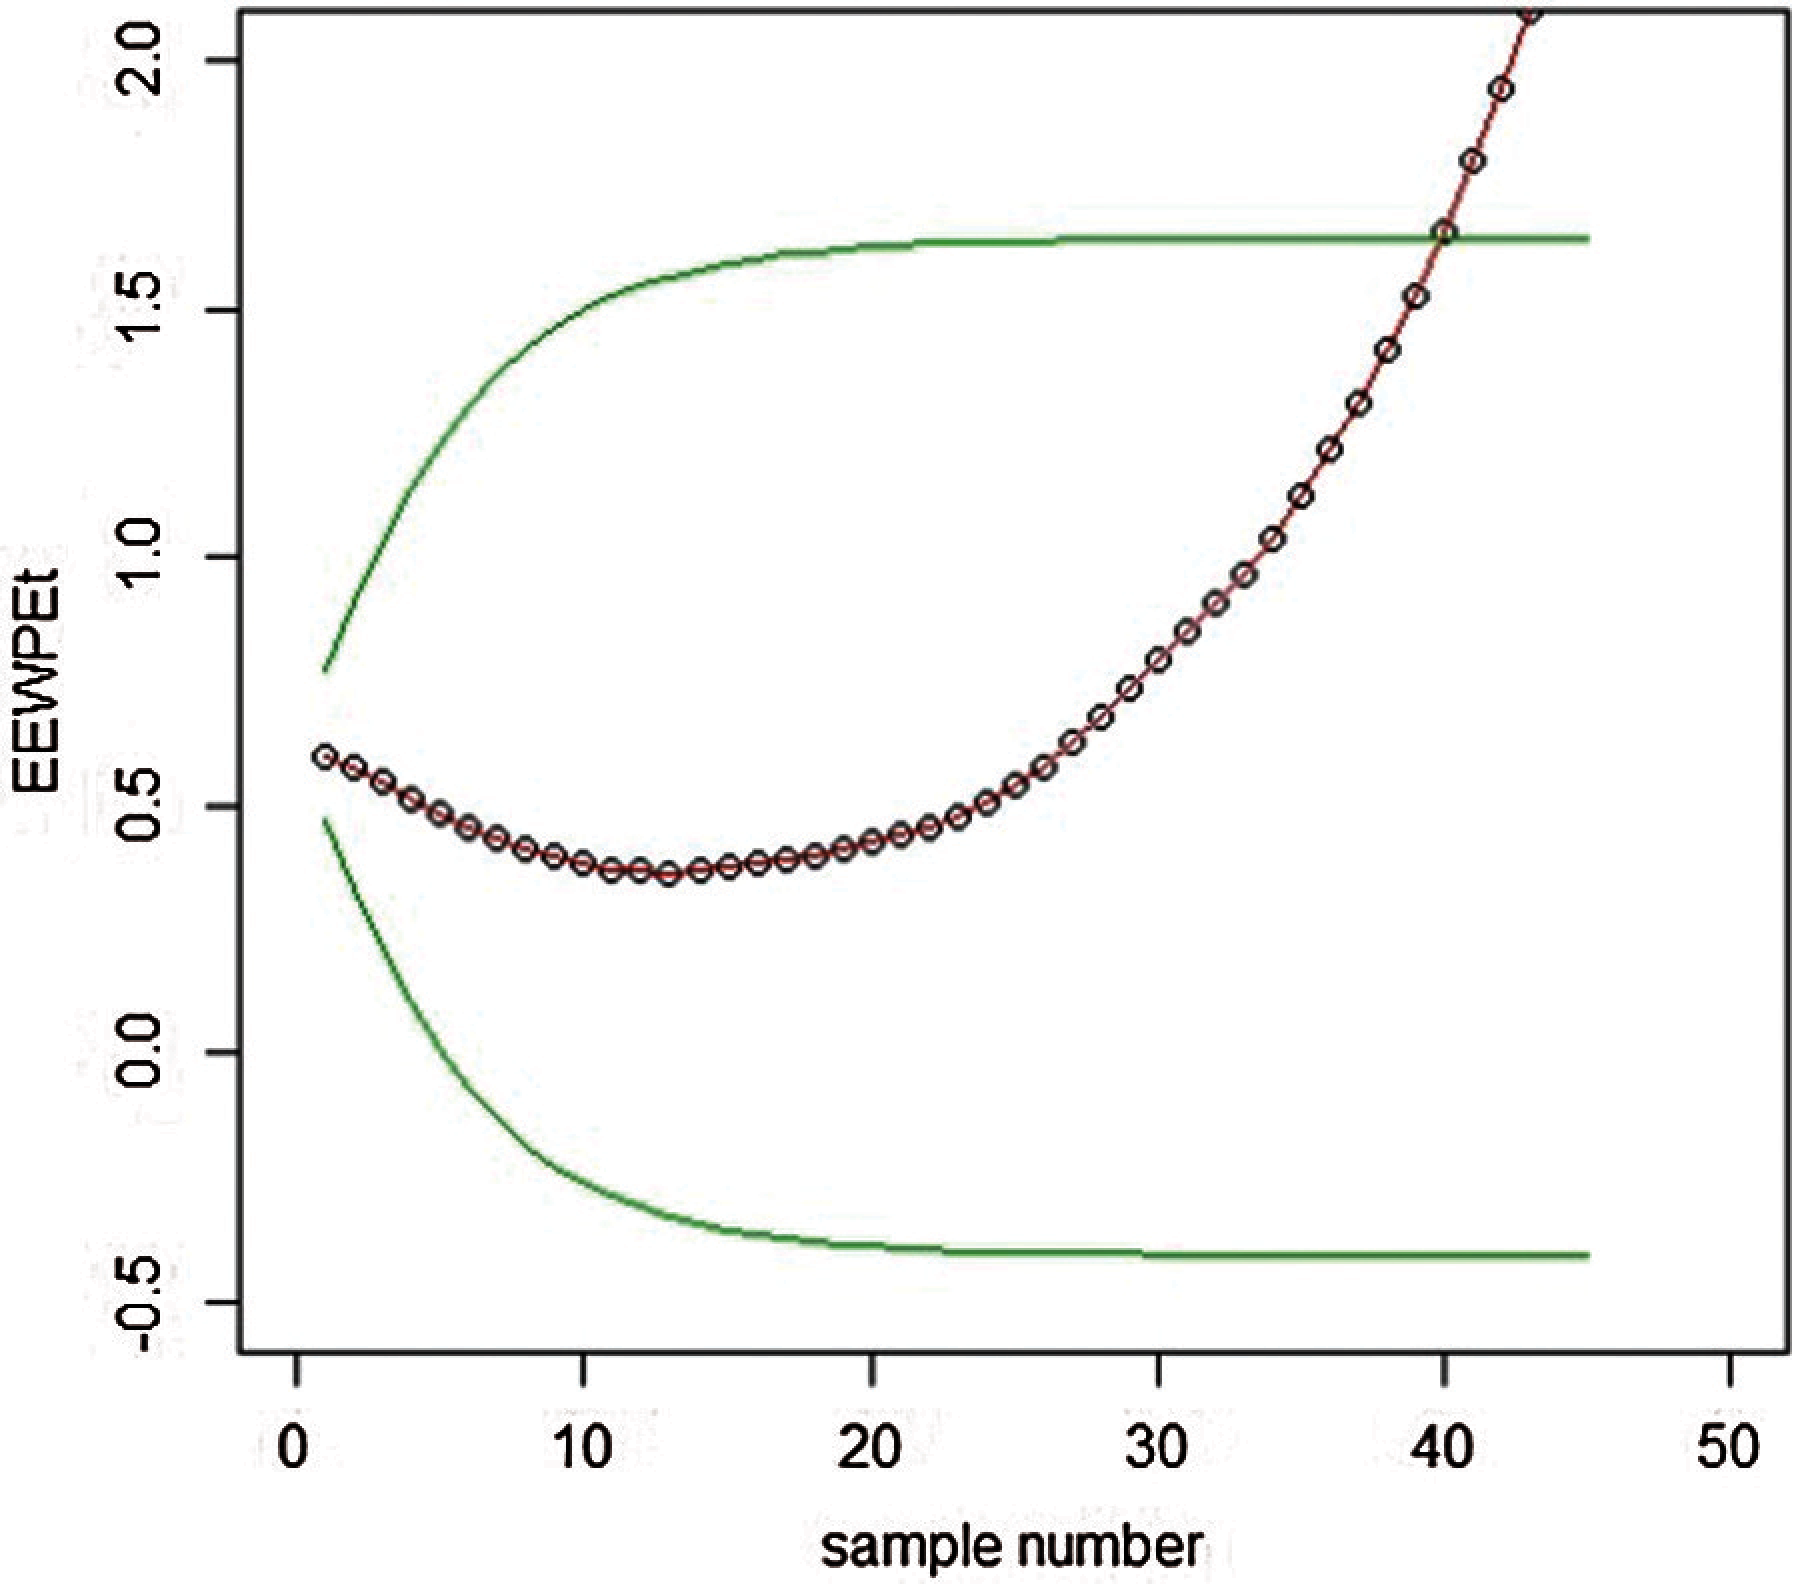
Figure 10: Graph of real data of the EEWMA control chart under PE when L = 7.66,
3.2 Earnings Per Share (EPS) of the National Refinery Ltd
Real-life data for earnings per share (EPS) of the National Refinery Ltd. were taken from the State Bank of Pakistan (SBP) report for non-financial companies from the year 1984–2019. The data in Tab. 7 followed the RPFD and plotted for EEWMA control charts under MMLM and PE, as shown in Figs. 11 and 12.
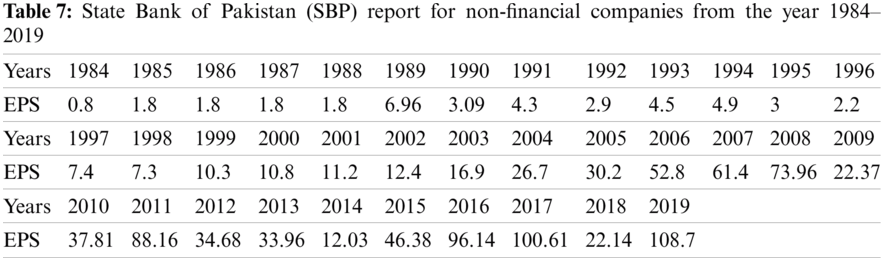

Figure 11: Graph of real data of the EEWMA control chart under MMLM when L = 12,
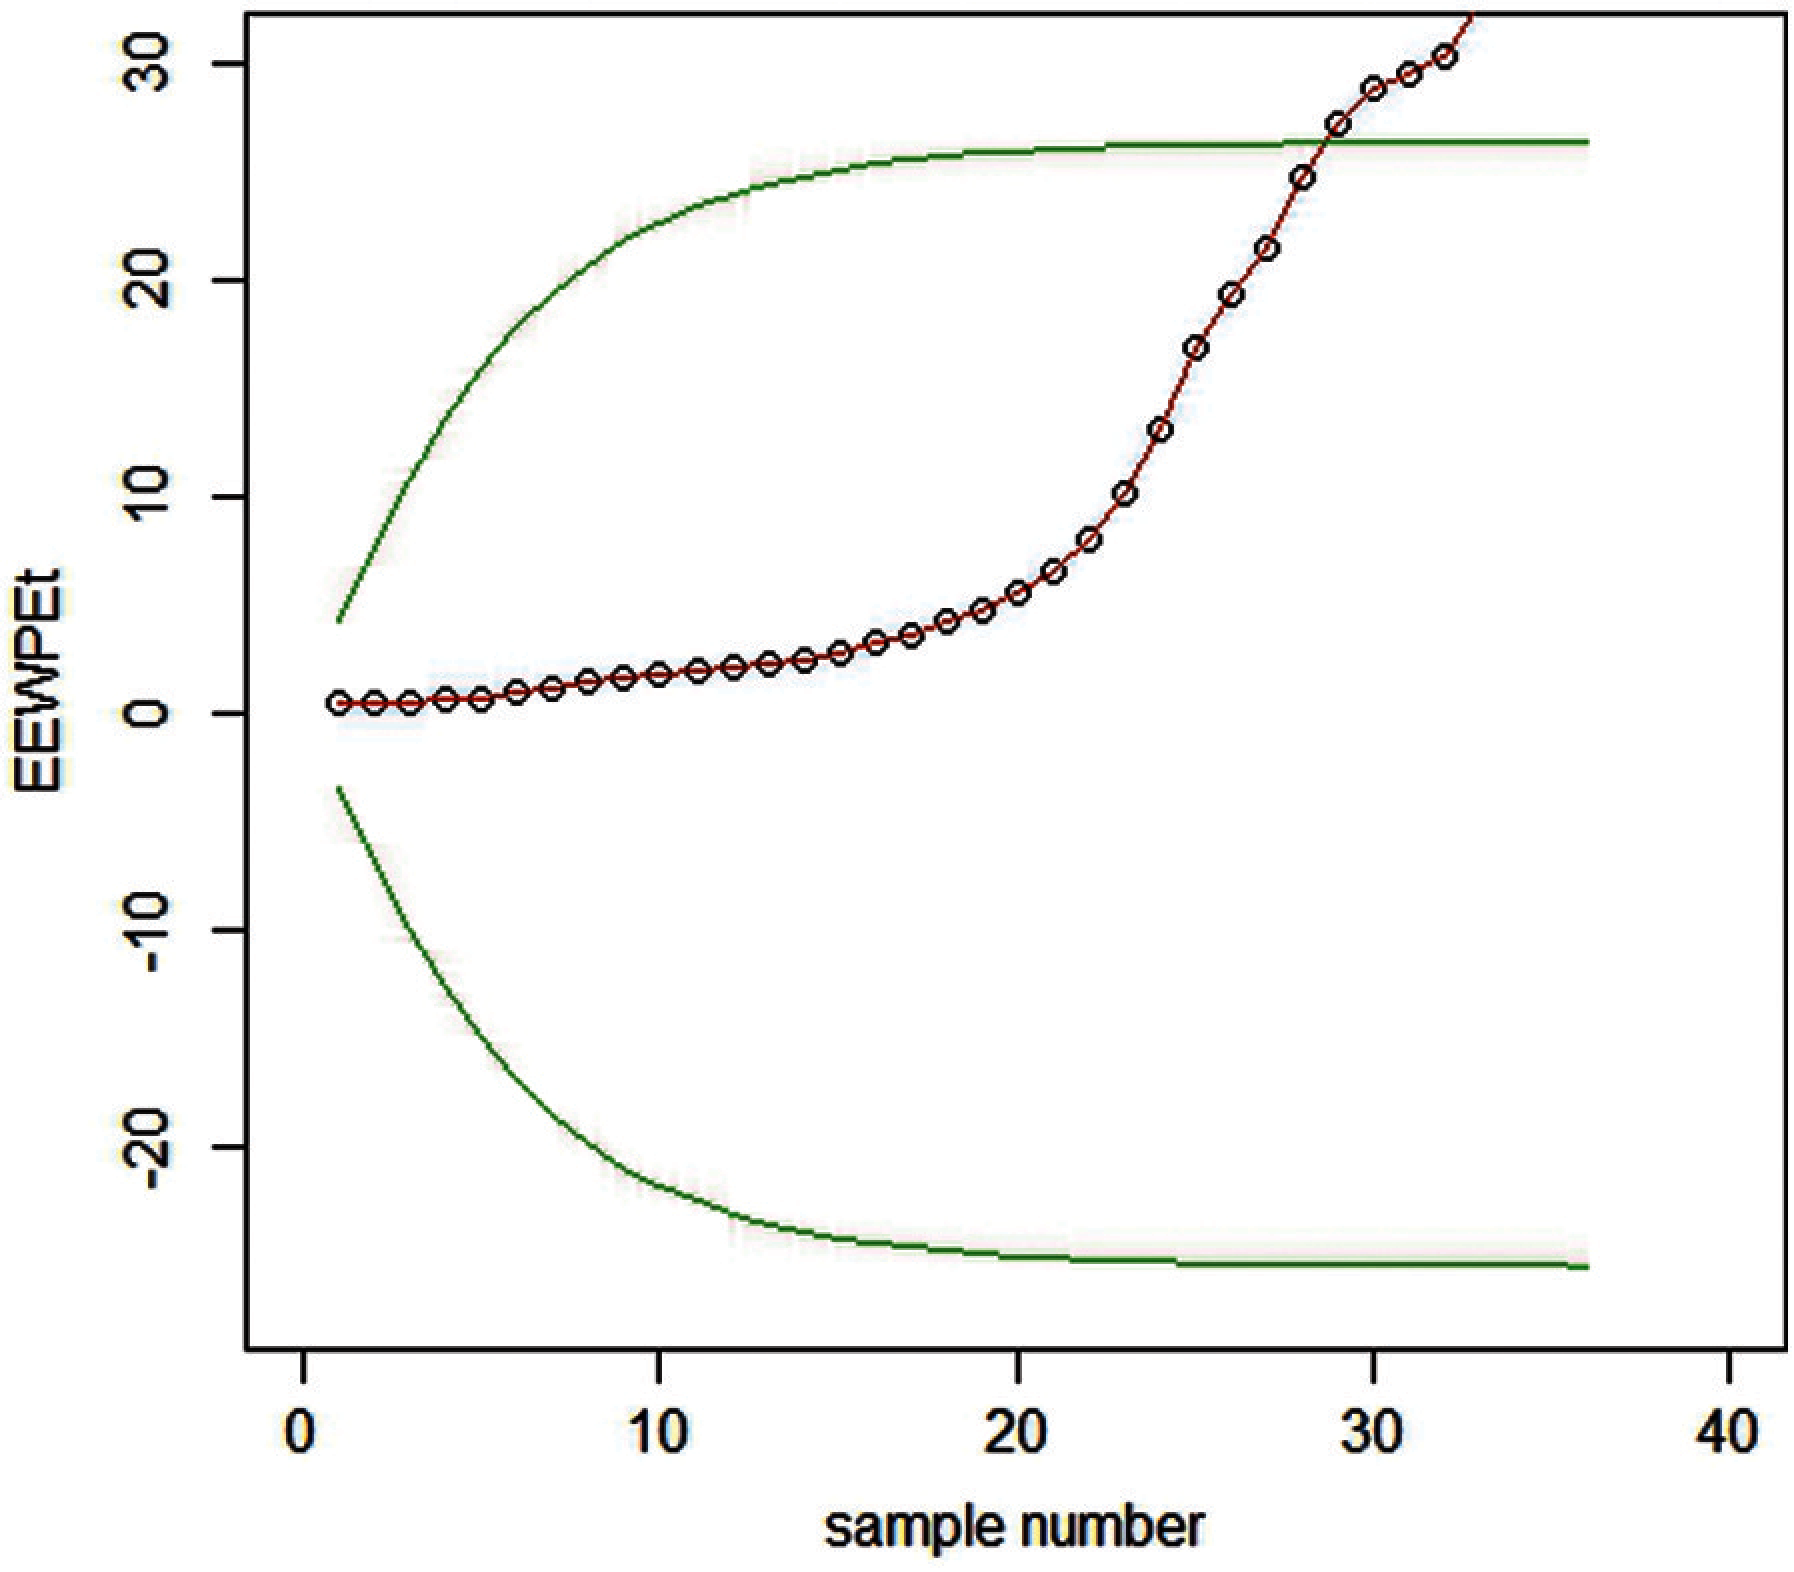
Figure 12: Graph of real data of the EEWMA control chart under PE when L = 7.66,
We have constructed EEWMA control charts on real-life data under MMLM and PE. For example, in Figs. 11 and 12,
We see that EEWMA using PE better predicts the process shifts using less samples as compare to MMLM. So it can be used effectively for Earning per share data.
This study is conducted to develop the control charts in a real-life situation that does not follow a normal distribution by employing statistical methods. The main findings of the study are:
• It discussed the application of the RPED in the production process of telecommunications and finance.
• It has applied two memory-based control charts and suggested that EWMA and EEWMA based on PE and MMLM are better estimators when the underlying distribution follows the RPFD.
• Further, we compared the performance of each control chart with a PE-based EEWMA control chart. We concluded that PE-based control charts are an effective estimator for the early deduction of machine errors. It can even identify minor shift errors more efficiently than MMLM-based estimators if a distribution works under the RPFD function.
• These results can be beneficial for scholars and practitioners of the diversified field of management and applied sciences. It will help them design the strategies to cope with the errors during the production process that improves product quality and eventually cause high returns.
Data Availability: The data used to support the findings of this study are included in the article.
Funding Statement: The authors received no specific funding for this study.
Conflicts of Interest: The authors declare that they have no conflicts of interest to report regarding the present study.
1. A. Zaka, A. S. Akhter and R. Jabeen, “The new reflected power function distribution: Theory, simulation and application,” AIMS Mathematics, vol. 5, no. 5, pp. 5031–5054, 2020. [Google Scholar]
2. S. W. Roberts, “Control chart tests based on geometric moving averages,” Technometrics, vol. 1, pp. 239–250, 1959. [Google Scholar]
3. R. Noorossana, S. Fathizadan and M. R. Nayebpour, “EWMA control chart performance with estimated parameters under non-normality,” Quality Technology and Quantitative Management, vol. 32, no. 5, pp. 1638–1654, 2016. [Google Scholar]
4. S. Ali, A. Pievatolo and R. Göb, “An overview of control charts for high-quality processes,” Quality and Reliability Engineering International, vol. 32, no. 7, pp. 2171–2189, 2016. [Google Scholar]
5. S. Chakraborti and M. A. Graham, “Nonparametric (distribution-free) control charts: An updated overview and some results,” Quality Engineering, vol. 31, no. 19, pp. 523–544, 2019. https://doi.org/10.1080/08982112.2018.1549330. [Google Scholar]
6. T. Mahmood and M. Xie, “Models and monitoring of zero-inflated processes: The past and current trends,” Quality and Reliability Engineering International, vol. 35, no. 8, pp. 2540–2557, 2019. [Google Scholar]
7. A. Ahmed, A. Sanaullah and M. Hanif, “A robust alternate to the HEWMA control chart under non-normality,” Quality Technology and Quantitative Management, vol. 17, no. 4, pp. 423–447, 2020. [Google Scholar]
8. Z. Khan, M. Gulistan, S. Kadry, Y. Chu and K. Lane-Krebs, “On scale parameter monitoring of the Rayleigh distributed data using a new design,” IEEE Access, vol. 8, pp. 188390–188400, 2020. [Google Scholar]
9. M. Aslam, N. Khan and M. Z. Khan, “Monitoring the variability in the process using neutrosophic statistical interval method,” Symmetry, vol. 10, no. 11, pp. 562–578, 2018. https://doi.org/10.3390/sym10110562. [Google Scholar]
10. M. Aslam, R. A. R. Bantan and N. Khan, “Design of a new attribute control chart under neutrosophic statistics,” International Journal of Fuzzy Systems, vol. 21, pp. 443–440, 2019. https://doi.org/10.1007/s40815-018-0577-1. [Google Scholar]
11. M. Aslam, A. H. AL-Marshadi and N. Khan, “A new x-bar control chart for using neutrosophic exponentially weighted moving average,” Mathematics, vol. 7, no. 10, pp. 957–967, 2019. https://doi.org/10.3390/math7100957. [Google Scholar]
12. M. Aslam, “Attribute control chart using the repetitive sampling under neutrosophic system,” IEEE Access, vol. 7, pp. 15367–15374, 2019. [Google Scholar]
13. M. Aslam and N. Khan, “A new variable control chart using neutrosophic interval method—An application to automobile industry,” Journal of Intelligent and Fuzzy Systems, vol. 36, no. 3, pp. 2615–2623, 2019. [Google Scholar]
14. Z. Khan, M. Gulistan, W. Chammam, S. Kadry and Y. Nam, “A new dispersion control chart for handling the neutrosophic data,” IEEE Access, vol. 8, pp. 96006–96015, 2020. https://doi.org/10.1109/ACCESS.2020.2995998. [Google Scholar]
15. Z. Khan, M. Gulistan, R. Hashim, N. Yaqoob and W. Chammam, “Design of S-control chart for neutrosophic data: An application to manufacturing industry,” Journal of Intelligent and Fuzzy Systems, vol. 38, no. 4, pp. 4743–4751, 2020. [Google Scholar]
16. A. Zaka, A. S. Akhter, R. Jabeen and A. Sanaullah, “Control charts for the shape parameter of reflected power function distribution under classical estimators,” Quality and Reliability Engineering. https://doi.org/10.1002/qre.2866. [Google Scholar]
17. M. Naveed, M. Azam, N. Khan and M. Aslam, “Design of a control chart using extended EWMA statistic,” Technologies, vol. 6, no. 108, pp. 2–15, 2018. [Google Scholar]
 | This work is licensed under a Creative Commons Attribution 4.0 International License, which permits unrestricted use, distribution, and reproduction in any medium, provided the original work is properly cited. |