DOI:10.32604/cmc.2022.020417
| Computers, Materials & Continua DOI:10.32604/cmc.2022.020417 | |
| Article |
Two-Mode Biomedical Sensor Build-up: Characterization of Optical Amplifier
1Faculty of Electrical and Electronics Engineering, University of Engineering and Technology, Taxila, 47050, Pakistan
2Department of Electrical Communication Engineering, University of Kassel, Kassel, 34127, Germany
3College of Computer Science & Information Technology, Jazan University, Jazan, 45142, Saudi Arabia
4Faculty of Engineering and Applied Sciences, Riphah International University, Islamabad, 44000, Pakistan
5Faculty of Information & Communication Technology, Balochistan University of Information Technology, Engineering and Management Sciences, Quetta
*Corresponding Author: Usman Masud. Email: usmanmasud123@hotmail.com
Received: 23 May 2021; Accepted: 12 August 2021
Abstract: Intracavity absorption spectroscopy is a strikingly sensitive technique that has been integrated with a two-wavelength setup to develop a sensor for human breath. Various factors are considered in such a scenario, out of which Relative Intensity Noise (RIN) has been exploited as an important parameter to characterize and calibrate the said setup. During the performance of an electrical based assessment arrangement which has been developed in the laboratory as an alternative to the expensive Agilent setup, the optical amplifier plays a pivotal role in its development and operation, along with other components and their significance. Therefore, the investigation and technical analysis of the amplifier in the system has been explored in detail. The algorithm developed for the automatic measurements of the system has been effectively deployed in terms of the laser's performance. With this in perspective, a frequency dependent calibration has been pursued in depth with this scheme which enhances the sensor's efficiency in terms of its sensitivity. In this way, our investigation helps us in a better understanding and implementation perspective of the proposed system, as the outcomes of our analysis adds to the precision and accuracy of the entire system.
Keywords: Biomedical sensor; cavity optomechanics; spectroscopy; relative intensity noise; semiconductor laser diode
In view of the health circumstances at present times, numerous techniques are being developed to counteract these diseases [1–3]. As the primary focus is human health, research remains concentrated towards various factors [4–10]. One of them is the air that is being exhaled from the human lungs. Information regarding numerous diseases can be ascertained with the help of this air. One of the underlying techniques that can be used for this purpose is spectroscopy, which aids in the analysis of spectrum of a substance of interest [11–14]. It has been found that this has lead to significant work in terms of research in physical and biological sciences [9,15–17], with much more potential on the way.
Semiconductor lasers have become a major focus of attention in the past decades, on account of their multiple applications in the biomedical sensors [18–20]. The medical experts have found diversified uses in the operations and surgical procedures in the hospitals [21–23]. The main reasons for their uses are precision, accuracy, and the exploration thresholds which had earlier not been possible [24,25]. The ongoing work shows promising future for the remedy of various diseases that had not been possible until now. A double-blinded placebo-controlled clinical trial has been successfully done in the near infra red regime [26]. Hair removal techniques [27,28] have been improved and precise ever since lasers have come into play by the surgeons. On account of these reasons, we resort to engage the lasers in infra red regime for the anticipated investigation and treatment of numerous diseases that can be prevalent in elder citizens.
Our work stems from the theory of intracavity absorption spectroscopy in which a substance of interest is placed inside the laser cavity [29–31]. Work in this connection has verified that this method is much sensitive as compared to intercavity spectroscopy, a fact that makes it an optimal choice for a biomedical sensor. We have explored this task in terms of the current work in which an optical system is being developed. To explore this principle further, our attempt is to use two modes (wavelengths). There are a few but strong technical grounds for that. First, the use of single mode does not yield very efficient results. Therefore, a system with two modes is better. Use of various modes can be very expensive, as well as complex. This is not desired as the setup is destined for a biomedical system. In view of these, this work endeavours to use a system that contains two modes, an idea that has not been anywhere else till now [9,15–17].
2 Measurement Setup and Related Issues
The laboratory system for this work has been elaborated in Fig. 1. This contains a Semiconductor Optical Amplifier (SOA) from which light is emitted in both directions in the Near Infra Red (NIR) range. To intensify its output, the principle of optical reflection [17,32] has been created with the aid of loop mirror on one side. Thus the output is provided into two Fiber Bragg Gratings (FBGs), namely FBGi (FBGl/FBG1) and FBGo (FBGh/FBG2). These are in reference to the inner (lower wavelength) and outer (higher wavelength) cavities respectively. These are separated with the help of optical couplers VCi and VCo which distinguish the two wavelengths (modes) Mi and Mo respectively.

Figure 1: Experimental setup of the sensor laser under investigation [17]
The SOA is supplied with injection current from the Laser Diode Controller (LDC) which also controls the temperature. The collimator is the sample holder where the substance of interest can be placed. Isolators ensure unidirectional flow of optical light, for instance into the Optical Spectrum Analyzer (OSA) for the sake of measurement purpose [13,33–36].
The photodiode collects the light from the laser diode sensor. The electrical signal output from the photodiode contains DC signal as well as AC signal. To prevent saturation of the RF amplifier, the DC signal is filtered by using high frequency bandwidth Bias Tee. The DC signal from Bias Tee is measured using Digital Multimeter (DMM) and is equal to the average photocurrent
3 Technical Description and Analysis of the Hardware
In order to understand the experimental setup, the equipment and the software used must be analyzed. Here the operation of the optical components and their control must be specifically addressed [37]. We perform an in-depth characterization of SOA in this work. The measurement results of the characterization routines provide the basis for the operation and the performance of the sensor.
3.1 The Semiconductor Optical Amplifier
It is important to understand the technical perspective of the SOA. In the proposed system, this is the source of light as well as the amplifier which increases the output intensity. The principle is similar to an active material in a laser which uses a constant fraction of the injected electrons to emit a certain number of photons at a specified value of pumping current [32,35]. In this way, both modes in the laser receive injection current, thereby giving rise to a competition between them.
A C-band SOA1117S/P from Covega [35,36] has been used as an SOA. It is a non-linear, polarization-independent semiconductor optical amplifier which is packaged in a 14-pin butterfly housing. It has an operating current range until 600 mA, and wavelength range from 1528 to 1562 nm, At 1550 nm, the typical saturation output power is 9 dBm, small signal gain of 20 dB (for input power of −20 dBm), gain ripple of 0.2 dB, polarization dependent gain of 1 dB, Noise Figure of 10 dB, and a forward voltage of 1.4 V. With the help of the LM14S2 Thorlabs holder [37], the semiconductor optical amplifier is clamped and can be connected using two 9-pin D-sub connectors with a laser and temperature controller. For this purpose, the laser controller LDC-3900 from ILX Light wave has been used [38]. This comprises a controllable current source (Model: 39400, capable to provide up to 4 A), and a 32 watt thermoelectric controller (Model: 39034).
The semiconductor optical amplifier is controlled by the laser controller LDC-3900. This in turn has a GPIB (IEEE-488) interface. Thus, the injection current for the semiconductor amplifier and its temperature can be controlled by a PC. The communication is done via the standard VISA interface. VISA (Virtual Instrument Software Architecture) which is an industry standard of various test and measurement equipment manufacturers such as Rohde & Schwarz, Agilent, National Instruments and Tektronix [38,39]. For the implementation of the VISA communication, LabVIEW (version: 18.0.1) [40] is used.
Before the use of an SOA in the overall system, its behaviour with respect to its injection current and temperature must be known. For this purpose, we used the spectrum of the SOA as a function of the injection current and temperature is recorded at the Optical Spectrum Analyzer (OSA), which is Yokogawa model AQ6370C [39]. In order to ensure the accuracy of the device behaviour, the spectrum has to be measured many times. To meet this requirement, Algorithm 1 for the automated characterization of the semiconductor amplifier is designed and implemented in Lab VIEW. This has the pronounced advantage in the sense that the characterization can be performed autonomously with a very high resolution, thereby refraining from continuous manual experimentation. The algorithm is so designed that it can be implemented in any programming language [38,41].
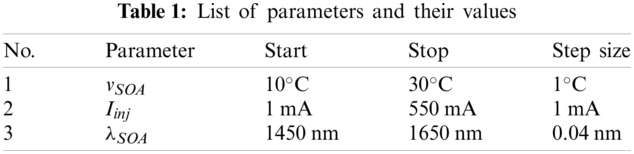
For the practical implementation of the characterization procedure in this work, the parameters used are given in Tab. 1. Here vSOA is the temperature of the controller, and

3.2 Evaluating the Characterizing Measurements of the SOA
Due to the amount of data which is needed for evaluation, the characterization is implemented as a script in Python. It is characterized by particularly a simple structure, few keywords and a simple syntax. Furthermore, it has an object-oriented semantics, whereby a good program readability is achieved in this manner. Moreover, Python is under the GPL (General Public License) and is therefore also available free for commercial use, thereby justifying one of the reasons of our biomedical system.
For the evaluation of the measured data of the SOA, two separate scripts have been written. The first script reads sequentially a series of measurements and analyzes this relative half-width, red shift, blue shift and laser fine structure (so called gain ripple) from this data. The analyzed data is then stored in separate ASCII files into the directory of the script.
The second script loads the previously saved files and restores the data analyzed using the Matplotlib extension for Python graphical form. The behaviour of the maximum wavelength
Fig. 2 also shows that certain wavelengths are independent of injection currents than others. This can be an effect of the multi-quantum well structure of the SOA which is being used. Another explanation could be that during these measurements, only the spectrum in each wavelength is used at its maximum intensity. By using a Pseudo-Voigt [42] or Gaussian distribution fit [43] to the spectra, we obtain a much smoother relationship, as shown in Fig. 3. The gray area marks the area around the operation at a pump current of about 450 mA. If we are in this part of the graph and change the injection current up to
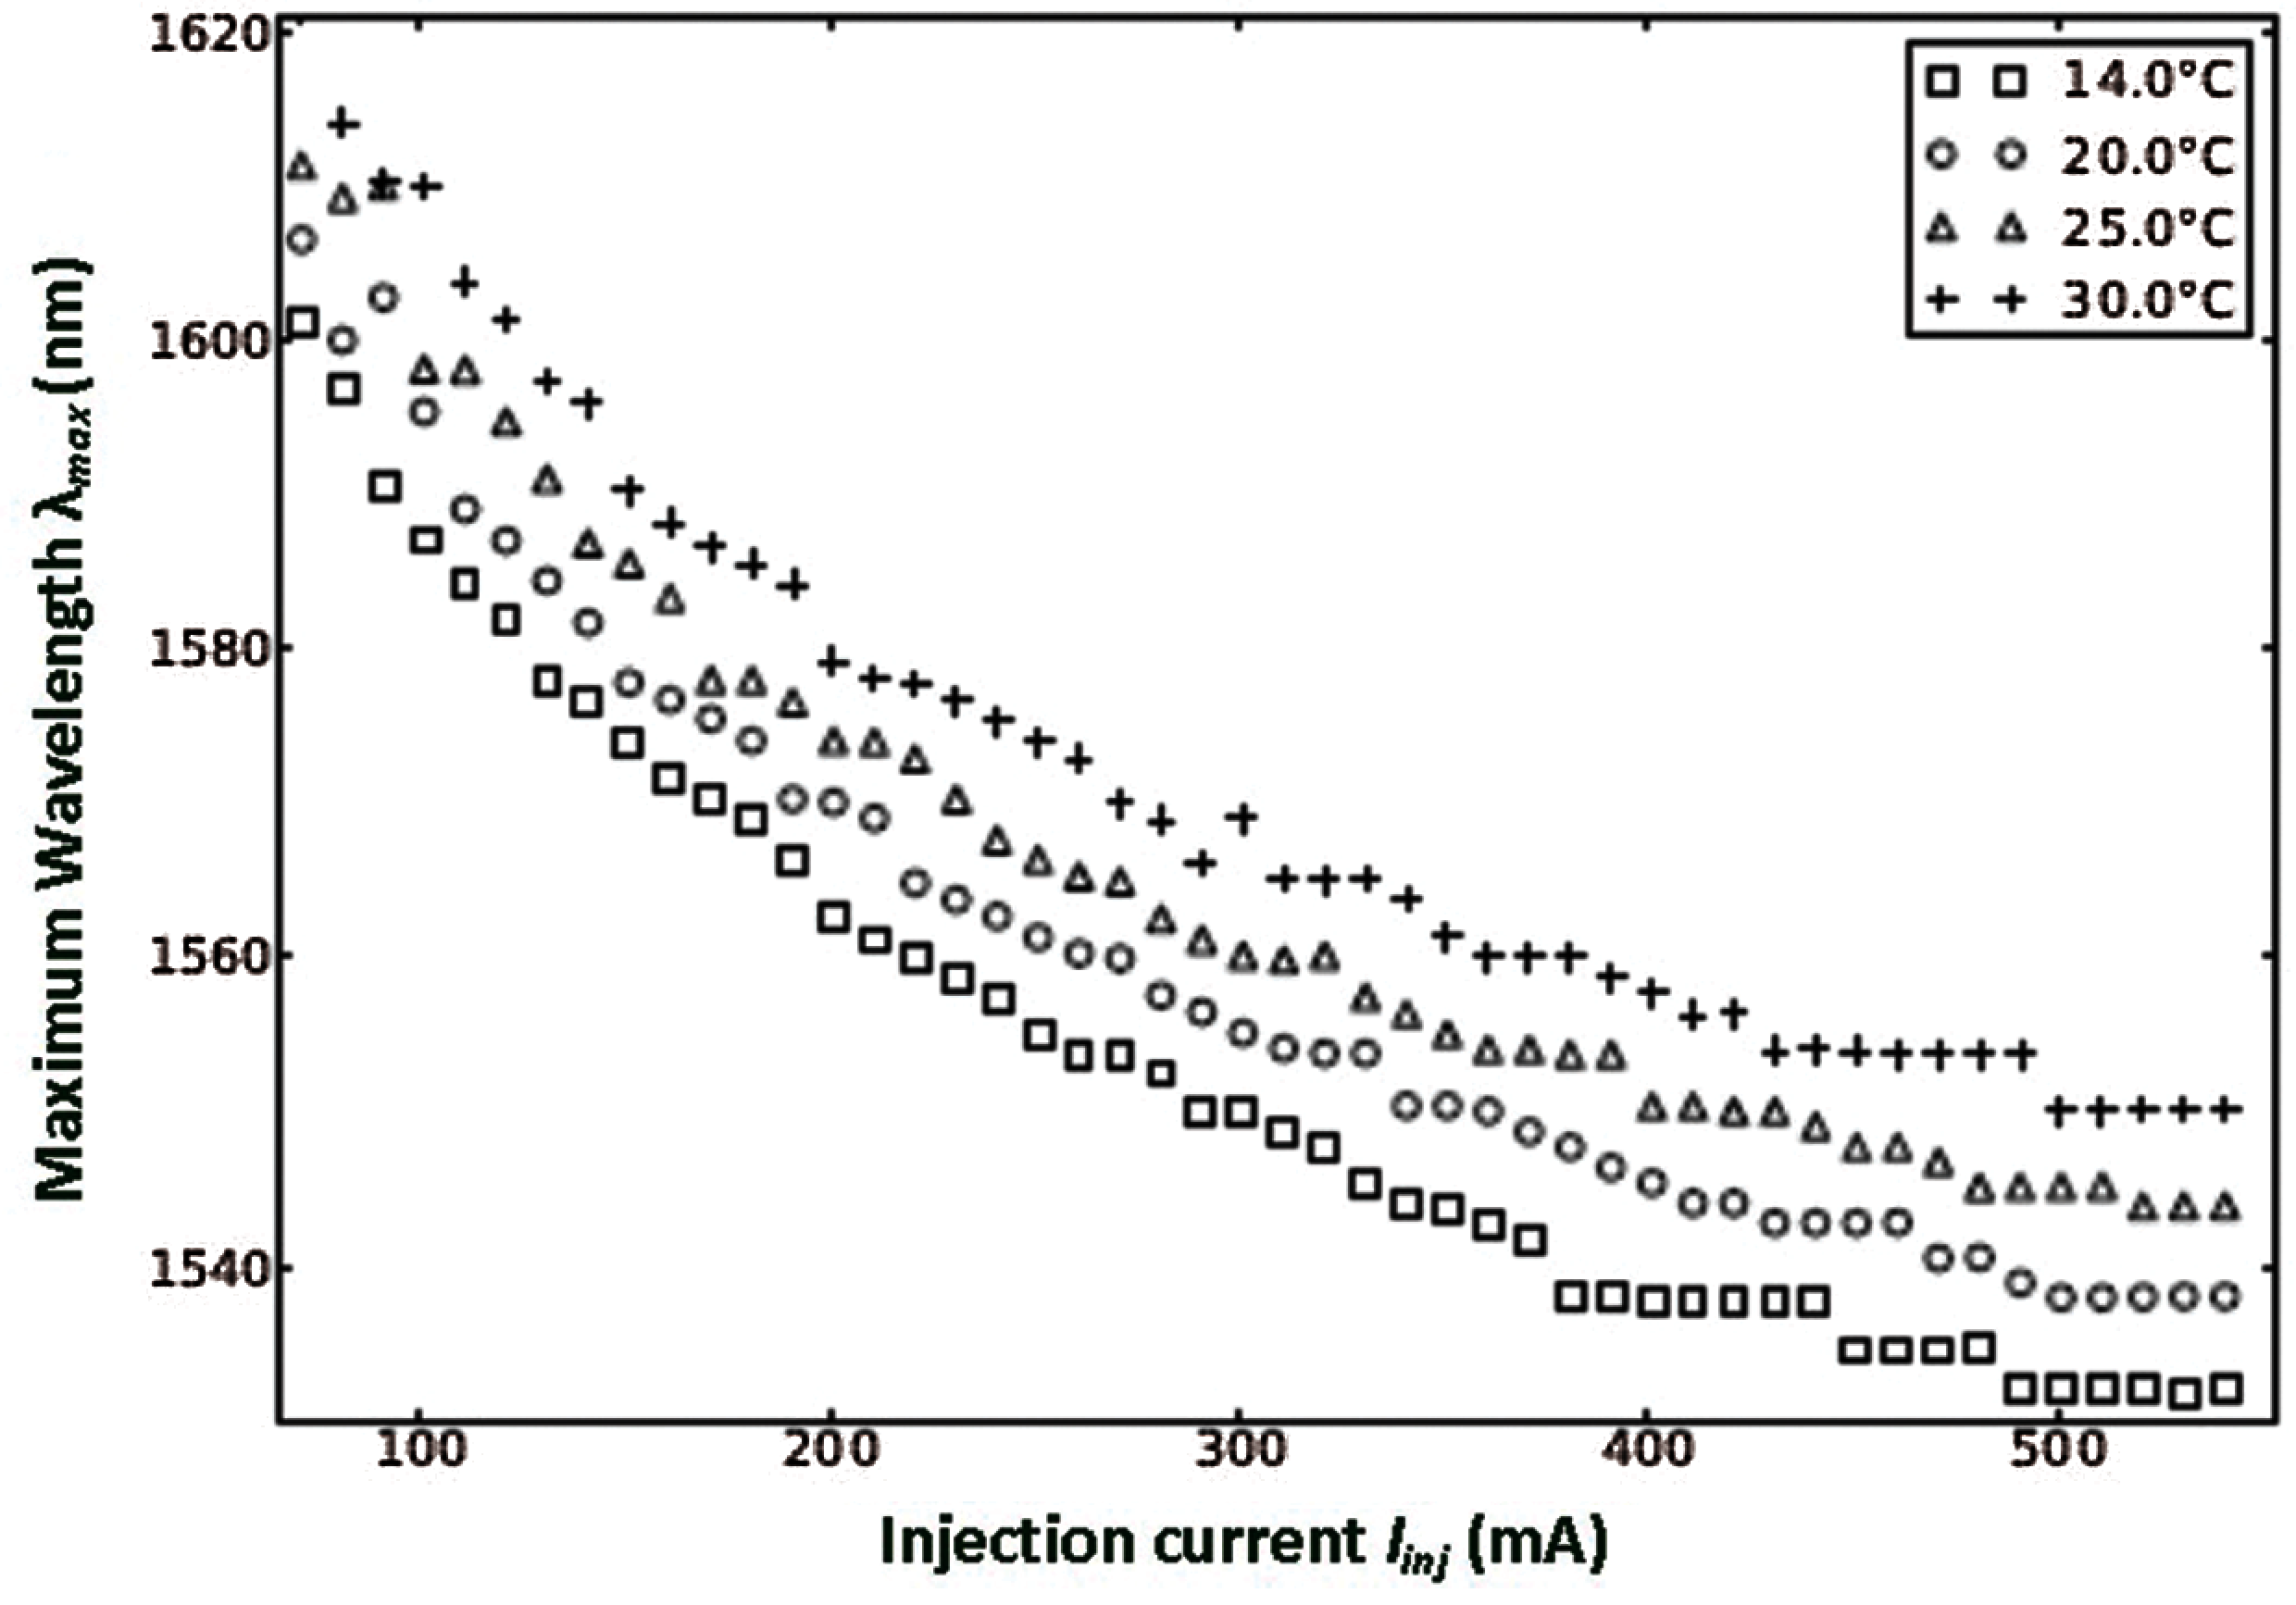
Figure 2: Comparison of the maximum wavelength

Figure 3: Behaviour of the maximum wavelength with the pumping current, matched by pseudo-Voigt function spectra. The gray area denotes the working area of the SOA. At an operating temperature of 20°C we have a change in the maximum wavelength of about 1 nm
The dependence of the temperature on the wavelength is shown in Fig. 4. The maximum wavelength
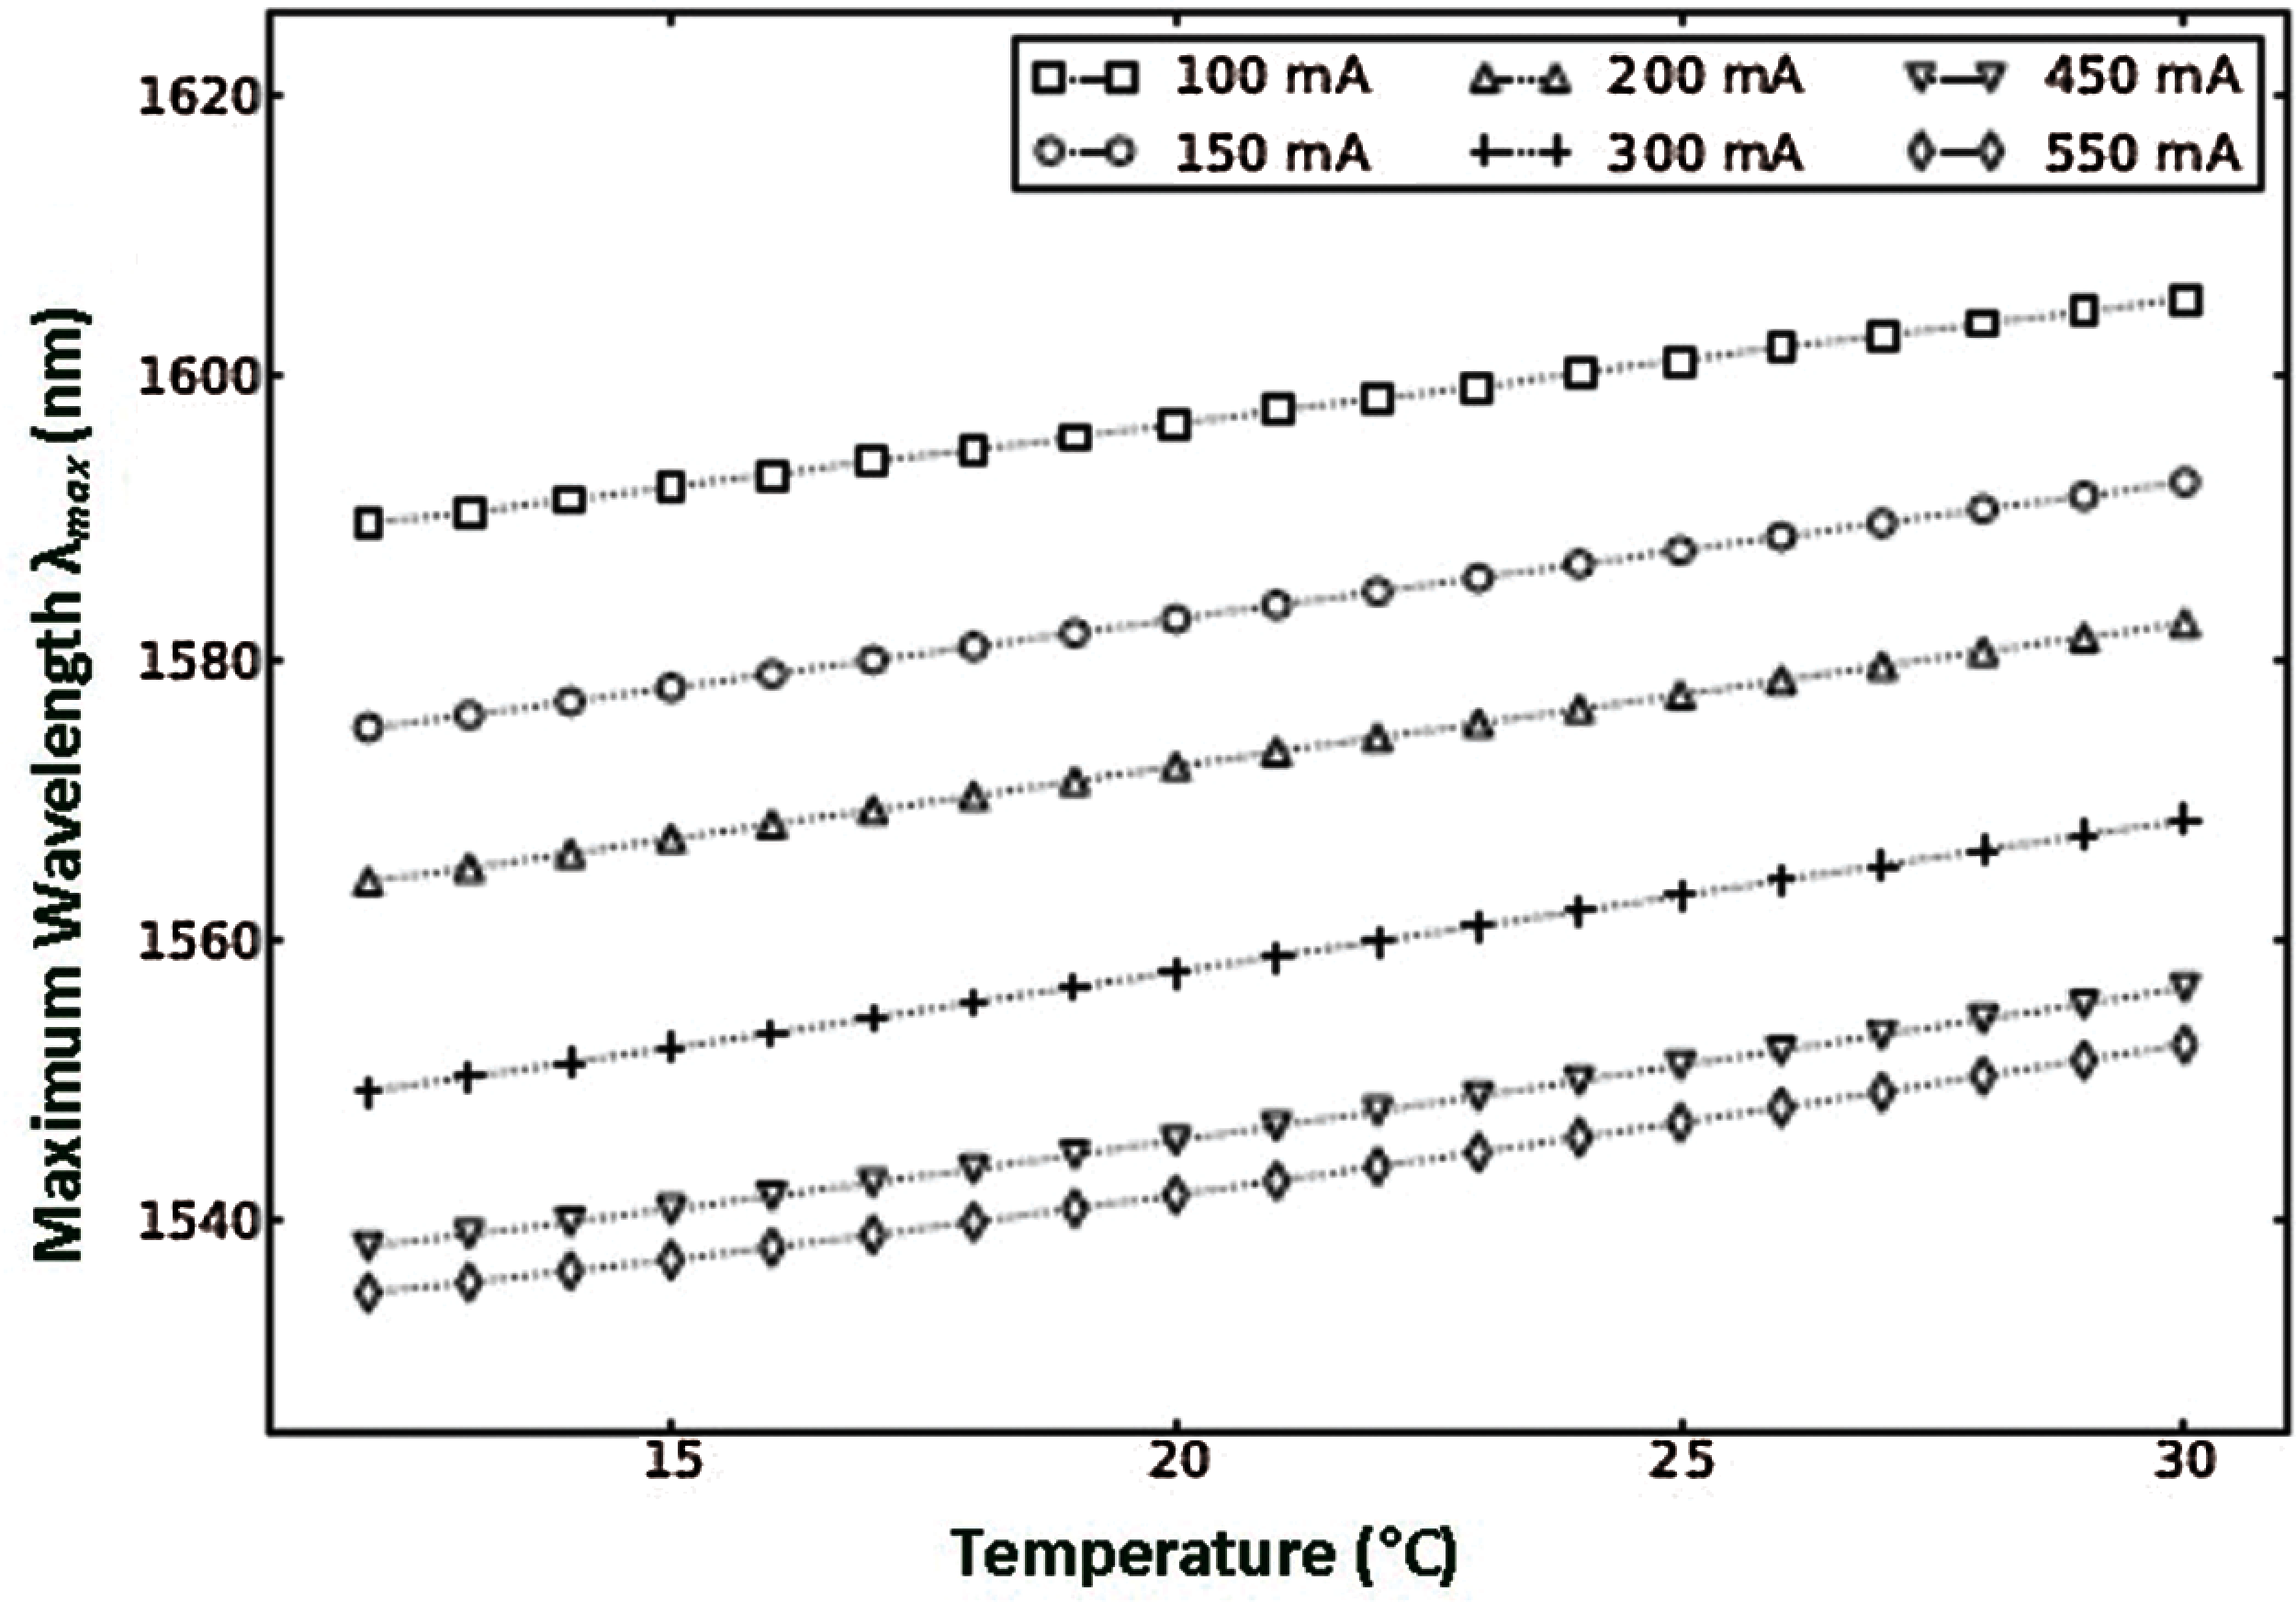
Figure 4: Behavior of the maximum wavelengths with respect to the temperature, matched by the pseudo-Voigt function spectra
The physical effects that are responsible for the blue-and red-shifts in an SOA, would exceed the theoretical framework of this work and are therefore not pursued further here. Instead, these phenomena are in accordance with the red shift [44] and blue shift [6,41,45–47] investigated earlier.
Much more important are the gradients of the red and blue shifts. These minor drifts can significantly affect the stability of the control loop at a later stage and must be brought into information [48,49].
Thus it can be stated at this level that a shift in the temperature at an operating point has significantly greater impact on the intensity than a drift of the pumping current at the same operating point. It is now imperative with this information and algorithm to do a frequency dependent calibration of the system.
4 Calibration Results and Discussion
The determination of the frequency response of optical receiver noise is very important in order to validate RIN calculation of different lasers. For this purpose, we use the setup presented in Fig. 5. The optical output from the laser system VCi is going into the attenuator which is fed into the optical receiver. The receiver consists of a PIN-Photodiode (PIN-PD), a Bias-Tee and a Low Noise Amplifier (LNA). The PIN-PD collects the light from the laser diode. The incoming PD signal has DC and AC components. The former is directly proportional to the average optical power input to the photodiode. On the contrary, the noise components from the PD and LDC comprise the AC counterpart. The Bias Tee (filtering abilities), separates the DC from AC, which is found by the digital multimeter having a low input impedance. As the strength of AC signal is not strong, LNA intensifies it and adds noise inherently, whose intensity is straight away dependent on the amplifier's noise figure. In this way, this value of noise is obtained at the ESA. One output from the receiver goes to the Electronic Spectrum Analyzer (ESA) (from the LNA terminal), and the other one goes to the Voltmeter (through the Bias-Tee terminal). The complete mathematical details and interpretation can be found in [17,48,49].
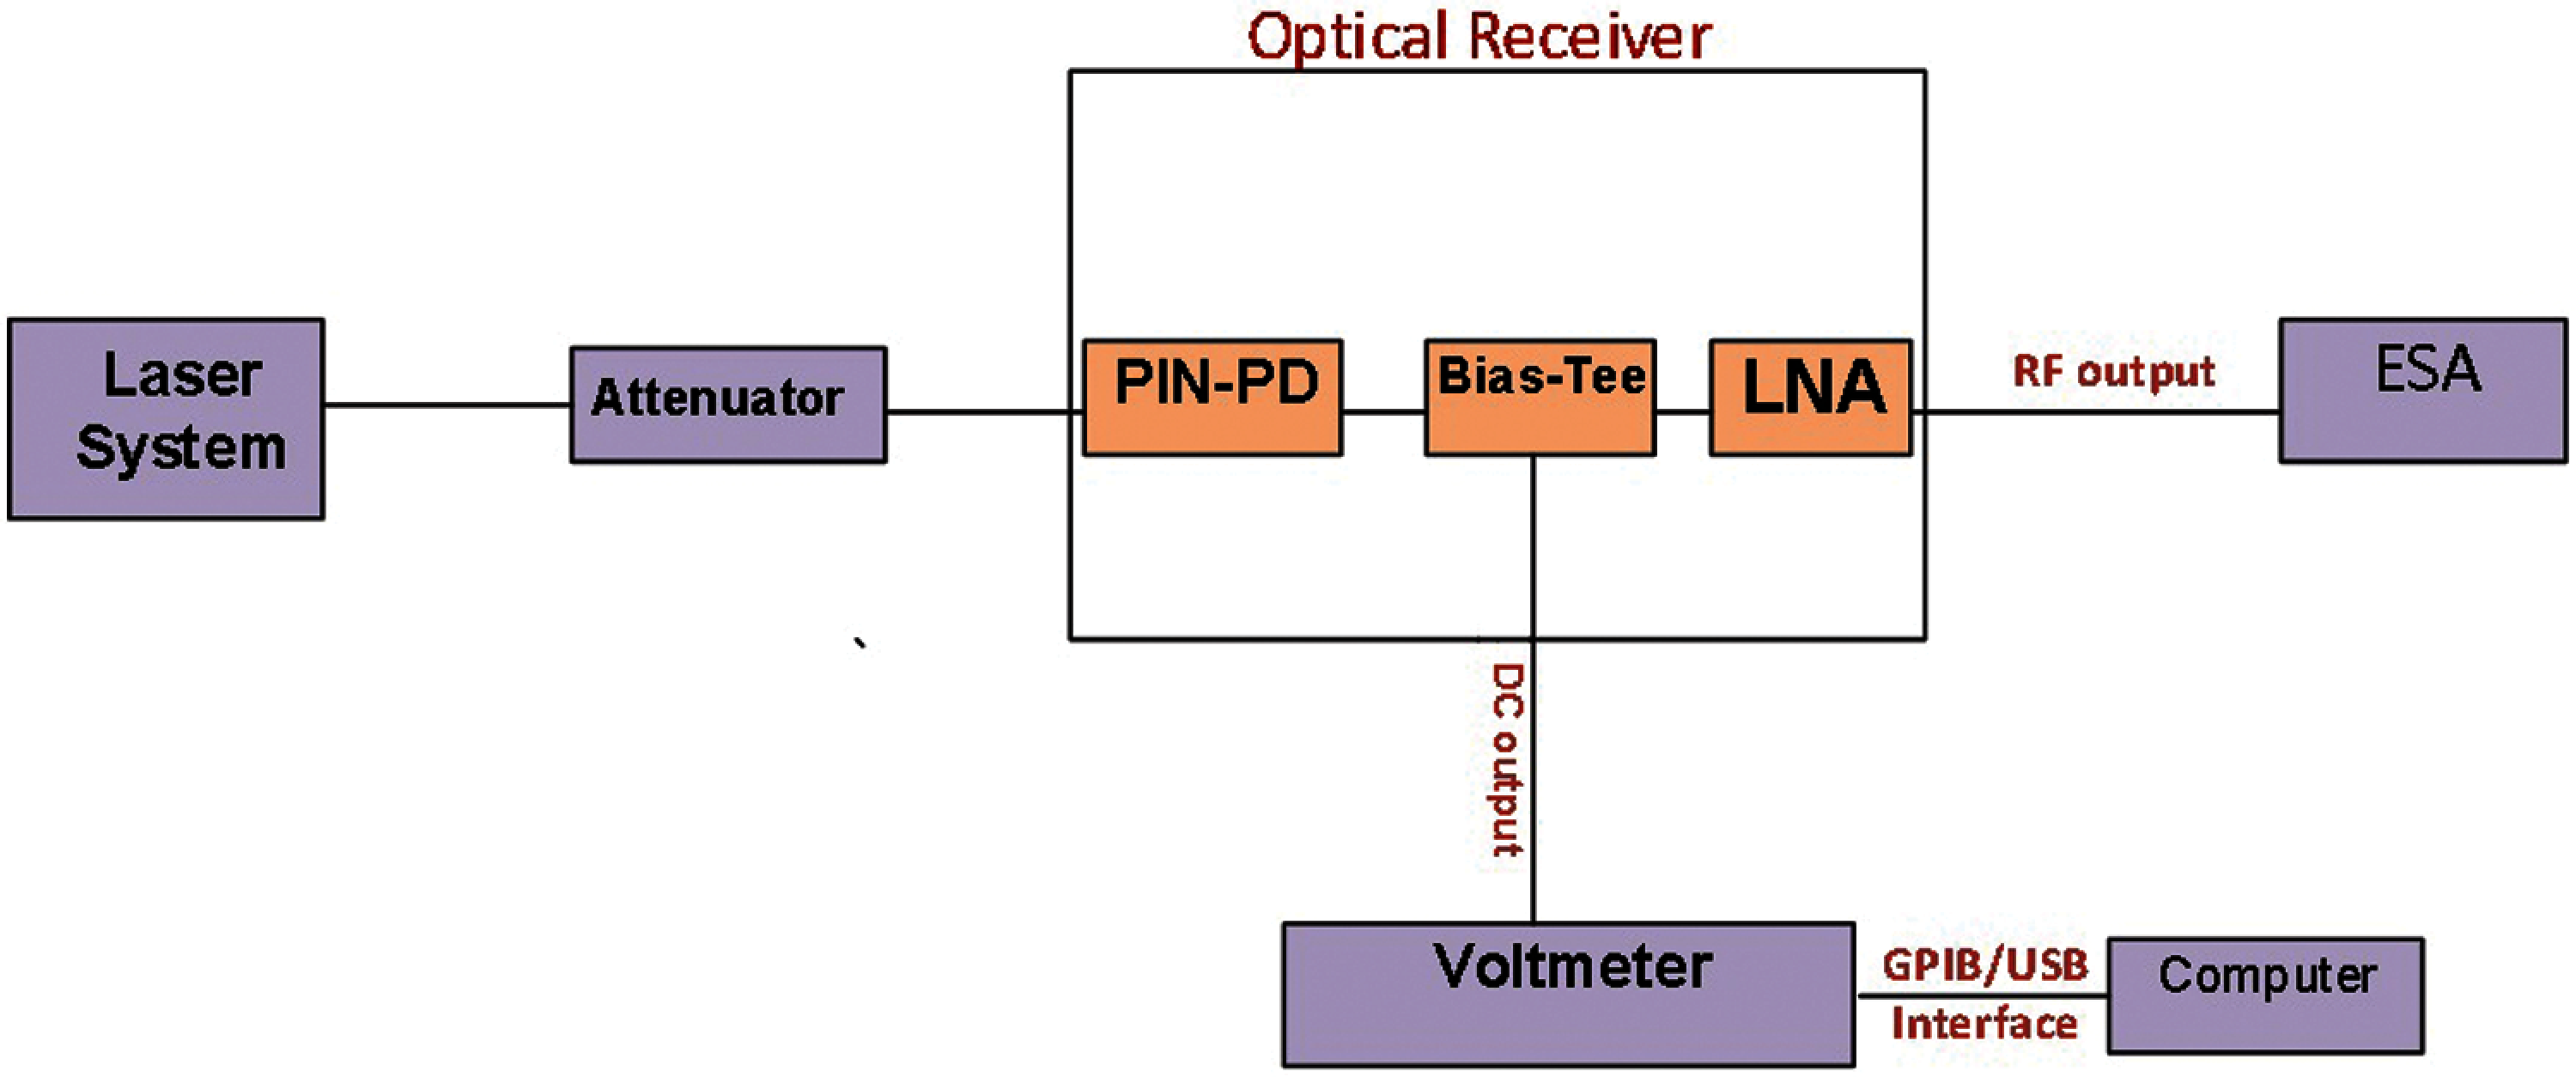
Figure 5: Setup for optical receiver characterization
In our work, we approach the system RIN into a Poisson or Shot noise component using a RIN standard expression for the frequency dependent calibration factor (
where,
4.1 Amplitude Analysis with Frequency
Fig. 6 shows the result of our measurement taken from ESA. The variation of the intensity noise in dBm for different values of attenuated power ranging from 80 to 200
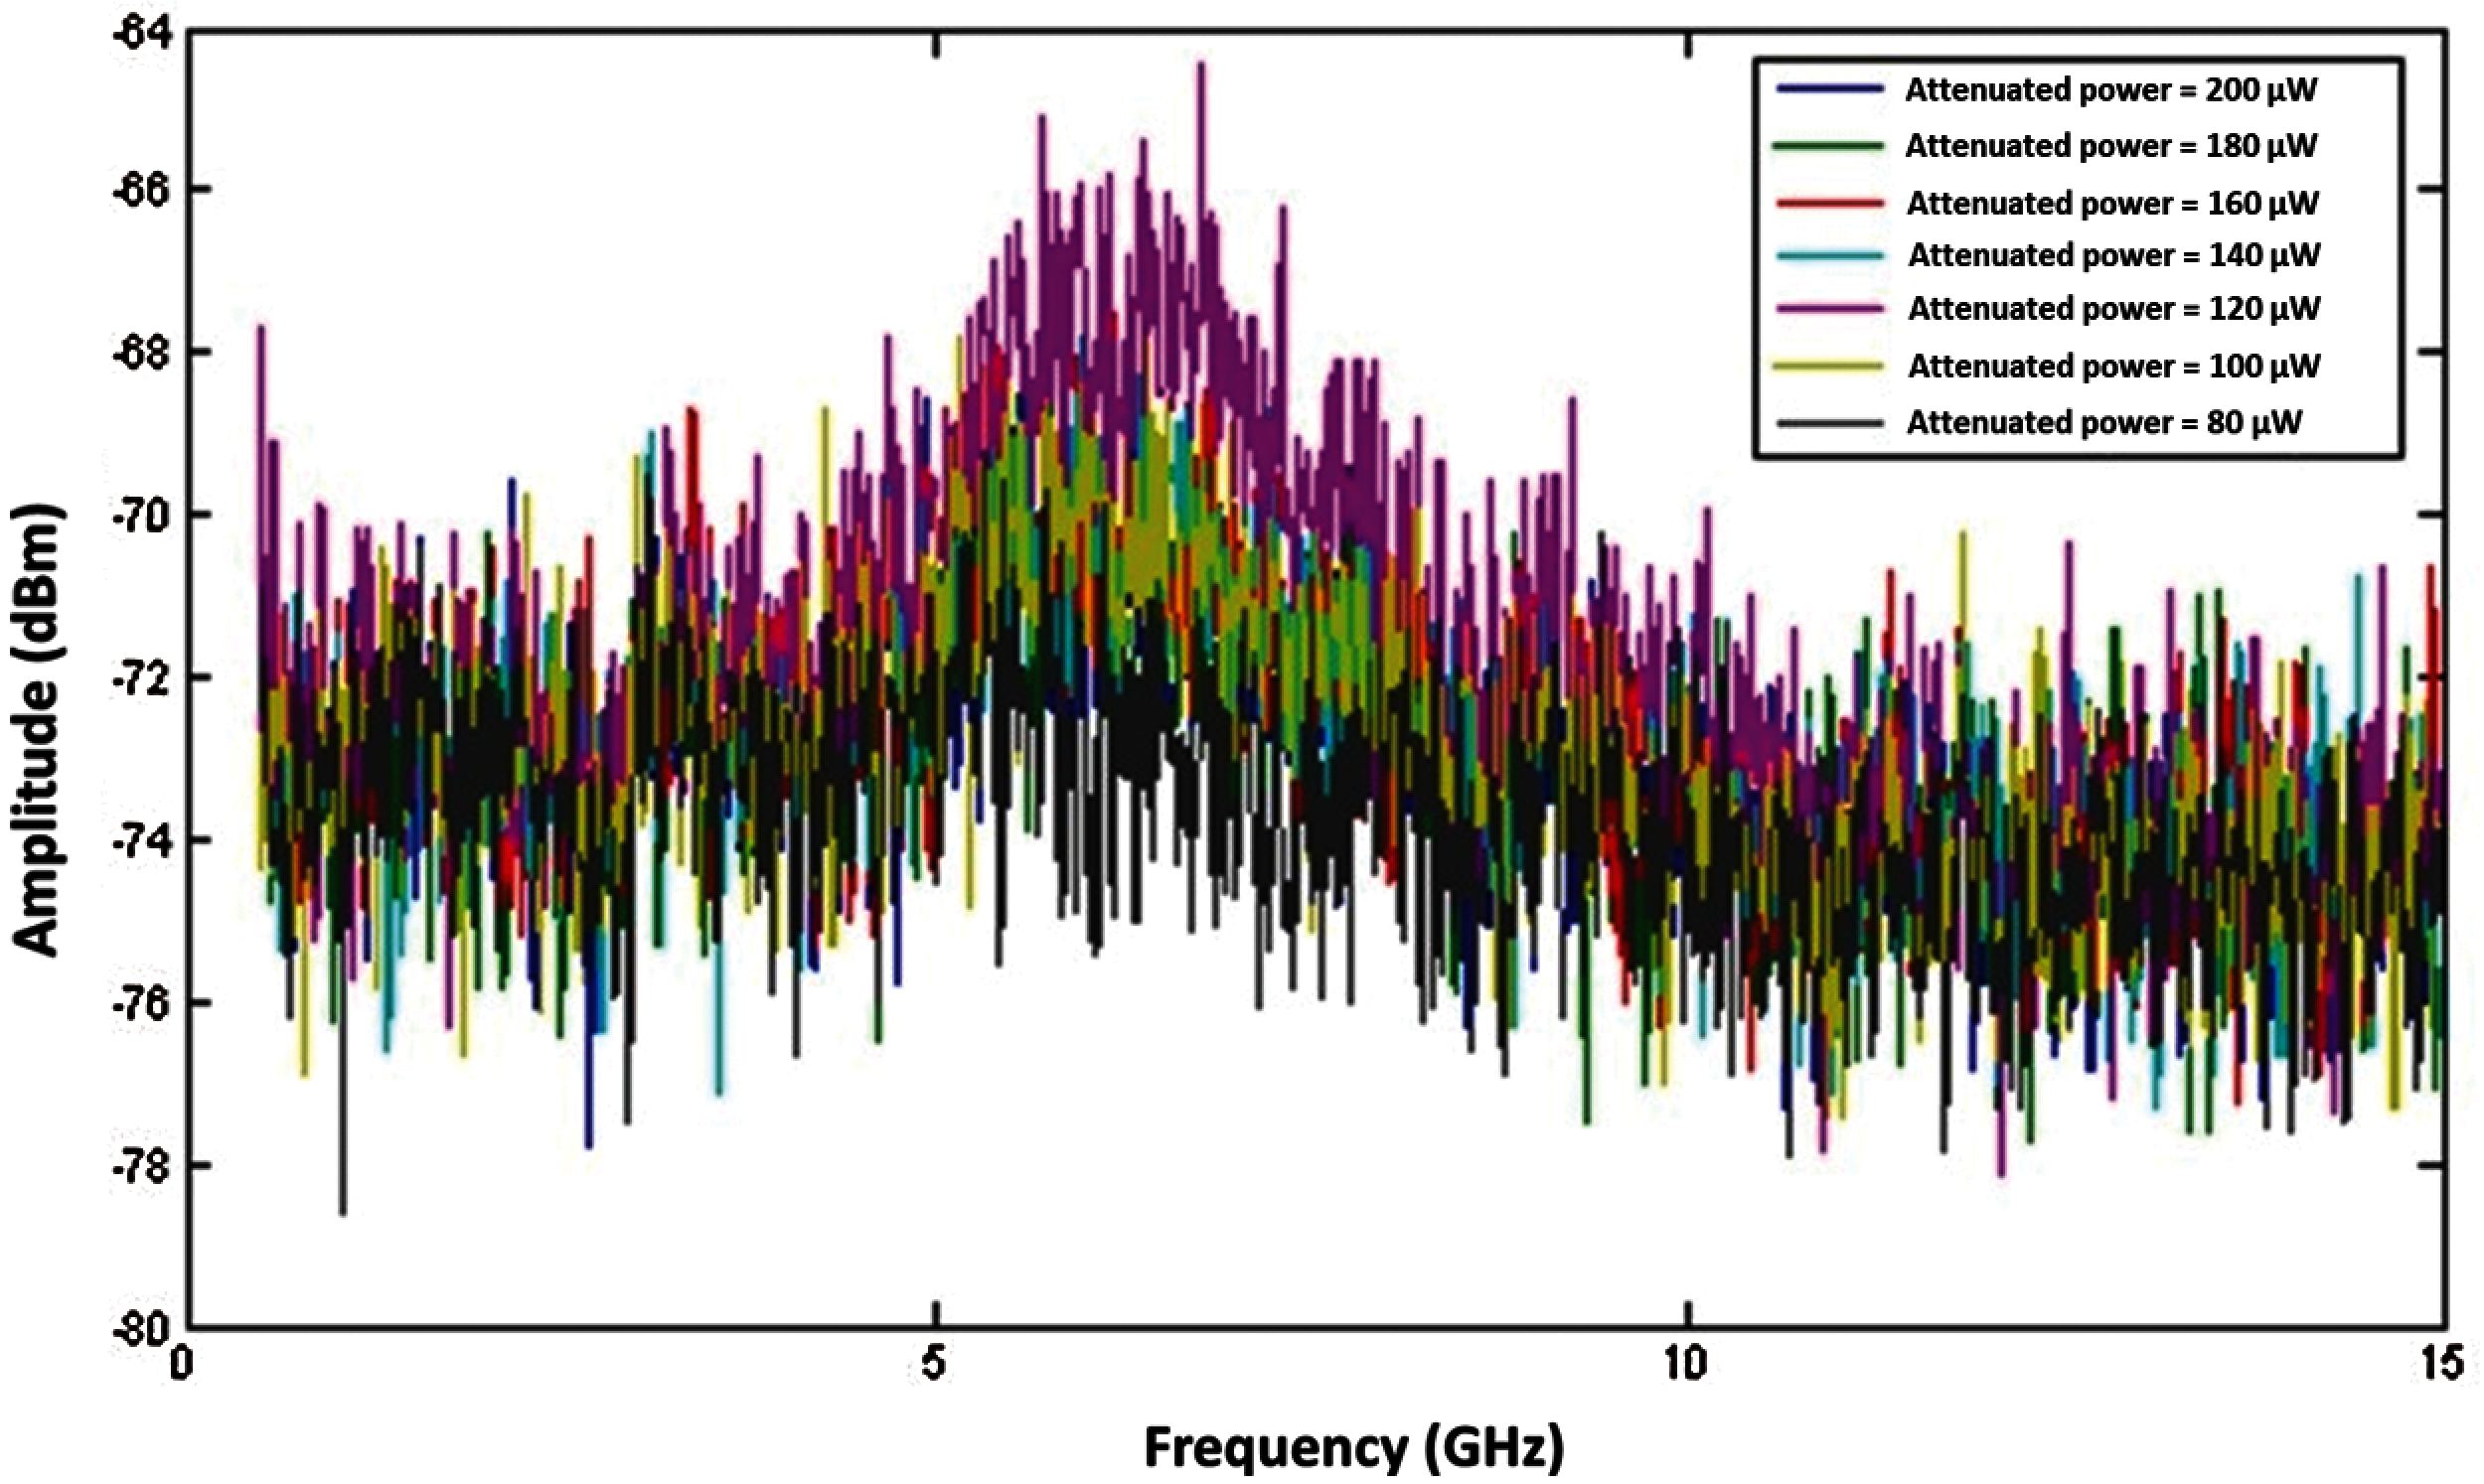
Figure 6: Amplitude vs. frequency at different attenuated powers
4.2 Variation of Calibration Factor
Fig. 7 shows a graph of the frequency dependent calibration function
Fig. 8 shows the
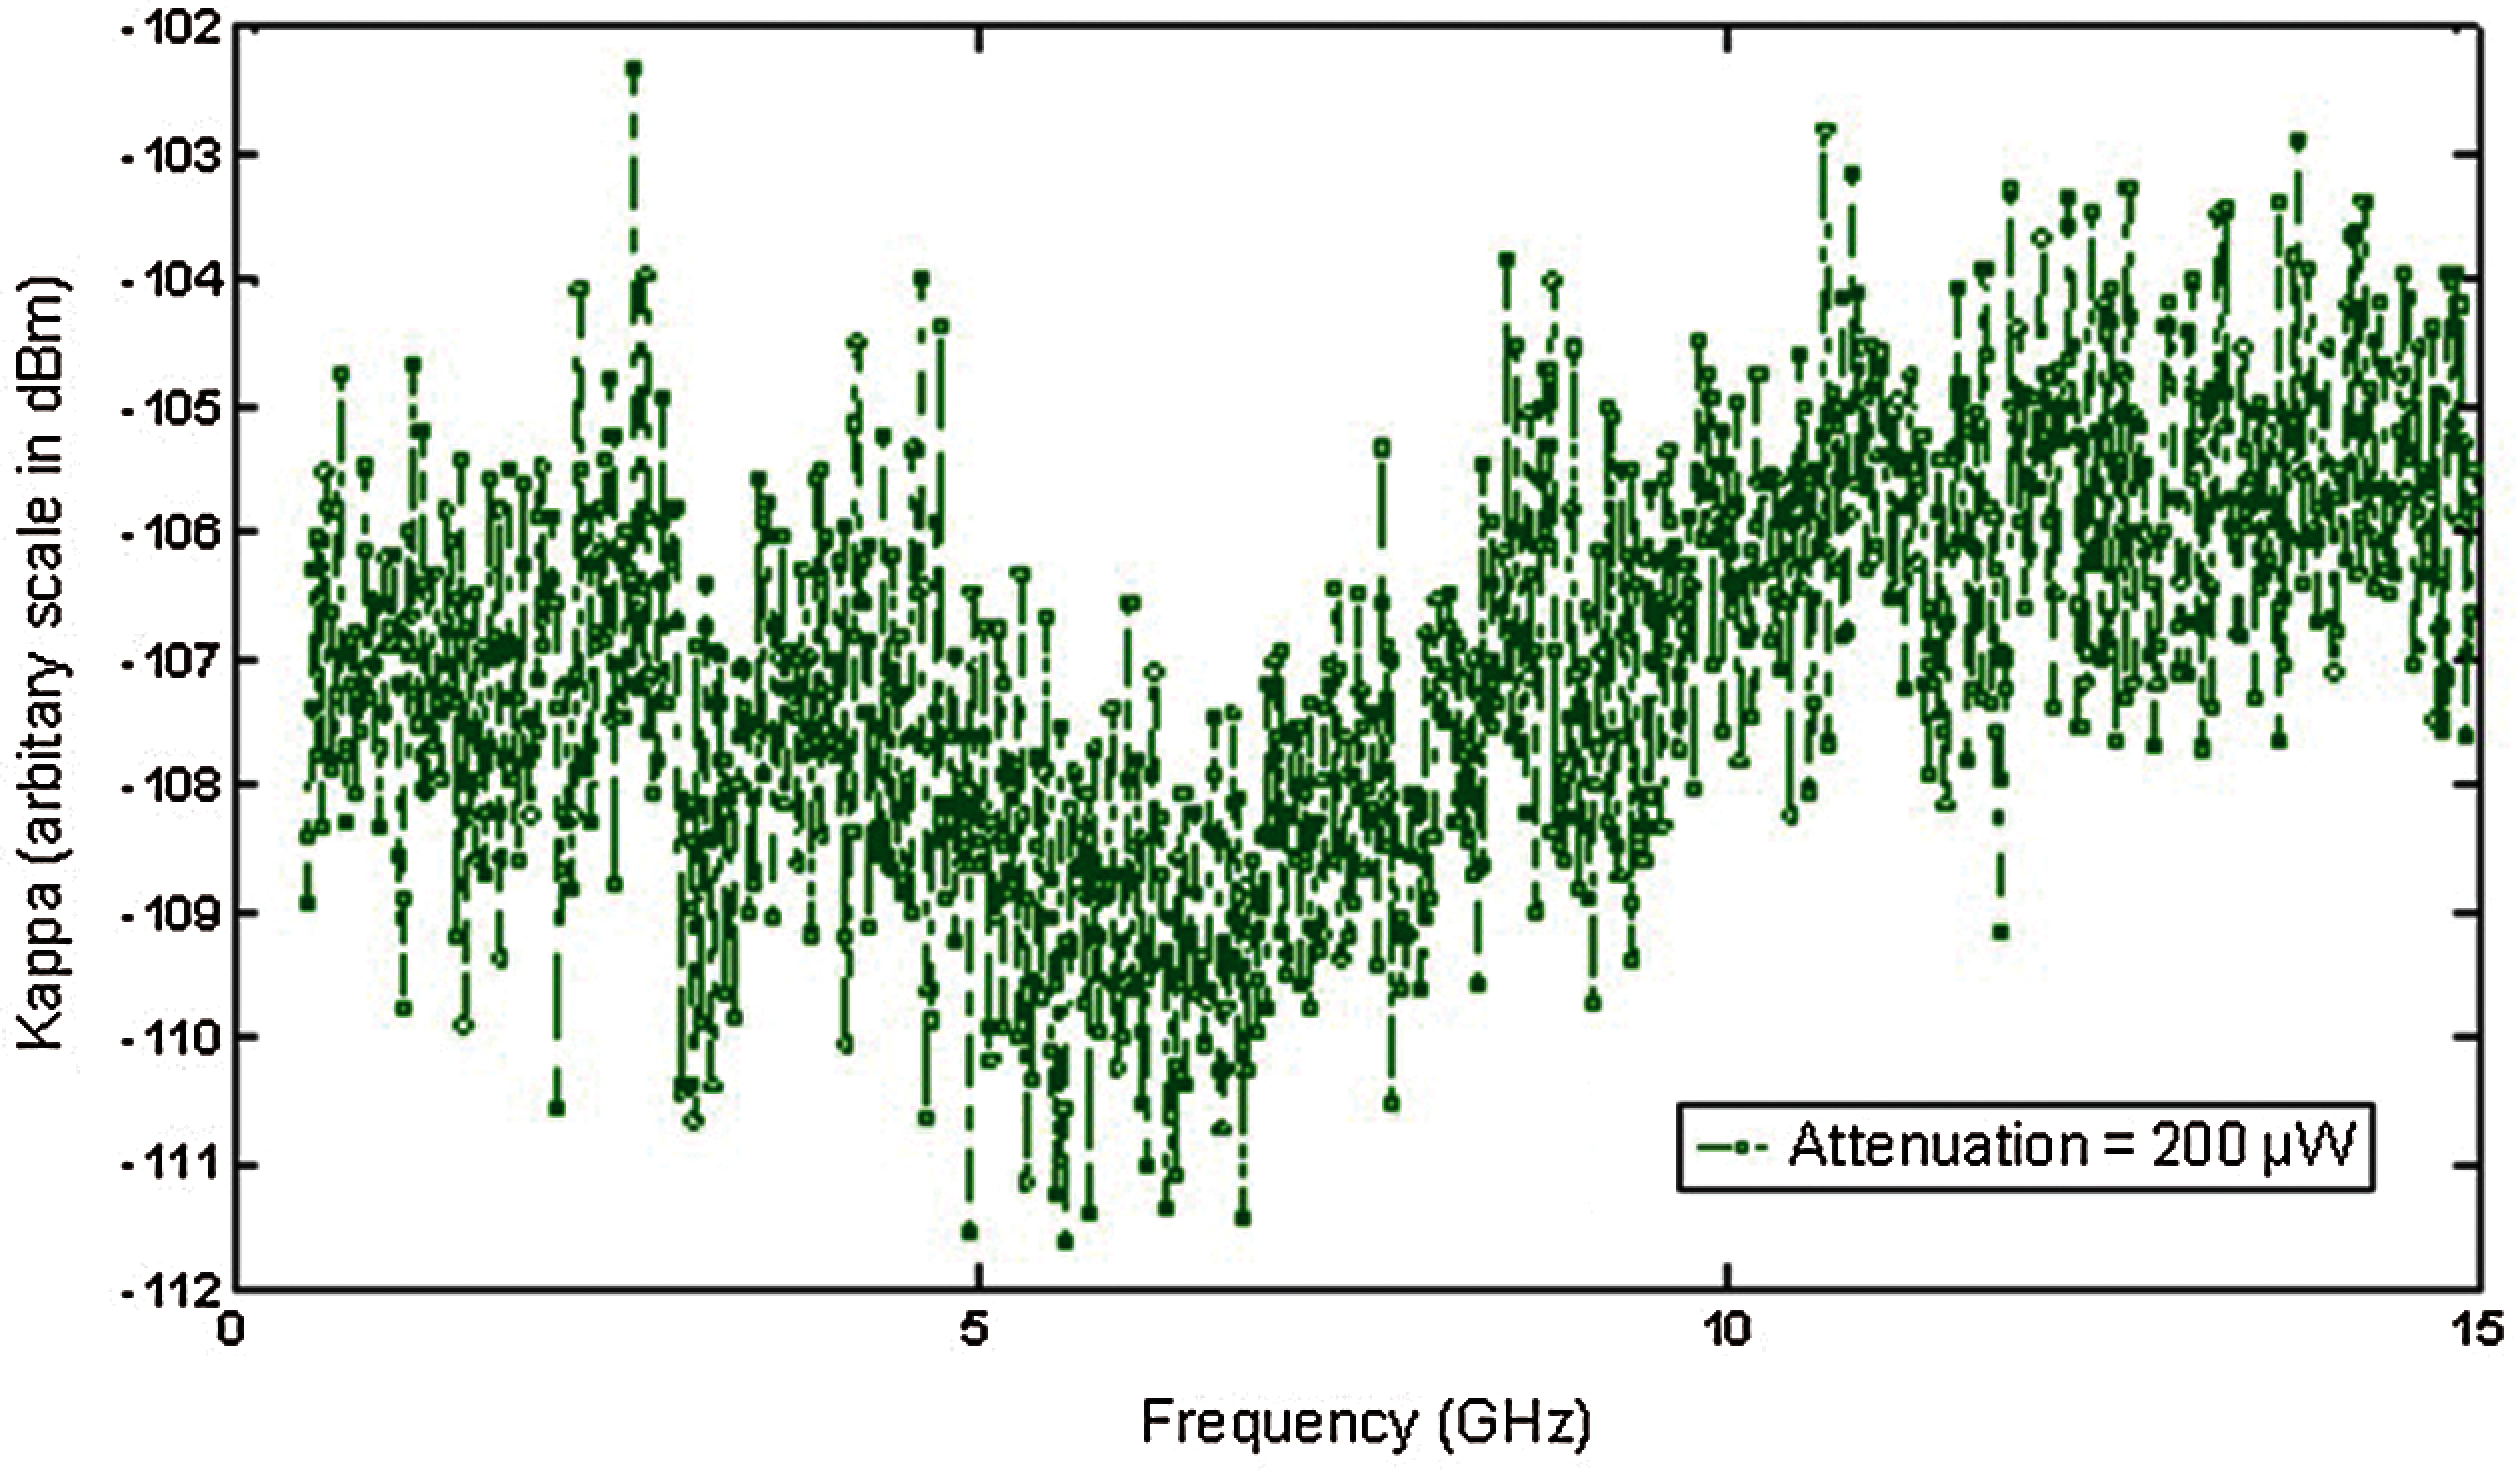
Figure 7: Calibration factor
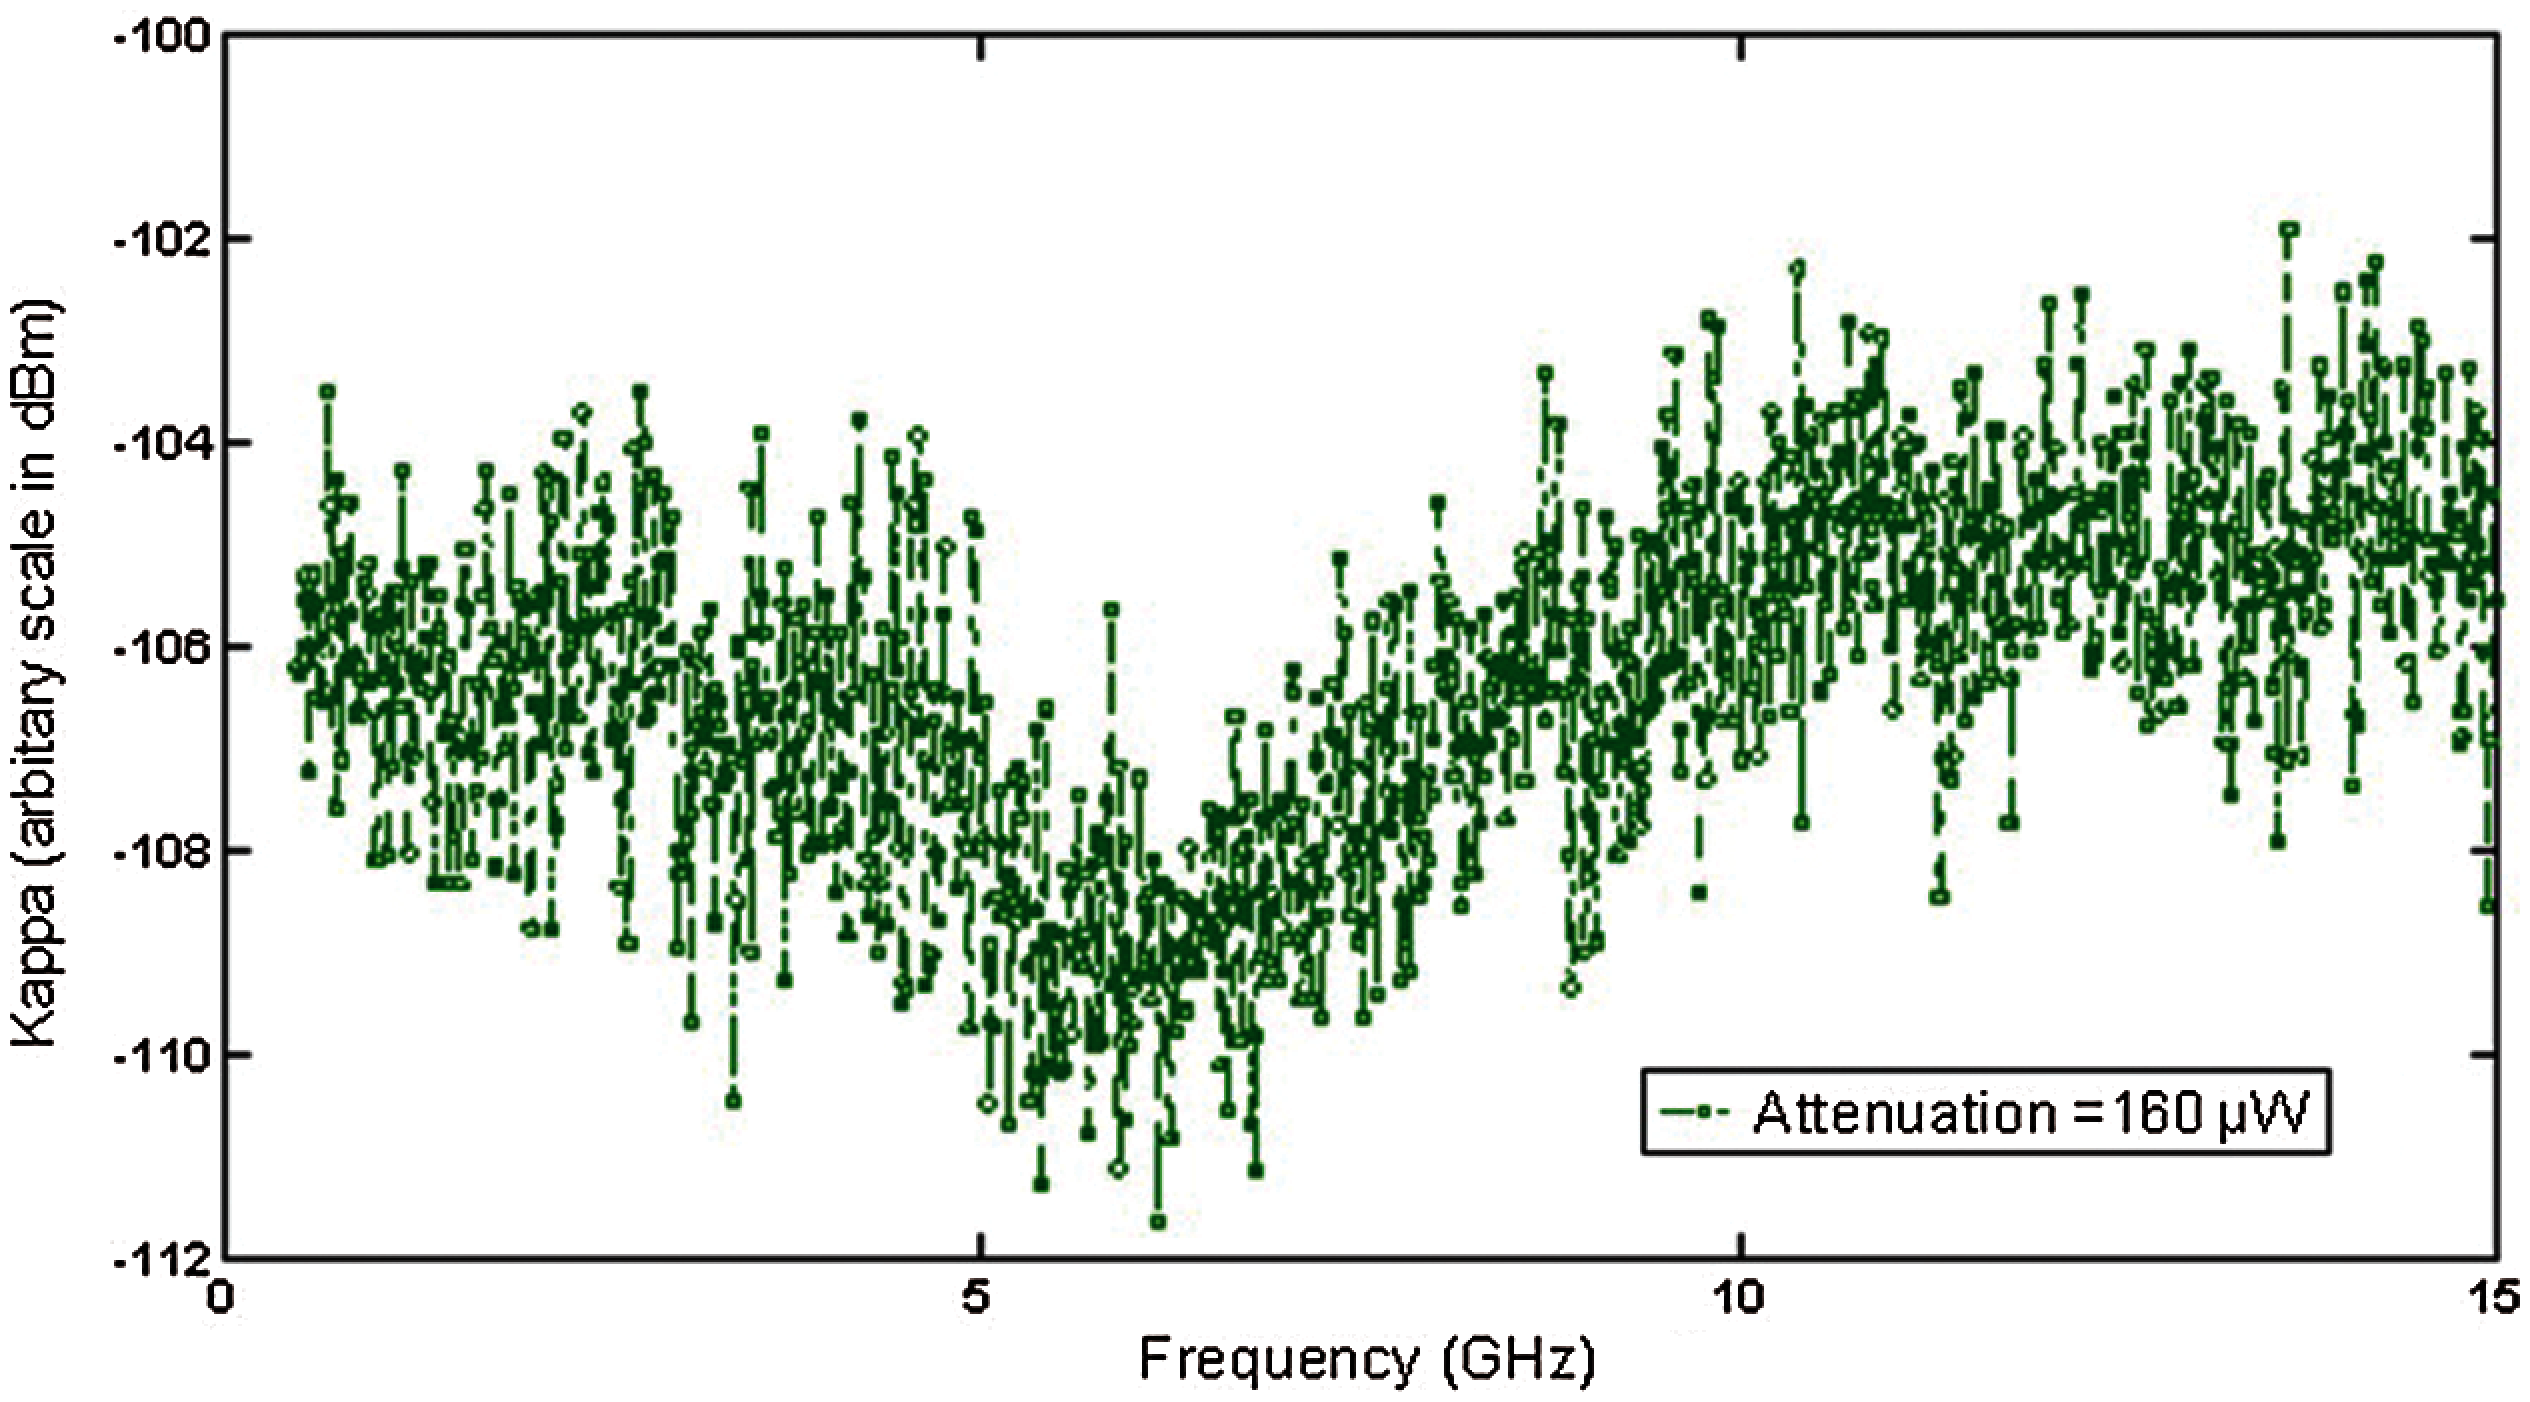
Figure 8: Calibration factor kappa
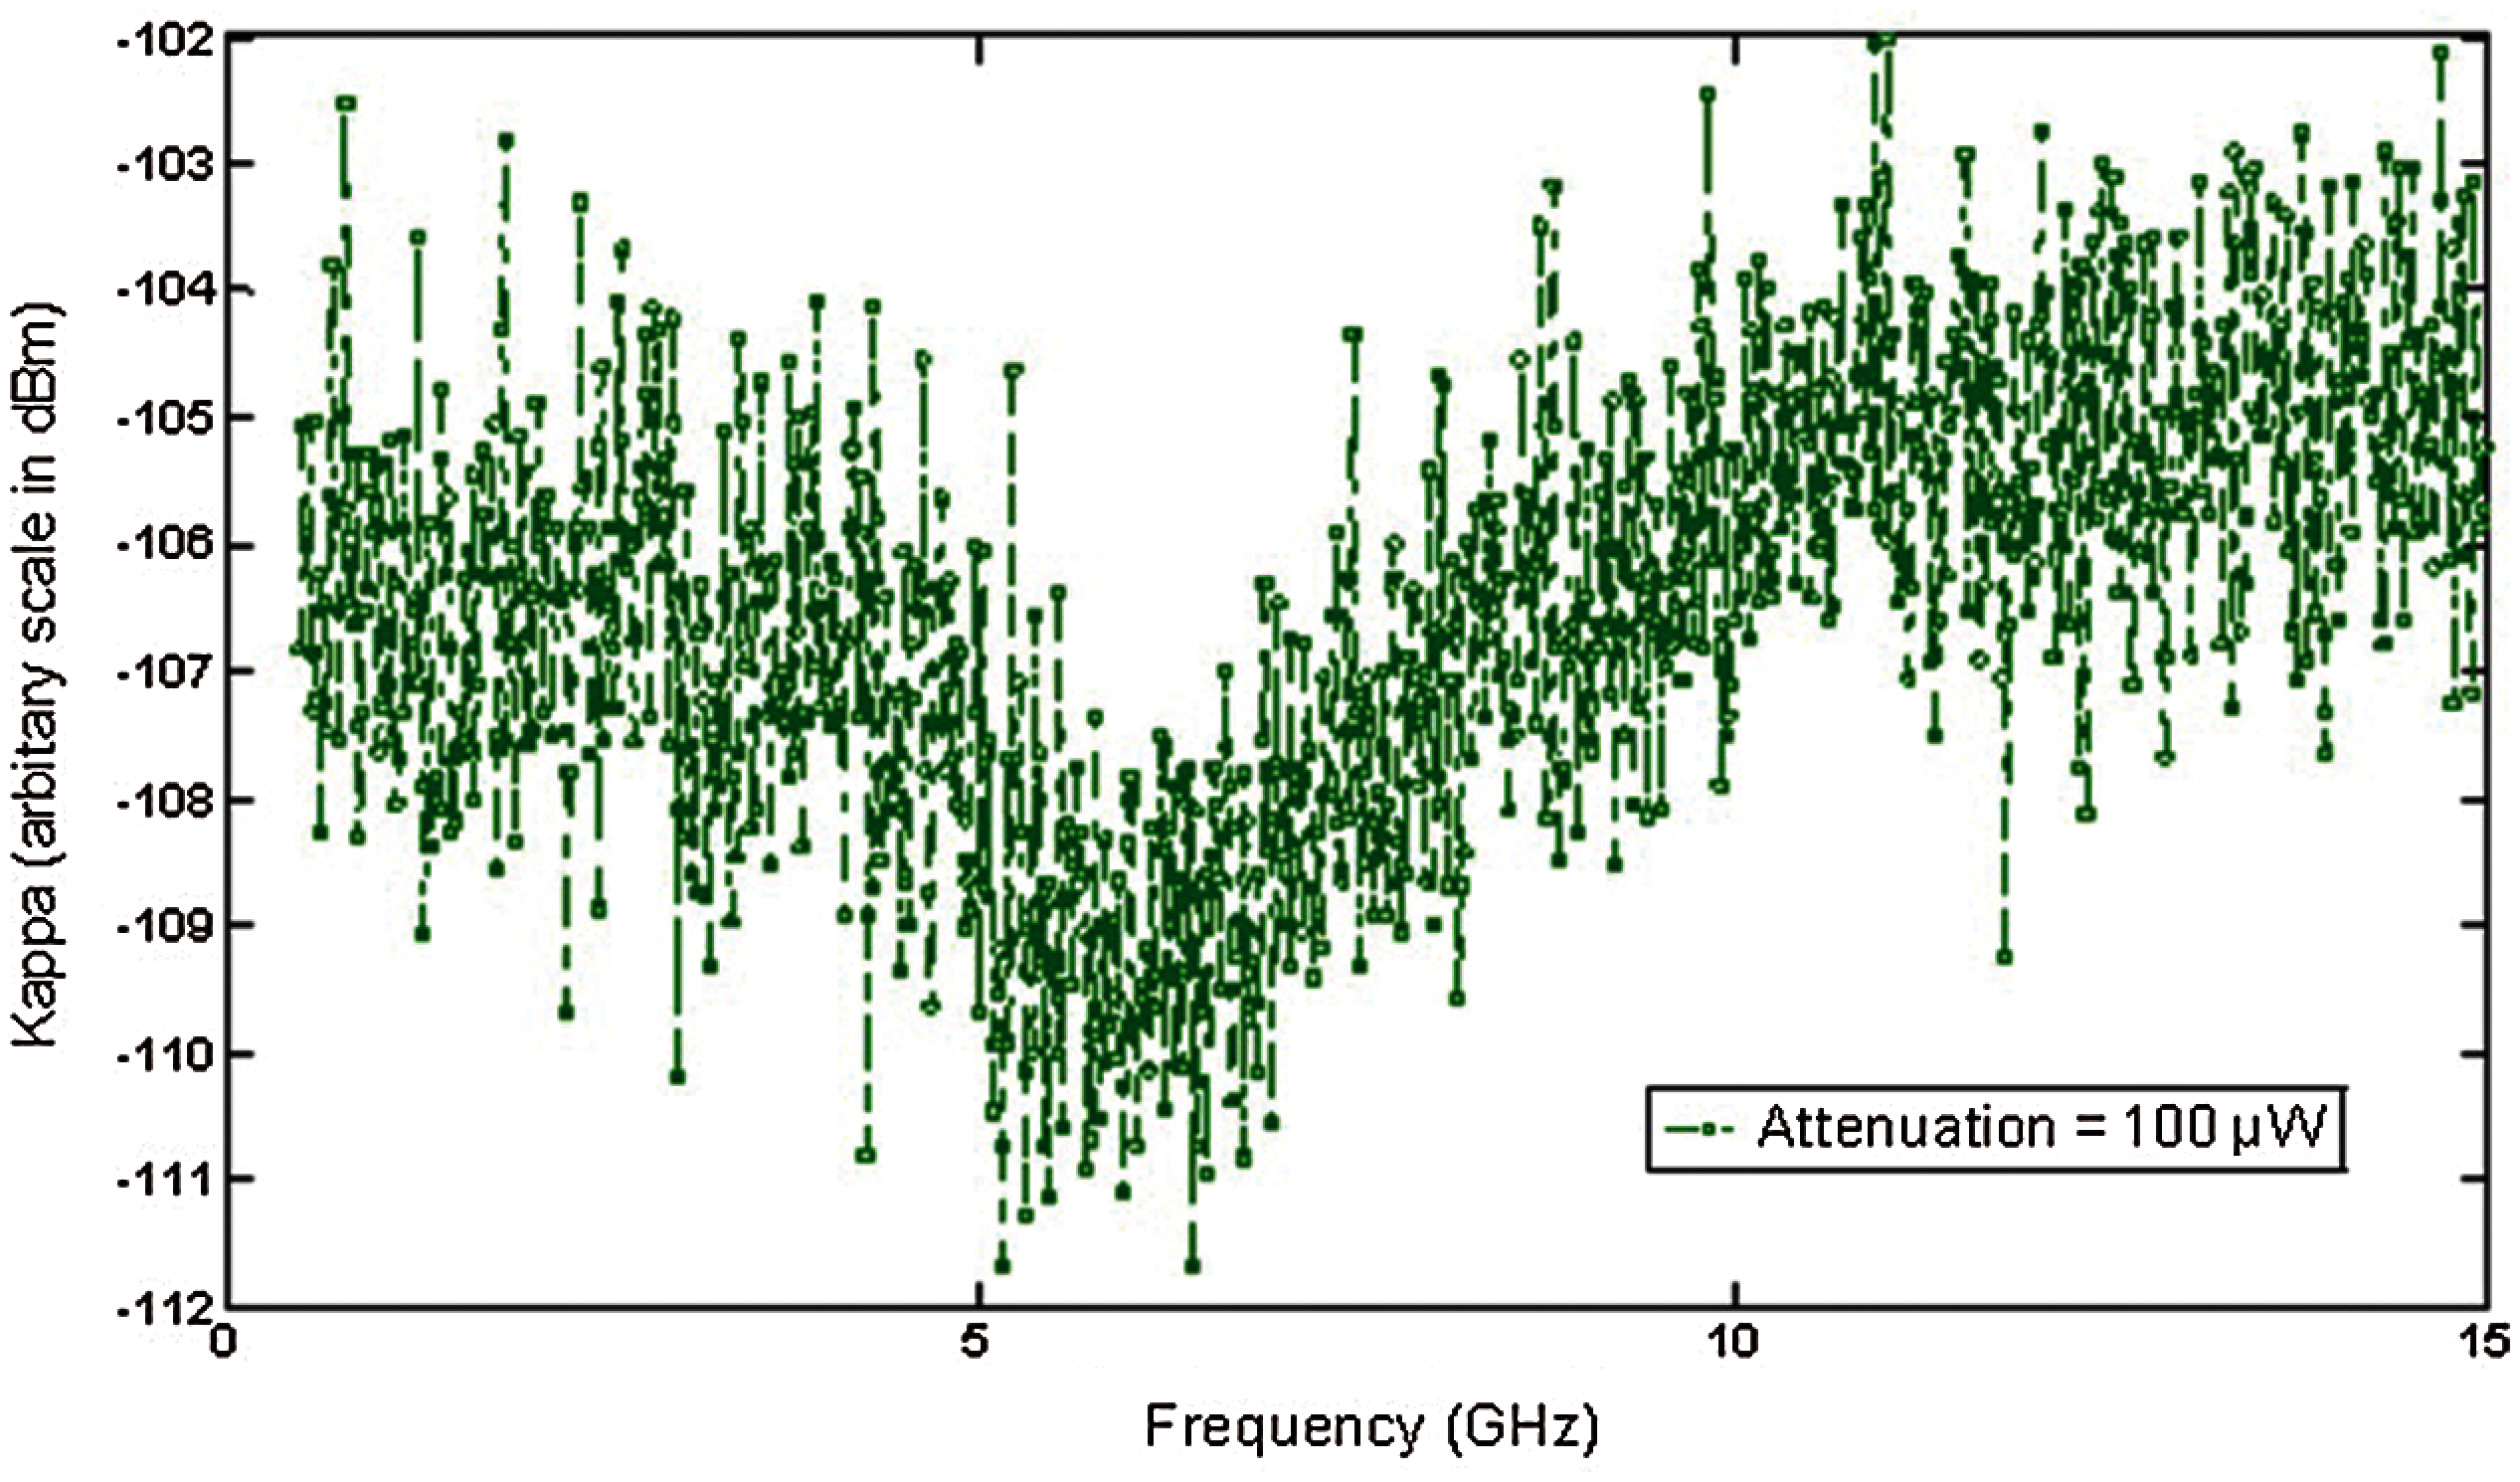
Figure 9: Calibration factor kappa
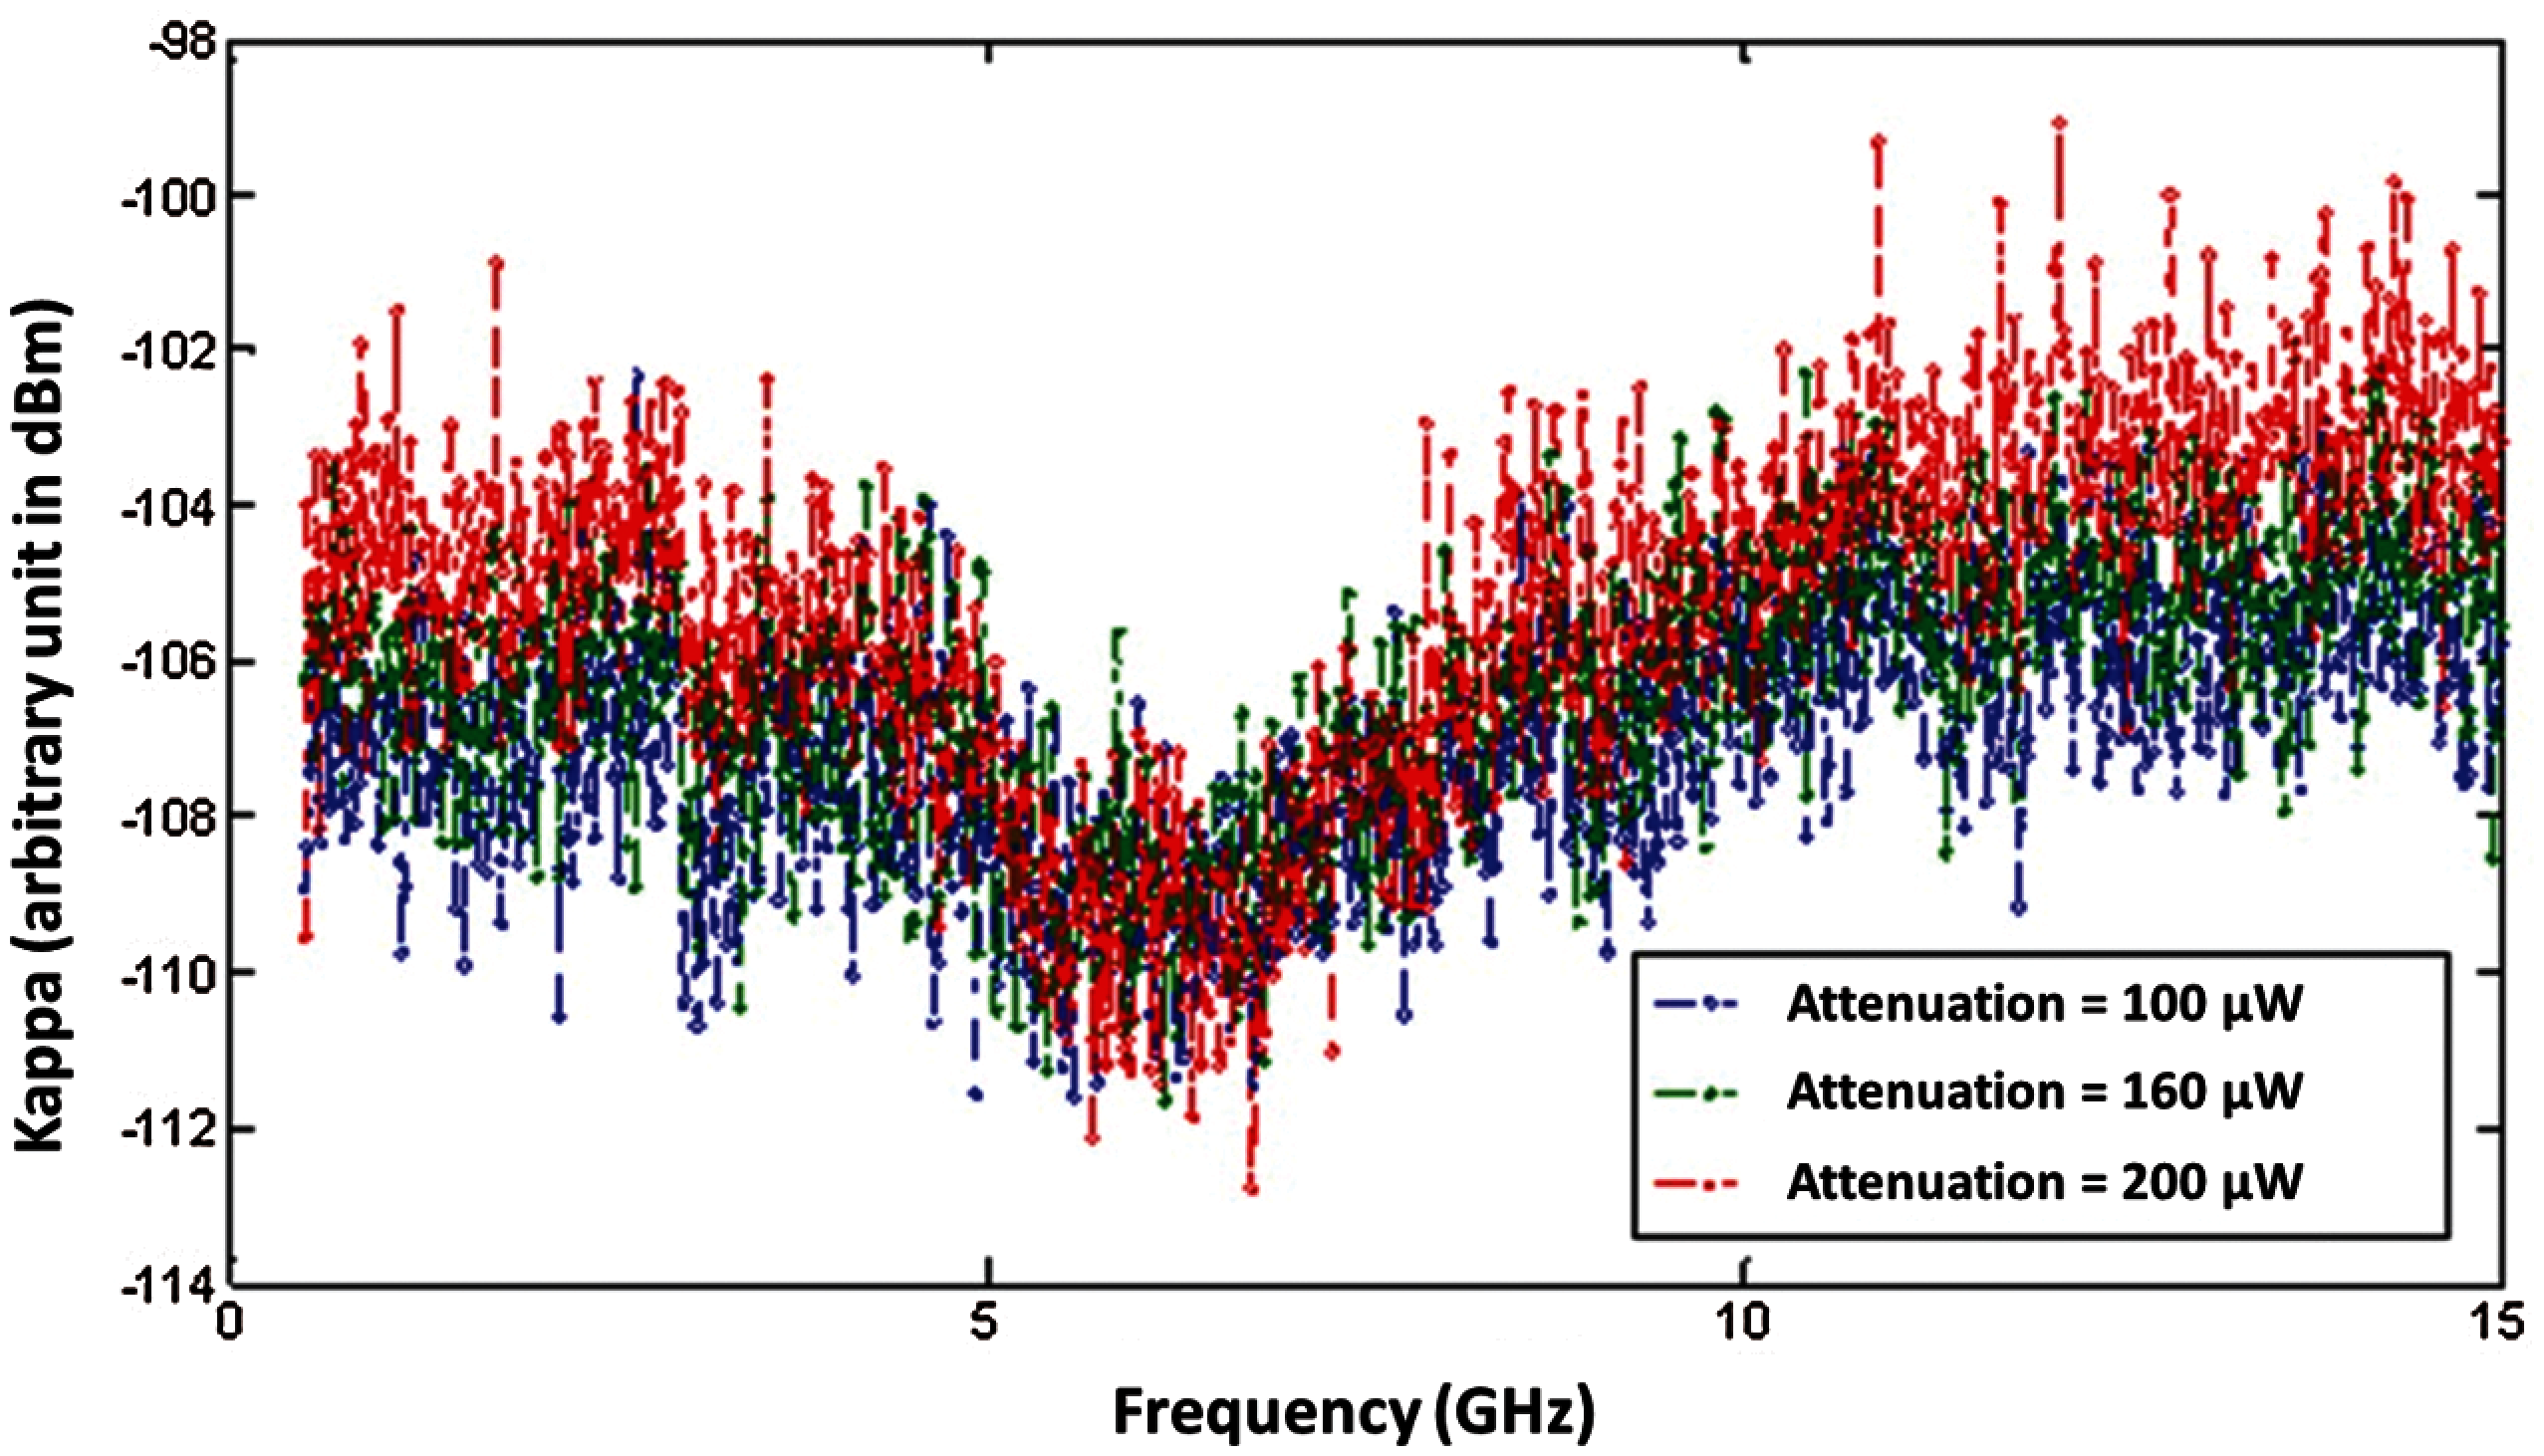
Figure 10: Calibration factor kappa
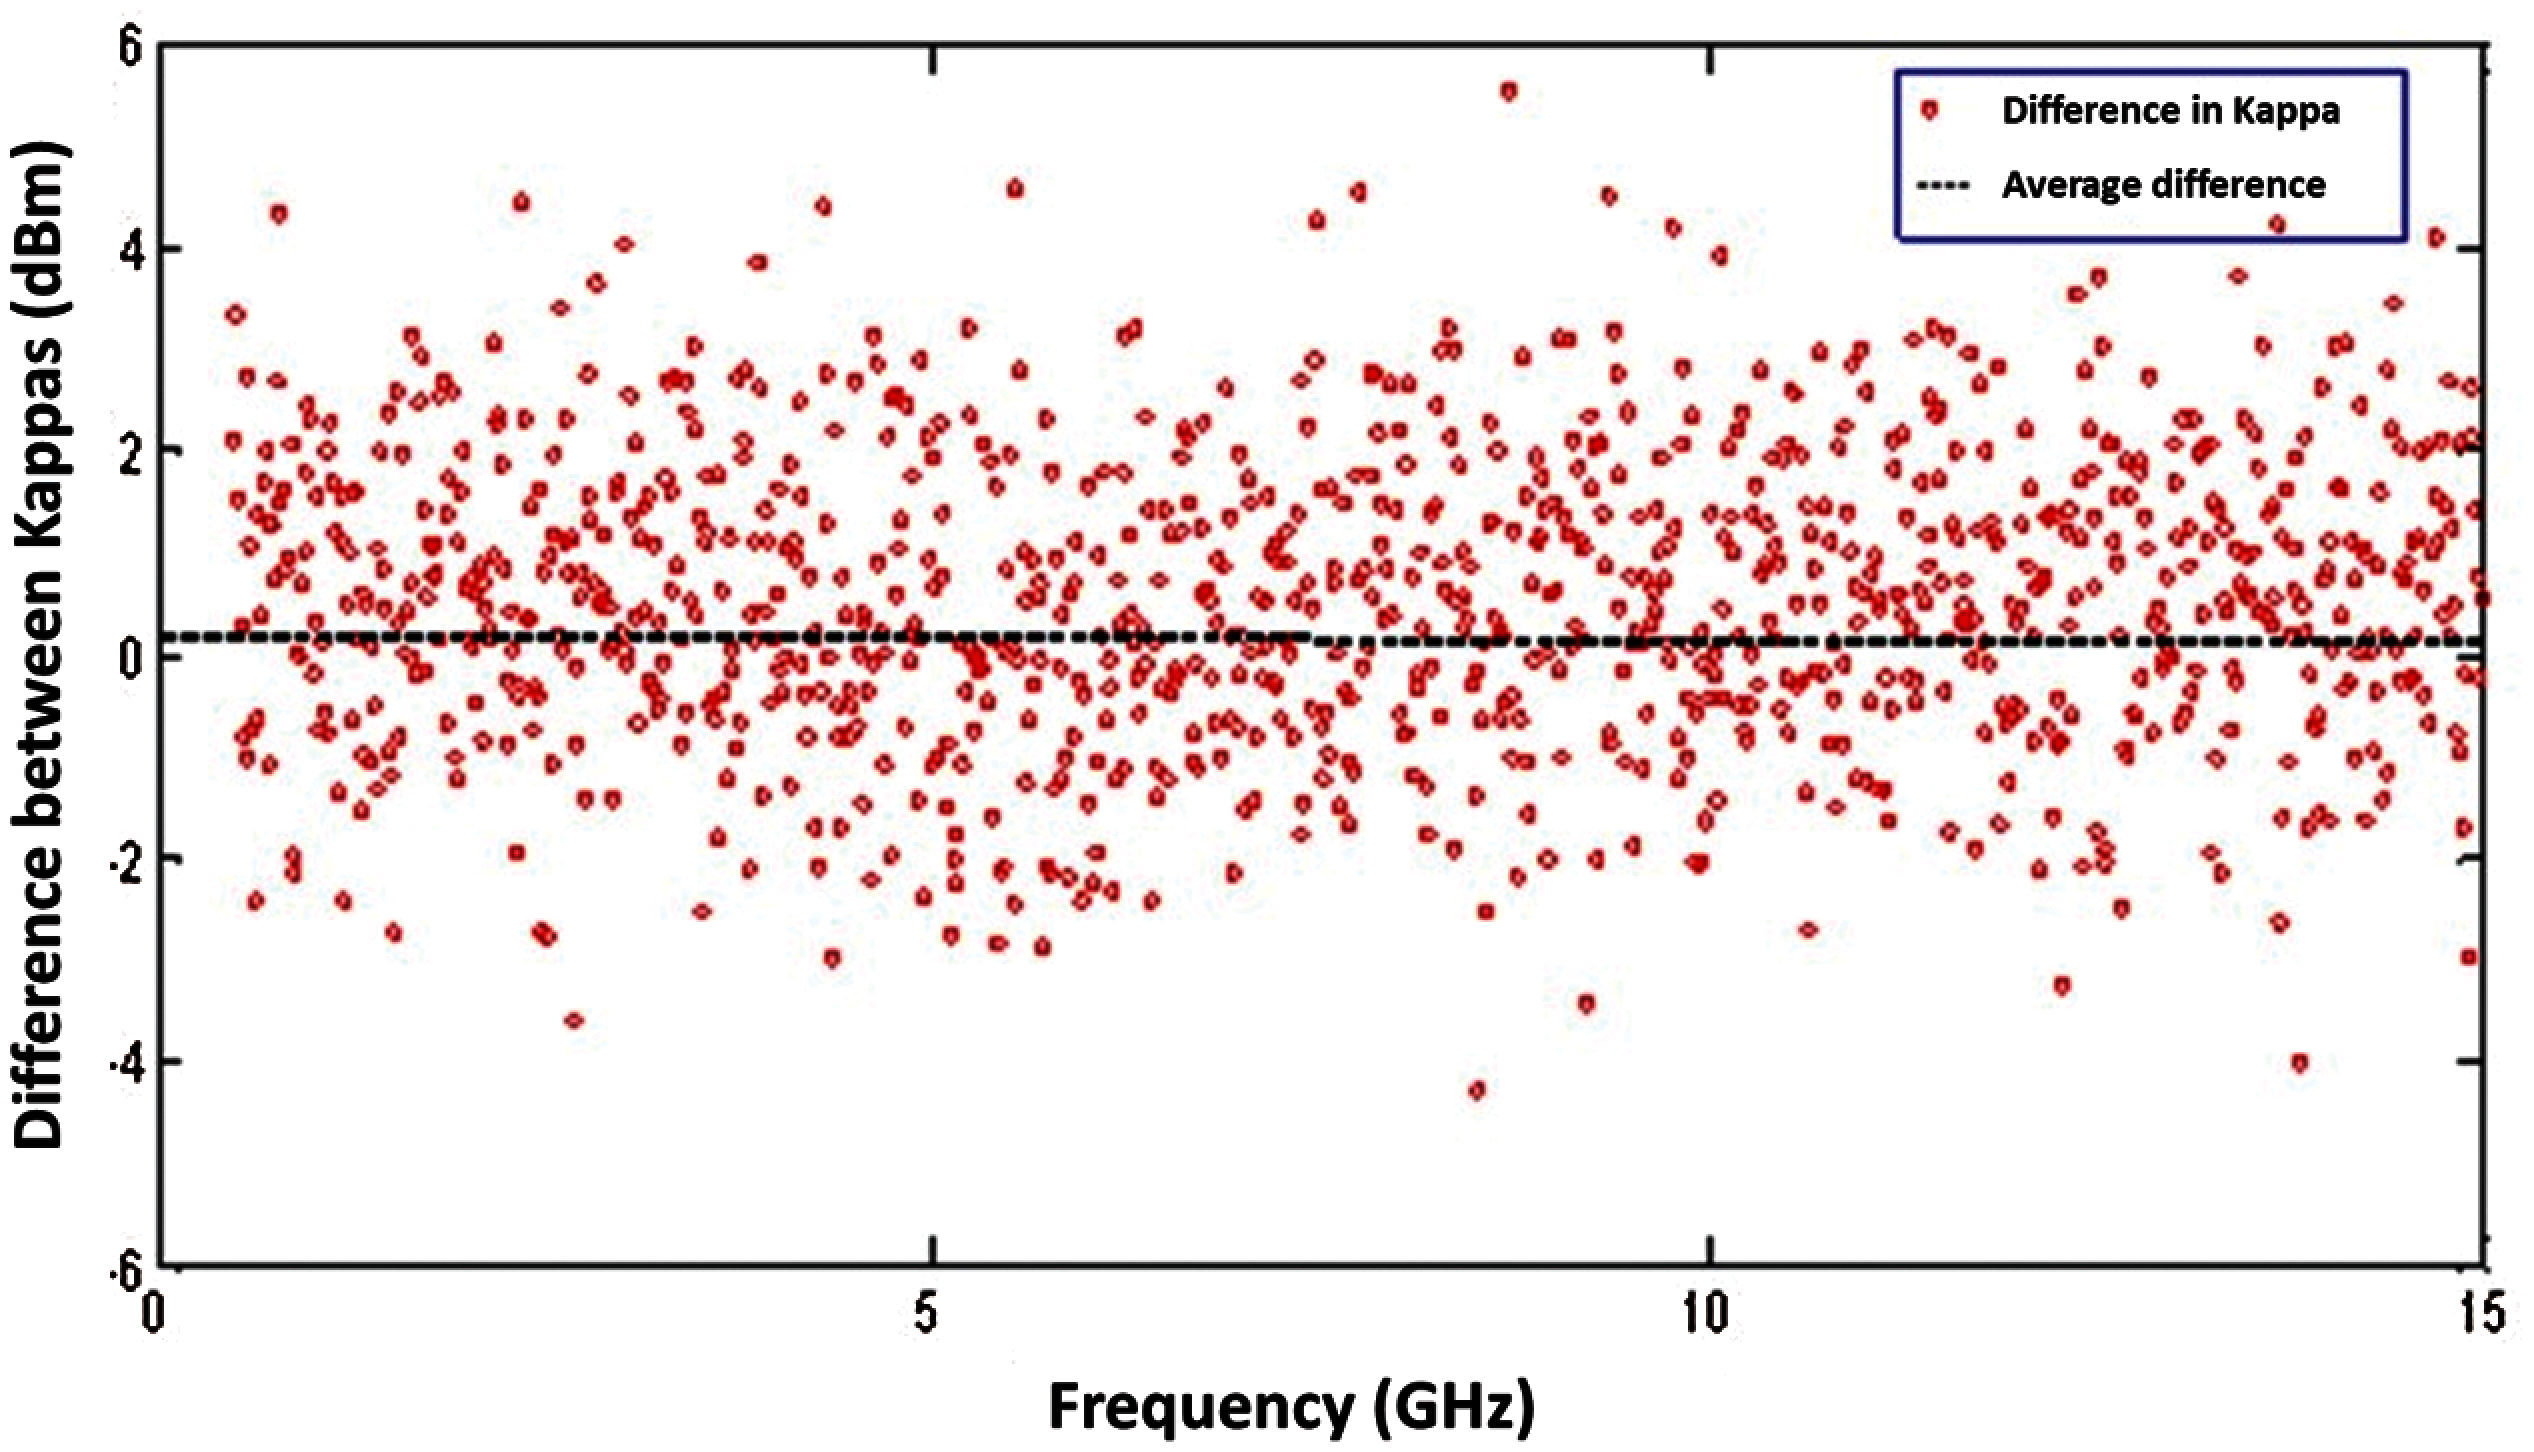
Figure 11: Difference between the kappas
In order to analyze the performance of our method, we compare the RIN of our system with that of the Agilent measurement setup [56]. The results have been shown in Fig. 12 where we can observe a significant difference. It can be clearly seen that the value of average RIN is greater for the system that we have developed in the laboratory. This means that the system can be used to provide sensitive information in an economic manner once the biomedical sensor is put in practice. Therefore, these findings are consistent with the results that have been earlier brought in [57] with the technical reasons hitherto.
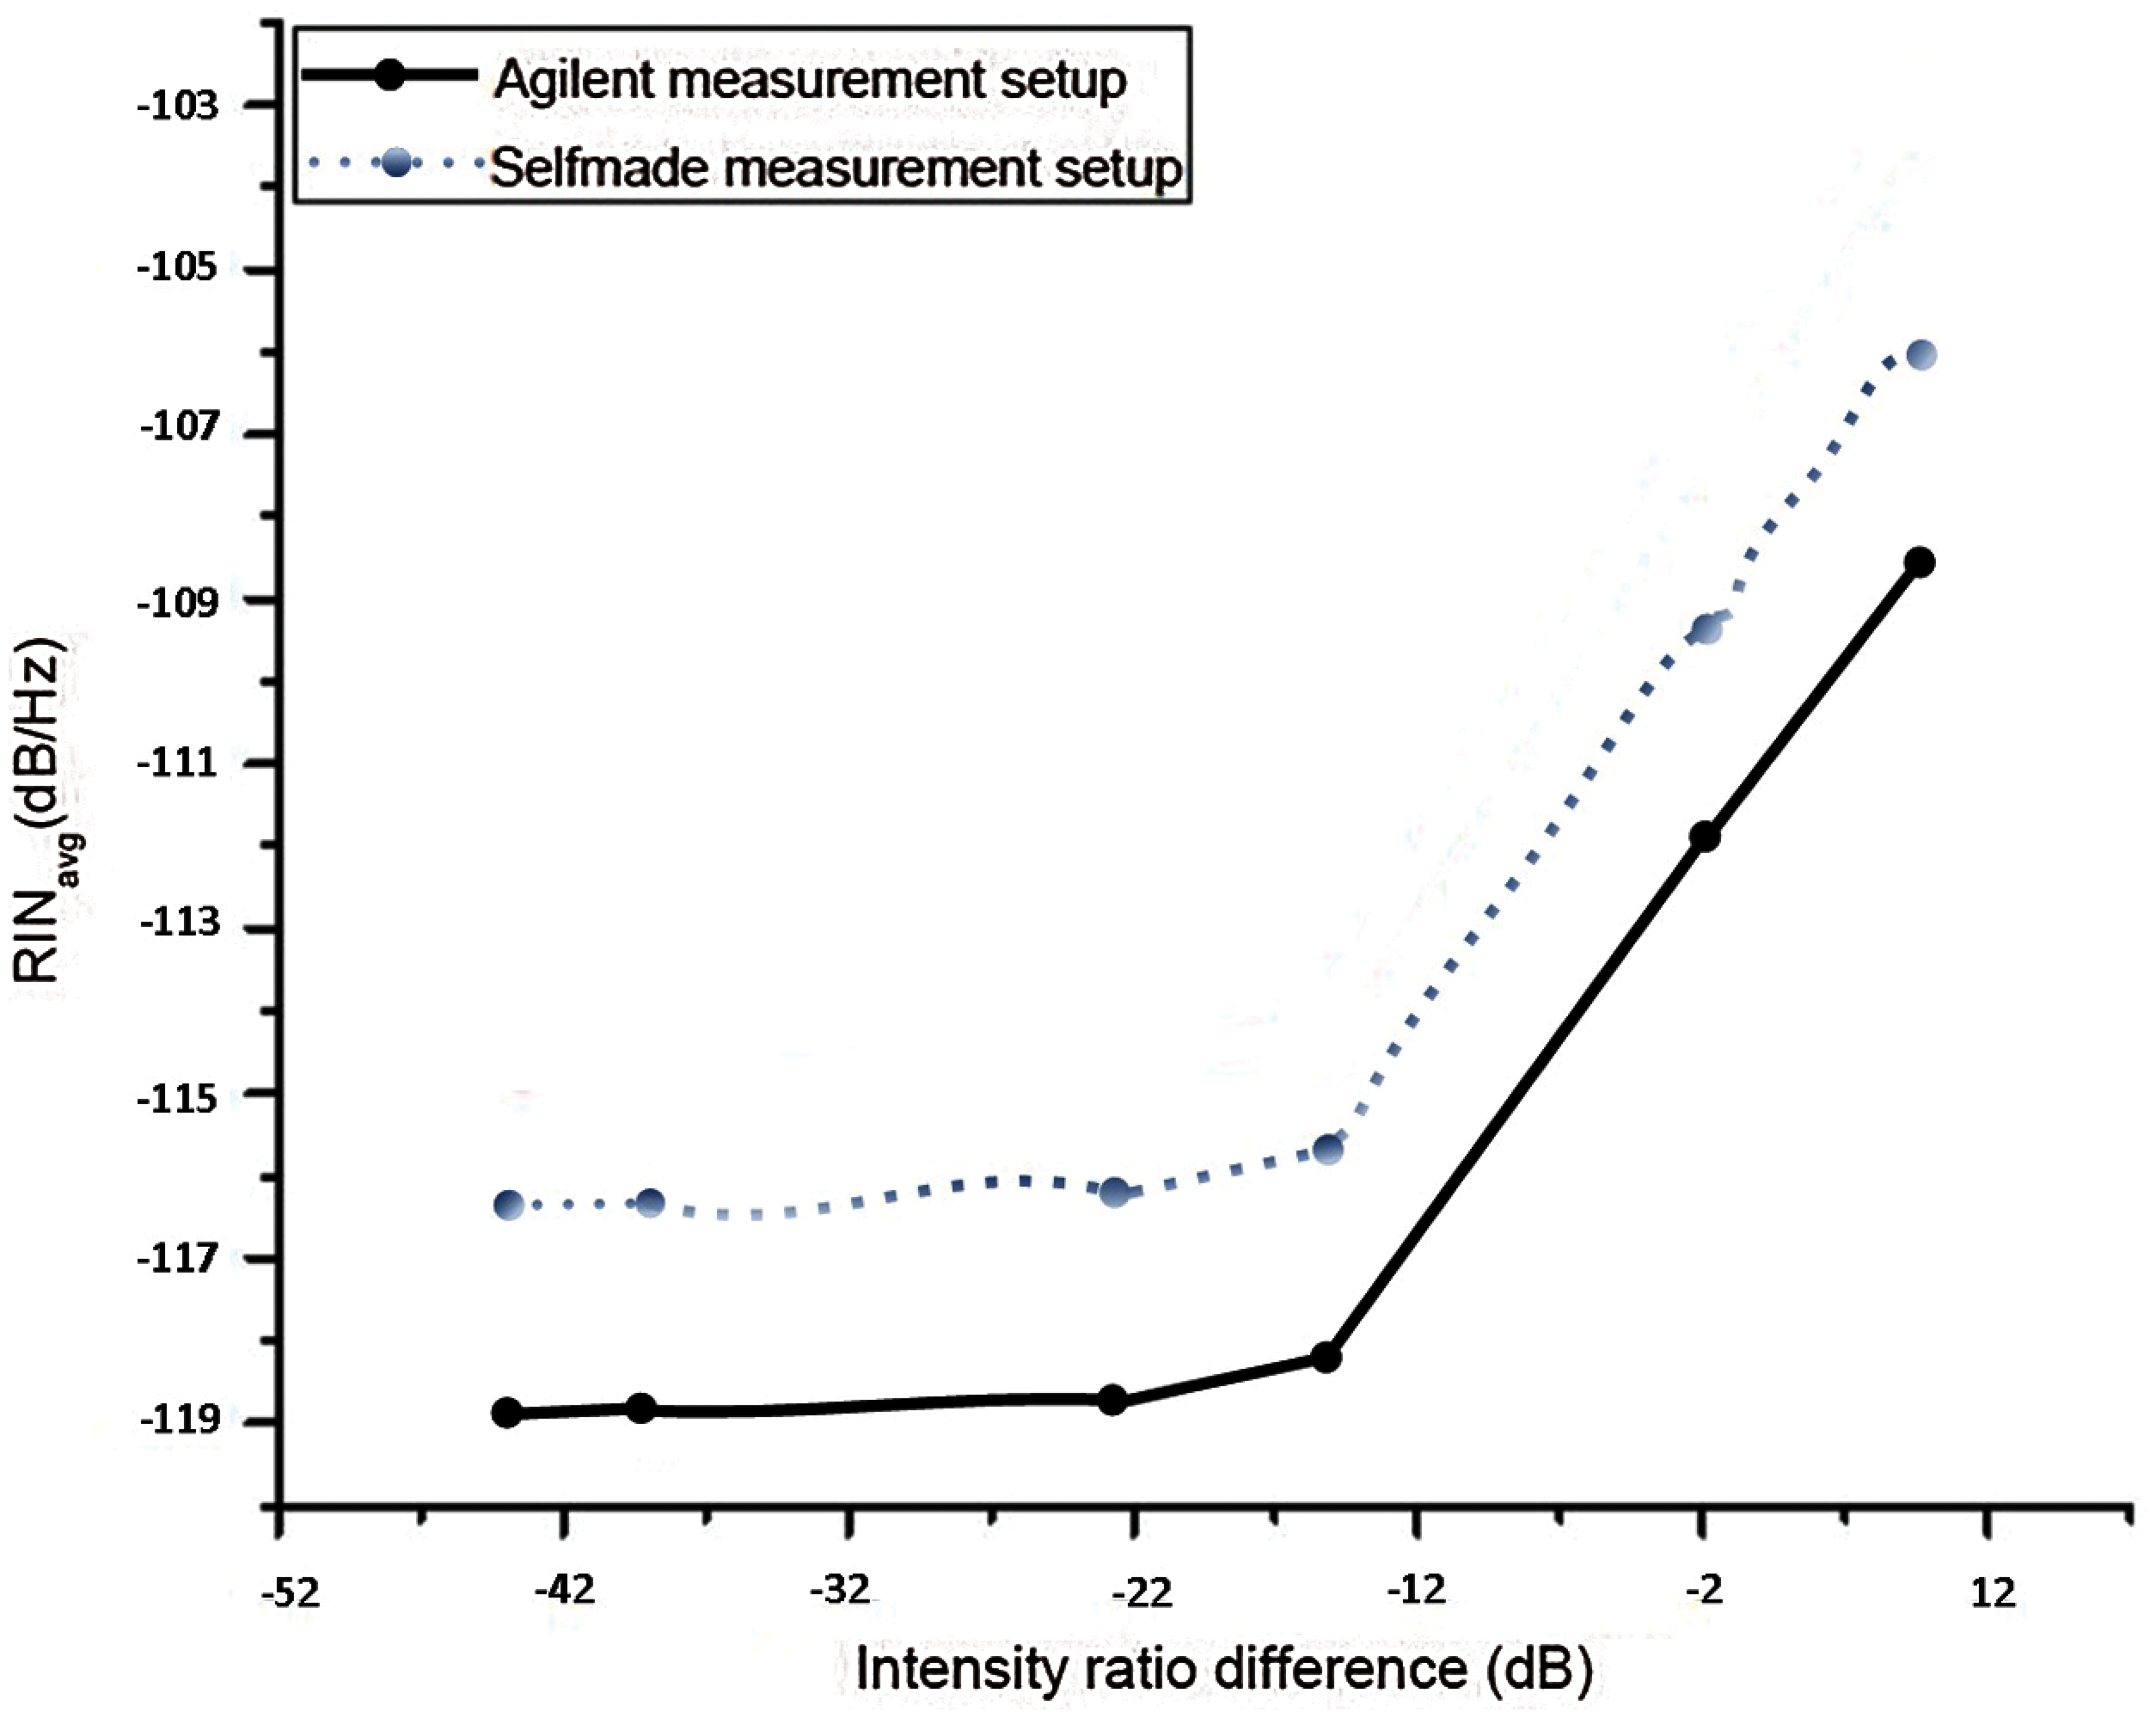
Figure 12: Comparing average RIN from both measurement setups

The current experimental analysis provides an investigation of a biomedical sensor for human health. The laser setup must be analyzed in depth for all the components. Therefore, the SOA has been investigated in detail in terms of characterization, calibration and technical analysis. Using the proposed algorithm and the set of defined parameters, the system has been evaluated in terms of the variation of the maximum wavelength with the injection current in a prescribed range of temperature, thereby providing worthwhile information regarding its red-shift and blue-shift.
A detailed test of the proposed technique and a simple description of the implementation complete this task. The whole procedure took quite some time, as it was performed under the stated experimental conditions. Here the system performance is explained on the basis of the RIN of the receiver system. We analyze the performance of the optical receiver for a frequency range up to 15 GHz by using the theoretical formulation of frequency dependent calibration function
Funding Statement: This work was supported in part by the German Academic Exchange Service (Deutsche Akademische Austausch Dienst (DAAD)), and in part by the University of Kassel.
Conflicts of Interest: The authors declare that they have no conflicts of interest to report about the present study.
1. H. I. Kobo, A. M. Abu-Mahfouz and G. P. Hancke, “A survey on software-defined wireless sensor networks: Challenges and design requirements,” IEEE Access, vol. 5, pp. 1872–1899, 2017. [Google Scholar]
2. A. Vizbaras, I. Šimonytė, S. Droz, N. Torcheboeuf and A. Miasojedovas, “Gasb swept-wavelength lasers for biomedical sensing applications,” IEEE Journal of Selected Topics in Quantum Electronics, vol. 25, no. 6, pp. 1–12, 2019. [Google Scholar]
3. M. S. Islam, C. M. B. Cordeiro, J. Sultana, R. A. Aoni and S. Feng, “A Hi-bi ultra-sensitive surface plasmon resonance fiber sensor,” IEEE Access, vol. 7, pp. 79085–79094, 2019. [Google Scholar]
4. A. S. Roy, S. Kim and S. P. Mudanai, “An improved flicker noise model for circuit simulations,” IEEE Transactions on Electron Devices, vol. 64, no. 4, pp. 1689–1694, 2017. [Google Scholar]
5. L. Jašíková and J. Roithová, “Infrared multiphoton dissociation spectroscopy with free-electron lasers: On the road from small molecules to biomolecules,” Chemistry–a European Journal, vol. 24, no. 14, pp. 3374–3390, 2018. [Google Scholar]
6. Y. Zhang, L. Y. Zhang, J. Zhou, L. Liu and F. Chen, “A review of compressive sensing in information security field,” IEEE Access, vol. 4, pp. 2507–2519, 2016. [Google Scholar]
7. E. K. R. Kipnoo, D. K. Boiyo, G. M. Isoe, T. V. Chabata and R. R. G. Gamatham, “Demonstration of Raman-based, dispersion-managed VCSEL technology for fibre-to-the-hut application,” Optical Fiber Technology, vol. 34, pp. 1–5, 2017. [Google Scholar]
8. P. Bonato, “Wearable sensors/systems and their impact on biomedical engineering,” IEEE Engineering in Medicine and Biology Magazine, vol. 22, no. 3, pp. 18–20, 2003. [Google Scholar]
9. L. D. S. H. Brinch-Pedersen and P. B. Holm, “Engineering crop plants: Getting a handle on phosphate,” Trends in Plant Science, vol. 7, no. 3, pp. 118–125, 2002. [Google Scholar]
10. I. Joindot, “Measurements of relative intensity noise (RIN) in semiconductor lasers,” Journal De Physique III, vol. 2, no. 9, pp. 1591–1603, 1992. [Google Scholar]
11. H. H. Nieuwoudt, B. A. Prior, I. S. Pretorius, M. Manley, and F. F. Bauer, “Principal component analysis applied to Fourier transform infrared spectroscopy for the design of calibration sets for glycerol prediction models in wine and for the detection and classification of outlier samples,” Journal of Agricultural and Food Chemistry, vol. 52, no. 12, pp. 3726–3735, 2004. [Google Scholar]
12. C. Bock and J. Prat, “WDM/TDM PON experiments using the AWG free spectral range periodicity to transmit unicast and multicast data,” Optics Express, vol. 13, no. 8, pp. 2887–2891, 2005. [Google Scholar]
13. Y. B. C. Man and G. Setiowaty, “Application of Fourier transform infrared spectroscopy to determine free fatty acid contents in palm olein,” Food Chemistry, vol. 66, no. 1, pp. 109–114, 1999. [Google Scholar]
14. S. Islam, M. N. Reza, J. T. Jeong and K. H. Lee, “Sensing technology for rapid detection of phosphorus in water: A review,” Journal of Biosystems Engineering, vol. 41, no. 2, pp. 138–144, 2016. [Google Scholar]
15. E. J. King, “The colorimetric determination of phosphorus,” Biochemical Journal, vol. 26, no. 2, pp. 292–297, 1932. [Google Scholar]
16. M. Bin, M. C. Gaidis, J. Zmuidzinas and T. G. Phillips, “Low-noise 1 THz niobium superconducting tunnel junction mixer with a normal metal tuning circuit,” Applied Physics Letters, vol. 68, no. 12, pp. 1714–1716, 1996. [Google Scholar]
17. U. Masud and M. I. Baig, “Investigation of cavity length and mode spacing effects in dual-mode sensor,” IEEE Sensors Journal, vol. 18, no. 7, pp. 2737–2743, 2018. [Google Scholar]
18. D. H. Lowndes, A. P. Alivisatos, M. Alper, R. S. Averback, J. Jacob Barhen et al., “Nanoscale science, engineering and technology research directions,” Technical Report, U.S. Department of Energy, pp. 37–52, 1999. [Google Scholar]
19. L. Goldman ed., “The biomedical laser: Technology and clinical applications,” in Springer Science & Business Media, New York, USA: Springer, 2013. [Google Scholar]
20. C. B. Marble and V. V. Yakovlev, “Biomedical optics applications of advanced lasers and nonlinear optics,” Journal of Biomedical Optics, vol. 25, no. 4, pp. 040902, 2020. [Google Scholar]
21. Y. C. Chen and X. Fan, “Biological lasers for biomedical applications,” Advanced Optical Materials, vol. 7, no. 17, pp. 1900377, 2019. [Google Scholar]
22. B. Azadgoli and R. Y. Baker, “Laser applications in surgery,” Annals of Translational Medicine, vol. 4, no. 23, p. 452, 2016. [Google Scholar]
23. R. R. Ansari, “Lasers for medical applications: Diagnostics, therapy, and surgery,” Journal of Biomedical Optics, vol. 19, no. 3, pp. 039901, 2014. [Google Scholar]
24. M. G. Martins, M. I. Martins, A. H. de Souza, F. T. Antunes, P. B. Pail et al., “Evaluation of lipolysis and toxicological parameters of low-level laser therapy at different wavelengths and doses in the abdominal subcutaneous tissue,” Lasers in Medical Science, pp. 1–10, 2021. [Google Scholar]
25. D. Sezen, M. Hatipoğlu and K. Üstün, “Evaluation of the clinical and biochemical efficacy of erbium, chromium:Ytrium-scandium-gallium-garnet (ER,CR:YSGG) laser treatment in periodontitis,” Lasers in Medical Science, vol. 35, no. 7, pp. 1567–1575, 2020. [Google Scholar]
26. M. F. das Neves, D. C. Aleixo, I. S. Mendes, F. P. Lima, R. A. Nicolau et al., “Long-term analyses of spastic muscle behavior in chronic poststroke patients after near-infrared low-level laser therapy (808 nmA double-blinded placebo-controlled clinical trial,” Lasers in Medical Science, vol. 35, no. 7, pp. 1459–1467, 2019. [Google Scholar]
27. C. I. Yen, C. J. Chang, C. S. Chang, H. C. Chen, M. H. Chien et al., “Laser hair removal following forehead flap for nasal reconstruction,” Lasers in Medical Science, vol. 35, no. 7, pp. 1549–1554, 2020. [Google Scholar]
28. S. J. Jo, J. Y. Kim, J. Ban, Y. Lee, O. Kwon et al., “Efficacy and safety of hair removal with a long-pulsed diode laser depending on the spot size: A randomized, evaluators-blinded, left-right study,” Annals of Dermatology, vol. 27, no. 5, pp. 517–522, 2015. [Google Scholar]
29. M. R. Almeida, K. D. S. Oliveira, R. Stephani and L. F. C. De Oliveira, “Fourier-transform Raman analysis of milk powder: A potential method for rapid quality screening,” Journal of Raman Spectroscopy, vol. 42, no. 7, pp. 1548–1552, 2011. [Google Scholar]
30. Z. Y. Zhang, D. D. Gui, M. Sha, J. Liu and H. Y. Wang, “Raman chemical feature extraction for quality control of dairy products,” Journal of Dairy Science, vol. 102, no. 1, pp. 68–76, 2019. [Google Scholar]
31. N. N. Y. Karacaglar, T. Bulat, I. H. Boyaci and A. Topcu, “Raman spectroscopy coupled with chemometric methods for the discrimination of foreign fats and oils in cream and yogurt,” Journal of Food and Drug Analysis, vol. 27, no. 1, pp. 101–110, 2019. [Google Scholar]
32. U. Masud, F. Jeribi, A. Zeeshan, A. Tahir and M. Ali, “Highly sensitive microsensor based on absorption spectroscopy: Design considerations for optical receiver,” IEEE Access, vol. 8, pp. 100212–100225, 2020. [Google Scholar]
33. B. Ozbey and K. Sertel, “Effects of internal reflections on the performance of lens-integrated mmW and THz antennas,” in 2018 Int. Applied Computational Electromagnetics Society Sym. (ACESBeijing, China, pp. 1–2, 2018. [Google Scholar]
34. M. Aboonajmi and T. A. Najafabadi, “Prediction of poultry egg freshness using vis-nIR spectroscopy with maximum likelihood method,” International Journal of Food Properties, vol. 17, no. 10, pp. 2166–2176, 2014. [Google Scholar]
35. D. R. Zimmerman and L. H. Spiekman, “Amplifiers for the masses: EDFA EDWA and SOA amplets for metro and access applications,” Journal of Lightwave Technology, vol. 22, no. 1, pp. 63–70, 2004. [Google Scholar]
36. M. Dagenais, P. Heim, S. Saini, S. Wilson and R. Leavitt, “High power C-band semiconductor booster optical amplifier,” in Optical Fiber Communication Conf., Optical Society of America, Atlanta, Georgia, United States, vol. 1, pp. 85–87, 2003. [Google Scholar]
37. N. Beuster, F. Raschke, A. Ihlow, C. Andrich and G. D. Galdo, “Attaining low uncertainties in measurements with RF signal generators and analyzers,” in IEEE Int. Instrumentation and Measurement Technology Conf., Turin, Italy, pp. 1–6, 2017. [Google Scholar]
38. R. Phelan, M. Gleeson, D. Byrne, J. O'Carroll and M. Nawrocka, “High power narrow linewidth discrete mode laser diode integrated with a curved semiconductor optical amplifier emitting at 2051 nm,” Applied Optics, vol. 57, no. 2, pp. E1–E5, 2018. [Google Scholar]
39. T. Kataoka and K. Hagimoto, “High resolution optical spectrum analyzer using a heterodyne detection technique,” in Advanced Technologies in I & M, IEEE Instrumentation and Measurement Technology Conf., Hamamatsu, Japan, vol. 1, pp. 234–237, 1994. [Google Scholar]
40. P. Chen, Y. Rong, S. Nordholm, A. J. Duncan and Z. He, “A LabVIEW-based implementation of real-time underwater acoustic OFDM system,” in 23rd Asia-Pacific Conf. on Communications, Perth, Australia, pp. 1–5, 2017. [Google Scholar]
41. S. Wold, M. Sjöström and L. Eriksson, “PLS-Regression: A basic tool of chemometrics,” Chemometrics and Intelligent Laboratory Systems, vol. 58, no. 2, pp. 109–130, 2001. [Google Scholar]
42. T. Ida, M. Ando and H. Toraya, “Extended pseudo-voigt function for approximating the voigt profile,” Journal of Applied Crystallography, vol. 33, pp. 1311–1316, 2000. [Google Scholar]
43. A. Lomakin, “Fitting the correlation function,” Applied Optics, vol. 40, no. 24, pp. 4079–4086, 2001. [Google Scholar]
44. K. P. O'Donnell and X. Chen, “Temperature dependence of semiconductor band gaps,” Applied Physics Letters, vol. 58, no. 25, pp. 2924–2926, 1991. [Google Scholar]
45. C. H. Henry, R. A. Logan and K. A. Bertness, “Spectral dependence of the change in refractive index due to carrier injection in gaAs lasers,” Journal of Applied Physics, vol. 52, no. 7, pp. 4457–4461, 1981. [Google Scholar]
46. B. R. Bennett, R. A. Soref and J. A. D. Alamo, “Carrier-induced change in refractive index of InP, gaAs and inGaAsP,” IEEE Journal of Quantum Electronics, vol. 26, no. 1, pp. 113–122, 1990. [Google Scholar]
47. S. An, J. Bae, V. G. Minogin and O. Kwon, “Current-dependent spectral blueshift in a three-dimensional photonic-quantum-ring laser,” Applied Optics, vol. 45, no. 8, pp. 1820–1824, 2006. [Google Scholar]
48. U. Masud, M. I. Baig and A. Zeeshan, “Automatization analysis of the extremely sensitive laser-based dual-mode biomedical sensor,” Lasers in Medical Science, vol. 35, no. 7, pp. 1531–1542, 2019. [Google Scholar]
49. U. Masud, M. Ali and M. Ikram, “Calibration and stability of highly sensitive fibre based laser through relative intensity noise,” Physica Scripta, vol. 95, no. 5, pp. 055505–055522, 2020. [Google Scholar]
50. G. Zhang, P. Li, W. Zhang and J. Zhao, “Analysis of multiple soybean phytonutrients by near-infrared reflectance spectroscopy,” Analytical and Bioanalytical Chemistry, vol. 409, no. 14, pp. 3515–3525, 2017. [Google Scholar]
51. M. Premaratne, A. J. Lowery, Z. Ahmed and D. Novak, “Modeling noise and modulation performance of fiber grating external cavity lasers,” IEEE Journal of Selected Topics in Quantum Electronics, vol. 3, no. 2, pp. 290–303, 1997. [Google Scholar]
52. P. Cattaneo, C. Balzaretti, F. Quaglia and M. di Gian-Camillo, “Valutazione della freschezza delle uova in guscio con metodi chimici e fisici. ingegneria alimentare,” Ingegneria Alimentare, Le Conserve Animali, vol. 13, no. 4, pp. 9–20, 1997. [Google Scholar]
53. L. Feng, M. Zhang, B. Adhikari and Z. Guo, “Nondestructive detection of postharvest quality of cherry tomatoes using a portable NIR spectrometer and chemometric algorithms,” Food Analytical Methods, vol. 12, no. 4, pp. 914–925, 2019. [Google Scholar]
54. A. Jonas, H. Stiel, L. Glöggler, D. Dahm and K. Dammer, “Towards poisson noise limited optical pump soft X-ray probe NEXAFS spectroscopy using a laser-produced plasma source,” Optics Express, vol. 27, no. 25, pp. 36524–36537, 2019. [Google Scholar]
55. E. Oguz, “Removal of phosphate from aqueous solution with blast furnace slag,” Journal of Hazardous Materials, vol. 114, no. 1–3, pp. 131–137, 2004. [Google Scholar]
56. U. Masud and M. I. Baig, “An application of newton's method in wireless systems,” in Proc. of the 8th Int. Conf. on Frontiers of Information Technology, Islamabad, Pakistan, pp. 1–5, 2010. [Google Scholar]
57. U. Masud, F. Jeribi, M. Alhameed, A. Tahir and Q. Javaid, “Traffic congestion avoidance system using foreground estimation and cascade classifier,” IEEE Access, vol. 8, pp. 178859–178869, 2020. [Google Scholar]
58. G. K. Verma and U. S. Tiwary, “Affect representation and recognition in 3D continuous valence-arousal-dominance space,” Multimedia Tools and Applications, vol. 76, no. 2, pp. 2159–2183, 2017. [Google Scholar]
59. U. Masud, M. I. Baig, F. Akram and T. S. Kim, “A p300 brain computer interface based intelligent home control system using a random forest classifier,” in 2017 IEEE Sym. Series on Computational Intelligence (SSCIHonolulu, Hawaii, IEEE, pp. 1–5, 2017. [Google Scholar]
 | This work is licensed under a Creative Commons Attribution 4.0 International License, which permits unrestricted use, distribution, and reproduction in any medium, provided the original work is properly cited. |