DOI:10.32604/cmc.2022.020965
| Computers, Materials & Continua DOI:10.32604/cmc.2022.020965 | |
| Article |
Intelligent Deep Learning Based Disease Diagnosis Using Biomedical Tongue Images
1Sri Sivasubramaniya Nadar College of Engineering, Chennai, 603110, India
2Department of Information Technology, Department of Electronics and Communication Engineering, CARE College of Engineering, Tiruchirappalli, 620009, India
3Department of Electronics and Communication Engineering, KPR Institute of Engineering and Technology, Coimbatore, 641407, India
4Department of Mathematics and Statistics, College of Science, Taif University, P.O. Box 11099, Taif 21944, Saudi Arabia
5Mathematics Department, Faculty of Science, Sohag University, Sohag, Egypt
6Deanship of Scientific Research, King Abdulaziz University, Jeddah, Saudi Arabia
7Department of Electrical and Computer Engineering, Faculty of Engineering, King Abdulaziz University, Jeddah, Saudi Arabia
*Corresponding Author: V. Thanikachalam. Email: thanikachalamv@ssn.edu.in
Received: 16 June 2021; Accepted: 30 July 2021
Abstract: The rapid development of biomedical imaging modalities led to its wide application in disease diagnosis. Tongue-based diagnostic procedures are proficient and non-invasive in nature to carry out secondary diagnostic processes ubiquitously. Traditionally, physicians examine the characteristics of tongue prior to decision-making. In this scenario, to get rid of qualitative aspects, tongue images can be quantitatively inspected for which a new disease diagnosis model is proposed. This model can reduce the physical harm made to the patients. Several tongue image analytical methodologies have been proposed earlier. However, there is a need exists to design an intelligent Deep Learning (DL) based disease diagnosis model. With this motivation, the current research article designs an Intelligent DL-based Disease Diagnosis method using Biomedical Tongue Images called IDLDD-BTI model. The proposed IDLDD-BTI model incorporates Fuzzy-based Adaptive Median Filtering (FADM) technique for noise removal process. Besides, SqueezeNet model is employed as a feature extractor in which the hyperparameters of SqueezeNet are tuned using Oppositional Glowworm Swarm Optimization (OGSO) algorithm. At last, Weighted Extreme Learning Machine (WELM) classifier is applied to allocate proper class labels for input tongue color images. The design of OGSO algorithm for SqueezeNet model shows the novelty of the work. To assess the enhanced diagnostic performance of the presented IDLDD-BTI technique, a series of simulations was conducted on benchmark dataset and the results were examined in terms of several measures. The resultant experimental values highlighted the supremacy of IDLDD-BTI model over other state-of-the-art methods.
Keywords: Biomedical images; image processing; tongue color image; deep learning; squeezenet; disease diagnosis
For a long-known time, human tongue is assessed visually for signs and symptoms of diseases, since it is a non-invasive approach. Conventionally, medical experts observe its features while the diagnosis outcomes depend upon their years of experience [1]. But, subjectivity and ambiguity affect the results of such visual diagnosis. In order to eliminate such qualitative factors, tongue images are examined objectively for which a novel method is provided for disease diagnosis. Such model can also reduce the physical damage caused to persons (related to other medical investigations). In advanced computerized tongue image analyses, texture and colour features are more commonly observed [2]. There has been no or only few studies conducted upon tongue image analyses utilizing geometry features. However, conventional medicines like Traditional Chinese medicine (TCM) assess the shape of tongue to determine a person's disease. The study conducted earlier [3] presented a method to manually identify the shapes of tongue depending on geometric features. With the help of support decision tool, it weighs the comparative effects of geometric features and categorizes the tongue image under one out of six tongue shapes such as, rectangle, hammer, obtuse triangle, acute triangle, round, and square (on the basis of TCM). The combination of signal decomposition with dimension reduction techniques along with neural networks also provide good accuracy for both subject dependent and independent disease diagnosis using biomedical images [4].
Few disease diagnosis systems make decisions based on distinct features extracted during feature extraction phase [5]. So, the quality of output is straightaway compared with the segmented tongue image present in the source. Thus, it is crucial to perform accurate and quick tongue image segmentation. So far, several automated tongue image segmentation methods have been presented based on detailed systems [6]. Especially, Bi-Elliptical Deformable Contour (BEDC) integrates module-based methods and Active Contour Models (ACM). In comparison with other techniques, this technique attained significant segmentation outcomes. Its segmentation quality was heavily based on few preceding knowledge and is sensitive to location and early curves present in the tongue. In order to confront this, Ning et al. [7] substituted module-based methods with the help of region merging approach in order to obtain coarse segmentation outcomes. ACM was utilized in this study for post-processing phase to attain improved segmentation efficiency related to BEDC. Though, earlier researchers [8] depend mostly on existing knowledge, the location data of early markers must be defined manually. Wu et al. [9] implemented an edge and region-based combinational method which could additionally eliminate the impact of nearby artefact in tongue and accordingly increase the results and strength of boost segmentation. Hence, this technique displayed weak strength in several situations. Particularly, the segmentation result was poor, if tongue poses are uneven and if the tongue is nearly shadowed by the lips [10,11].
Li et al. [12] proposed a simple and efficient tongue image segmentation system. At first, this technique extracts the primary tongue body areas with the performance of image threshold on transformed hue component in HSI colour space. Then, the image threshold results in red component of the actual tongue image which is chosen in an adaptive way to detect the gap between upper lip and tongue body root. At last, the primary body part of the tongue is established by eliminating fake object areas, for instance upper lip, so as to attain the latter tongue image segmentation outcome. Zhang et al. [13] improved a disease diagnoses approach for diabetes in accordance with regularized tongue image by SVM. The texture and colour features of the tongue image are extracted and used as input variables. Then, diabetes diagnosis method is trained using SVM. The study assessed the impact of this combination in improving the incorporation of SVM kernel parameter and input variable.
Fan et al. [14] studied a number of tongue features in patients with gastric and diabetic symptoms. The researchers collected the images with the help of digital tongue imaging technique. During feature extraction, texture and four TCM tongue features were detected such as slenderness, coating colour, constitution colour, plumpness, and cracks. During classification, two distinct classification methods were utilized such as SVM & RF to categorize the symptoms of TCM & DM gastric diseases. Wang et al. [15] presented an AI structure with the help of DCNN framework to recognize tooth-marked tongue. Firstly, they made use of massive dataset containing 1548 tongue images captured by several tools. Meng et al. [16] presented an innovative feature extraction module termed CHDNet to extract unbiased features and reduce the human effort upon tongue diagnosis in TCM. CNN model is known to have primarily concentrated on learning convolution filter and adjusting the weights amongst itself. So, this model has two challenges such as inadequate ability & redundancy in dealing with unbalanced sample distribution. So, the researchers presented local response normalization and high dispersal function to address these problems.
The current research article designs an Intelligent Deep Learning based Disease Diagnosis Model using Biomedical Tongue Images, called IDLDD-BTI model. The proposed IDLDD-BTI model incorporates fuzzy-based Adaptive Median Filtering (FADM) technique for noise removal process. Besides, SqueezeNet model is also employed as a feature extractor that tunes the hyperparameters of SqueezeNet model using Oppositional Glowworm Swarm Optimization (OGSO) algorithm. At last, Weighted Extreme Learning Machine (WELM) classifier is employed to allocate proper class labels to input tongue color images. In order to assess the improved diagnostic results of the presented IDLDD-BTI model, extensive experimental analysis was performed on benchmark dataset.
2 The Proposed IDLDD-BTI Model
Fig. 1 shows the working principle involved in the presented IDLDD-BTI model. The presented IDLDD-BTI model incorporates FADM-based noise removal technique, SqueezeNet-based feature extractor, OGSO-based parameter tuning, and WELM-based classification. The detailed working processes of these modules are discussed in succeeding sections.
During pre-processing stage, FADM technique is employed to remove the noise. Binary decision map
1. Define the amount of noise-free pixel
2. Develop
3. Estimate the median pixel
4. Compute the variance between central pixel and the neighboring pixels from filtering window [17].
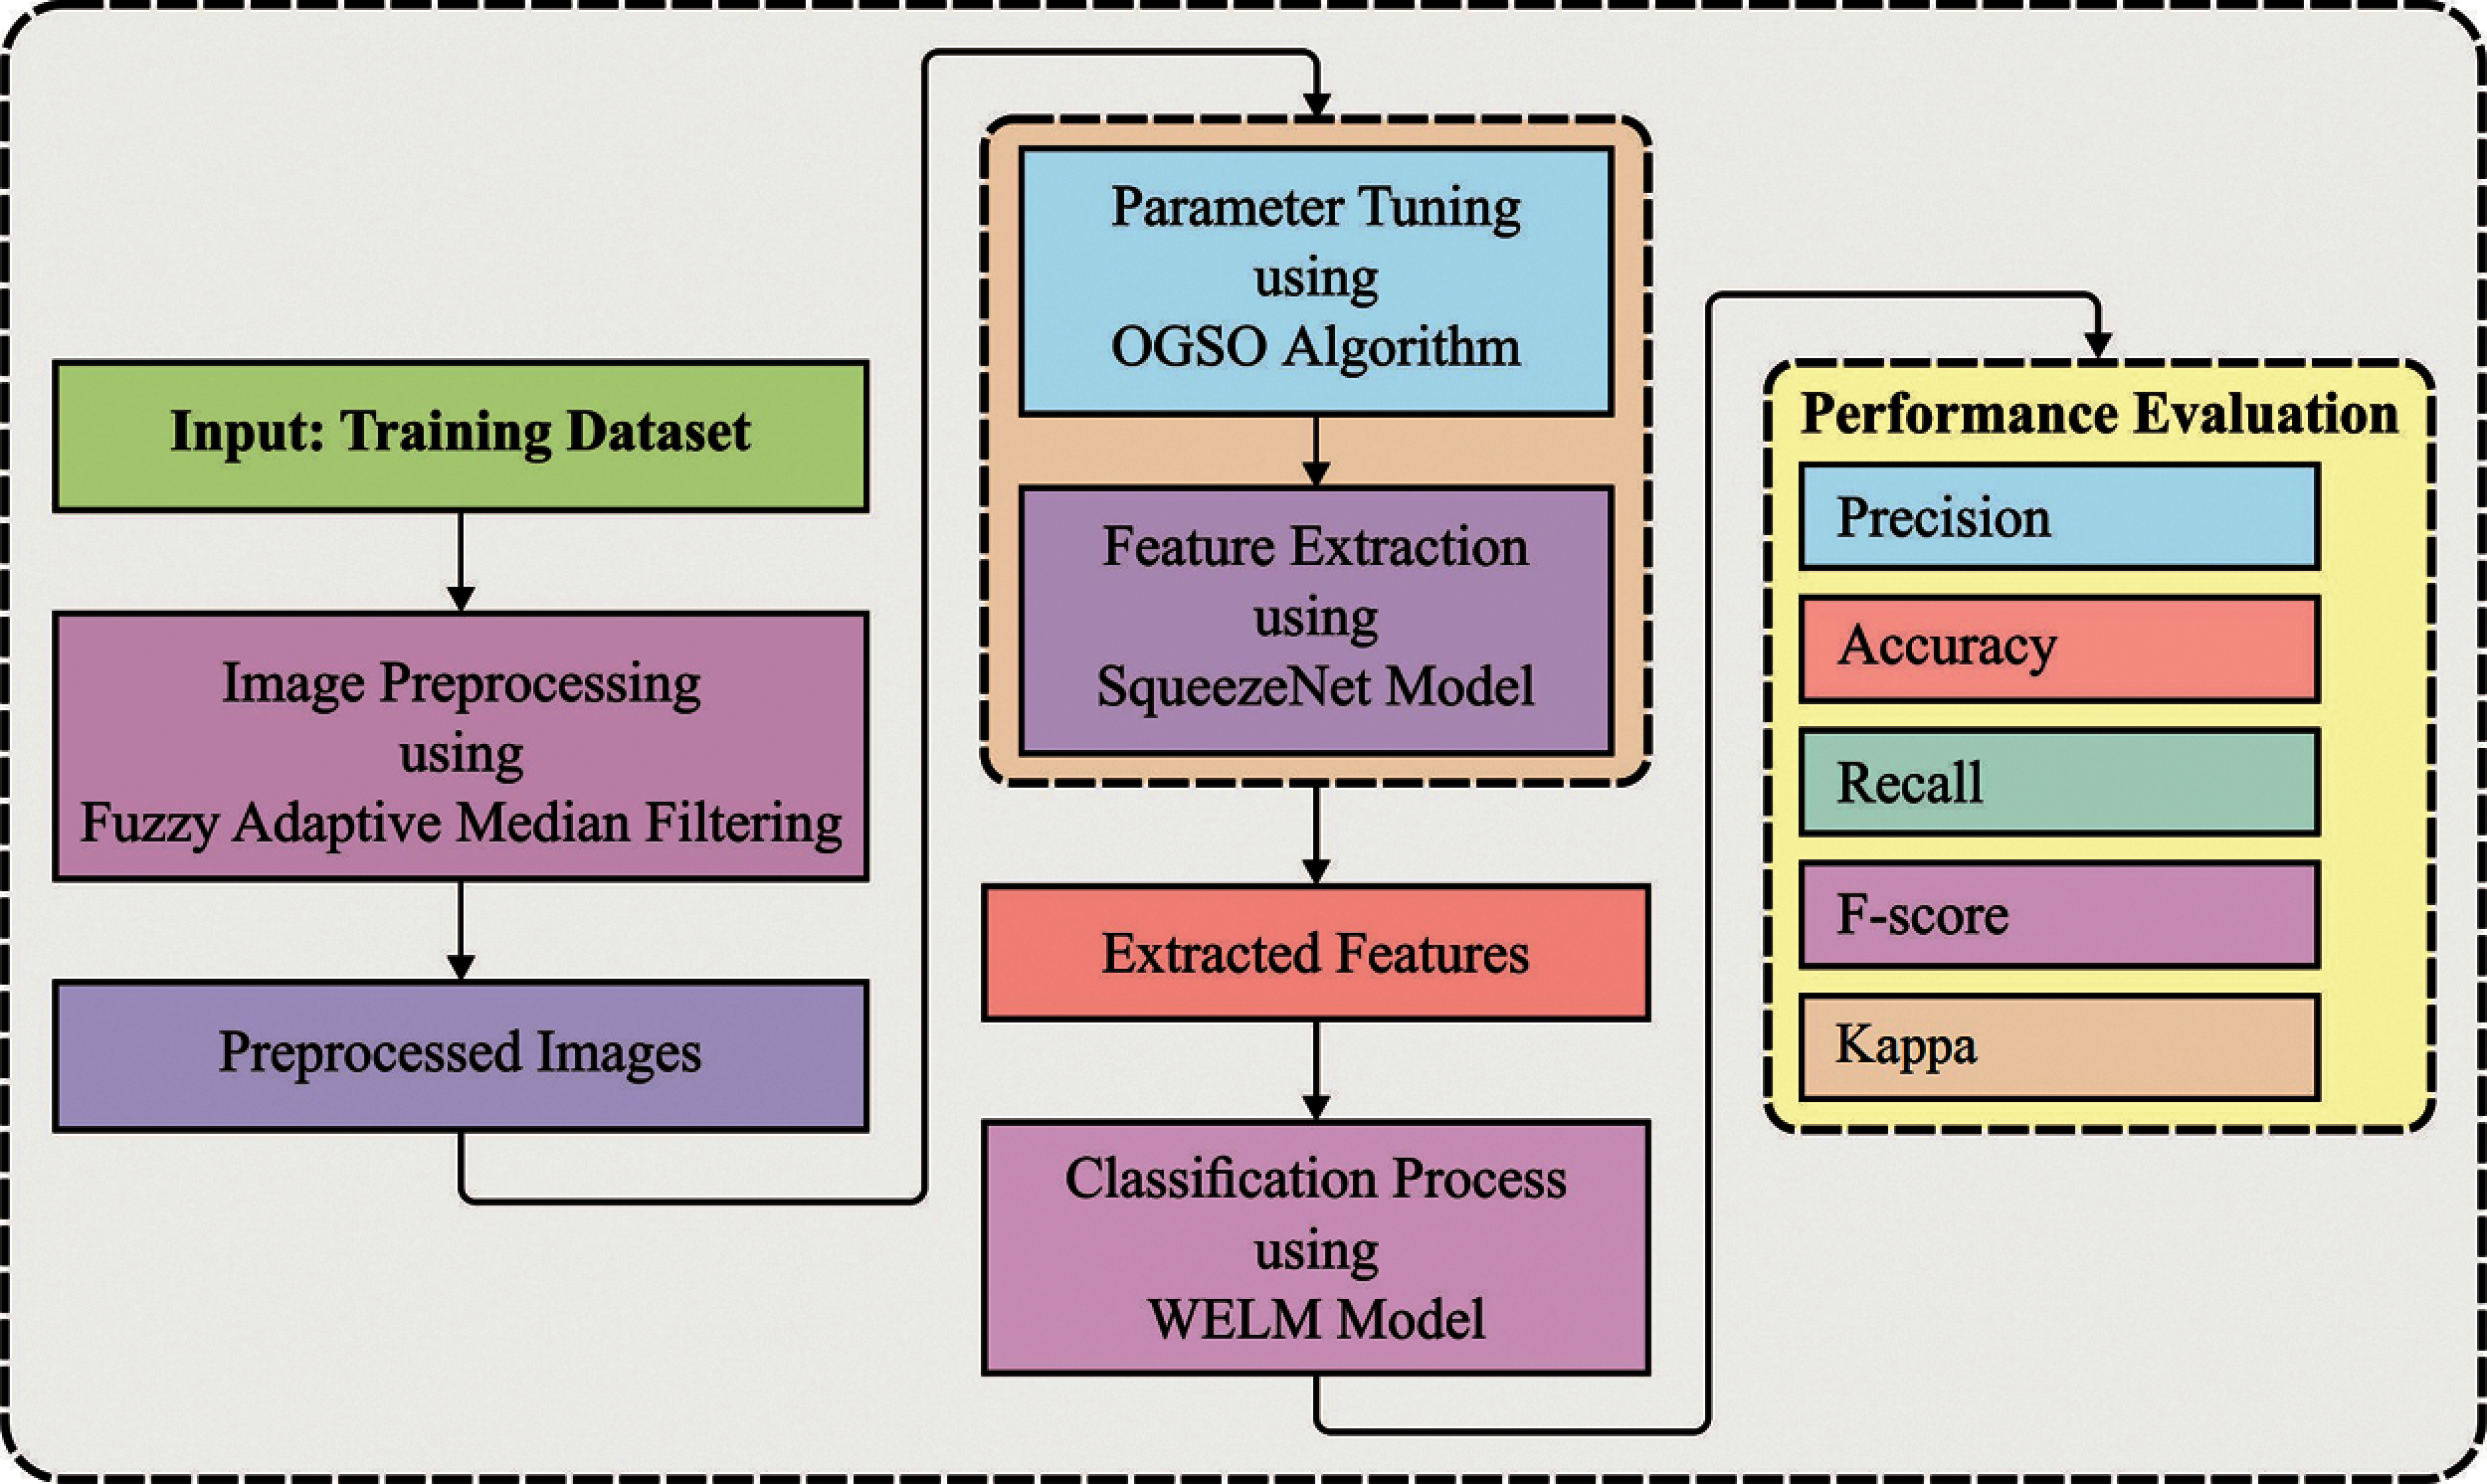
Figure 1: Overall process of IDLDD-BTI model
Based on:
where
where
6. Calculate the restoration term
2.2 Squeezenet Based Feature Extraction
SqueezeNet is a convolutional network that applies optimum efficiency than AlexNet with 50× smaller parameter. It has 15 layers with five distinct layers as two convolutional layers, three max pooling layers, eight fire layers, one global average pooling layer, and one output layer softmax. The structure of network is shown in Fig. 2. As demonstrated in the figure, K×K notations signify the receptive field size of filter, ‘s’ implies the stride sizes and l represents the length of the feature map, correspondingly. The input of networks consists of 227 × 227 dimensions with RGB channel.
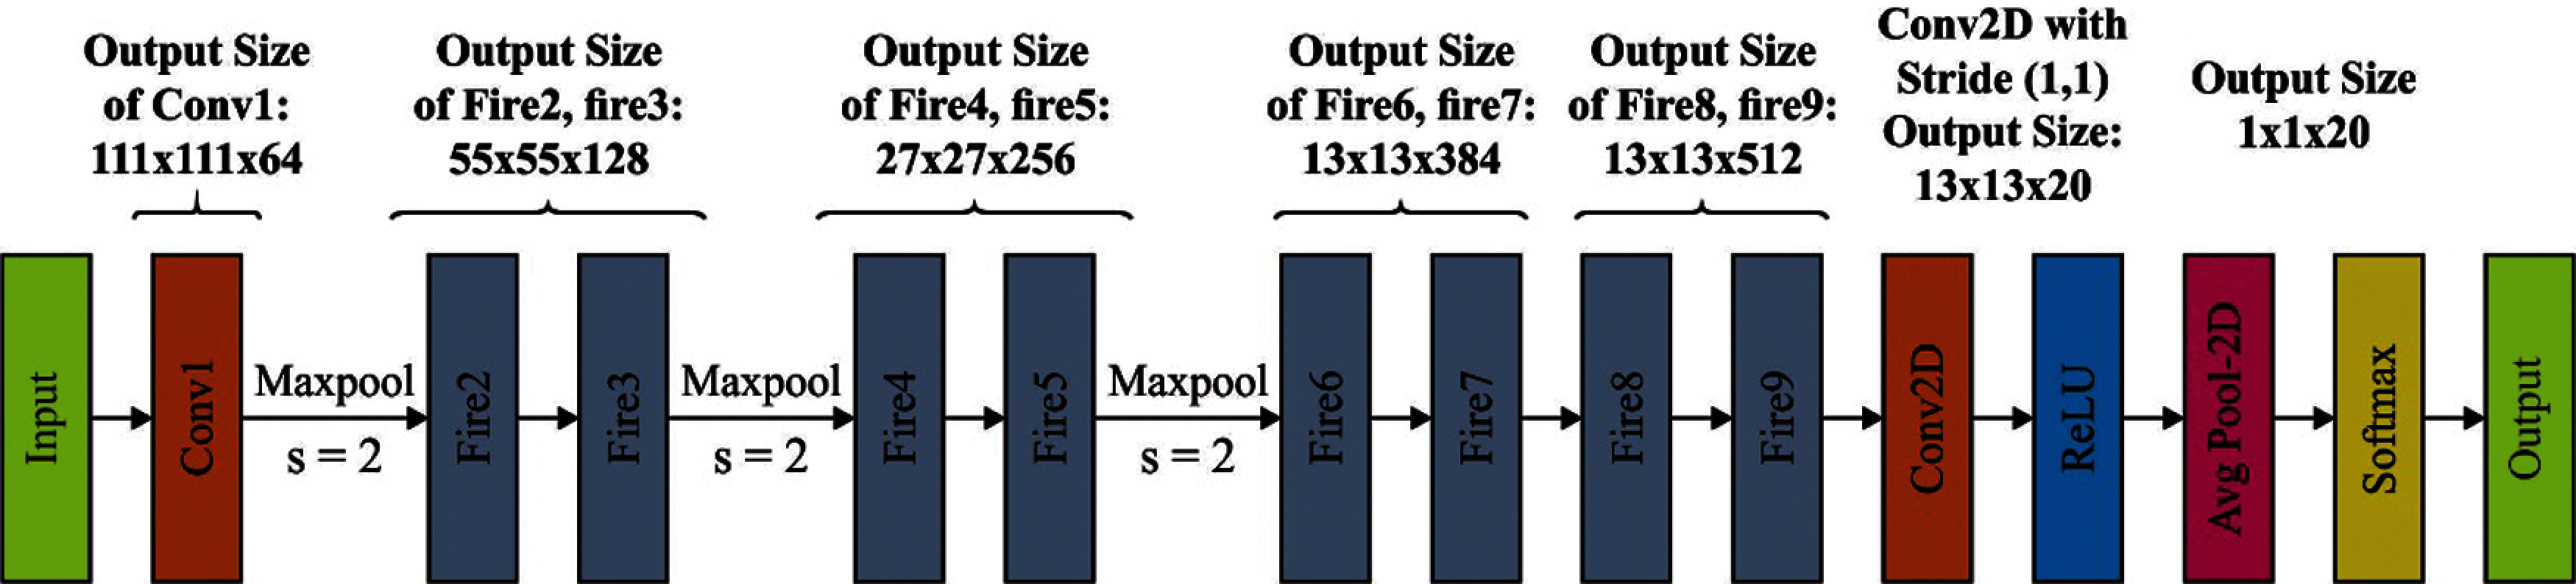
Figure 2: SqueezeNet architecture
The generalization of input images by convolutional and max-pooling layers is executed. The convolutional layers get convoluted amongst weights as well as small regions from input volume, with
Eventually, expansion outcomes are stacked from in-depth dimensions of input tensors by concatenating function. Fig. 3 shows a review on fire layers and sub operations. Considering that
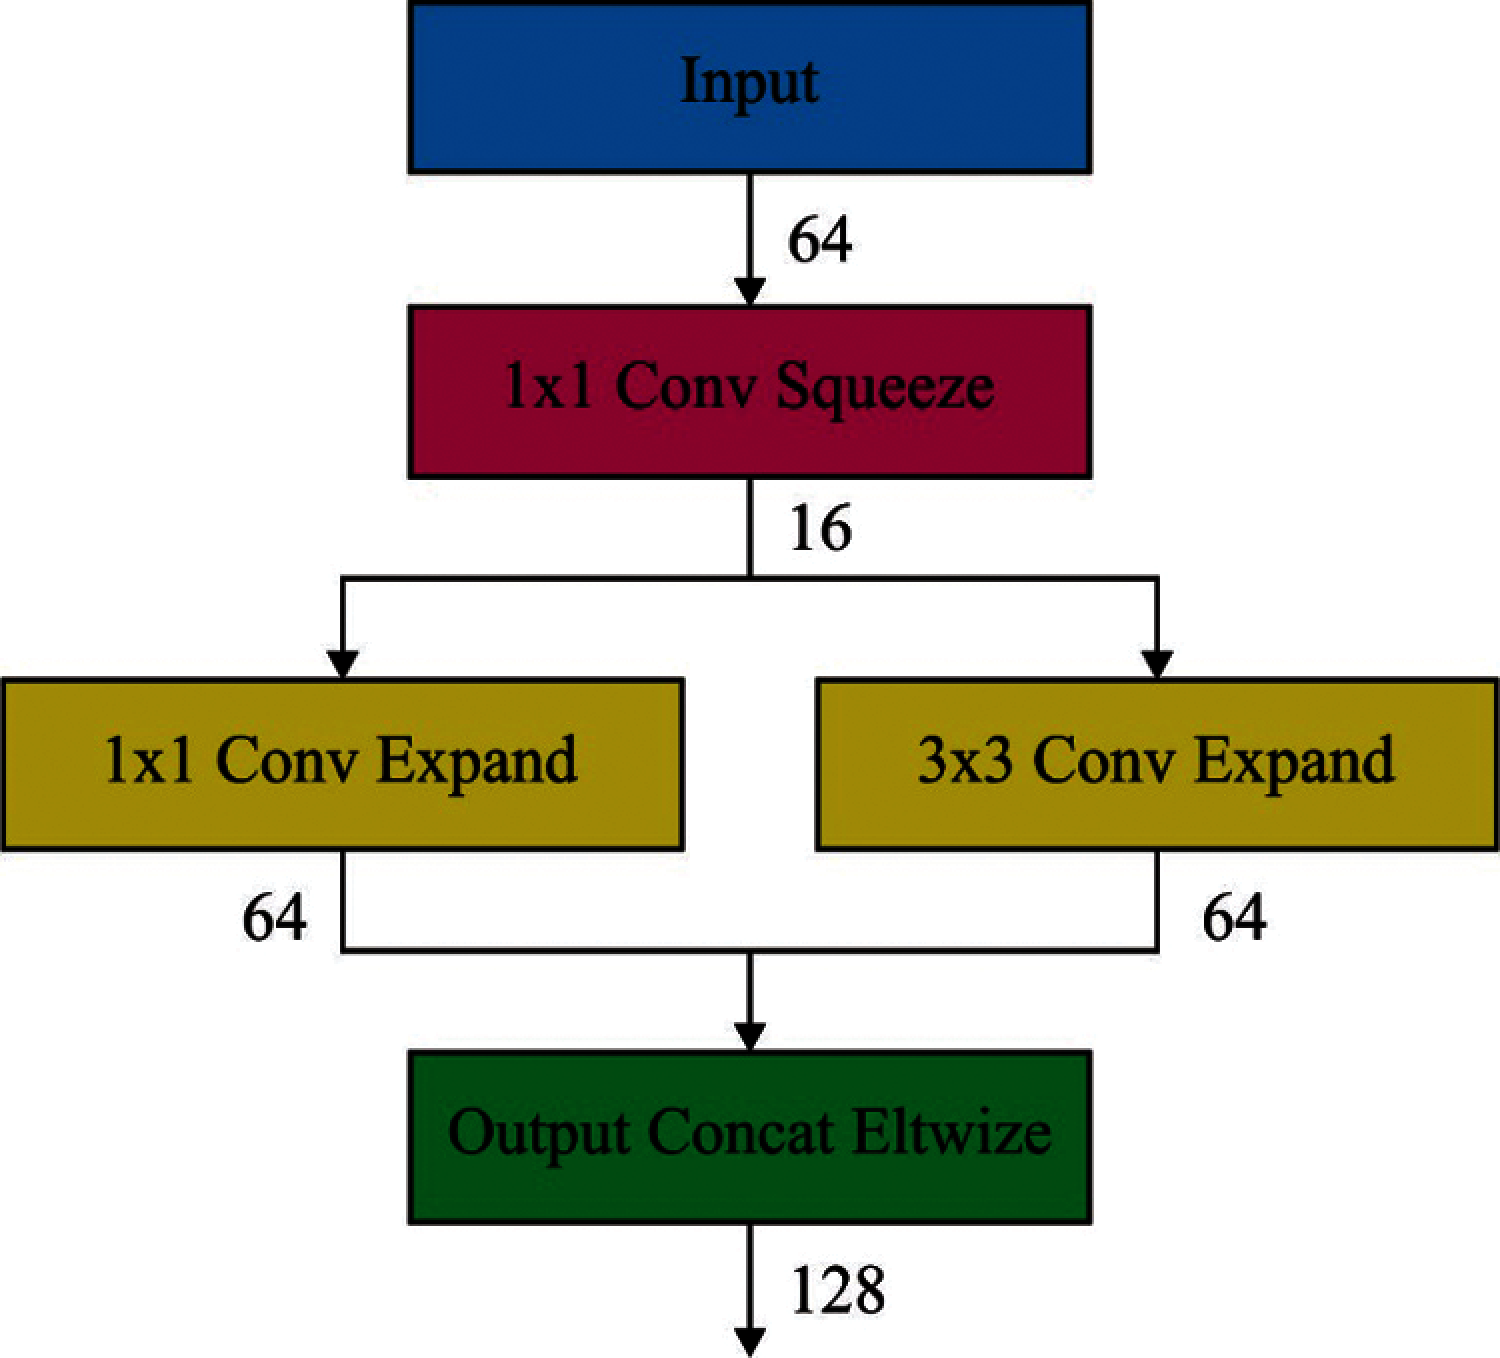
Figure 3: Structure of fire layer
At this point,
2.3 OGSO-Based Parameter Tuning
OGSO algorithm is employed in this study to adjust the hyperparameters involved in WELM model in an optimal manner. GSO is a smart swarm optimization method which is utilized on the basis of luminescent features of fireflies. In GSO method, glowworm swarm is dispersed in solution space and Fitness Function (FF) of all the positions of glowworm. The powerful glowworm shows the maximal brightness and its optimum location is made up of maximal FF rate. Glowworm has a vital line of sight called decision domain that has the density range for adjacent nodes. On the other hand, the decision radius is constrained, when glowworm travels to same kind of robust fluorescence in a decision domain. After obtaining high iteration values, all the glowworms are located in optimal position. It is limited by five stages:
• Fluoresce in concentration
• Neighbor set
• Decision domain radius
• Moving probability
• Glowworm position
The fluorescence, in concentration upgrading technique, is given as follows.
whereas
Whereas
Whereas
Whereas
Opposition Based Learning (OBL) is mainly employed from efficient optimization procedures to improve the convergence speed of distinct heuristic optimization modules. The efficient performance of OBL contributes in the evaluation of opposite and current populations in the same generation to identify an optimal candidate solution for the given problem. OBL module is efficiently employed in distinct metaheuristics to improve the speed of convergence. The module of the opposite amount should be described in OBL.
Consider
In the event of d dimension search space, the explanation may be extended as follows:
where
At the final stage, WELM classifier is applied to allocate proper class labels for the input tongue color images. ELM is utilized as the classifier of balanced dataset whereas WELM is utilized as a classifier for imbalanced dataset. Training dataset has N different instances
where
where S implies the output matrix of single hidden layers
In accordance with Karush-Kuhn-Tucker theory, Lagrangian factor has been recognized in altering the trained ELM as a dual issue. The output weights
where C signifies the regularization coefficients [19]. Hence, the output functions of ELM classification is written as follows
where
It is clear in (13) that the hidden layer feature maps
So, the KELM classifier efficiency is distributed into two parameters such as kernel function parameters,
where W represents the weight matrix. WELM has two weightage models as given below.
where
The proposed model was validated using tongue image dataset that comprises of images under different class labels namely Healthy, Chronic Kidney Disease (CKD), nephritis, verrucous gastritis, pneumonia, nephritis syndrome, chronic cerebral circulation insufficiency, upper respiratory tract infection, erosive gastritis, Coronary Heart Disease, chronic bronchitis and mixed hemorrhoid. The dataset includes 936 images with each class containing 78 images. Fig. 4 depicts the sample test images from the dataset. The parameter setting of the SqueezeNet model is given as follows. Batch size: 500, max. epochs:15 , learning rate: 0.05, dropout rate: 0.2, and momentum: 0.9.
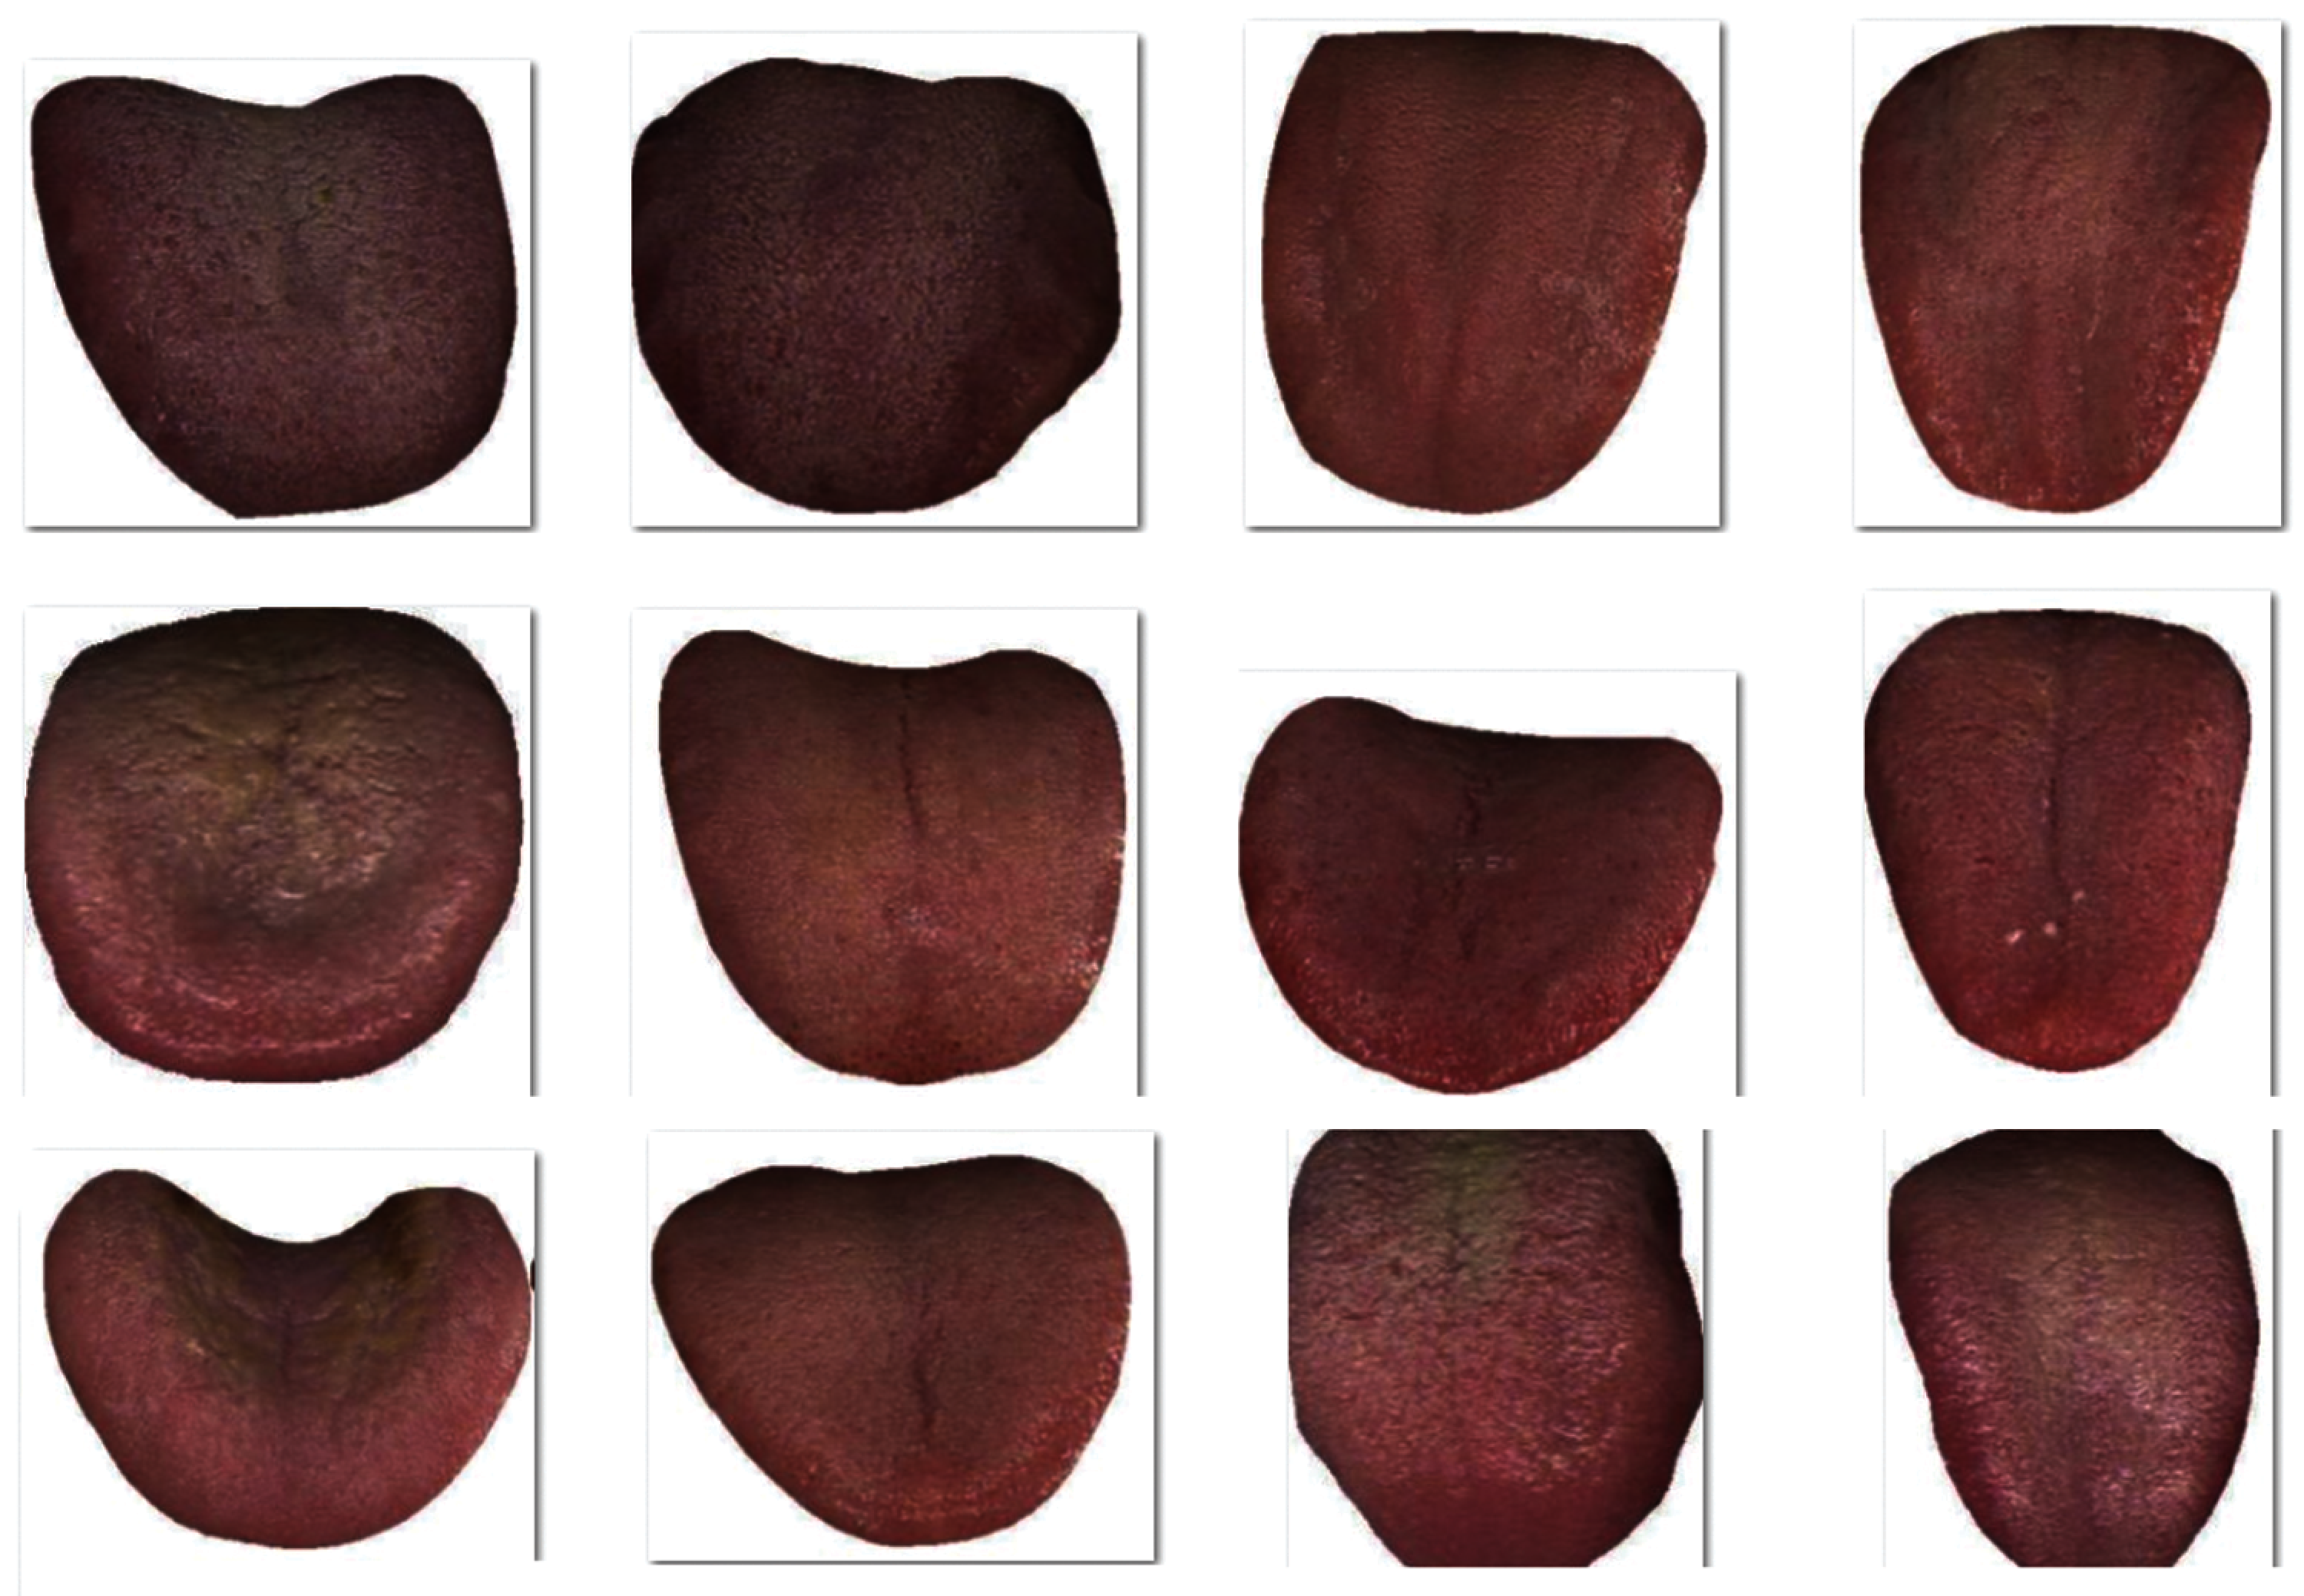
Figure 4: Sample tongue images
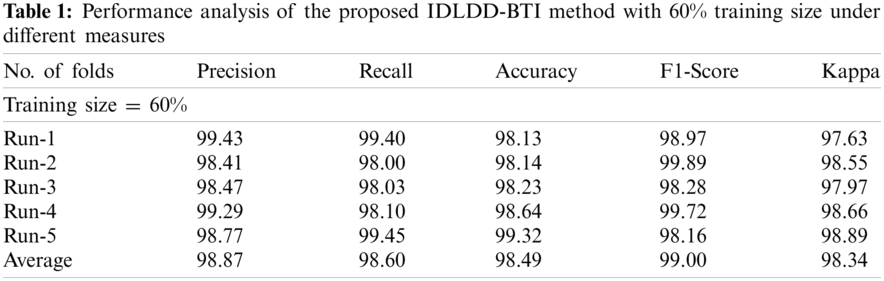
Tab. 1 and Fig. 5 shows a brief classification result attained by IDLDD-BTI technique with a training size of 60%. The outcomes exhibit that the proposed IDLDD-BTI model accomplished better results under all the runs. For instance, under run-1, the IDLDD-BTI model obtained a precision of 99.43%, recall of 99.40%, accuracy of 98.13%, F1-score of 98.97%, and kappa of 97.63%. At the same time, under run-3, the IDLDD-BTI model accomplished a precision of 98.47%, recall of 98.03%, accuracy of 98.23%, F1-score of 98.28%, and kappa of 97.97%. Moreover, under run-5, the IDLDD-BTI model obtained a precision of 98.77%, recall of 99.45%, accuracy of 99.32%, F1-score of 98.16%, and kappa of 98.89%.
Tab. 2 and Fig. 6 shows a brief classification results attained by IDLDD-BTI approach with 70% training size. The outcomes infer that IDLDD-BTI model accomplished optimum outcomes in all the runs. For instance, under run-1, the IDLDD-BTI model achieved a precision of 99.81%, recall of 95.75%, accuracy of 98.02%, F1-score of 99.03%, and kappa of 98.65%. Likewise, under run-3, the IDLDD-BTI model attained a precision of 98.88%, recall of 97.19%, accuracy of 98.54%, F1-score of 97.89%, and kappa of 97.49%. Also, under run-5, the IDLDD-BTI method accomplished a precision of 98.91%, recall of 96.56%, accuracy of 97.57%, F1-score of 98.69%, and kappa of 97.97%.
Tab. 3 and Fig. 7 shows a detailed classification result attained by IDLDD-BTI algorithm with 80% training size. The outcomes demonstrate that the proposed IDLDD-BTI model accomplished optimal outcomes under all the runs. For instance, under run-1, the IDLDD-BTI model obtained a precision of 97.56%, recall of 98.33%, accuracy of 97.64%, F1-score of 97.07%, and kappa of 96.81%. Concurrently, under run-3, IDLDD-BTI model achieved a precision of 98.54%, recall of 99.31%, accuracy of 98.89%, F1-score of 96.25%, and kappa of 95.70%. In addition, under run-5, the IDLDD-BTI method yielded a precision of 96.55%, recall of 99.30%, accuracy of 98.23%, F1-score of 99.45%, and kappa of 98.15%.
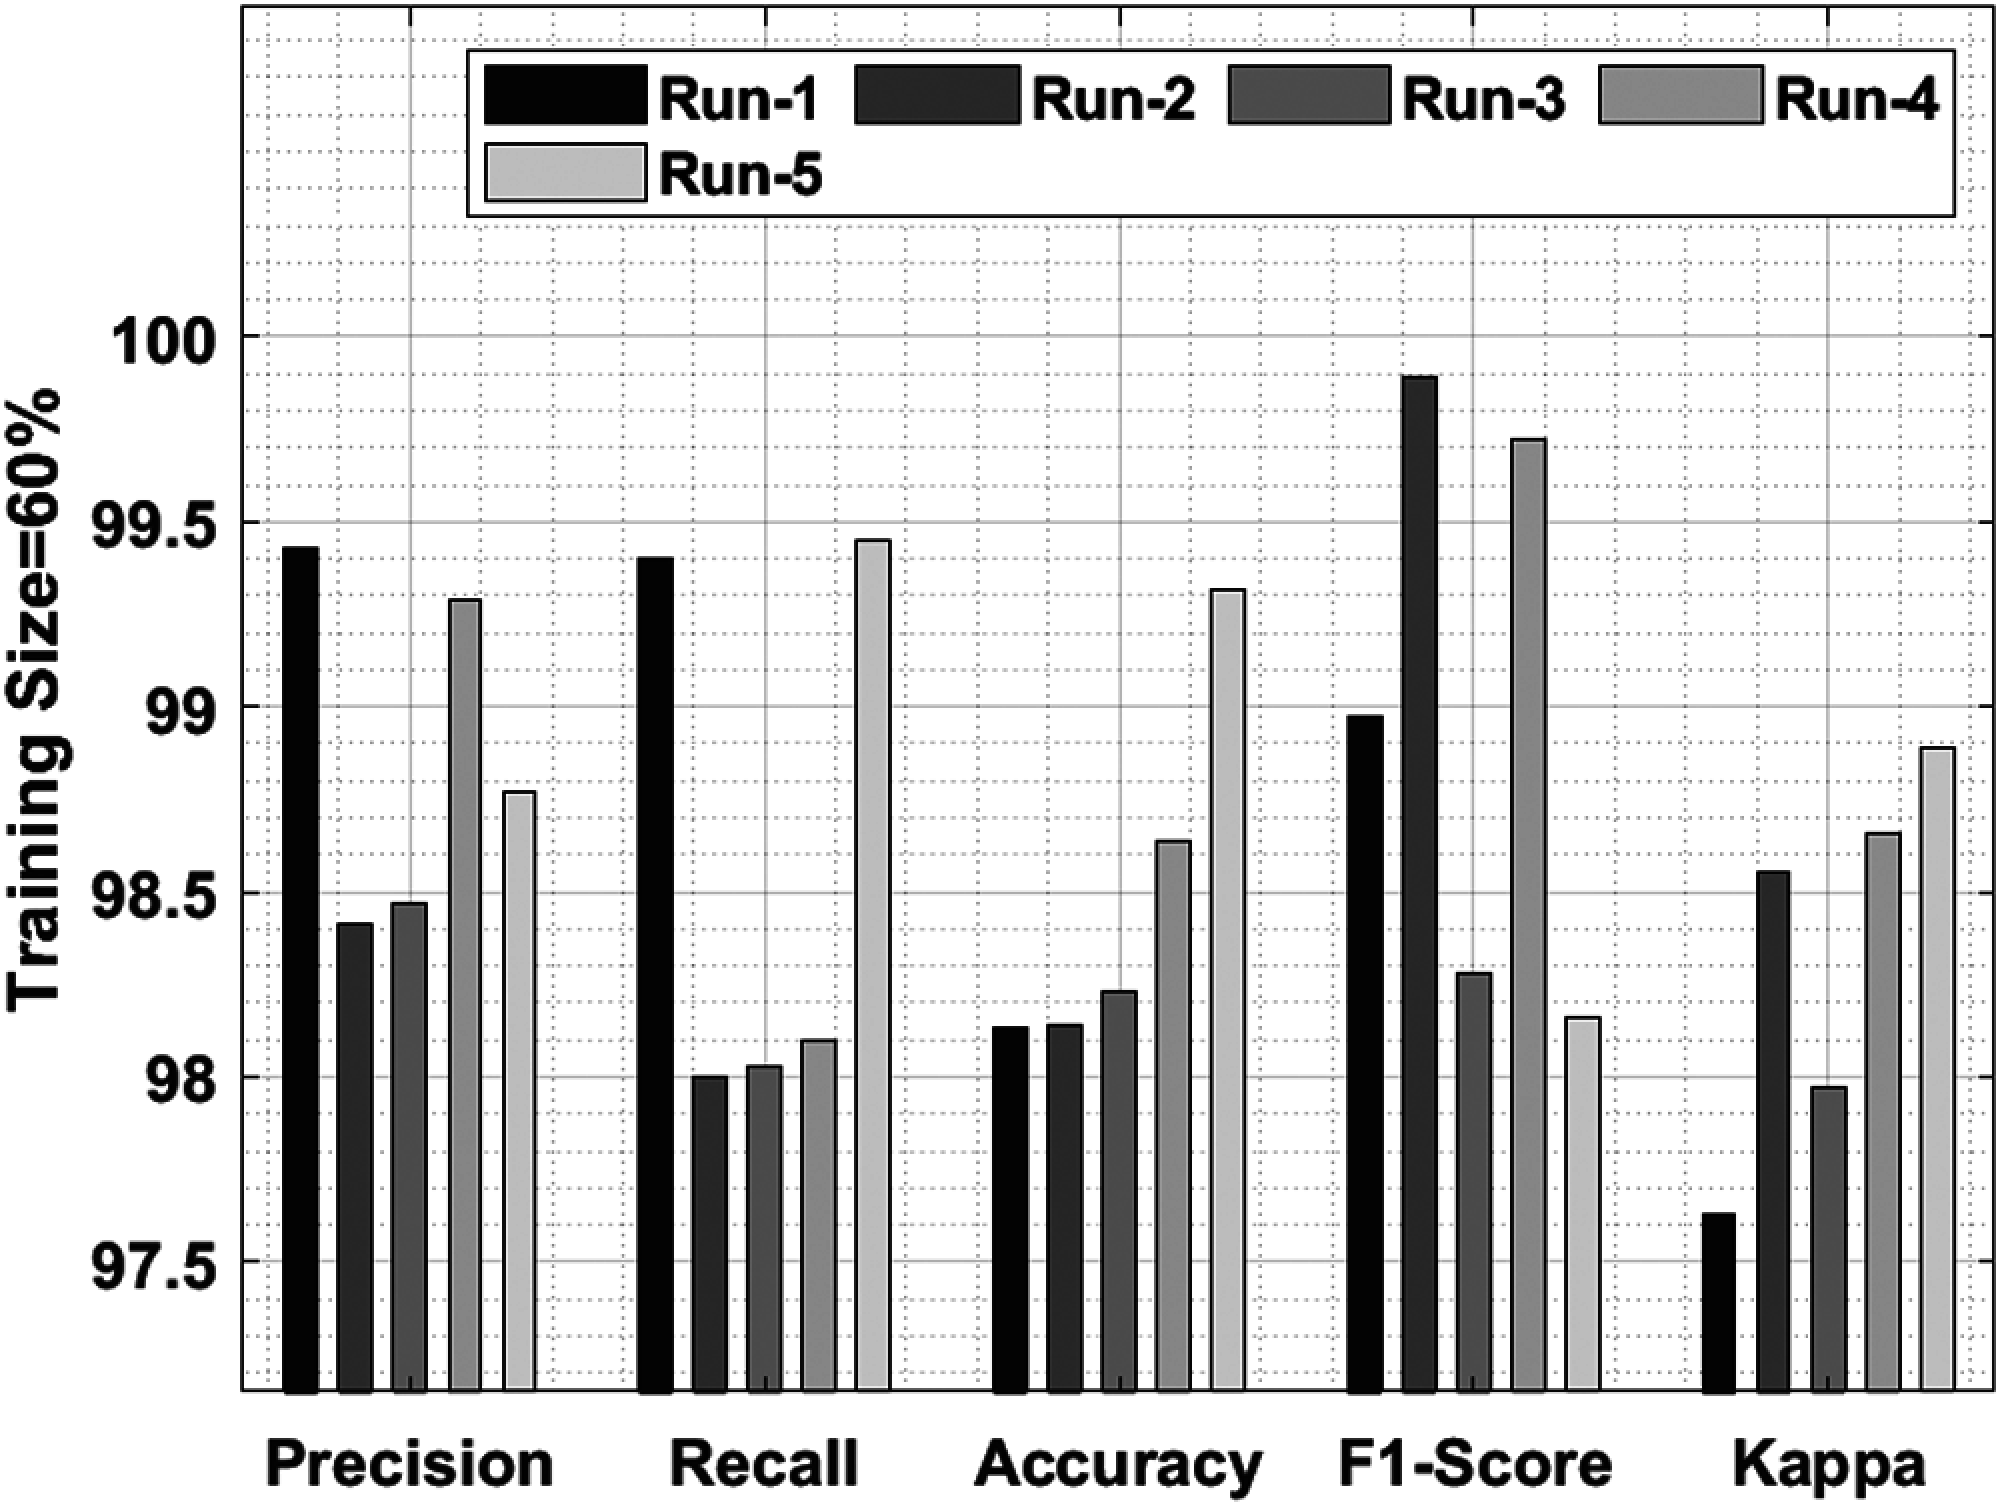
Figure 5: Results of the analysis of IDLDD-BTI model with 60% training size
Figure 6: Result analysis of IDLDD-BTI model on training size of 70%
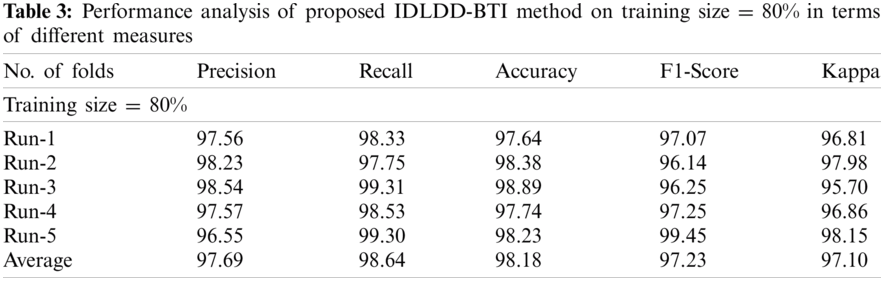
Figure 7: Result analysis of IDLDD-BTI model on training size of 80%
Tab. 4 and Fig. 8 shows the average results of analysis of IDLDD-BTI technique under varying TS. The experimental outcomes infer that the presented IDLDD-BTI technique produced a maximum average precision of 98.55%, recall of 97.90%, accuracy of 98.23%, F1-score pf 98.28%, and kappa of 97.82%.
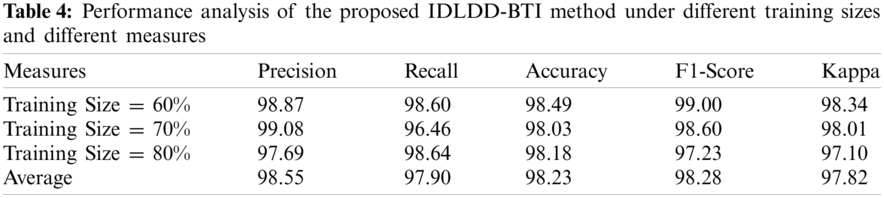
Figure 8: Results of the analysis of IDLDD-BTI model under different training sizes
A detailed comparative results of the analysis is shown in Tab. 5 and Fig. 9 to exhibit the improved diagnostic performance of IDLDD-BTI technique [20,21]. From the results, it is evident that SIFT-Decision Tree and SIFT-SVM models produced ineffective results with minimal classification outcomes. Moreover, the LBP-Decision Tree model accomplished slightly improved classifier results over earlier models. Eventually, the LBP-SVM, VGG19-Random Forest, and VGG19-Gaussian NB models demonstrated moderately closer performances. However, the proposed IDLDD-BTI method outperformed other models by accomplishing a superior performance with maximal precision of 0.99, recall of 0.98, accuracy of 0.98, F1-score of 0.98, and kappa of 0.98.
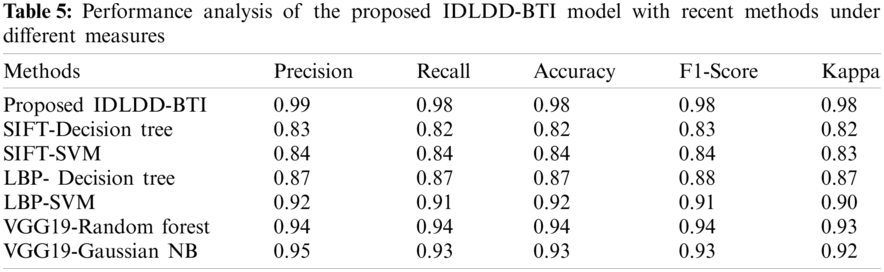
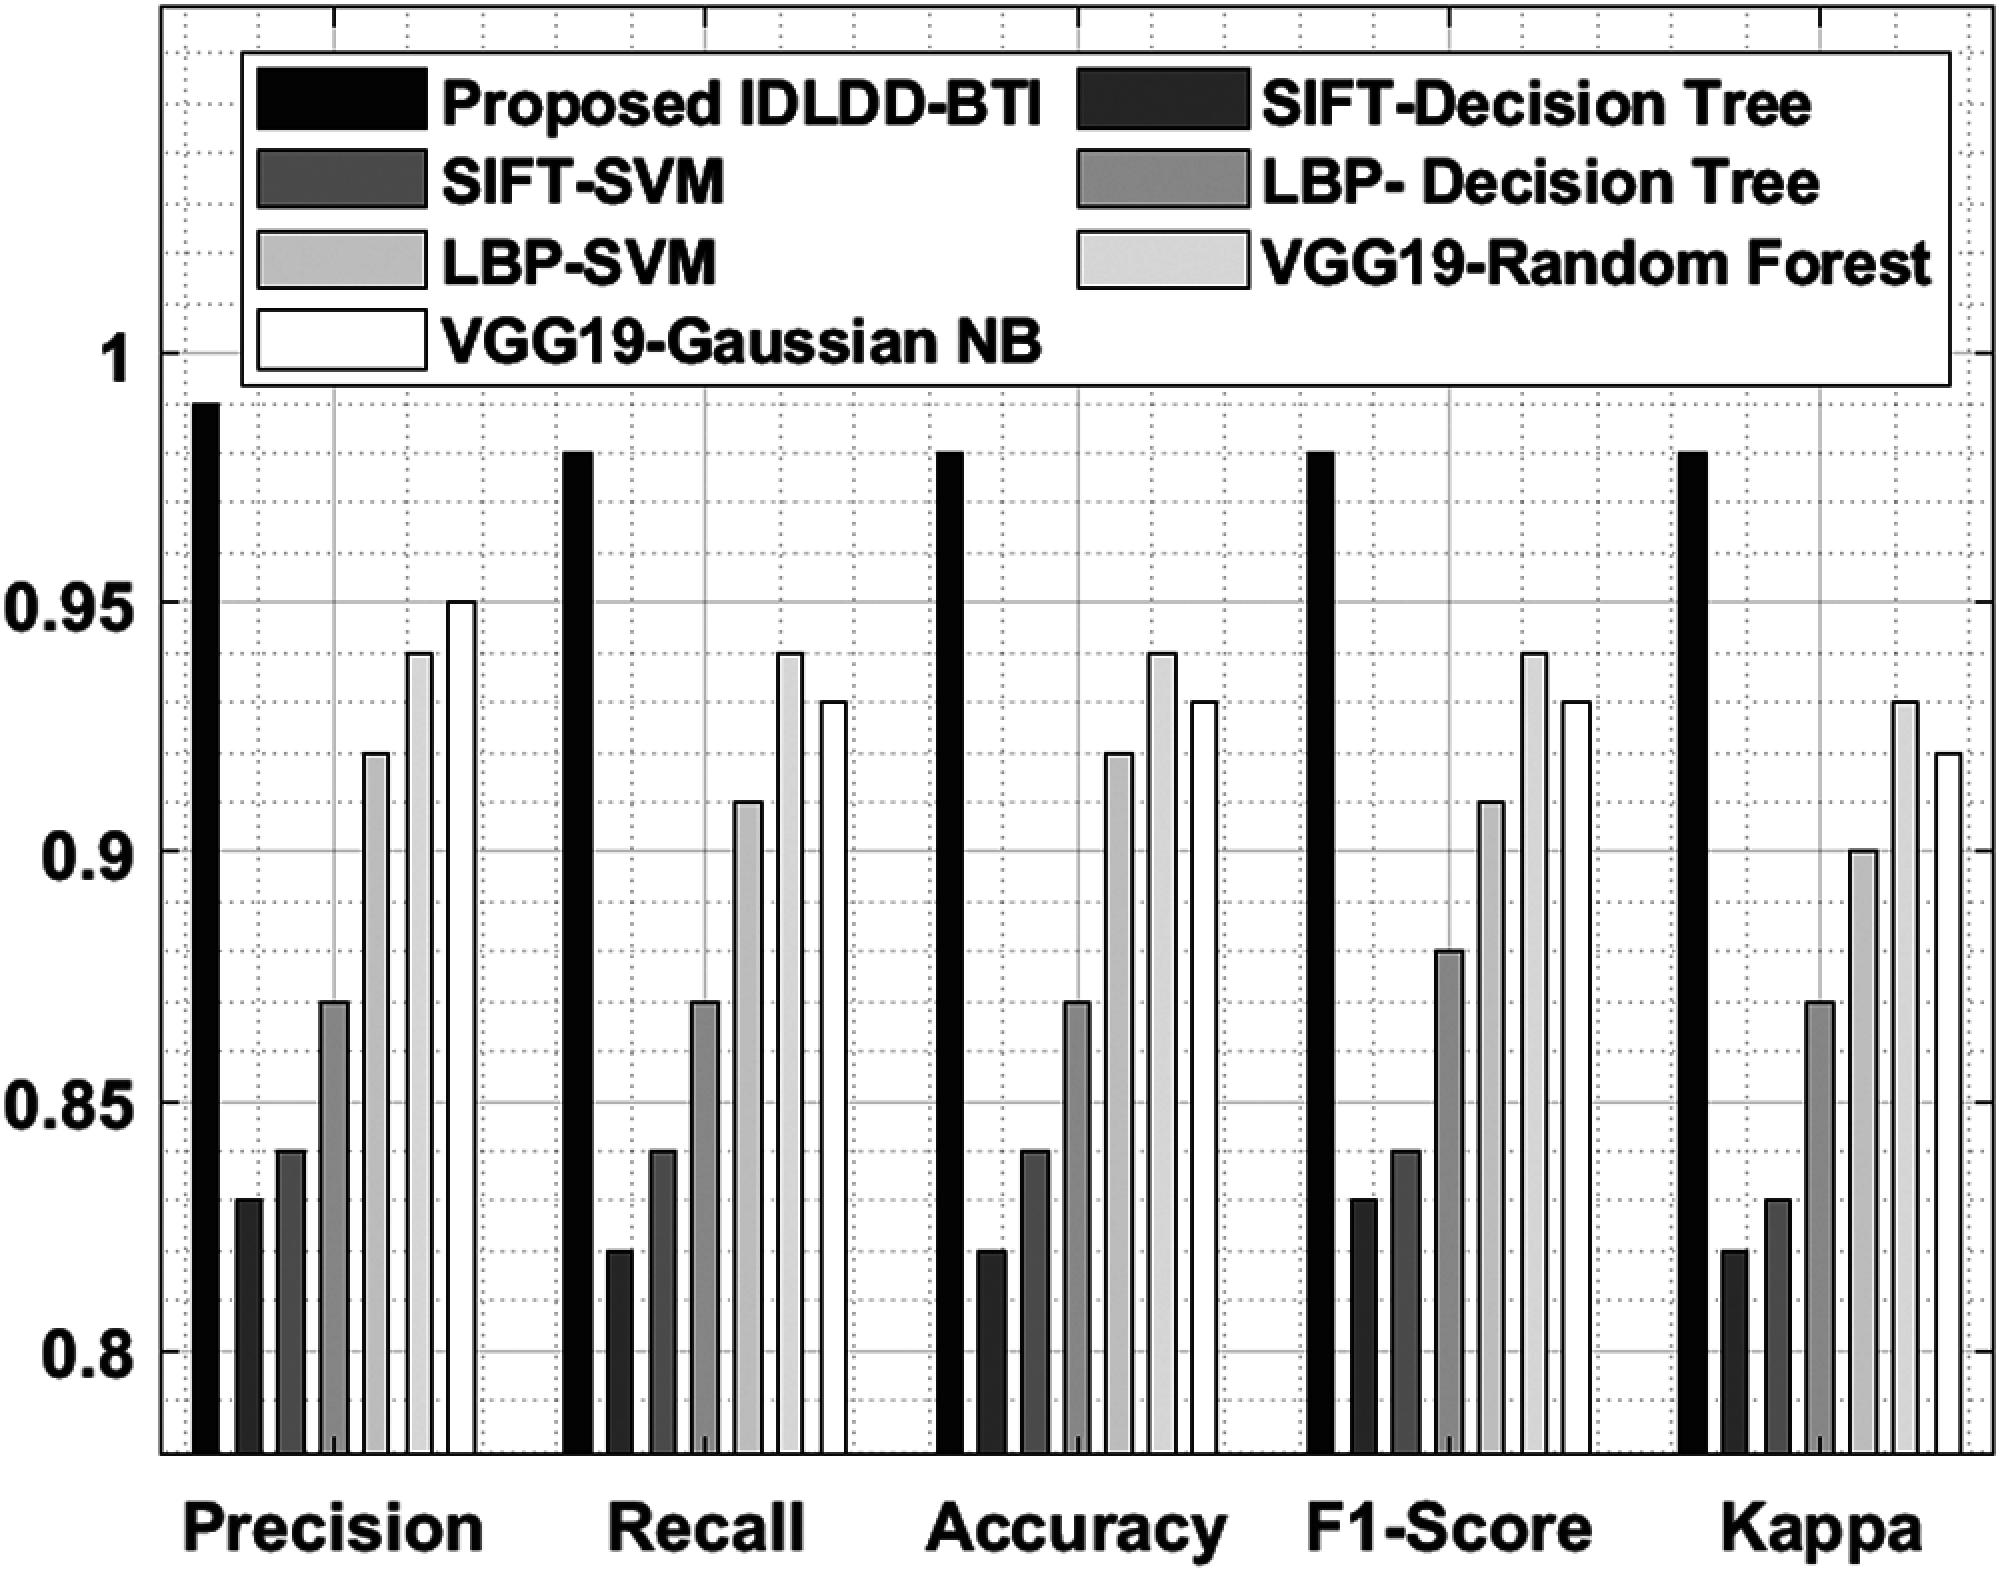
Figure 9: Comparative analysis of IDLDD-BTI model with different measures
The current research article developed a new IDLDD-BTI method to diagnose the diseases using tongue color images. The presented IDLDD-BTI model incorporates FADM-based noise removal technique, SqueezeNet-based feature extractor, OGSO-based parameter tuning, and WELM-based classification. OGSO algorithm classifier helps in fine tuning the hyperparameters of SqueezeNet model in such a way that the diagnostic performance gets considerably increased to a maximum level. In order to verify the improved diagnostic results of the presented IDLDD-BTI model, extensive experimental analysis was conducted using benchmark dataset. The resultant experimental values highlighted the supremacy of IDLDD-BTI model over existing state-of-the-art techniques. In future, the presented IDLDD-BTI model can be used as a smartphone application to diagnose patients from remote locations too.
Funding Statement: This paper was funded by the Deanship of Scientific Research (DSR), King Abdulaziz University, Jeddah, Saudi Arabia, under grant No. (D-79-305-1442). The authors, therefore, gratefully acknowledge DSR technical and financial support.
Conflicts of Interest: The authors declare that they have no conflicts of interest to report regarding the present study.
1. B. Zhang and H. Zhang, “Significant geometry features in tongue image analysis,” Evidence-Based Complementary and Alternative Medicine, vol. 2015, pp. 1–8, 2015. [Google Scholar]
2. K. Shankar, E. Perumal, P. Tiwari, M. Shorfuzzaman and D. Gupta, “Deep learning and evolutionary intelligence with fusion-based feature extraction for detection of COVID-19 from chest X-ray images,” Multimedia Systems, pp. 1–13, 2021. https://doi.org/10.1007/s00530-021-00800-x. [Google Scholar]
3. B. Huang, J. Wu, D. Zhang and N. Li, “Tongue shape classification by geometric features,” Information Sciences, vol. 180, no. 2, pp. 312–324, 2010. [Google Scholar]
4. M. T. Sadiq, X. Yu, and Z. Yuan, “Exploiting dimensionality reduction and neural network techniques for the development of expert brain–computer interfaces,” Expert Systems with Applications, vol. 164, pp. 114031, 2021. [Google Scholar]
5. J. Zhou, Q. Zhang, B. Zhang and X. Chen, “Tonguenet: A precise and fast tongue segmentation system using u-net with a morphological processing layer,” Applied Sciences, vol. 9, no. 15, pp. 3128, 2019. [Google Scholar]
6. J. Banumathi, A. Muthumari, S. Dhanasekaran, S. Rajasekaran, I. V. Pustokhina et al., “An intelligent deep learning based xception model for hyperspectral image analysis and classification,” Computers, Materials & Continua, vol. 67, no.2, pp. 2393–2407, 2021. [Google Scholar]
7. J. Ning, D. Zhang, C. Wu and F. Yue, “Automatic tongue image segmentation based on gradient vector flow and region merging,” Neural Computing and Applications, vol. 21, no. 8, pp. 1819–1826, 2012. [Google Scholar]
8. J. Ning, L. Zhang, D. Zhang and C. Wu, “Interactive image segmentation by maximal similarity based region merging,” Pattern Recognition, vol. 43, no. 2, pp. 445–456, 2010. [Google Scholar]
9. K. Wu and D. Zhang, “Robust tongue segmentation by fusing region-based and edge-based approaches,” Expert Systems with Applications, vol. 42, no. 21, pp. 8027–8038, 2015. [Google Scholar]
10. K. Shankar, E. Perumal, M. Elhoseny and P. T. Nguyen, “An iot-cloud based intelligent computer-aided diagnosis of diabetic retinopathy stage classification using deep learning approach,” Computers, Materials & Continua, vol. 66, no.2, pp. 1665–1680, 2021. [Google Scholar]
11. M. Elhoseny, M. M. Selim and K. Shankar, “Optimal deep learning based convolution neural network for digital forensics face sketch synthesis in internet of things (IoT),” International Journal of Machine Learning and Cybernetics, Jul. 2020. https://doi.org/10.1007/s13042-020-01168-6. [Google Scholar]
12. Z. Li, Z. Yu, W. Liu, Y. Xu, D. Zhang et al., “Tongue image segmentation via color decomposition and thresholding,” Concurrency and Computation: Practice and Experience, vol. 31, no. 23, pp. 1–9, 2019. [Google Scholar]
13. J. Zhang, J. Xu, X. Hu, Q. Chen, L. Tu et al., “Diagnostic method of diabetes based on support vector machine and tongue images,” BioMed Research International, vol. 2017, pp. 1–9, 2017. [Google Scholar]
14. S. Fan, B. Chen, X. Zhang, X. Hu, L. Bao et al., “Machine learning algorithms in classifying TCM tongue features in diabetes mellitus and symptoms of gastric disease,” European Journal of Integrative Medicine, vol. 43, pp. 101288, 2021. [Google Scholar]
15. X. Wang, J. Liu, C. Wu, J. Liu, Q. Li et al., “Artificial intelligence in tongue diagnosis: Using deep convolutional neural network for recognizing unhealthy tongue with tooth-mark,” Computational and Structural Biotechnology Journal, vol. 18, pp. 973–980, 2020. [Google Scholar]
16. D. Meng, G. Cao, Y. Duan, M. Zhu, L. Tu et al., “Tongue images classification based on constrained high dispersal network,” Evidence-Based Complementary and Alternative Medicine, vol. 2017, pp. 1–12, 2017. [Google Scholar]
17. V. Thirilogasundari, V. S. Babu and S. A. Janet, “Fuzzy based salt and pepper noise removal using adaptive switching median filter,” Procedia Engineering, vol. 38, pp. 2858–2865, 2012. [Google Scholar]
18. F. Ucar and D. Korkmaz, “COVIDiagnosis-net: Deep bayes-squeezenet based diagnosis of the coronavirus disease 2019 (covid-19) from X-ray images,” Medical Hypotheses, vol. 140, pp. 109761, 2020. [Google Scholar]
19. H. Zhu, G. Liu, M. Zhou, Y. Xie, A. Abusorrah et al., “Optimizing weighted extreme learning machines for imbalanced classification and application to credit card fraud detection,” Neurocomputing, vol. 407, pp. 50–62, 2020. [Google Scholar]
20. S. Rajakumaran and J. Sasikala, “An efficient machine learning based tongue color analysis for automated disease diagnosis model,” International Journal of Advanced Research in Engineering and Technology, vol. 11, no. 12, pp. 718–734, 2020. [Google Scholar]
21. J. Sasikala and S. Rajakumaran, “An automated tongue color image analysis for disease diagnosis and classification using deep learning techniques,” European Journal of Molecular & Clinical Medicine, vol. 7, no. 7, pp. 4779–4796, 2021. [Google Scholar]
 | This work is licensed under a Creative Commons Attribution 4.0 International License, which permits unrestricted use, distribution, and reproduction in any medium, provided the original work is properly cited. |