DOI:10.32604/cmc.2022.021107
| Computers, Materials & Continua DOI:10.32604/cmc.2022.021107 | |
| Article |
Multi-View Multi-Modal Head-Gaze Estimation for Advanced Indoor User Interaction
1Department of Computer Engineering, Kumoh National Institute of Technology, Gumi, 39177, Korea
2Department of Data Science, Seoul National University of Science and Technology, Seoul, 01811, Korea
*Corresponding Author: Jin-Woo Jeong. Email: jinw.jeong@seoultech.ac.kr
Received: 23 June 2021; Accepted: 07 August 2021
Abstract: Gaze estimation is one of the most promising technologies for supporting indoor monitoring and interaction systems. However, previous gaze estimation techniques generally work only in a controlled laboratory environment because they require a number of high-resolution eye images. This makes them unsuitable for welfare and healthcare facilities with the following challenging characteristics: 1) users’ continuous movements, 2) various lighting conditions, and 3) a limited amount of available data. To address these issues, we introduce a multi-view multi-modal head-gaze estimation system that translates the user’s head orientation into the gaze direction. The proposed system captures the user using multiple cameras with depth and infrared modalities to train more robust gaze estimators under the aforementioned conditions. To this end, we implemented a deep learning pipeline that can handle different types and combinations of data. The proposed system was evaluated using the data collected from 10 volunteer participants to analyze how the use of single/multiple cameras and modalities affect the performance of head-gaze estimators. Through various experiments, we found that 1) an infrared-modality provides more useful features than a depth-modality, 2) multi-view multi-modal approaches provide better accuracy than single-view single-modal approaches, and 3) the proposed estimators achieve a high inference efficiency that can be used in real-time applications.
Keywords: Human-computer interaction; deep learning; head-gaze estimation; indoor monitoring
Since the outbreak of COVID-19, governmental bodies worldwide announced that, to limit the spread of the virus, noncontact interactions should be established between people [1]. Noncontact interaction is essential for medically vulnerable people (e.g., the elderly, patients, or the disabled, as shown in Fig. 1) who can be easily infected by the virus [2].
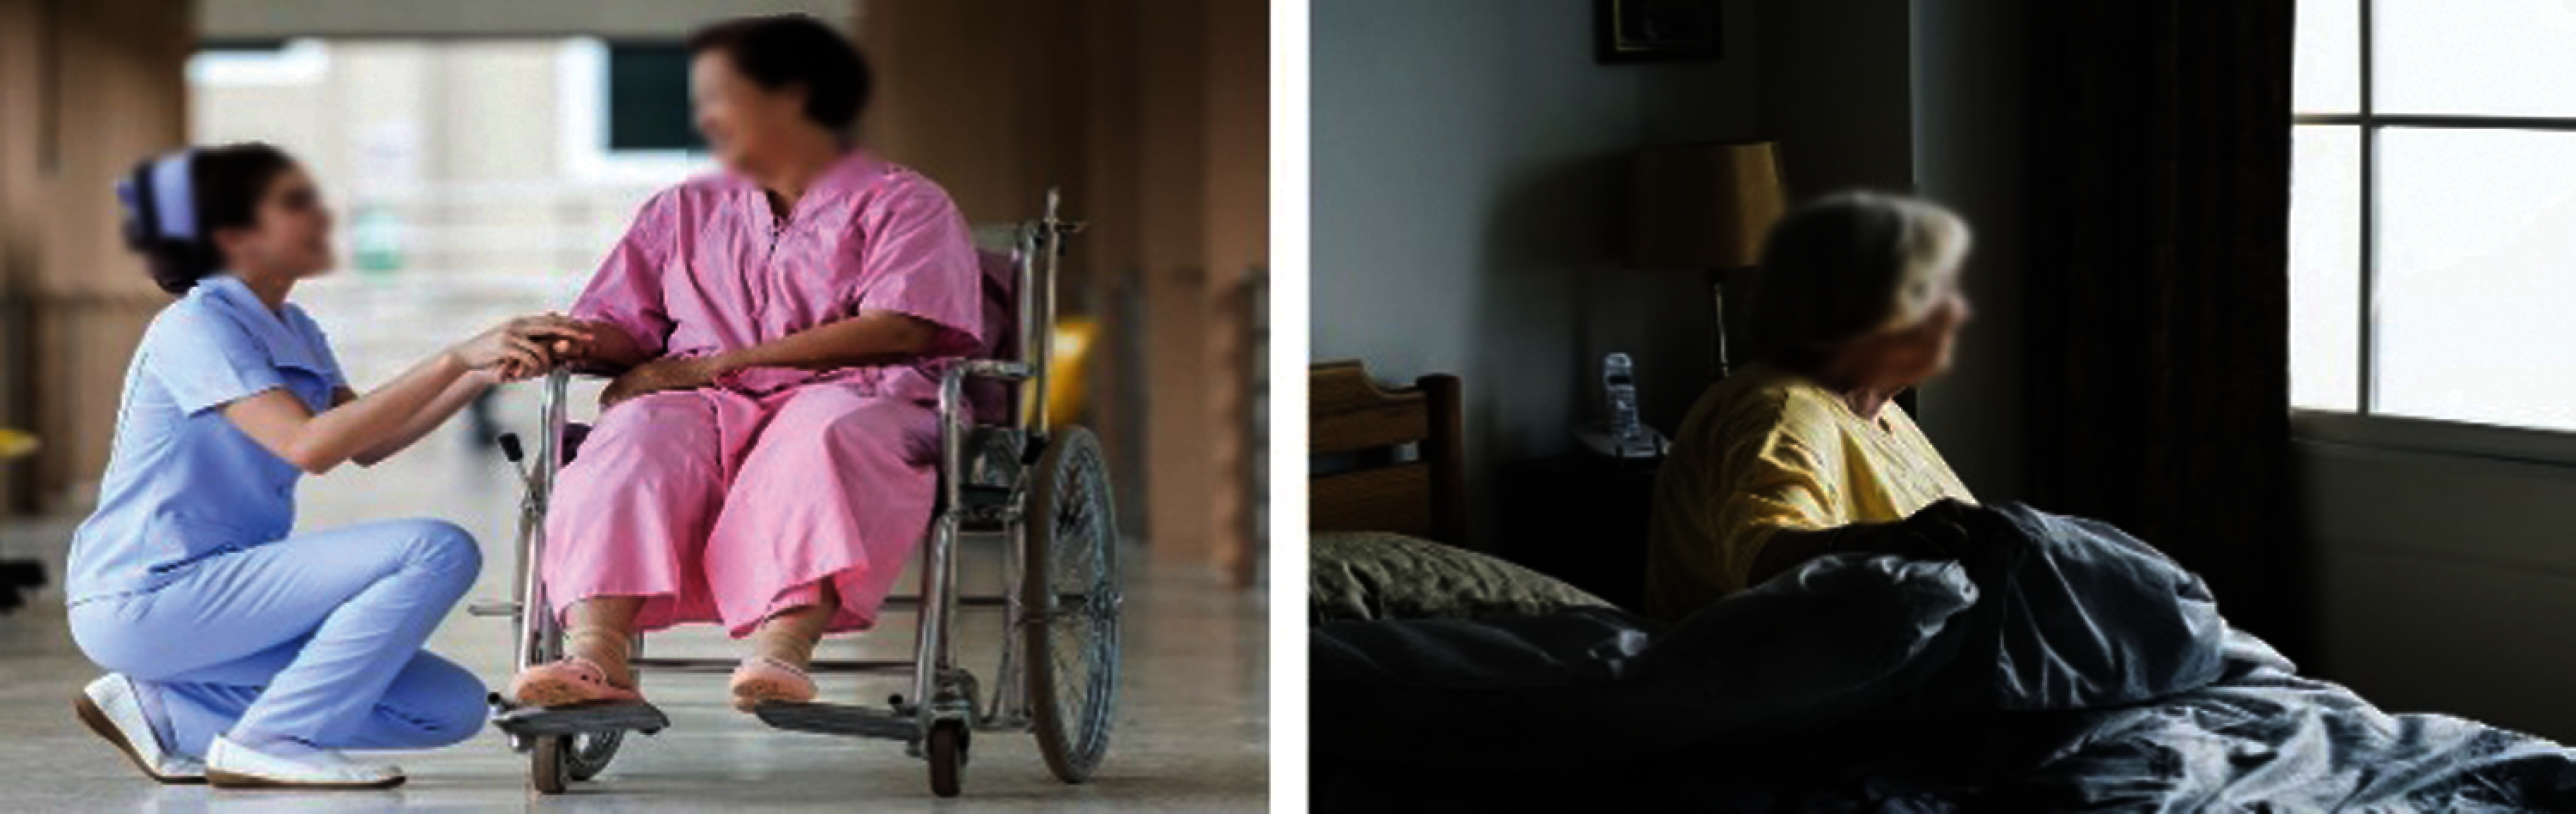
Figure 1: Examples of medically vulnerable people
Accordingly, medical welfare facilities (e.g., hospitals and nursing homes) have begun to limit face-to-face care and contact visits [3]. Although non-contact interaction will be effective in preventing the medically vulnerable from contracting the virus, it makes continuous monitoring of their statuses and conditions challenging. Therefore, it is essential to develop more effective and advanced noncontact interaction techniques to monitor and predict the health status, intentions, and behaviors of people in the welfare domain.
As shown in Fig. 2, many researchers have attempted to develop contactless monitoring systems for various applications. Previous methods for monitoring people can be divided into 1) vision-based [4–13], 2) wearable-based [14–21], and 3) head-gaze-based technologies [22–31]. Vision-based methods usually detect and track the pose or movements of medically vulnerable people using user images captured by cameras. References [4–6] mainly detected the fall status of a person using a deep learning network or image processing algorithm. In addition, various approaches have attempted to recognize their behaviors (e.g., sitting, standing, and lying) [8,9] or analyze their sleep patterns [11,12]. In contrast, wearable-based systems monitor user conditions using wearable sensors or hand bands to measure the heart rate, blood pressure, and body temperature of users [17–21]. With wearable-based methods, physiological data can be acquired without the assistance of caregivers or nurses. However, these approaches mainly focused on monitoring the user's behaviors or status, so that they still lack the interactive features, such as understanding user intents and predicting user's interests, which are particularly essential for the users in welfare facilities.
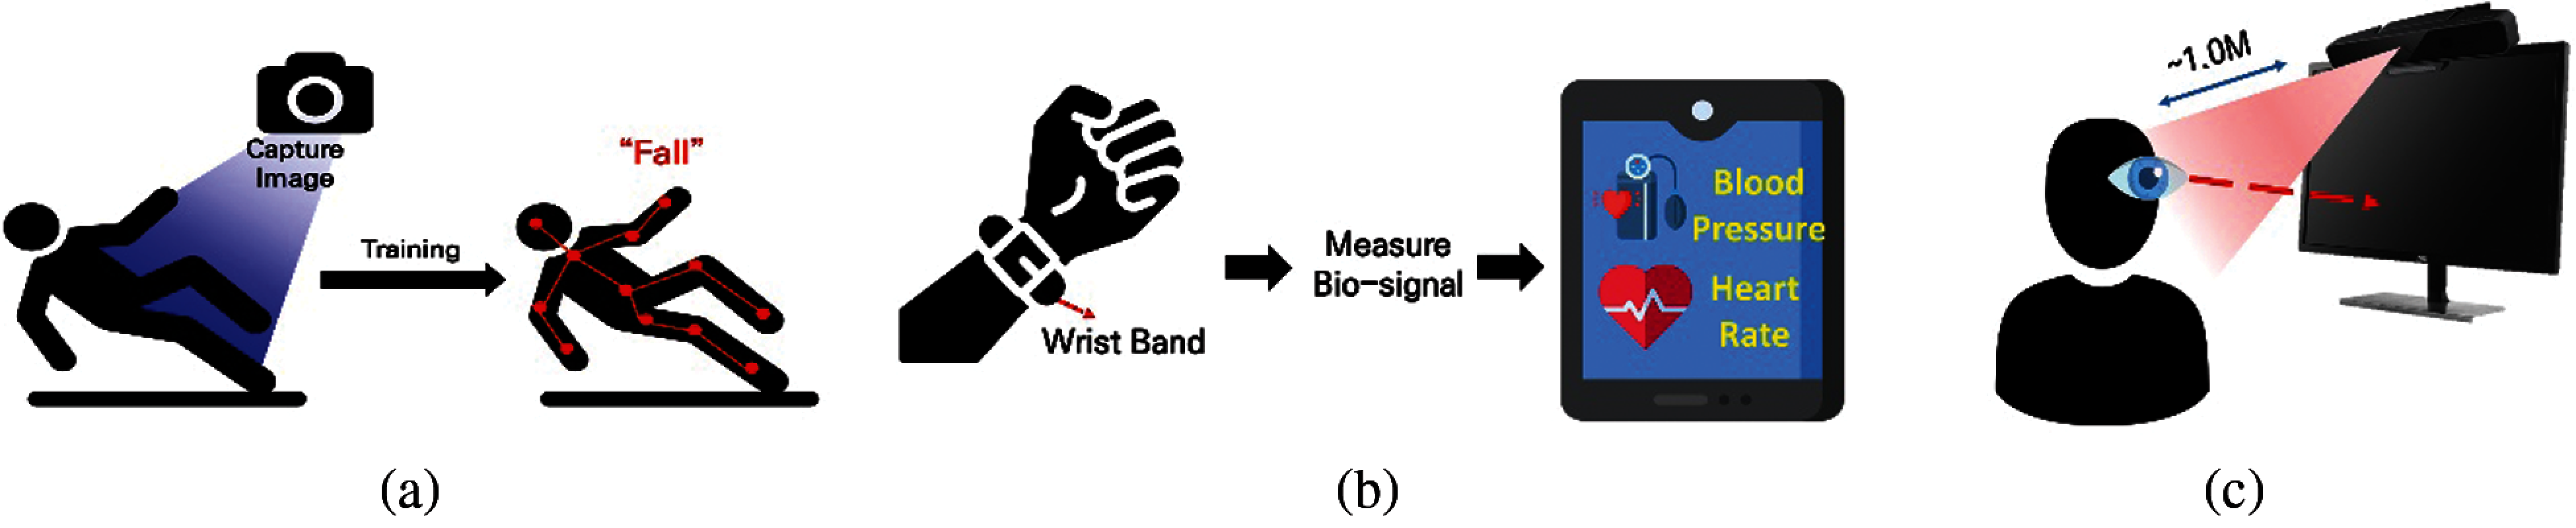
Figure 2: Examples of contactless monitoring systems (a) Vision-based method (b) Wearable-based method (c) Gaze-based method
In recent years, gaze estimation has been considered one of the most promising interaction technologies for monitoring and predicting user intentions and behaviors because it is based on the assumption that users look at a certain area with particular attention or interest. Conventional gaze-based methods mainly focus on fine-grained gaze estimation. For example, they compute the values of yaw, roll, and pitch of the user gaze direction to predict a point (coordinates) on a monitor screen where the user gazes at [32–34] (see Fig. 3a). These methods usually utilize deep learning techniques or geometric eye models to compute the gaze point from the eye feature. However, because they require the use of handheld/nearby devices, such as monitors, laptops, mobile phones, and tablets, they are not suitable for the target domain of this study, where natural indoor monitoring and interaction is needed. On the other hand, another type of gaze estimation technology called head-gaze estimation utilizes the head orientation of users. This approach attempts to predict an indoor predefined zone or area that the user is looking at, rather than a specific point on the monitor screen. For example, head-gaze estimation systems estimate where a user is looking (e.g., a side or rear mirror, etc.) while driving a vehicle [22–31] (refer to Fig. 3b). Even though these systems attempted to interact with users by estimating the head-gaze direction, there still exists a limitation that they are also targeted to a confined and controlled environment such as an in-vehicle setup. Therefore, the existing systems are not suitable for our target domain (welfare facilities), which has the following challenging conditions: 1) (head-) gaze estimation should be extended to support an indoor, 2) various lighting conditions must be handled, and 3) only a limited data size can be used.
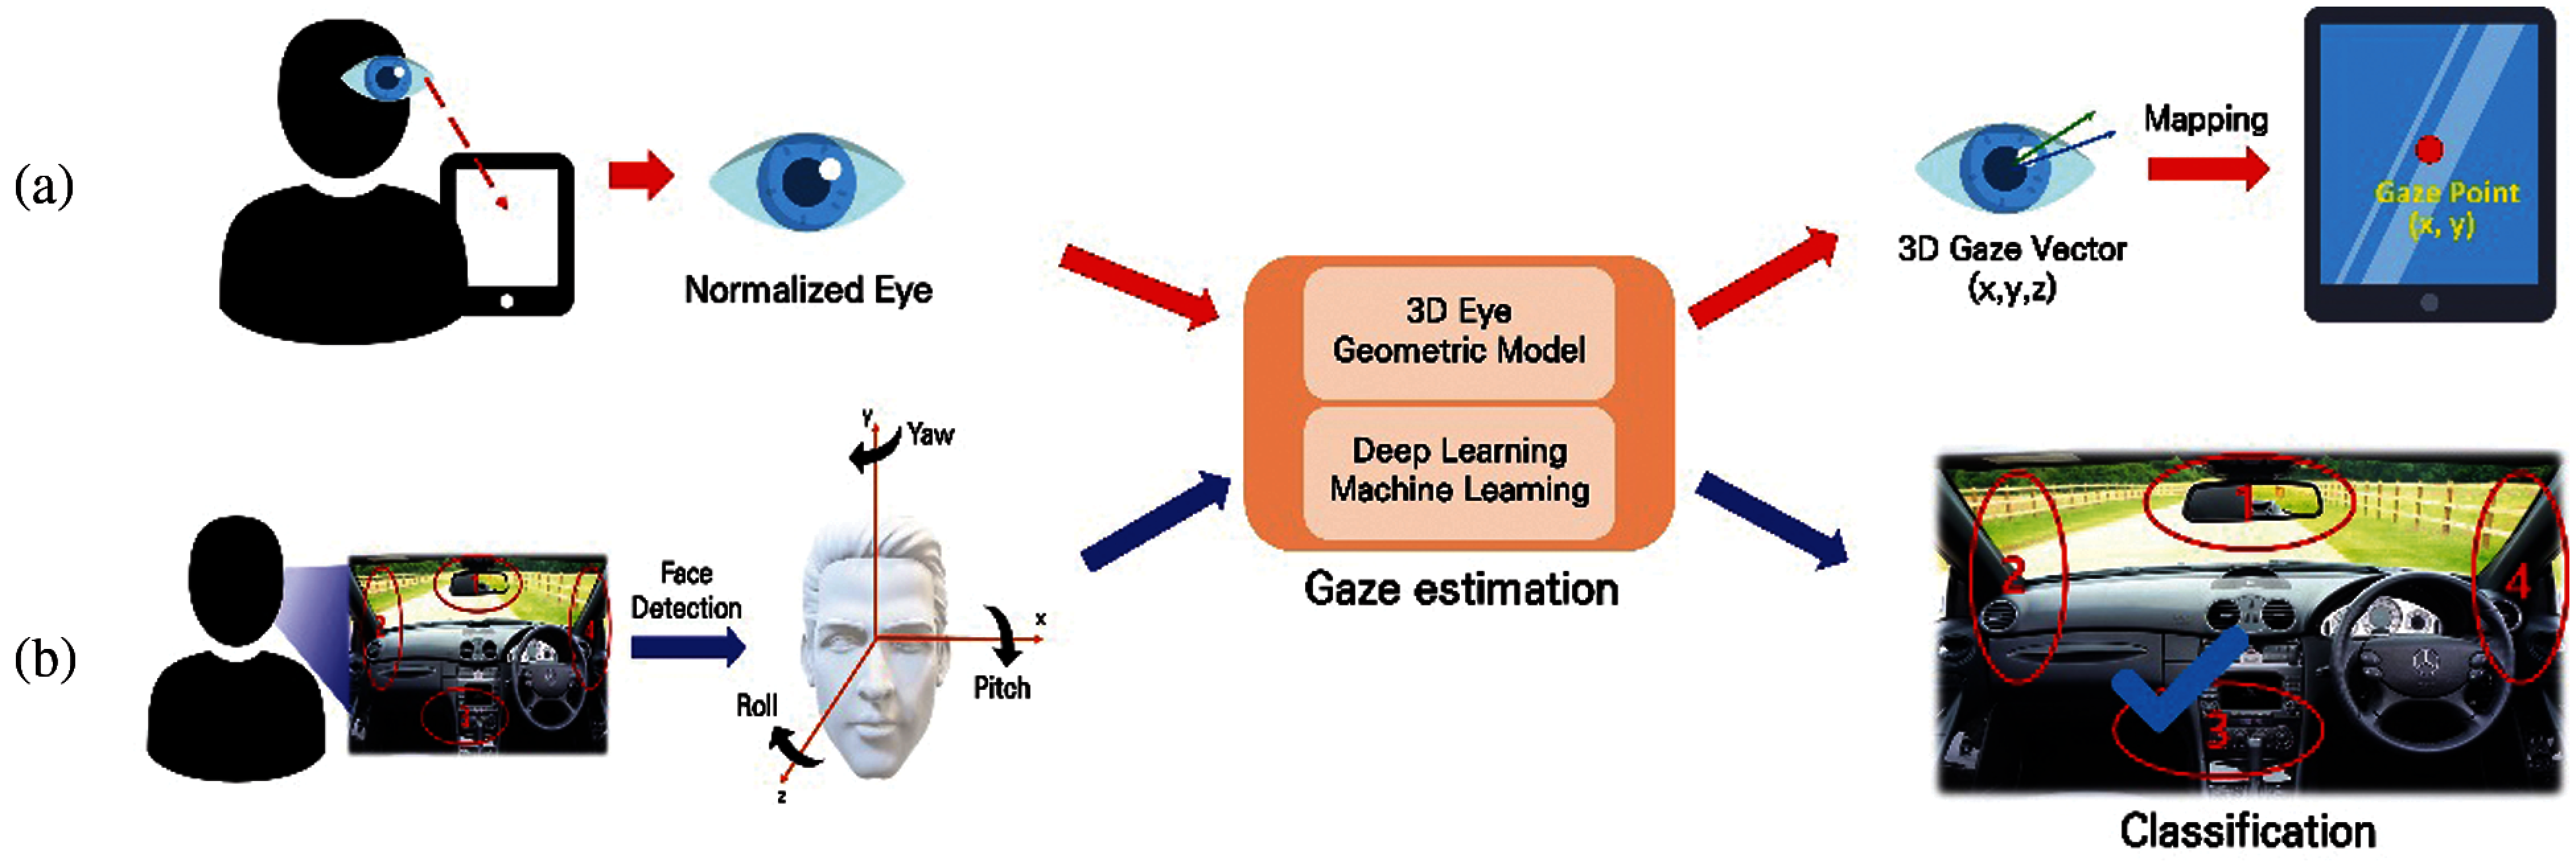
Figure 3: Example of conventional (a) gaze-based and (b) head-gaze-based methods
To address the limitations of the previous approaches, we introduce an indoor user monitoring and interaction system based on the multi-view multi-modal head-gaze estimation. In the proposed approach, user images are captured by multiple cameras with depth and infrared modalities; subsequently, the head-gaze direction of users is estimated through deep learning architectures. Based on head-gaze estimation, which is a proxy of user gaze direction, we attempt to interact with users more naturally in an indoor environment. In addition, we exploit depth and infrared imaging modalities, which are more robust to changes in lighting conditions, to handle various situations (e.g., nighttime and blackout). Finally, we adopt a multi-view, multi-modal approach to overcome the problem of a limited amount of data by capturing the various perspectives of a user. A few studies have examined interactive head-gaze estimation techniques that use a multi-view or multi-modal approach [22,35]. For example, Yoon et al. [22] tried to estimate the head-gaze direction using two cameras (i.e., frontal and side views) with infrared modality, and Lian et al. [35] predicted the user gaze direction using RGB images captured in three views. Although various multi-view or multi-modal approaches have been studied for head-gaze estimation, the effects of the view and modality configurations on the overall performance of head-gaze estimation systems still need to be investigated in depth.
In this study, we analyze the differences in the performance of the proposed system under various camera configurations (i.e., views) and modalities in terms of accuracy and efficiency. In particular, we conduct various experiments to answer the following research questions.
• Which modality performs well in both single-view and multi-view approaches?
First, we examine which modality (i.e., depth or infrared image) would be more effective in single-view and multi-view setups. The answer to this question will provide a basic insight into the use of image modality for head-gaze estimation under challenging conditions.
• Does the multi-view approach yield better performance than the single-view approach?
Conventionally, it has been often observed that the multi-view approach performs better than the single-view approach in various tasks, such as object recognition, pose estimation, and so on. However, the effects of using multiple views on the performance of head-gaze estimation in the welfare domain remain unclear. Therefore, we investigate whether this assumption can also be applied to our problem domain.
• Does the multi-modal approach perform better than the single-modal approach?
The multi-modal approach is generally considered more effective than the single-modal approach in various domains. In this study, we verify this assumption in terms of single or multi-view head-gaze estimation. To this end, we applied three approaches to combine the image modalities: i) data-level, ii) feature-level, and iii) modal-wise. The data-level method combines the depth and infrared images directly before feeding them to the estimation network. The feature-level method concatenates the intermediate convolution neural network (CNN) features of each modality in each view before the final prediction layers. The modal-wise method concatenates the intermediate CNN features of the same modality across multiple views. Further details on the methods used to exploit multi-modal data are discussed in Section 4.4.
The remainder of this paper is organized as follows. Section 2 reviews related studies and Section 3 describes the data collection procedure. The details of the proposed approach are described in Section 4. Section 5 presents the experimental results for each research question, and Section 6 discusses the performance of the proposed method in terms of efficiency. Finally, we present our conclusions and future research directions in Section 7.
As mentioned in the Introduction, many contactless monitoring and interaction methods have been presented and integrated into various applications. The previous methods can be divided into the following: 1) vision-based systems, 2) wearable-based systems, and 3) head-gaze-based systems. In this section, we briefly review the characteristics of conventional methods and compare them with the proposed method.
Vision-based systems monitor users using images captured by RGBD cameras. These methods mainly focus on fall detection, behavior monitoring, and analysis of sleep patterns. First, [4–7] proposed a fall detection system based on user images. These systems observed user movements by capturing RGB and depth images in an indoor environment with bright lighting conditions. The captured images were fed to a vision-based deep learning network that was trained to detect the fall status. Next, [8–10] monitored user behavior in a care room by capturing users or detecting a bed. In Nari et al. [8], a care room was divided into three zones, namely, relaxing, walking, and toilet zones; next, the system identified the location of the elderly and monitored their behaviors (e.g., sitting, standing, and lying). In addition, [9,10] detected a bed in a care room by capturing RGB images from multiple views and capturing videos using a monocular camera, respectively. Subsequently, whether the patients were leaving their beds was monitored. Some approaches have analyzed the sleep patterns of users for medical care purposes. In Torres et al. [11], the RGB and depth images of a patient were captured in three views; and in [12,13], the depth images of users lying in their beds were captured. The captured images were then fed to a vision-based deep learning network to extract the features of the sleep patterns of the users. The previous vision-based systems presented various methods for contactless interaction using cameras; however, they were only limited to monitoring the status of a care room or detecting the simple movements or behavior patterns of users.
Wearable-based approaches attempt to directly measure the bio-signals and movement patterns of users to detect and predict their conditions. In [14–16], fall detection systems with a wearable band prototype equipped with accelerometers and gyroscope sensors were presented. The sensor data measured by the device were transformed using various filtering methods and transmitted to the fall detection system. However, gyroscope and accelerometer sensors are sensitive to noise, and inertial measurement unit (IMU)-based approaches often struggle to find appropriate filtering methods to guarantee acceptable performance. In contrast, [17,18] attempted to monitor the health status of users by detecting an abnormal heart rate with an electrocardiogram (ECG) sensor. In [14,19,20], the heart rate of users was monitored through a wearable wrist band equipped with a set of sensors. If an abnormal status was detected, the system transmitted an alarm signal or information to the emergency center through a mobile application [14,19] or displayed the measured bio-signal on a thin-film transistor-liquid crystal display (TFT-LCD) screen [20]. Similarly, Arai [21] measured not only the heart rate but also blood pressure, oxygen saturation, and body temperature to monitor user status. In Arai [21], a multi-modal system for measuring various vital signs, including electroencephalography (EEG) and electromyography (EMG), was proposed. Although various wearable systems have successfully detected the conditions and status of users, they still suffered from the limitation that the user needs to wear sensor devices to measure their bio-signals.
As stated in the Introduction, head-gaze is a proxy of user gaze direction computed based on the head orientation of users, a useful indicator that does not require precise calibration to represent the interests and intentions of users [22]. Previous studies on the estimation of head-gaze mainly focused on monitoring the status of users (e.g., whether the user is concentrating) while driving [22–31]. These studies first divided the in-vehicle space into multiple zones (e.g., right mirror, rear-view mirror, and speed meter areas). Afterward, a single camera was installed on the dashboard of a vehicle to capture RGB images of the driver’s face while looking at certain in-vehicle zones. Finally, the authors of [23–27] trained a deep learning model and conventional machine learning algorithms using the captured RGB images to estimate the head-gaze direction. In addition, the authors of [28–30] collected the depth, infrared images, or 3D point cloud data of a driver, which are not primarily affected by lighting conditions, to estimate the direction of the driver’s head-gaze. In particular, [22,31] captured drivers in multiple views (i.e., frontal and side-views) with an RGB or an infrared modality to monitor their attention while driving. For example, the authors of [31] placed cameras in front and on top of the driver to capture the facial features and mimic the driver’s view, respectively.
However, these methods still have several limitations; they only work in a limited environment with a short-distance setup between the user and camera (e.g., in-vehicle) as well as in stable lighting conditions. In addition, they usually require a large amount of data for training gaze estimators; however, it is particularly difficult to collect dataset in the welfare and healthcare domains. Therefore, it is considered that the existing methods based on head-gaze estimation are not suitable for our target domain where various challenging issues remain.
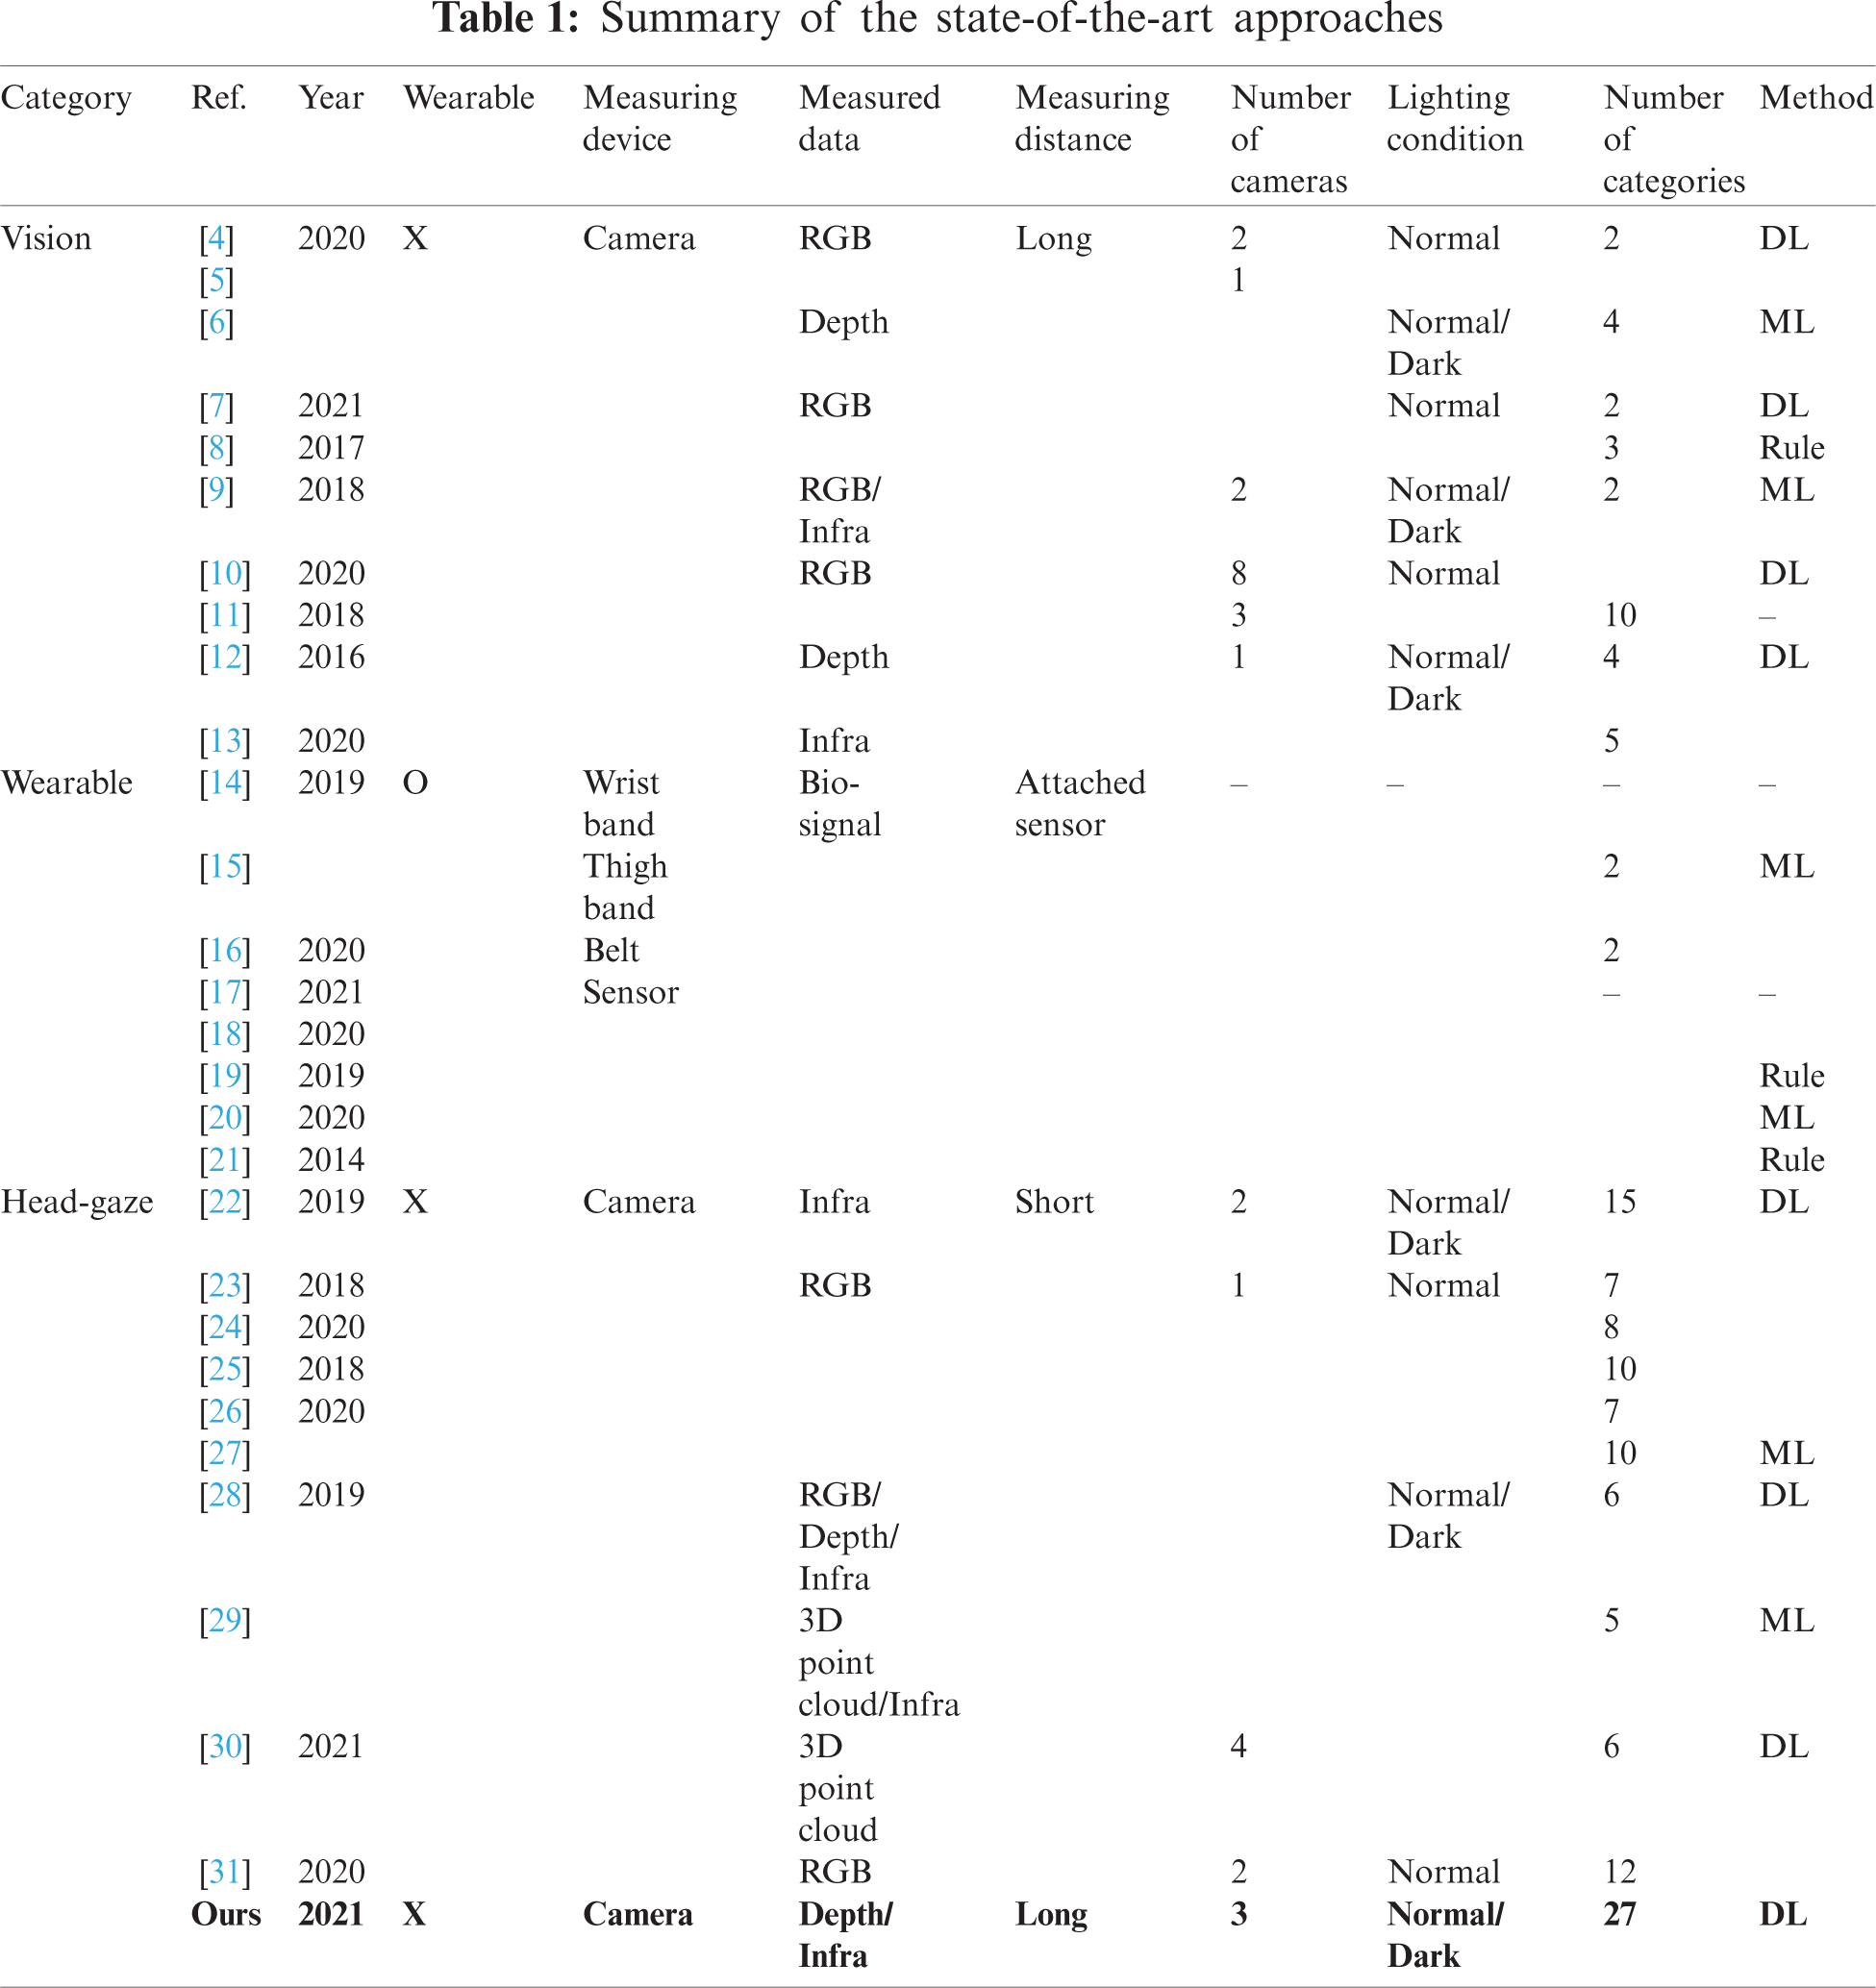
A summary of the state-of-the-art is presented in Tab. 1. First, as shown in the table, vision-based methods usually detect user’s movement patterns using images captured from cameras by utilizing deep learning (DL) and machine learning (ML) approaches. These methods work effectively for a long-distance setup between the measuring device and users; however, they only detect a simple event, such as whether the user leaves the bed or not. Next, wearable-based methods monitor the condition of users by measuring bio-signals (e.g., heart rate, blood pressure, EMG, etc.) using various sensors attached to their bodies. Therefore, users are unavoidably asked to wear sensing devices, resulting in an uncomfortable user experience. Finally, head-gaze-based methods mainly monitor the user’s status (e.g., whether a user is concentrating while driving) using multi-modal data captured from cameras. However, they also operate only in a limited environment, such as an in-vehicle setup; hence, they are not suitable for the welfare and healthcare domain where a more natural and wide interaction is required.
To sum up, state-of-the-art methods on user monitoring and interaction have several limitations, such as the need to wear devices, detection of simple patterns, and short interaction distance. In this paper, we introduce an indoor user monitoring and interaction system based on the estimation of head-gaze direction using a multi-view multi-modal approach. In particular, the proposed system tackles and overcomes the following limitation of previous works: 1) use of multiple cameras to support a long interaction distance, 2) use of multi-modal data to handle various lighting conditions, and 3) development of a deep learning pipeline to achieve robust performance with less data. Finally, through various experiments we investigate the changes in the overall performance of the system according to the view and modality configurations in various challenging conditions.
To simulate our target environment (e.g., a patient alone in a hospital room or an elderly person alone in a nursing home), we set up our laboratory condition as shown in Fig. 4.
Details of our experimental setting are as follows:
• A single chair was located at the center of the room.
• Three RGBD cameras were installed approximately 2 m from the front of the chair. The cameras were located at the top left, top right, and center of the user’s front (hereafter, L-view, R-view, and C-view, respectively). This setup allowed the participants to act naturally.
• For head-gaze estimation, we defined several zones in which each participant could gaze in the room, as illustrated in Fig. 4. For this, we defined nine virtual grids for each wall (i.e., the left side, right side, and front) around the participant; hence, a total of 27 grids were used as our target class (i.e., directions of head-gaze). Each virtual grid was labeled using a number card for easy reference.
• The lighting of the laboratory was set to dim while capturing user images to reflect the nighttime condition of our target location. For this setup, an Intel Realsense camera was used because it provides depth and infrared modalities that are largely unaffected by lighting conditions.

Figure 4: Example of the experimental setting
For the data collection task, we recruited ten university students (five males and five females) aged between 20 and 27 years. The data collection procedure used in this study is as follows:
• After a participant arrived, the experimenter gave an overview of the experiment along with a set of instructions regarding the entire procedure.
• The participant was asked to sit on a chair located at the center of the room.
• The participant was asked to naturally look at the grid randomly selected by the experimenter for 1 s. The participants were also allowed to move their body freely while gazing at a specific grid. The cameras installed in the room captured the images of the participants using the depth and infrared modalities. This task was repeated until all the grids were selected by the experimenter.
• After completing the first phase (i.e., capturing images of the user for 27 grids) of the experiment, the participant was given 5 min of break.
• After the break, the same task described in 3) was performed again. The experiment ended after this task was completed.
The data collection experiment took 10–15 min on average, including the pre/post setup and break between the phases for each participant. Fig. 5 shows the sample images of participant No.1 captured in three views with the depth and infrared modalities. As can be seen from the figure, the participant can be identified from the images of both modalities despite the laboratory lighting being set to dim. The captured images were used for training and testing the proposed multi-view multi-modal head-gaze estimation framework after a series of image pre-processing tasks. The total number of images captured in the experiment was 97,200 (i.e., 30 frames

Figure 5: Example of images captured with the depth and infrared modalities
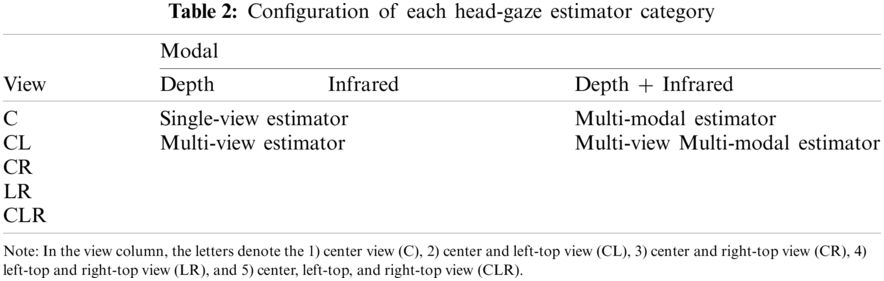
The overall architecture of the proposed approach is illustrated in Fig. 6. In this study, we investigated how architectural changes affect the overall head-gaze performance. As depicted in Fig. 6, we designed four different architectures based on how the number of views and/or modalities incorporated to build an estimator. Specifically, we begin with the single-view gaze estimator (Fig. 6a) as the basic module of our framework. The single-view gaze estimator was used to predict the direction of the head-gaze using images captured in the front view (i.e., C-view) with a single modality (i.e., depth or infrared only). The details of the image pre-processing and the base network used in this estimator are described in Section 4.1. The multi-view estimator depicted in Fig. 6b is an extension of the single-view estimator in terms of view. In this estimator, a set of images captured from different views is used to estimate the head-gaze direction. For example, a combination of images captured in the left and right views (i.e., L-view and R-view) can be used, rather than only front view (i.e., C-view) images. On the other hand, the multi-modal estimator depicted in Fig. 6c is an extension of the single-view estimator in terms of modality. In this estimator, a set of images captured with multiple modalities (i.e., both depth and infrared modalities) is used, rather than only single-modal images. Finally, the multi-view multi-modal estimator is an extended version of the single-view estimator in terms of view and modality. In this estimator, the images captured in multiple views with multiple modalities are exploited to predict the head-gaze direction.
Tab. 2 summarizes the configurations of each estimator. There can be multiple variations in each estimator category according to the type of modality and view used. First, the single-view estimator can use either depth or infrared images; thus, two types of networks exist. The multi-view estimator can use four different combinations of views (i.e., C

Figure 6: Overall network architecture of our proposed method: (a) Single-view estimator, (b) Multi-view estimator, (c) Multi-modal estimator, and (d) Multi-view multi-modal estimator
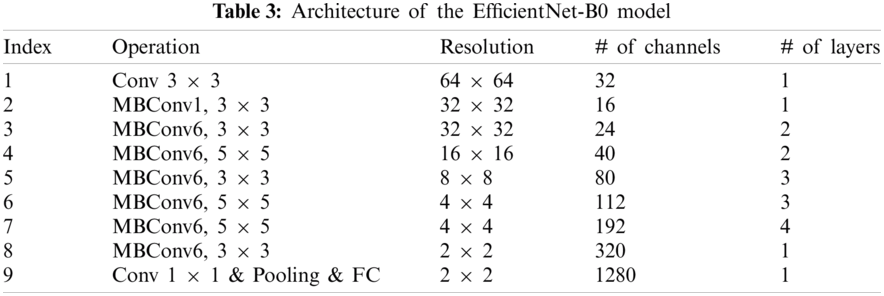
In the single-view estimator architecture, we used a state-of-the-art CNN model called EfficientNet [36], which achieved a top-1 accuracy of 84.3% on the ImageNet classification task, as our base feature extractor. The authors of the EfficientNet presented a novel scaling method that uniformly scales all dimensions of depth, width, and resolution of the baseline network using a compound coefficient. According to the different configurations of scaling factors, EfficientNet can have different architectures, ranging from EfficientNetB0 (smallest) to EfficientNet-B7 (largest). For example, the B7 network architecture has approximately 13 times more parameters than the B0 network architecture. In our framework, the EfficientNet-B0 model was used as a base feature extractor and the input size of the model was adjusted according to the resolution of our data (i.e., from 224
The network architecture for the single-view head-gaze estimation can be summarized as follows. As shown in Fig. 6a, we added a global max-pooling layer, a fully connected layer with 256 nodes, and the final fully-connected layer with a softmax function after the last layer of the pre-trained EfficientNet-B0. We then fine-tuned this model for head-gaze estimation on our collected dataset. We cropped the face region to a size of 64
As mentioned in Section 4, the multi-view estimator is an extension of the single-view estimator in terms of view. In the multi-view estimator, the images captured from different views are fed to each single-view estimator, as shown in Fig. 6b. For example, if the images from three different views (i.e., center, left, and right views) are exploited for head-gaze estimation, three different types of single-view estimators (i.e., center, left, and right views) are generated. Subsequently, we extract the 256-dimensional image features from each estimator with a different perspective (i.e., view) and concatenate them into a single feature vector with a size of 256
Similar to the multi-view estimator, the multi-modal estimator is an extension of the single-view estimator in terms of modality, as shown in Fig. 6c. The architecture of the multi-modal estimator differs according to the fusion of different modalities, as shown in Fig. 7. In this study, we utilized two multi-modal fusion approaches for a single-view estimator setup: i) data-level approach and ii) feature-level approach. In the data-level approach (DIdata, hereafter), the captured infrared and depth images are fused by element-wise multiplication before being fed to the deep learning network, which is similar to the process used in Yaghoubi et al. [37]. The fused image has the same resolution as the original depth and infrared images; therefore, it can be fed to the single-view estimator network for the final head-gaze estimation without significant architectural changes. An example of this approach is shown in Fig. 7a. In contrast to the data-level fusion method, the feature-level fusion approach (DIfeature, hereafter) concatenates the intermediate CNN features of each modality, similar to the approach used in Krafka et al. [32]. As shown in Fig. 7b, the images captured using the depth and infrared modalities are fed to each single-view estimator. Afterward, the 256-dimensional CNN features extracted from each estimator are concatenated into a single feature vector with dimensions of 256
4.4 Multi-View Multi-Modal Estimator
In this architecture, the images captured in multiple views (i.e., center, left, and right views) with multiple modalities (i.e., both depth and infrared modalities) are used together for head-gaze estimation. The example architecture of the multi-view multi-modal estimator is illustrated in Fig. 6d. For this architecture, we need to consider the following: i) how to fuse data from different views and ii) how to fuse data with different modalities in the multi-view setup. For multi-view fusion, we simply applied the same approach used in the multi-view estimator (Section 4.2). In other words, we concatenate the intermediate CNN features from each view into a single feature vector for the final head-gaze estimation. The characteristics of the intermediate CNN features from each view depend on how the data with different modalities in each view are fused. For multi-modal fusion in the multi-view setup, we utilized the fusion methods discussed in Section 4.3 (i.e., the data-level and feature-level fusion approaches) and an additional approach called modal-wise fusion. The differences between the fusion methods are shown in Fig. 8.

Figure 7: Illustration of multi-modal fusion methods (a) Data-level (b) Feature-level

Figure 8: Illustration of multi-view multi-modal fusion methods (a) Data-level (b) Feature-level (c) Modal-wise
The data-level and feature-level fusion approaches used in this architecture are similar to those used in the multi-modal estimator (Section 4.3), except for the number of views considered.
First, the data-level fusion method combines the images captured with depth and infrared modalities in the same view by element-wise multiplication. An example of the data-level fusion approach is shown in Fig. 8a. As can be seen in the figure, the images captured in the C-view with depth and infrared modalities are multiplied before being fed to the single-view estimator. Similarly, the images captured in the L-view with both modalities are also combined at the data-level. Afterward, each fused image is fed to the single-view estimator for each view to produce an intermediate CNN feature with 256-dimensions. Finally, the intermediate features from the different views are concatenated (i.e., multi-view fusion) and fed to the last classification layer to estimate the final head-gaze direction.
Second, the feature-level fusion method concatenates intermediate CNN features with different modalities from the same view. An example of feature-level fusion is shown in Fig. 8b. For example, the images captured with different modalities in each view are first passed through the single-view estimator for each modality. Then, each single-view estimator produces an intermediate CNN feature with 256-dimensions for each modality. Subsequently, these intermediate CNN features are concatenated into a single vector with a size of 256 (nodes)
Finally, we added a modal-wise fusion method (DImodal, hereafter) that concatenates the intermediate CNN features of the same modality from different views. An example of this approach is illustrated in Fig. 8c. In contrast to feature-level fusion, which combines data with different modalities in the same view, the modal-wise approach combines data from different views with the same modality. For example, the depth and infrared images captured in different views (e.g., C-view and L-view) are first fed to single-view estimators. Afterward, the intermediate CNN features from each estimator are collected and concatenated based on the modality. Therefore, a single vector with a size of 256 (nodes)
As stated earlier, four different combinations of views (i.e., center
In this section, various experiments were conducted to answer the following research questions.
• Which modality performs well in both single-view and multi-view approaches?
As mentioned in Section 1, we investigate which image modality would be effective in single-view and multi-view approaches. This observation will provide answers regarding which modality is more suitable for head-gaze estimation under challenging conditions.
• Does the multi-view approach yield better performance than the single-view approach?
Conventionally, it is often observed that the multi-view approach achieves a better performance than the single-view approach for vision-based tasks. Accordingly, we investigate whether this observation is also applicable to our target domain, where various challenging conditions, such as 1) the indoor environment, 2) various lighting conditions, and 3) a limited amount of data exist.
• Does the multi-modal approach perform better than the single-modal approach?
Similar to the use of multiple views, it is often assumed that the multi-modal approach performs better than the single-modal approach. We examine whether this assumption is applicable to the proposed multi-view multi-modal approach.
The experiments were performed on a high-end server equipped with a single NVIDIA RTX 2080 Ti GPU, 128 GB RAM, and an Intel i9-10900X CPU. We used the Keras framework with a TensorFlow backend to implement the proposed method. The network was trained with a batch size of 5 and an Adam optimizer with a learning rate of 1e-3. We also applied the early stopping strategy, in which the training procedure is stopped when the validation performance (e.g., validation loss or validation accuracy) is not improved for N consecutive epochs. In addition, to simulate our target environment (e.g., an elderly person living alone in a nursing home) where obtaining training images is extremely limited and challenging, we only used four frames for each grid per person (approximately 6k images in total) when training our estimation framework. All the experiments in this section shared the same experimental settings.
5.1 Performance of Single-Modal Estimators
In this section, we provide and analyze the experimental results to answer the first research question based on a single-modal setup. To do this, we examine the performance of single-view and multi-view estimators based on either the depth or infrared modality. The classification accuracy of the estimators is summarized in Tab. 4.
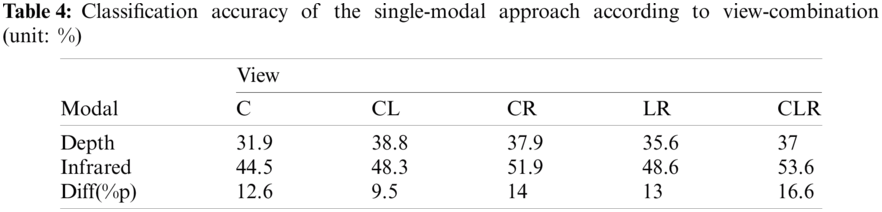
First, it should be noted that the proposed approach did not yield remarkable performance in terms of classification accuracy despite the use of a deep learning network that achieves state-of-the-art performance in image classification tasks. In all the experiments, we observed a minimum classification accuracy of 21.7% and maximum classification accuracy of 57.4%; which do not meet the requirements for practical application. This indicates that the tasks conducted in this study are significantly challenging; however, the performance of the estimators can be improved. Throughout the experiments and discussion sections, we present an analysis of the use of multi-view multi-modal approaches to improve the performance of head-gaze estimation in our target domain.
With respect to our research question, we can see from Tab. 4, the depth-modality estimator produced a classification accuracy of 36.24 on average, ranging from 31.9% to 37%. On the other hand, the classification accuracy of the infrared-modality estimator ranged from 44.5% to 53.6%, 49.38% on average. This result indicates that the single-modal estimator with infrared modality yields a higher classification accuracy than the single-modal estimator with depth modality, with an average performance gain of 13.14%p. Specifically, the performance differences between the single-modal estimators ranged from 9.5% to 16.6% according to the view configurations (i.e., C, CL, CR, LR, and CLR views). In addition, it can be observed that the performance differences between both modalities tend to increase as the number of views increases. Specifically, the performance difference between the modalities in the CLR-view setup is 16.6%p, which is approximately 1.3 times higher than that in the C-view setup (i.e., 12.6%p). Interestingly, the depth-modal estimator with CLR-view (i.e., the classification accuracy of 37%) performed worse than the infrared-modal estimator with C-view (i.e., a classification accuracy of 44.5%). This implies that the images captured with depth modality lack useful information about head-gaze estimation compared to those captured with infrared modality in a single-view, even if used in a multi-view configuration. The reason for this performance difference can be inferred from Fig. 5. As shown in the figure, the depth images are generally used to represent the distance between the camera and user; therefore, we can infer that depth images were not useful for capturing important information for head-gaze estimation. In contrast, infrared images have distinct features (i.e., face shape and head-gaze orientation) that represent the user’s appearance; thus, networks using infrared images would yield a better performance. From these results, we can conclude that the networks trained with infrared images can perform better than those trained with depth images for both the single-view and multi-view approaches.
5.2 Comparison of the Performance Between Single-View and Multi-View Estimators
In this section, we investigate the effectiveness of the multi-view approach on head-gaze estimation to answer the second research question. For this investigation, we examined the performance of single-modal and multi-modal estimators with different view configurations.
First, we discuss the performance differences in the single-modal estimator with depth modality according to the number of views. As shown in Tab. 4, the depth-modality estimator achieved the lowest performance with a classification accuracy of 31.9% for a single-view (i.e., C-view). The classification accuracy was improved to 37.4%, on average, with a double-view (i.e., C
Second, we analyze the performance differences in the single-modal estimator with infrared modality according to the number of views. In contrast to the performance of the depth-modality estimator, the infrared-modality estimator achieved the best classification accuracy of 53.6% with a triple-view configuration. Specifically, the classification accuracy of the triple-view setup was 4%p and 9.1%p higher than that of the double-view (average accuracy of 49.6%), and single-view (44.5%) approaches, respectively. Owing to the use of double views, a performance improvement of 5.1%p was also observed in comparison to the single-view approach. From this result, we can conclude that the performance of the single-modal estimator with infrared modality improves as the number of views increases.
Fig. 9 depicts the confusion matrices for the single-modal estimators with single-view and multi-view setups. First, the depth-modality estimator with the C-view produced a lot of errors, as shown in the first column of Fig. 9a. Similarly, the infrared-modality estimator with the C-view also produced several errors even though it achieved a better performance than the depth-modality estimator (refer to the first column of Fig. 9b). From these results, we can infer that the single-modal networks mainly have difficulties in head-gaze estimation for the grids (gaze zone) in front of the user. We believe this comes from the tendency that the participants hardly move their heads when gazing at the grids in front of them. However, it was noticeable that the single-modal estimators benefitted from adopting the multi-view configuration. Specifically, we can see that the performance of the depth-modality estimator slightly improved when the multi-view configuration (i.e., double-view and triple-view setups) was used (See Fig. 9a). Similarly, as shown in Fig. 9b, the confusion matrices indicate that the infrared-modal estimator also produces better classification results as the number of views increases. Interestingly, the infrared-modality estimator performed better than the depth-modality estimator in all scenarios, regardless of the view configuration, and achieved the best classification results with a triple-view setup.

Figure 9: Confusion matrix of single-modal estimators according to view setups (a) Depth-modality estimator, (b) Infrared-modality estimator
Next, we examine the performance differences in multi-modal approaches according to the number of views. As mentioned in Sections 4.3 and 4.4, we applied three methods to combine the heterogeneous modalities of images, i.e., 1) data-level, 2) feature-level, and 3) modal-wise approaches. Tab. 5 summarizes the classification accuracy of the multi-modal approach according to the combination of views.
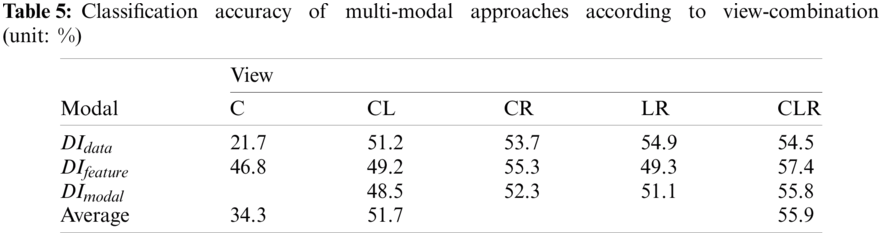
First, similar to the single-modal estimator, multi-modal estimators with a single-view setup achieved the worst classification accuracy of 34.3% on average (21.7% for DIdata and 46.8% for DIfeature and DImodal). Note that the modal-wise fusion method (DImodal) combines data with the same modality before feeding them to the network, which indicates that it works equally with the feature-level fusion method (DIfeature) in a single-view setup. Interestingly, we can see that the multi-modal estimator with a data-level fusion approach (DIdata) produced even worse performance (21.7%) than the single-modal estimators (31.9% for the depth estimator and 44.5% for the infrared estimator) in the single-view setup (C-view). This implies that the feature-level fusion method is more effective than the data-level approach when adopting a multi-modal estimator with a single-view configuration.
On the other hand, the performance of multi-modal networks with a double-view setup was improved to 51.7% on average, which was 17.4%p higher than that of the single-view setup. Finally, the triple-view approach achieved the best classification accuracy of 55.9% on average, which resulted in an average performance improvement of 4.2%p compared to the double-view approaches, and 21.6%p on average compared to the single-view approach. From these results, we can find that the classification performance of the multi-modal estimator improves as the number of views increases. However, we could not find an optimal fusion method that works best for all view configurations. The multi-modal estimator with a feature-level fusion approach (DIfeature) generally performed well in single-view and triple-view setups. On the other hand, the multi-modal estimator with a data-level fusion method (DIdata) significantly benefitted from the use of a multi-view setup, thereby achieving the best performance on average (i.e., 53.3%) in a double-view setup.

Figure 10: Confusion matrix of multi-modal estimators with data-level fusion according to view setups
More specifically, the multi-view setup resulted in a significant performance improvement of 31.9%p compared to the single-view setup. However, there were no performance differences between the double-view and triple-view setups. Fig. 10 shows the confusion matrices for the multi-modal estimators with the data-level fusion method according to the single-view and triple-view setup. As shown in the figure, the
From the experimental results discussed in this section, we can conclude that the multi-view approaches perform better than single-view approaches, regardless of the modality used.
5.3 Comparison of the Performance Between Single-Modal and Multi-Modal Estimators
In this section, we examine the performance differences between the single-modal and multi-modal estimators to answer the last research question. Fig. 11 summarizes the classification accuracy of both multi-modal and single-modal estimators according to the view configuration. As described in the previous section, the modal-wise fusion method works equally with feature-level fusion in the case of the single-view configuration; therefore, we present the performance of DIfeature only for a single-view configuration.
First, we investigate the performance differences in each estimator for single-view configuration (i.e., C-view). As shown in the figure, we can see that the multi-modal estimator with DIfeature outperformed the single-modality estimators. Specifically, the DIfeature exhibited a performance improvement of 14.9%p and 2.3%p, respectively, in comparison to the depth-modality estimator and the infrared-modality estimator.

Figure 11: Classification accuracy of head-gaze estimators according to the configuration of views
However, the performance of the multi-modal estimator with DIdata was decreased significantly compared with that of the single-modal estimators. For example, the classification accuracy of DIdata was 21.7%, which was 10.2%p and 22.8%p lower than that of the single-modal estimators with depth and infrared modalities, respectively. Next, we analyze the performance differences between the single-modal and multi-modal estimators for a double-view configuration. Similar to the results of the single-view configuration, the multi-modal estimators improved the performance by 14.3%p and 2.1%p on average compared with the single-modality estimator with depth and infrared modality, respectively. In particular, the multi-modal estimator with data-level fusion was found to be the most useful, resulting in the highest performance improvement of 15.8%p. In addition, we can observe that there are no significant differences between the performances of the multi-modal estimators with the double-view setup. Finally, we compared the performances of the estimators according to changes in the modality in the triple-view configuration. As shown in Fig. 11, we found that the classification accuracy of multi-modal approaches was 18.9%p higher on average than that of the depth-modality estimator. In addition, the multi-modal estimators showed a performance improvement of approximately 2%p on average compared to the infrared-modality estimator.
To sum up, Fig. 11 clearly depicts that the multi-modal approaches outperform the single-modality estimators. Consequently, multi-modal estimators outperformed the single-modal estimators regardless of the view setup except for the case of DIdata with C-view.
In the previous section, we compared the performance of the head-gaze estimators in terms of classification accuracy. However, the efficiency of a system must also be considered to ensure reasonable performance in real-life scenarios. Therefore, in this section, therefore, we discuss the performance differences between the multi-modal and single-modal approaches in terms of efficiency, such as the number of trainable parameters, training time, and inference time.
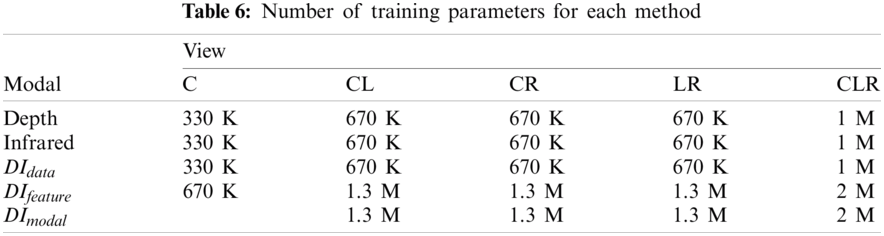
6.1 Number of Training Parameters
First, we examined the number of training parameters required for each head-gaze estimation architecture. Tab. 6 summarizes the number of training parameters for each approach. As shown in the table, we can see that the number of training parameters increased with the number of views. For example, the number of training parameters of the network using depth images with the CLR-view setup (i.e., 1 M) is approximately three times greater than that of the same network with the C-view setup (i.e., 330 K). We can observe the same pattern in all modality combinations. Interestingly, the number of training parameters required for DIdata is the same as the number of parameters required for the single-modal approaches. As described in Section 4.4, the infrared and depth images are fused at the data level in the DIdata approach; therefore, the number of single-view estimators is identical to that of single-modal approaches. However, because DIfeature and DImodal exploit the intermediate CNN features for each modality, more networks and prediction layers are required, thereby resulting in an increased number of parameters. Specifically, it can be observed that the networks with DIfeature and DImodal require approximately 2 times more parameters than the others.
Generally, it is known that an increase in the number of parameters leads to an increase in the training and inference time of deep learning networks. Therefore, we analyzed the effect of differences in network architecture on training and inference time.
First, the per-epoch training time (unit: sec) of all approaches is shown in the right column of Tab. 7. Similar to the previous analysis on the number of training parameters, we found that the training time per epoch is proportional to the size of the network model. For example, the single-epoch training takes 30 s for the single-view single-modal approaches, whereas it takes 50 to 70 s when adopting the multi-view single-modal approaches. This tendency was also observed in multi-modal approaches. As can be seen in the table, multi-view multi-modal approaches take 82 to 110 s for single-epoch training, which is 1.6–2.2 times longer than that of single-view multi-modal approaches.
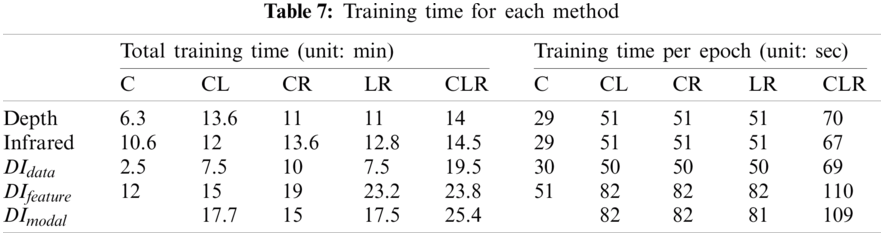
In addition, a similar pattern was observed with respect to the total training time required for models. The left column of Tab. 7 shows the total training time required for each model. As can be seen in the table, the number of training parameters significantly affected the total training time. For example, we found that the models with DIfeature and DImodal, which have the largest number of trainable parameters, took the longest time to train in all cases. Specifically, the training time of the multi-modal approaches with DIfeature and DImodal were 24.6 min on average for the triple-view setup, which is 1.5 times longer compared with that of the single-modal estimators (16 min on average). Through these results, we found that, although the use of multiple views and multiple modalities can lead to a longer training time but can improve the performance of head-gaze direction. Accordingly, we can conclude that there exists a trade-off between training efficiency and accuracy.
Next, the inference efficiency of all approaches in terms of the frame per second (FPS) is listed in Tab. 8. Similar to the training time, we can see that the inference time is also proportional to the size of the network model. Specifically, single-modal approaches and the DIdata approach can handle approximately twice as many frames as multi-modal approaches while estimating the user’s head-gaze direction. On the other hand, we observed that the multi-modal networks with a large number of parameters (i.e., DIfeature and DImodal with CLR-view) could perform at over 60 FPS which is a requirement for real-time applications. Based on these results, we expect that multi-view multi-modal head-gaze estimators can be applied to practical and real-time scenarios.

In this section, we analyzed the performance of each head-gaze estimator architecture in terms of training and inference efficiency. Through various experiments, we found that 1) the multi-modal networks with a multi-view setup (in particular, CLR-view) require more time for training and inferencing since they have a larger and heavier architecture, and 2) there exists a trade-off between accuracy and efficiency. For example, we observed that, although the classification accuracy of each head-gaze estimator improved as the number of views (i.e., camera) increased, the time needed to train the networks also increased. Similarly, multi-modal approaches produced better classification accuracy but required more time for training networks than single-modal approaches. Therefore, the architecture of deep learning-based head-gaze estimation must be designed with careful consideration of the target environmental conditions. Finally, we expect that our analysis of multi-view multi-modal head-gaze estimation under challenging conditions can facilitate the development of practical solutions and further research.
In this paper, we proposed a head-gaze estimation system based on a multi-view multi-modal approach for monitoring and interacting with a user in an indoor environment. The proposed approach captures the users from multiple views using cameras with depth and infrared modalities for head-gaze estimation under the following challenging conditions: 1) indoor interaction should be considered, 2) various lighting conditions must be handled, and 3) only a limited data size is available. To address these requirements, configured four different types of head-gaze estimators based on the use of view and modality. In particular, we applied three modal fusion approaches (i.e., data-level, feature-level, and modal-wise) to fuse data with different modalities in multi-modal estimators.
To demonstrate the differences in the classification accuracy of the proposed approach according to view and modality configurations, we performed various experiments and analyzed the results. Through the experimental results, we found that the infrared modality provides more useful features than the depth modality. It was also observed that the classification accuracy of the head-gaze estimators is improved when adopting the multi-view approaches than the single-view approach. Finally, the multi-modal estimators outperformed the single-modality estimators except for some cases (e.g., DIdata for C-view). In other words, we can conclude that multi-view multi-modal estimators are generally superior for head-gaze estimation in our target domain. In terms of training efficiency, we found that multi-view, multi-modal approaches generally have more training parameters than single-view, single-modal approaches. In addition, we could see that the training and inference times per epoch were proportional to the number of parameters. In summary, we can conclude that there exists a trade-off between accuracy and efficiency; therefore, the architecture of deep learning-based head-gaze estimation must be designed with careful consideration of the conditions of the target environment.
Although our study provides various analyses on head-gaze estimation under challenging conditions, we encountered some limitations that need to be addressed in the future.
First, the experiments conducted in this study had the following restrictions: 1) only a single subject could participate in the experiment; 2) the participant should sit on the chair in the room although they were allowed to move their body naturally during the task; and 3) a set of predefined areas (e.g., 27 gaze zones) for indoor gaze estimation was assumed. In future research, we plan to extend our protocol to 1) allow multiple subjects to participate in the experiment, 2) encourage them to perform various activities (e.g., walking and jumping) during the task, and 3) achieve object-level head-gaze prediction, thereby realizing more practical scenarios.
Second, we validated the effect of exploiting multiple views (up to three views) on head-gaze estimation for a single user. To achieve successful head-gaze estimation under the aforementioned conditions, we will attempt to utilize more views to obtain more informative data and revise our head-gaze estimation models. In addition, we plan to study domain adaptation using self-supervised learning approaches to improve the performance of head-gaze estimation in our domain. Various approaches have been developed to address human-computer interaction (HCI) tasks, such as pose estimation [38], gesture recognition [39], and movement/behavior detection [40], using images or video clips. Although these approaches have different characteristics compared to gaze estimation, they are generally based on user body movements. Therefore, we will study a method to learn the feature representation from these tasks using self-supervised learning approaches [41–43] and investigate how they can be adapted to the field of gaze estimation.
Third, our proposed method mainly focused on head-gaze estimation for indoor environments, such as welfare and healthcare facilities. In our future work, we aim to extend our study to work with robust and stable performance under outdoor conditions and virtual reality (VR)/augmented reality (AR) applications in addition to other indoor environments. For this, we plan to optimize the architecture of the proposed framework in terms of the model size, with a network pruning method [44] or knowledge distillation techniques [45] to realize practical real-time applications. We expect that our extended multi-view multi-modal approach can improve the performance of conventional head-gaze estimation methods using the VR/AR setup [46] and VR/AR head-mounted devices equipped with commercial eye-trackers [47].
Funding Statement: This work was supported by the Basic Research Program through the National Research Foundation of Korea (NRF) grant funded by the Korea Government (MSIT) under Grant 2019R1F1A1045329 and Grant 2020R1A4A1017775.
Conflicts of Interest: The authors declare that they have no conflicts of interest to report regarding the present study.
1. CDC, “Personal and social activities,” 2021. Accessed 29 July 2021, [Online]. Available:https://www.cdc.gov/coronavirus/2019-ncov/daily-life-coping/personal-social-activities.html. [Google Scholar]
2. CDC, “People at increased risk,” 2021. Accessed 29 July 2021, [Online]. Available:https://www.cdc.gov/coronavirus/2019-ncov/need-extra-precautions/index.html. [Google Scholar]
3. CDC, “Public health activity guidance,” 2021. Accessed 29 July 2021, [Online]. Available: https://www.cdc.gov/coronavirus/2019-ncov/hcp/non-covid-19-client-interaction.html. [Google Scholar]
4. X. Wang and K. Jia, “Human fall detection algorithm based on YOLOv3,” in Proc. ICIVC, Beijing, China, pp. 50–54, 2020. [Google Scholar]
5. H. Abdo, K. M. Amin and A. M. Hamad, “Fall detection based on RetinaNet and MobileNet convolutional neural networks,” in Proc. ICCES, Cairo, Egypt, pp. 1–7, 2020. [Google Scholar]
6. M. Bundele, H. Sharma, M. Gupta and P. S. Sisodia, “An elderly fall detection system using depth images,” in Proc. ICRAIE, Jaipur, India, pp. 1–4, 2020. [Google Scholar]
7. X. Cai, X. Liu, M. An and G. Han, “Vision-based fall detection using dense block with multi-channel convolutional fusion strategy,” IEEE Access, vol. 9, pp. 18318–18325, 2021. [Google Scholar]
8. M. I. Nari, A. W. Setiawan and W. Adiprawita, “A hierarchical description-based video monitoring system for elderly,” in Proc. EECSI, Yogyakarta, Indonesia, pp. 1–5, 2017. [Google Scholar]
9. M. Inoue, R. Taguchi and T. Umezaki, “Vision-based bed detection for hospital patient monitoring system,” in Proc. EMBS, Honolulu, HI, USA, pp. 5006–5009, 2018. [Google Scholar]
10. M. Inoue and R. Taguchi, “Bed exit action detection based on patient posture with long short-term memory,” in Proc. EMBC, Montreal, QC, Canada, pp. 4390–4393, 2020. [Google Scholar]
11. C. Torres, J. C. Fried, K. Rose and B. S. Manjunath, “A multiview multimodal system for monitoring patient sleep,” IEEE Transactions on Multimedia, vol. 20, no. 11, pp. 3057–3068, 2018. [Google Scholar]
12. T. Grimm, M. Martinez, A. Benz and R. Stiefelhagen, “Sleep position classification from a depth camera using bed aligned maps,” in Proc. ICPR, Cancun, Maxico, pp. 319–324, 2016. [Google Scholar]
13. S. M. Mohammadi, S. Enshaeifar, A. Hilton, D. J. Dijk and K. Wells, “Transfer learning for clinical sleep pose detection using a single 2D IR camera,” IEEE Transactions on Neural Systems and Rehabilitation Engineering, vol. 29, pp. 290–299, 2021. [Google Scholar]
14. T. F. Bernadus, L. B. Subekti and Y. Bandung, “IoT-based fall detection and heart rate monitoring system for elderly care,” in Proc. ICISS, Bandung, Indonesia, pp. 1–6, 2019. [Google Scholar]
15. W. Saadeh, S. A. Butt and M. A. B. Altaf, “A patient-specific single sensor IoT-based wearable fall prediction and detection system,” IEEE Transactions on Neural Systems and Rehabilitation Engineering, vol. 27, no. 5, pp. 995–1003, 2019. [Google Scholar]
16. K. Desai, P. Mane, M. Dsilva, A. Zare, P. Shingala et al., “A novel machine learning based wearable belt for fall detection,” in Proc. GUCON, Greater Noida, India, pp. 502–505, 2020. [Google Scholar]
17. P. Kora, A. Rajani, M. C. Chinnaiah, K. Swaraja and K. Meenakshi, “IoT based wearable monitoring structure for detecting abnormal heart,” in Proc. SEFET, Hyderabad, India, pp. 1–4, 2021. [Google Scholar]
18. H. T. Yew, M. F. Ng, S. Z. Ping, S. K. Chung, A. Chekima et al., “IoT based real-time remote patient monitoring system,” in Proc. CSPA, Langkawi, Malaysia, pp. 176–179, 2020. [Google Scholar]
19. A. A. R. Richard, M. F. Sadman, U. H. Mim, I. Rahman and M. S. R. Zishan, “Health monitoring system for elderly and disabled people,” in Proc. ICREST, Dhaka, Bangladesh, pp. 677–681, 2019. [Google Scholar]
20. H. Fei and M. Ur-Rehman, “A wearable health monitoring system,” in Proc. UCET, Glasgow, UK, pp. 1–4, 2020. [Google Scholar]
21. K. Arai, “Rescue system with vital sign, location and attitude sensing together with traffic condition, readiness of helper monitoring in particular for disabled and elderly persons,” in Proc. ITNG, Las Vegas, NV, USA, pp. 155–160, 2014. [Google Scholar]
22. H. S. Yoon, N. R. Baek, N. Q. Truong and K. R. Park, “Driver gaze detection based on deep residual networks using the combined single image of dual near-infrared cameras,” IEEE Access, vol. 7, pp. 93448–93461, 2019. [Google Scholar]
23. S. Vora, A. Rangesh and M. M. Trivedi, “Driver gaze zone estimation using convolutional neural networks: A general framework and ablative analysis,” IEEE Transactions on Intelligent Vehicles, vol. 3, no. 3, pp. 254–265, 2018. [Google Scholar]
24. Q. Bi, X. Ji and Y. Sun, “Research on driver’s gaze zone estimation based on transfer learning,” in Proc. ICIBA, Chongqing, China, pp. 1261–1264, 2020. [Google Scholar]
25. I. R. Tayibnapis, M. K. Choi and S. Kwon, “Driver’s gaze zone estimation by transfer learning,” in Proc. ICCE, Las Vegas, NV, USA, pp. 1–5, 2018. [Google Scholar]
26. S. Dari, N. Kadrileev and E. Hullermeier, “A neural network-based driver gaze classification system with vehicle signals,” in Proc. IJCNN, Glasgow, UK, pp. 1–7, 2020. [Google Scholar]
27. X. Shan, Z. Wang, X. Liu, M. Lin, L. Zheo et al., “Driver gaze region estimation based on computer vision,” in Proc. ICMTMA, Phuket, Thailand, pp. 357–360, 2020. [Google Scholar]
28. R. F. Ribeiro and P. D. P. Costa, “Driver gaze zone dataset with depth data,” in Proc. FG, Lille, France, pp. 1–5, 2019. [Google Scholar]
29. H. Li, Q. Zhao, W. Zhao and Y. Wu, “Driver-car natural interaction method based on head-eye behaviors,” in Proc. IHMSC, Hangzhou, China, pp. 161–164, 2019. [Google Scholar]
30. T. Hu, S. Jha and C. Busso, “Temporal head pose estimation from point cloud in naturalistic driving conditions,” IEEE Transactions on Intelligent Transportation Systems, pp. 1–14, 2021. [Google Scholar]
31. L. Yang, K. Dong, A. J. Dmitruk, J. Brighton and Y. Zhao, “A dual-cameras-based driver gaze mapping system with an application on non-driving activities monitoring,” IEEE Transactions on Intelligent Transportation Systems, vol. 21, no. 10, pp. 4318–4327, 2020. [Google Scholar]
32. K. Krafka, A. Khosla, P. Kellnhofer, H. Kannan, S. Bhandarkar et al., “Eye tracking for everyone,” in Proc. CVPR, Las Vegas, NV, USA, pp. 2176–2184, 2016. [Google Scholar]
33. Q. Huang, A. Veeraraghavan and A. Sabharwal, “TabletGaze: Dataset and analysis for unconstrained appearance-based gaze estimation in mobile tablets,” Machine Vision and Applications, vol. 28, no. 5–6, pp. 445–461, 2017. [Google Scholar]
34. X. Zhang, Y. Sugano, M. Fritz and A. Bulling, “MPIIGaze: Real-world dataset and deep appearance-based gaze estimation,” IEEE Transactions on Pattern Analysis and Machine Intelligence, vol. 41, no. 1, pp. 162–175, 2019. [Google Scholar]
35. D. Lian, L. Hu, W. Luo, Y. Xu, L. Duan et al., “Multiview multitask gaze estimation with deep convolutional neural networks,” IEEE Transactions on Neural Networks and Learning Systems, vol. 30, no. 10, pp. 3010–3023, 2019. [Google Scholar]
36. M. Tan and Q. V. Le, “EfficientNet: Rethinking model scaling for convolutional neural networks,” in Proc. ICML, Long Beach, California, USA, vol. 97, pp. 6105–6114, 2019. [Google Scholar]
37. E. Yaghoubi, D. Borza, J. Neves, A. Kumar and H. Proença, “An attention-based deep learning model for multiple pedestrian attributes recognition,” Image and Vision Computing, vol. 102, no. 11, pp. 1–10, 2020. [Google Scholar]
38. Y. Chen, Y. Tian and M. He, “Monocular human pose estimation: A survey of deep learning-based methods,” Computer Vision and Image Understanding, vol. 192, pp. 1–20, 2020. [Google Scholar]
39. M. Oudah, A. Al-Naji and J. Chahl, “Hand gesture recognition based on computer vision: A review of techniques,” Journal of Imaging, vol. 6, no. 73, pp. 1–29, 2020. [Google Scholar]
40. S. Deep, X. Zheng, C. Karmakar, D. Yu, L. G. C. Hamey et al., “A survey on anomalous behavior detection for elderly care using dense-sensing networks,” IEEE Communications and Survey and Tutorials, vol. 22, no. 1, pp. 352–370, 2020. [Google Scholar]
41. J. B. Grill, F. Strub, F. Altché, C. Tallec, P. Richemond et al., “Bootstrap your own latent: A new approach to self-supervised learning,” in Proc. NEURIPS, vol. 33, pp. 21271–21284, 2020. [Google Scholar]
42. T. Chen, S. Kornblith, M. Norouzi and G. Hinton, “A simple framework for contrastive learning of visual representations,” in Proc. ICML, Online, pp. 1597–1607, 2020. [Google Scholar]
43. K. He, H. Fan, Y. Wu, S. Xie and R. Girshick, “Momentum contrast for unsupervised visual representation learning,” in Proc. CVPR, Seattle, WA, USA, pp. 9726–9735, 2019. [Google Scholar]
44. P. Molchanov, S. Tyree, T. Karras, T. Aila and J. Kautz, “Pruning convolutional neural networks for resource efficient inference,” in Proc. ICLR, Toulon, France, pp. 1–17, 2017. [Google Scholar]
45. G. Hinton, O. Vinyals and J. Dean, “Distilling the knowledge in a neural network,” in Proc. NIPS, Montreal, Canada, pp. 1–9, 2014. [Google Scholar]
46. R. Atienza, R. Blonna, M. I. Saludares, J. Casimiro and V. Fuentes, “Interaction techniques using head gaze for virtual reality,” in Proc. TENSYMP, Bali, Indonesia, pp. 110–114, 2016. [Google Scholar]
47. Pico, “Pico Neo 3,” 2021. Accessed 29 July 2021, [Online]. Available: https://www.pico-interactive.com/us/neo3.html. [Google Scholar]
 | This work is licensed under a Creative Commons Attribution 4.0 International License, which permits unrestricted use, distribution, and reproduction in any medium, provided the original work is properly cited. |