DOI:10.32604/cmc.2022.018262
| Computers, Materials & Continua DOI:10.32604/cmc.2022.018262 | |
| Article |
Parametric Study of Hip Fracture Risk Using QCT-Based Finite Element Analysis
1Department of Mechanical Engineering, University of Manitoba, Winnipeg, R3T 5V6, Canada
2Institute of Structural Mechanics, Bauhaus-Universität Weimar, Weimar, 99423, Germany
3Department of Biomedical Engineering, University of Manitoba, Winnipeg, R3T 5V6, Canada
*Corresponding Author: Timon Rabczuk. Email: Timon.Rabczuk@uni-weimar.de
Received: 03 March 2021; Accepted: 14 September 2021
Abstract: Various parameters such as age, height, weight, and body mass index (BMI) influence the hip fracture risk in the elderly which is the most common injury during the sideways fall. This paper presents a parametric study of hip fracture risk based on the gender, age, height, weight, and BMI of subjects using the subject-specific QCT-based finite element modelling and simulation of single-leg stance and sideways fall loadings. Hip fracture risk is estimated using the strain energy failure criterion as a combination of bone stresses and strains leading to more accurate and reasonable results based on the bone failure mechanism. Understanding the effects of various parameters on hip fracture risk can help to prescribe more accurate preventive and treatment plans for a community based on the gender, age, height, weight, and BMI of the population. Results of this study show an increase in hip fracture risk with the increase of age, body height, weight, and BMI in both women and men under the single-leg stance and the sideways fall configurations.
Keywords: Hip fracture risk; finite element model; strain energy; parametric study
Hip fracture is one of the common injuries during the sideways fall especially for the elderlies where it may cause long-term disability and even death of individuals [1]. Due to the increasing trend of hip fracture over the world [2], especial attention should be paid to this issue to consider proper preventive and treatment actions. Precise hip fracture risk prediction and study on the effective parameters on hip fracture occurrence in the elderlies assist surgeons and specialists to design appropriate treatment plans and effective hip protectors.
In the past decades, developments and advances in imaging technologies, i.e., Dual-Energy X-ray Absorptiometry (DXA) and Quantitative Computed Tomography (QCT), and numerical methods such as the finite element (FE) method could create a reliable tool for accurate hip fracture risk assessment without the limitations of the statistical models depending on measuring bone mineral density (BMD). A combination of QCT imaging and FE modelling has been employed in many studies to predict hip fracture risk, high stress and strain regions, and failure loads of human femur. For example, Kheirollahi et al. [3–6] proposed studies estimating hip fracture risk index and determining high-risk regions of the human femur using the strain energy failure criterion via QCT-based FE modelling. A comparative study was presented by Bisheh et al. [7] to assess hip fracture risk based on different failure criteria using QCT-based FE modelling. Dragomir-Daescu et al. [8] presented a robust QCT-based FE model which can calculate proximal femur stiffness and hip fracture load during a sideways fall. Gong et al. [9] studied on the relation between femoral strength and BMD, and also the relation between a material distribution and geometric morphology by nonlinear FE analysis. Koivumäki et al. [10] presented a CT-based FE model to estimate experimentally measured failure loads in the proximal femur. Luo et al. [11] estimated hip fracture risk using DXA-based patient-specific FE modelling according to the stress criterion. In another study by Mirzaei et al. [12], the strength and failure patterns of the human proximal femur were obtained using the QCT-based FE method.
In addition to imaging technologies and numerical methods, human body parameters such as age, height, weight, and body mass index (BMI) have great effects on the hip fracture risk assessment. Hence, a study considering various body parameters can be useful to prevent probable hip fracture in the elderly and propose an appropriate treatment for the case of hip fracture occurrence. Parametric studies of hip fracture risk based on the gender, age, height, weight, and BMI of subjects lead to a precise estimation of hip fracture in relation to the specifications and lifestyle of a community. To the authors’ knowledge, there is no study in the literature considering various human body parameters on hip fracture risk using QCT-based FE modelling and strain energy criterion. The main objective of this study is to find the relation of human body parameters with the hip fracture occurrence by integration of QCT imaging technology and FE simulation based on the strain energy criterion which is a combination of both stress and strain effects leading to a more accurate assessment of hip fracture risk [4].
In this paper, the correlations between the hip fracture risk and different human body parameters such as age, body height, body weight, and BMI are investigated and attained for 30 females (totally 60 right and left femurs) and 30 males (totally 60 right and left femurs). To this purpose, we construct a subject-specific QCT-based FE model of the femur using Mimics and ANSYS software based on the QCT data of subjects and then hip fracture risk index is calculated based on the strain energy criterion using MATLAB codes at the critical regions of the femur, locations usually receiving higher stress and strain within sideways fall [5,6]. The hip fracture risk index variations with age, body height, body weight, and BMI (representative of body shape) at the three critical cross-sections of the femur during the single-leg stance and the sideways fall for 30 females and 30 males are shown in the scattered plots. The correlation coefficients (r) and the corresponding statistical significance (p-value) are calculated using in-house MATLAB codes for the parameters considered in this study.
In this section, the calculation of hip fracture index based on the integration of QCT imaging and FE modelling using the strain energy criterion is explained in detail.
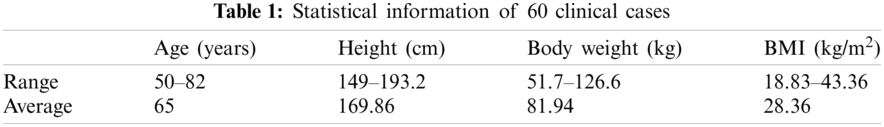
2.1 Finite Element Modeling Based on the QCT Image
The QCT image is used to construct three dimensional (3D) model of the subject's femur. To this purpose, the QCT images should be saved in the Digital Imaging and Communications in Medicine (DICOM) format and then an appropriate segmentation should be applied to separate the femur from the soft tissue. The intensity of the QCT image voxel is defined as Hounsfield Unit (HU) which is used to determine bone density [13,14]. QCT images of 30 females (totally 60 right and left femurs) and 30 males (totally 60 right and left femurs), attained from the Winnipeg Health Science Centre, are used for the parametric study. The age scope of chosen cases is between 50 and 82 years (average of 65 years) with a height range of 149–193.2 centimeters and a body weight range of 51.7–126.6 kilograms. The statistical information of the subjects is given in Tab. 1.
2.1.2 Construction of Finite Element Mesh
To construct the femur 3D model from the subject's QCT image, Mimics software (Materialise, Leuven, Belgium) is employed. QCT image, in DICOM format, is imported to Mimics for the required segmentation and manipulation (Fig. 1a) and then the construction of the 3D model (Fig. 1b). By using the 3-Matic module of Mimics, FE mesh is generated (Fig. 1c) with the 4-node linear tetrahedral element SOLID72 acceptable by ANSYS. For the convergence study, FE models with different maximum element edge lengths are employed. The maximum von Mises stress is calculated for FE models with different maximum element edge lengths under the same loading and boundary conditions and then the maximum element edge length, providing converged results, is determined and used throughout the FE simulations and numerical analyses.
2.1.3 Assignment of Material Properties
By using the relation between CT numbers and bone material properties, inhomogeneous isotropic material properties of the femur can be obtained from the QCT image data. The bone ash density (
Young's modulus (
and Poisson's ratio (
To apply continuous distribution of inhomogeneous bone mechanical properties, elements are categorized into several discrete material bins via Mimics (Materialise, Leuven, Belgium). We need a convergence study to assign the required number of material bins. The maximum von Mises stress is calculated for models with different material bins under the same loading and boundary conditions to find the maximum number of material bins leading to the converged results for use in all FE simulations and numerical analyses. Fig. 1d displays an isotropic inhomogeneous distribution of the bone material properties.
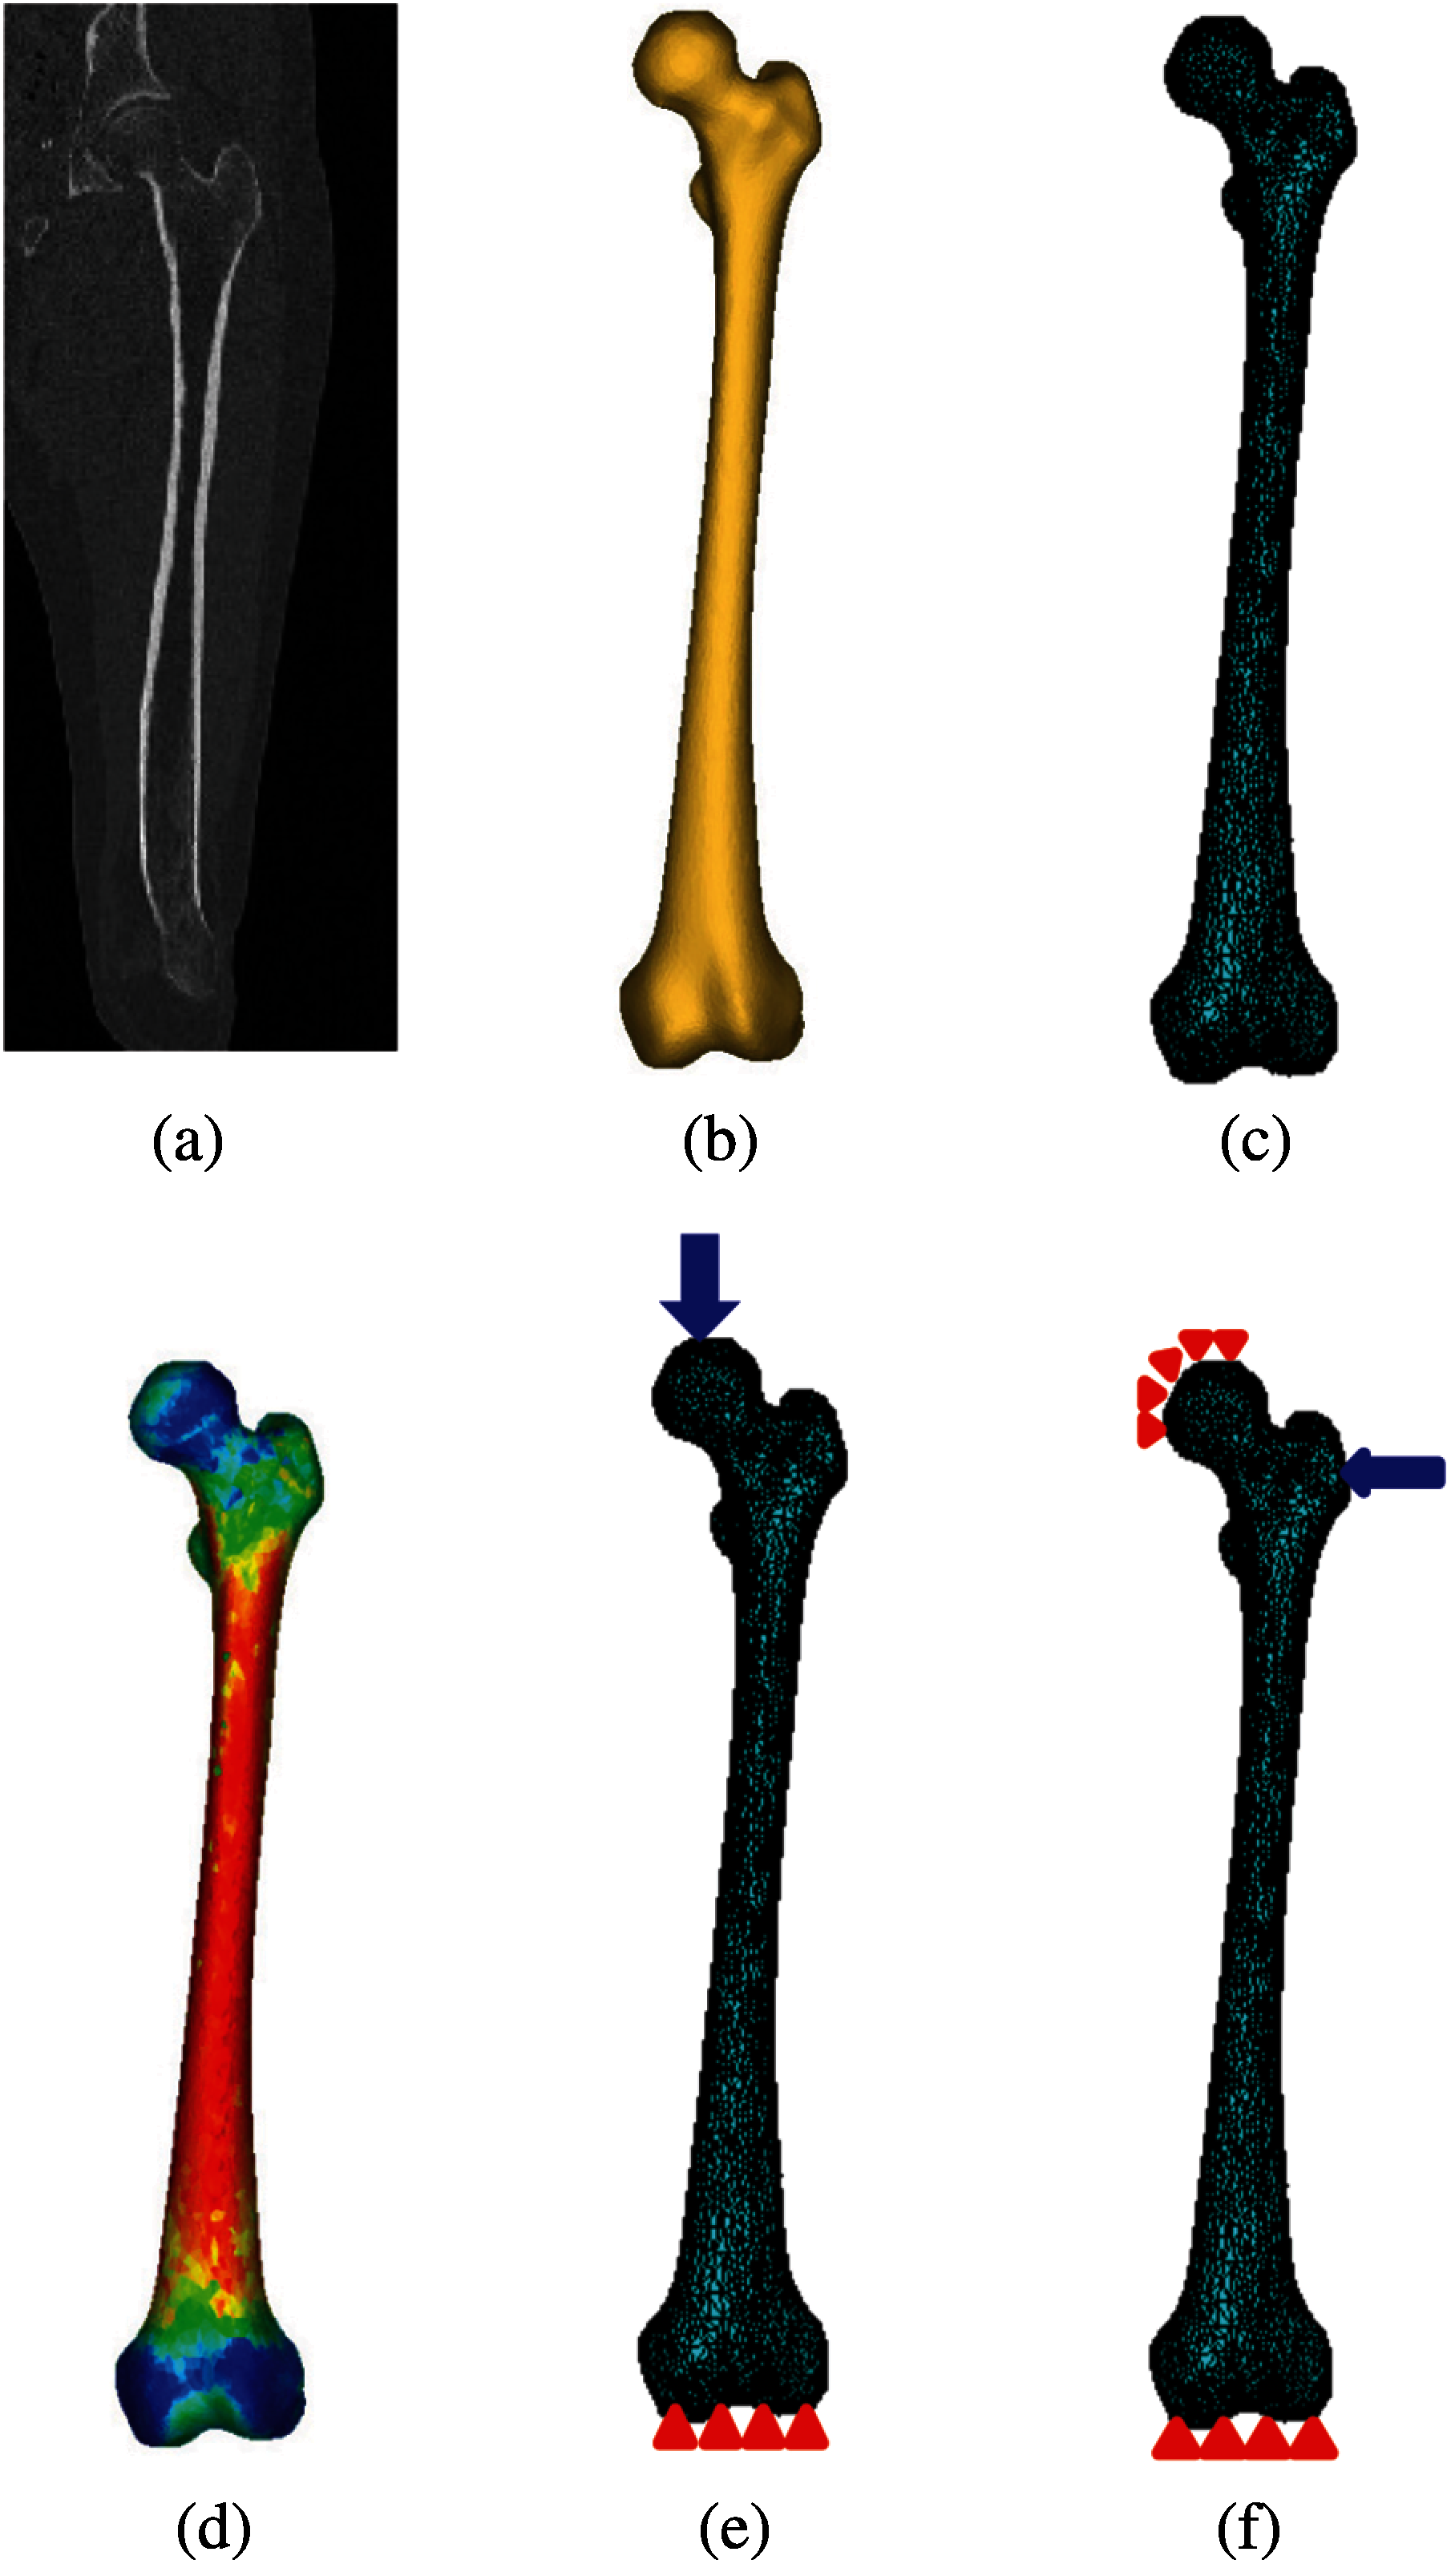
Figure 1: QCT-based FE simulation of the human femur: (a) femur QCT scanning, (b) femur 3D model constructed from the QCT scanning, (c) 3D FE model of the femur, (d) assignment of inhomogeneous isotropic material properties, (e) single-leg stance loading and boundary conditions, and (f) sideways fall loading and boundary conditions. (Color should be used for this figure)
3D FE model of the femur with the assigned material properties, obtained from Mimics, is imported to ANSYS for further simulations and analyses. Single-leg stance and sideways fall configurations are simulated in the FE analysis. To simulate the single-leg stance, 2.5 times of the subject's body weight, as a distributed load, is applied on the femoral head [19] and the distal end of the femur is assumed constrained in all directions [17,20] (see Fig. 1e),
where w is the subject's body weight in Newton (N).
To simulate the sideways fall condition, the distal end of the femur is assumed completely fixed and the femur head is considered constrained in the loading direction (see Fig. 1f) [10,21]. The impact force, due to the sideways fall, is applied on the greater trochanter of the femur (Fig. 1f) and given by [19,22],
where h is the height of the subject in centimeter.
Throughout this study, all FE simulations and analyses are done automatically using ANSYS Parametric Design Language (APDL) codes by applying all loading and boundary conditions to a group of nodes at the corresponding locations of the femur (see Figs. 1e and 1f).
Femoral neck, intertrochanteric, and subtrochanteric fractures are three common types of hip fracture (Fig. 2) which constitute, respectively, 37%, 49%, and 14% of the total hip fractures [23]. In this study, the smallest femoral neck cross-section (SFN CS), the intertrochanteric cross-section (IntT CS), and the subtrochanteric cross-section (SubT CS) are considered as the critical cross-sections of the femur as shown in Fig. 2 and are determined using the approach presented in our previous studies [3,4].
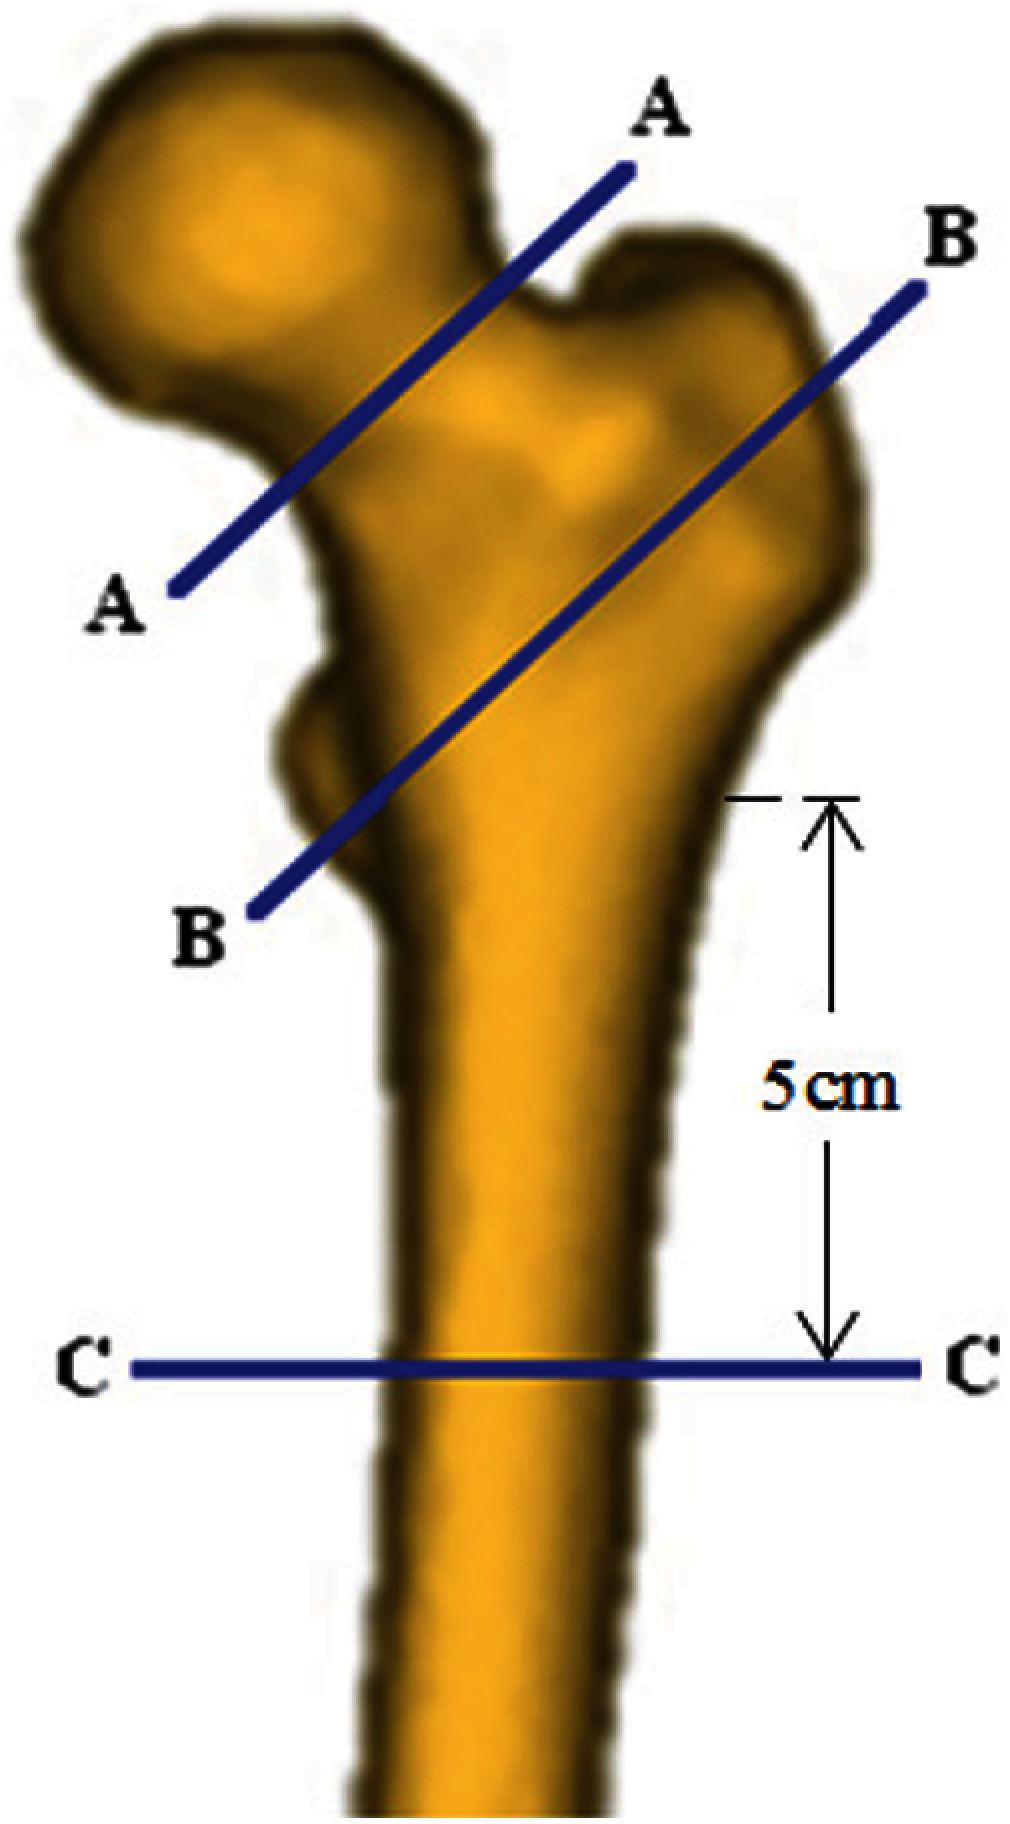
Figure 2: Critical femoral cross-sections: the smallest femoral neck cross-section (section A--A), the intertrochanteric cross-section (section B--B), and the subtrochanteric cross-section (section C--C) [3,4]
2.4 Hip Fracture Risk Index Definition
We define the hip fracture risk index based on the strain energy criterion. The strain energy at the three critical cross-sections of the femur is calculated using MATLAB codes and based on the data obtained from the FE solutions. To generate a two-dimensional (2D) mesh for computing the cross-section strain energy, the plane boundaries of the three critical cross-sections, obtained from the FE mesh, are imported to MATLAB codes. The generated triangle elements over the three critical cross-sections are shown in Fig. 3.
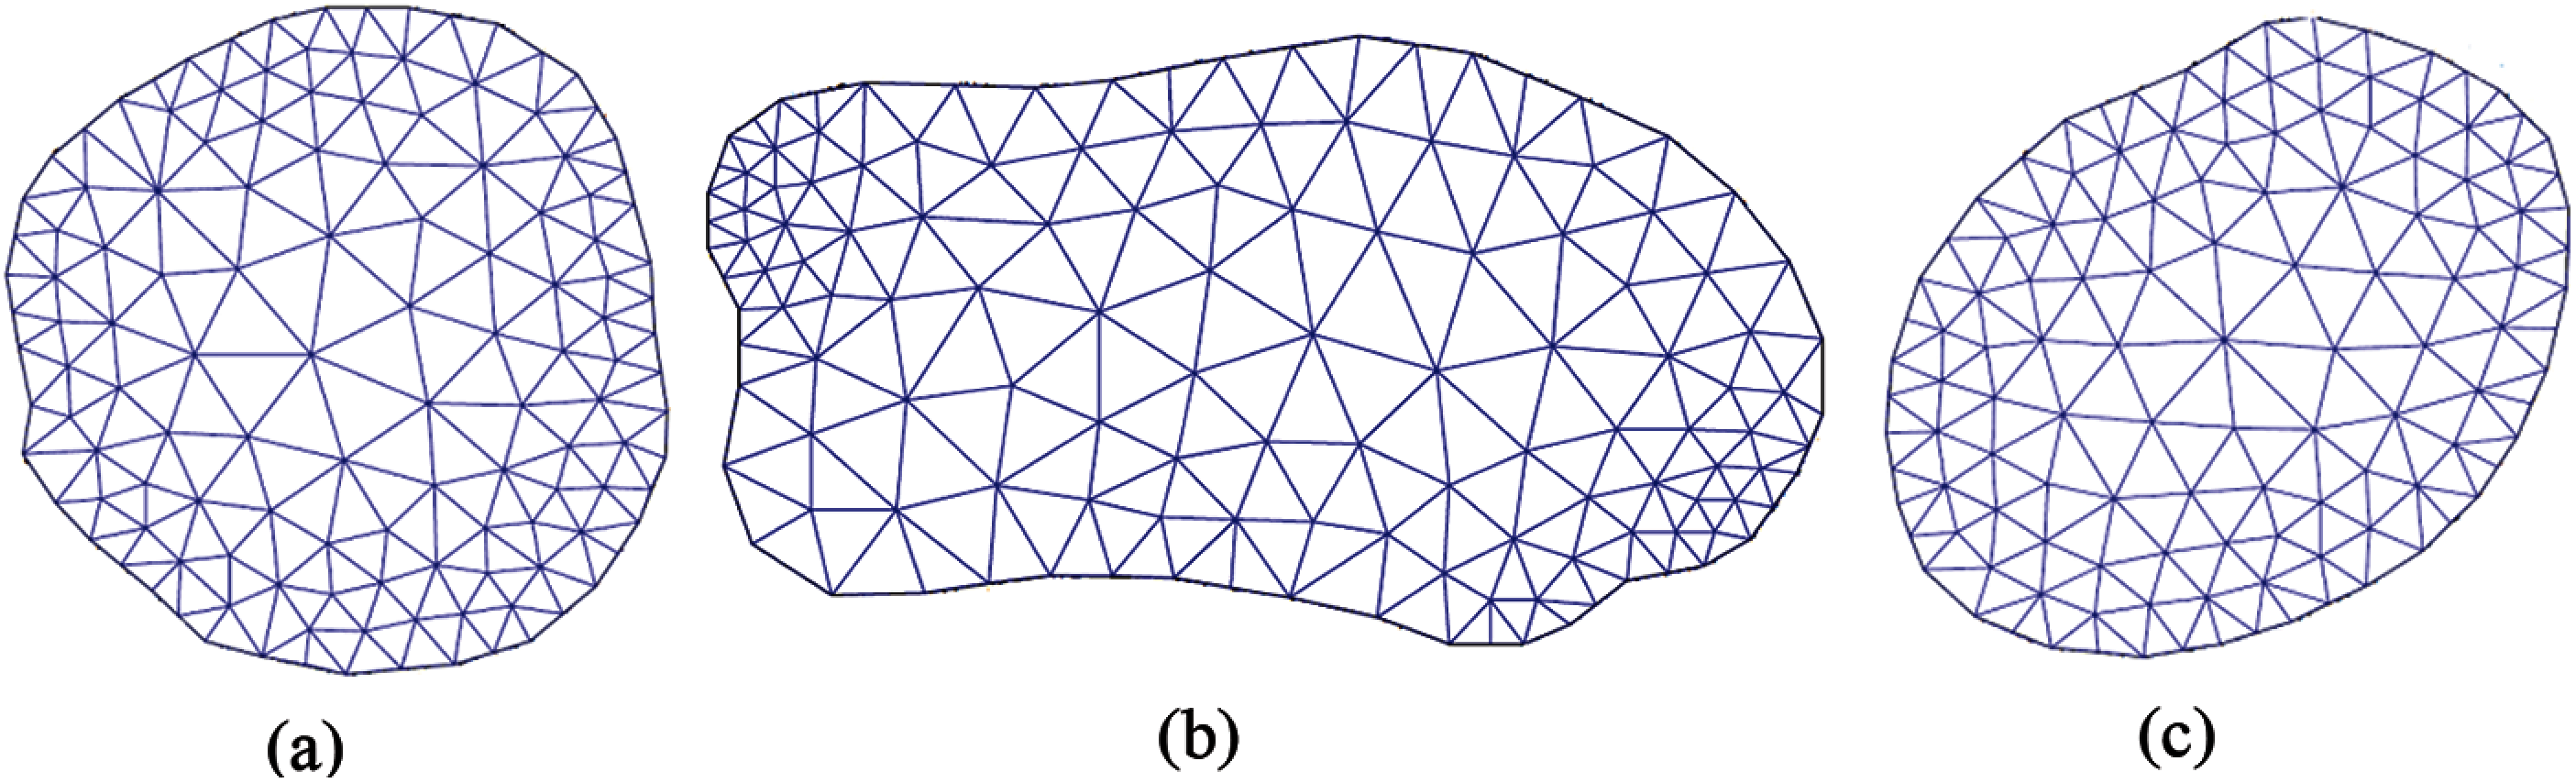
Figure 3: Generated triangle elements over (a) the smallest femoral neck cross-section, (b) the intertrochanteric cross-section, and (c) the subtrochanteric cross-section [3,4]
The strain energy at the three critical cross-sections of the femur due to the applied forces is obtained as the sum of the strain energy of all triangle elements generated over the cross-section,~i.e.,
where U represents the strain energy at the three critical cross-sections of the femur,
Gaussian integration method is employed to compute the strain energy of triangle element e of the proposed cross-section. Integration points in each triangle element are assigned using in-house MATLAB codes. By using the Gaussian integration method, the strain energy of triangle element e due to the applied forces is computed by,
where
where
where
where Poisson's ratio (
The maximum allowable strain energy or yield strain energy of the three critical cross-sections of the femur is also calculated using in-house MATLAB codes and the data obtained by the APDL codes from the FE solutions. The yield strain energy of the three critical cross-sections is obtained as the sum of the yield strain energy of all triangle elements generated over the cross-section, i.e.,
where
where
where
Hip fracture risk index (FRI) at the three critical cross-sections of the femur using the strain energy criterion is defined as the ratio of the strain energy (
where
3 Numerical Results and Discussions
Fig. 4 displays the convergence results of FE solutions. The convergence study shows that for the maximum element edge length smaller than 8 mm, there is no much significant difference in the maximum von Mises stress at the narrowest femoral neck. Hence, throughout this study to construct the femur FE model, the maximum element edge length is considered 8 mm.
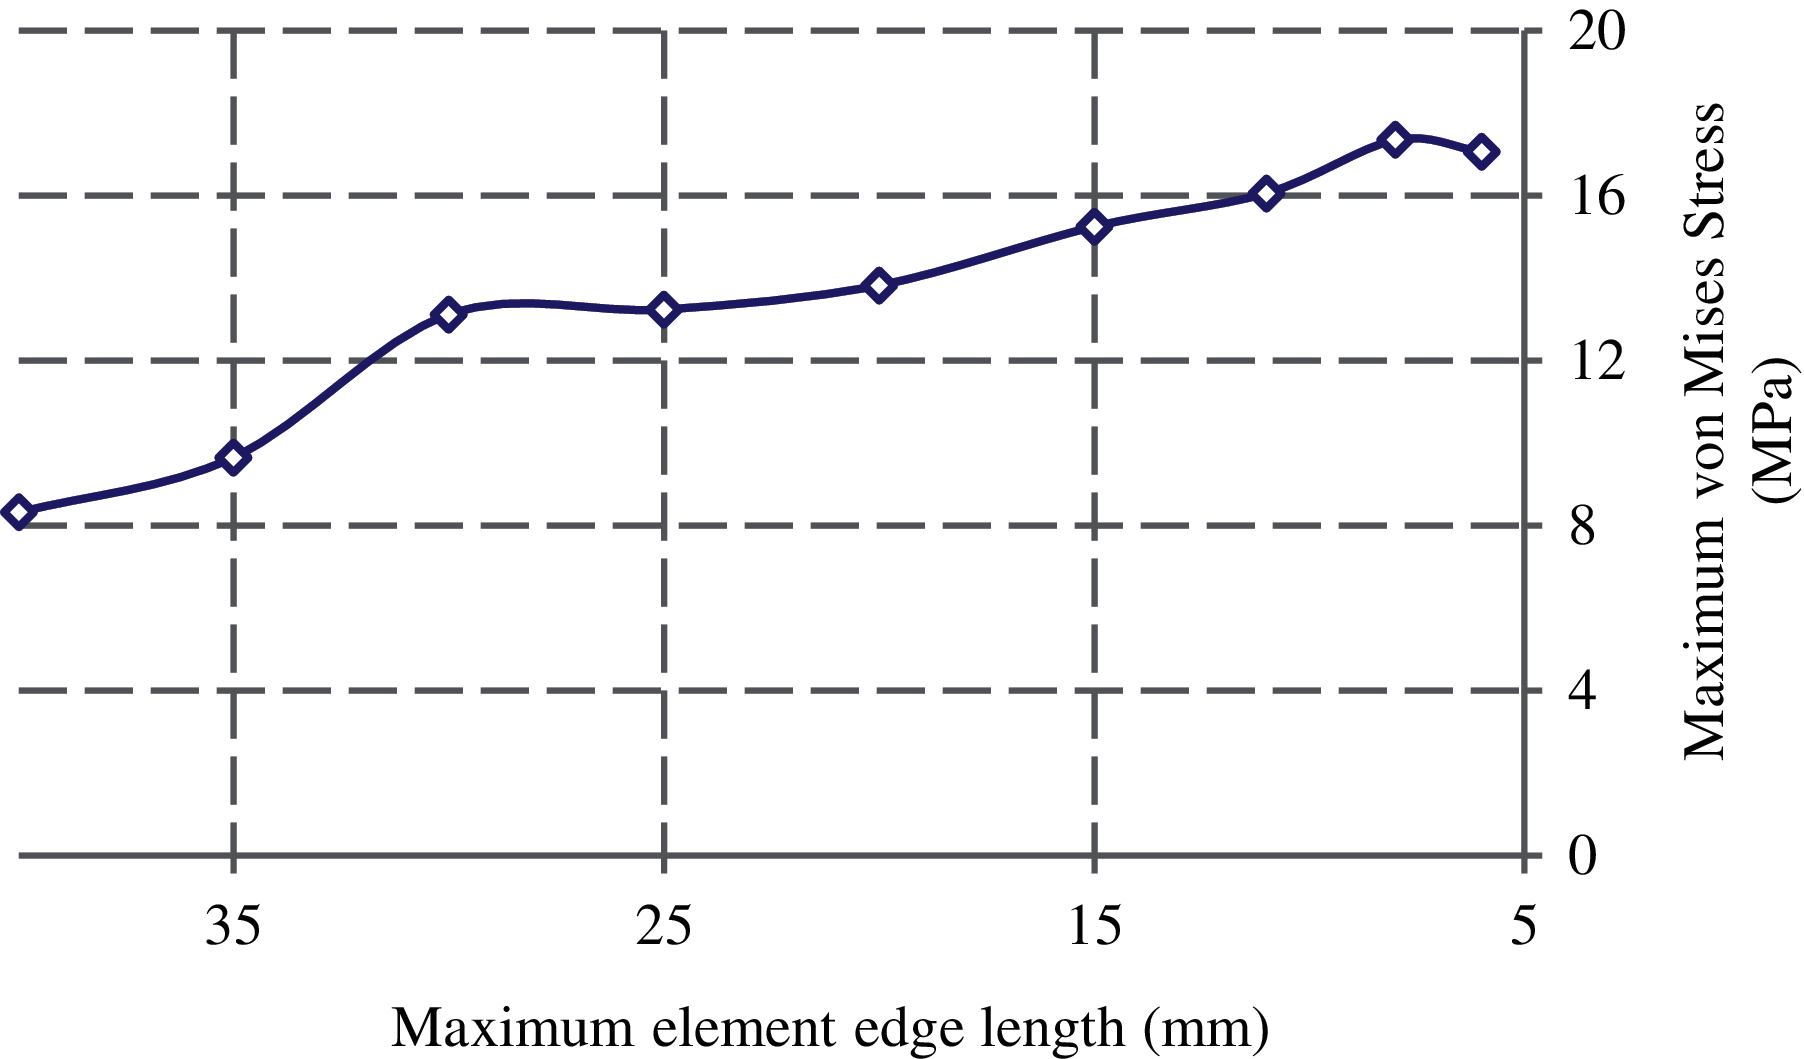
Figure 4: Convergence of the maximum von Mises stress at the femoral neck with the element size
3D FE models of the femur with different material bins are created to investigate model convergence in assigning inhomogeneous material properties. To this purpose, the maximum von Mises stress at the narrowest femoral neck is calculated under the same loading and boundary conditions. As seen from Fig. 5, the results of the convergence study show that there is no noticeable change in the maximum von Mises stress with the number of material bins larger than 50. Therefore, 50 discrete material bins are used to assign the material properties throughout this study.
A convergence study is also conducted to find the element size used in integrating the cross-sectional strain energy. The FRI at the smallest femoral neck cross-section is computed with different maximum element edge lengths. The results are plotted in Fig. 6 and as seen, three is not a significant difference on the FRIs with the maximum element edge length smaller than 5 mm. Thus, the maximum element edge length is considered 5 mm in computing the cross-sectional strain energy.
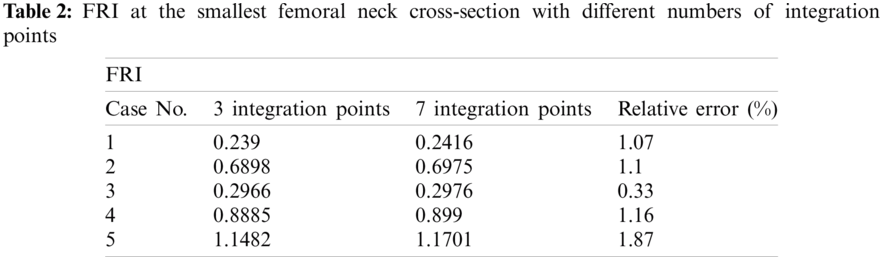
To find the required number of integration points for computing the hip FRI, we calculate the FRI at the smallest femoral neck cross-section of 5 clinical cases by considering 3 and 5 integration points (Tab. 2). As shown in Tab. 2, the relative errors between FRIs obtained with 3 and 7 integration points are not much significant. Hence, the 3-point integration rule is considered in this study with lower computational time.
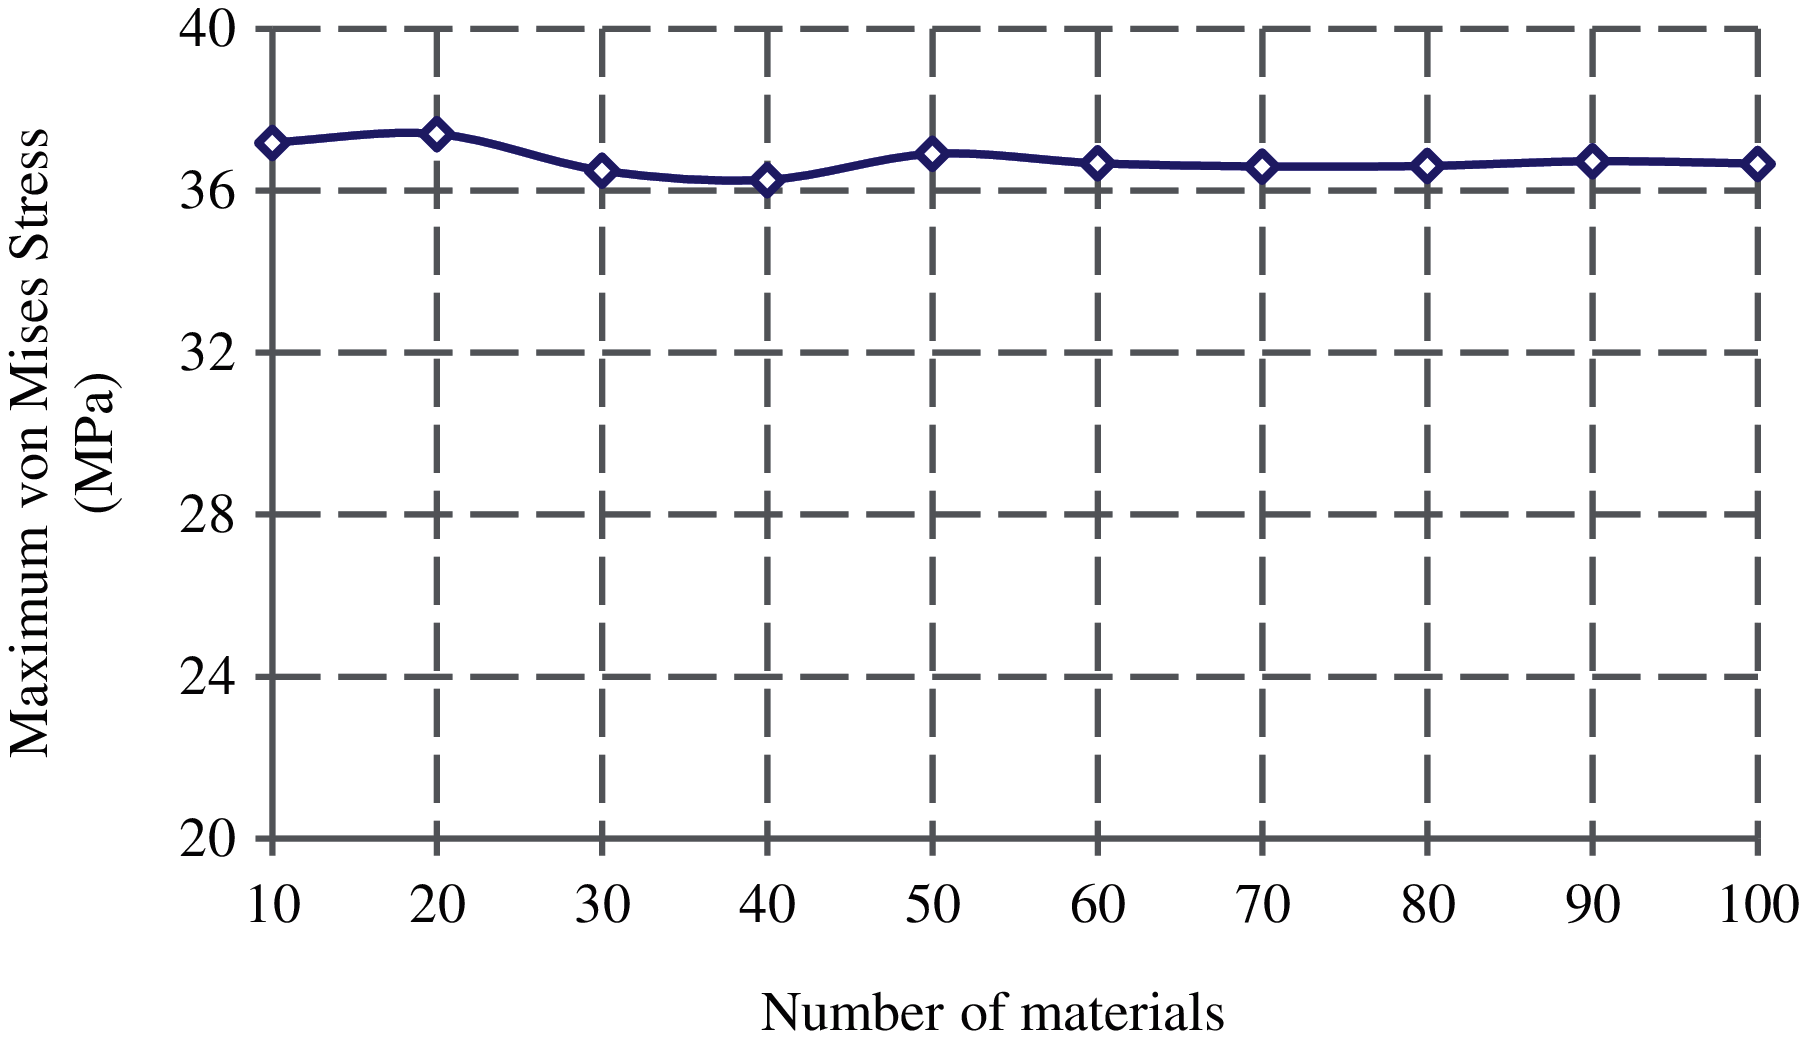
Figure 5: Convergence of the maximum von Mises stress at the femoral neck with the material bins
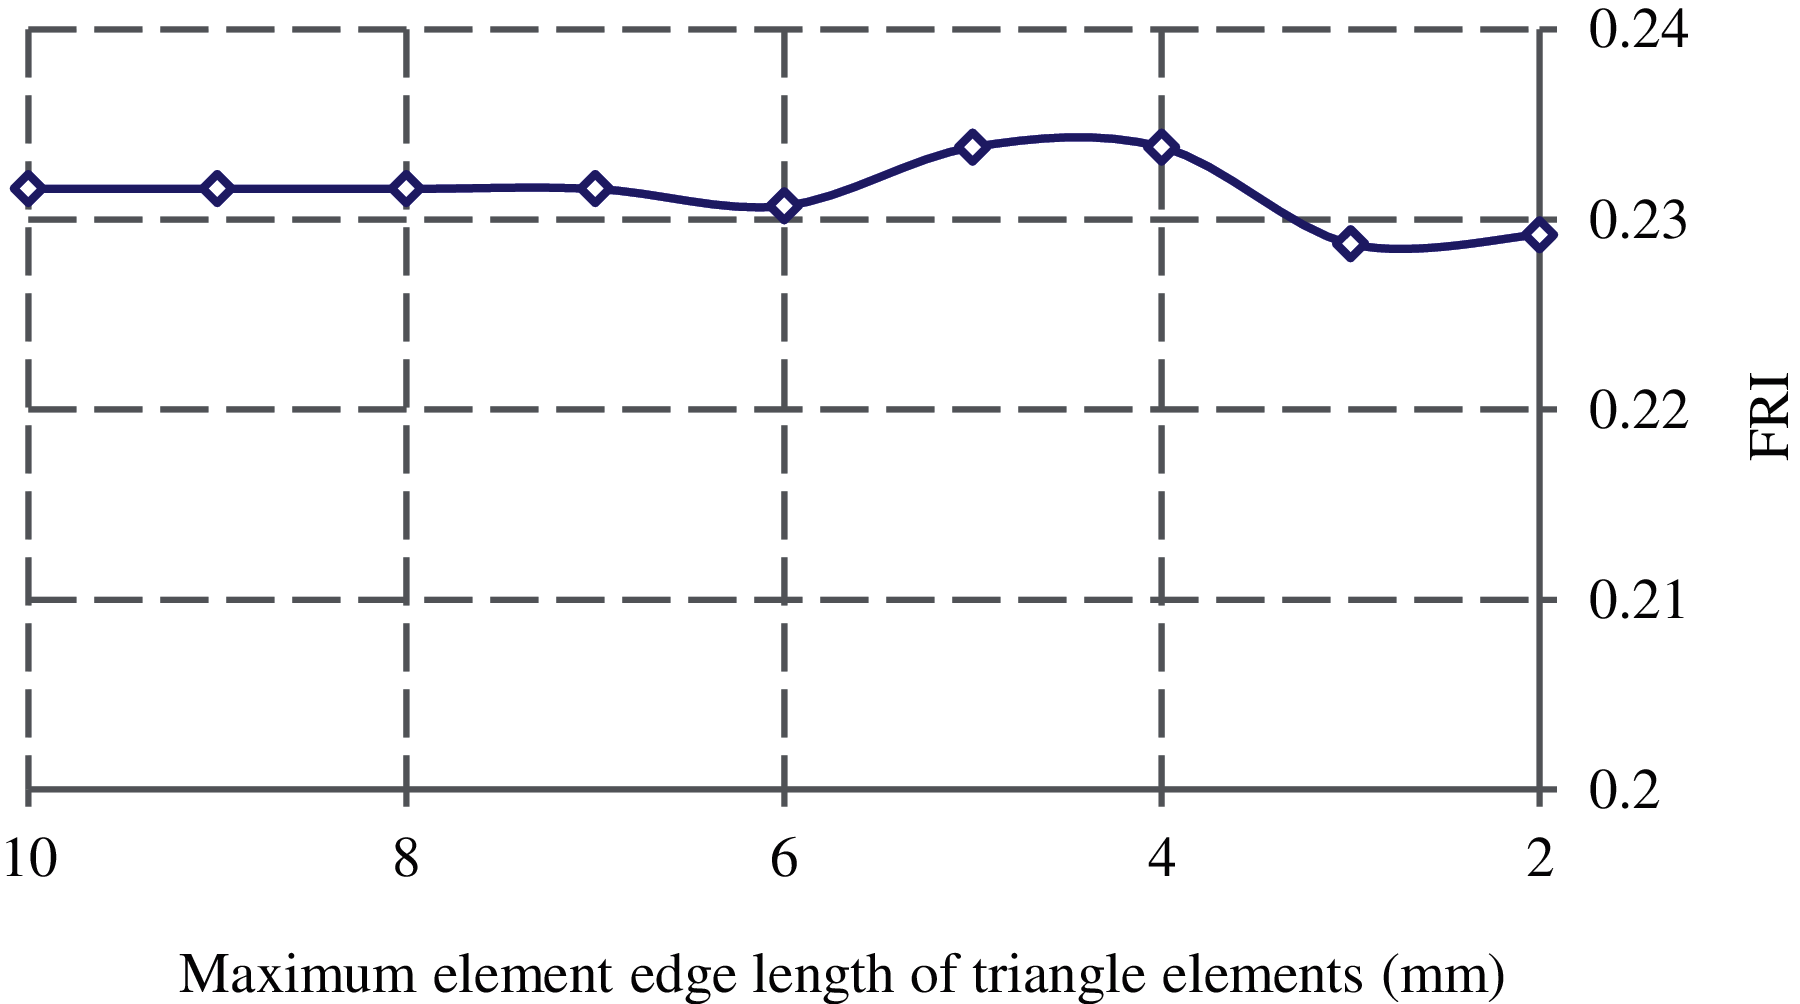
Figure 6: Convergence of FRI with the maximum element edge length of triangle elements generated over the smallest femoral neck cross-section
3.2 Parametric Study of Hip Fracture Risk
In this study, the correlations between the hip fracture risk and various human body parameters such as age, body height, weight, and BMI are investigated using 30 females (totally 60 right and left femurs) and 30 males (totally 60 right and left femurs). The correlation coefficients (
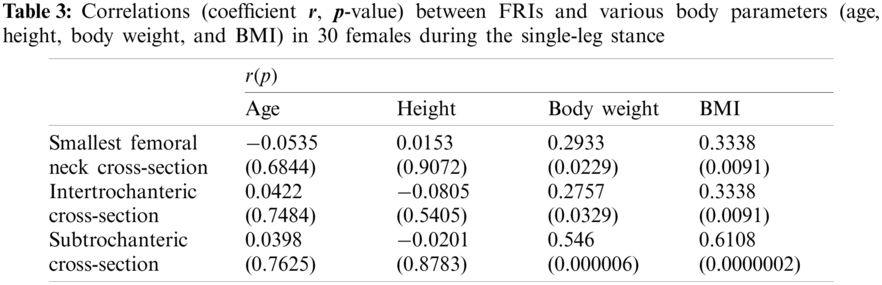
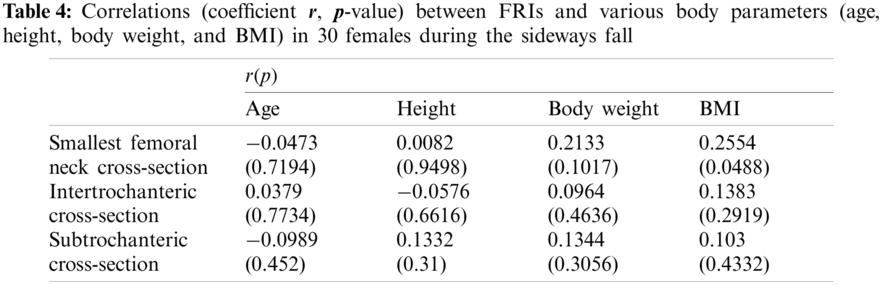
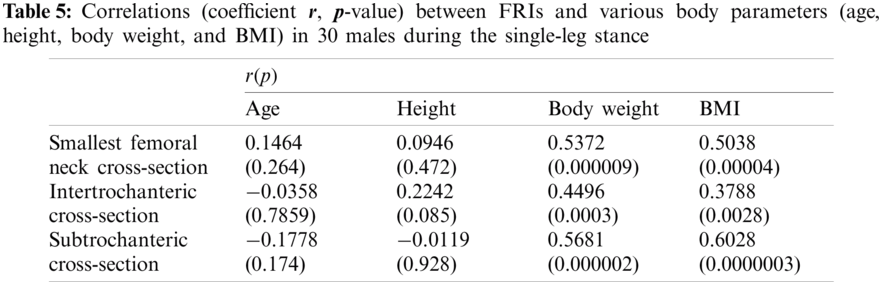
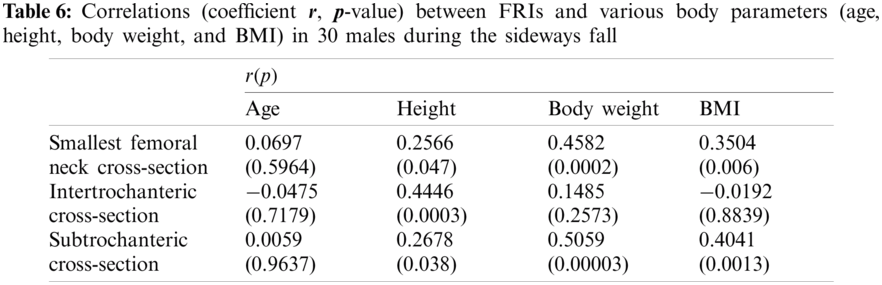
The FRI variations vs. age at the three critical cross-sections of the femur during the single-leg stance and the sideways fall for 30 females and 30 males are shown in the scattered plots in Figs. 7 and 8, respectively. It is seen that the hip fracture risk has a positive correlation with the age at the three critical cross-sections, but as shown in Tabs. 3–6, this correlation is not strong (
The scattered plots of FRI vs. height at the three critical cross-sections of the femur during the single-leg stance and the sideways fall for 30 females and 30 males are also shown, respectively, in Figs. 9 and 10. The hip fracture risk also has a positive correlation with the height, but this correlation for females during both the single-leg stance and the sideways fall and males during the single-leg stance is weak (
As seen in Figs. 11 and 12, there is an increasing trend of FRI versus body weight. There is a strong correlation (
The correlation between FRI and BMI (representative of body shape) is also positive (see Figs. 13 and 14). This correlation is strong (
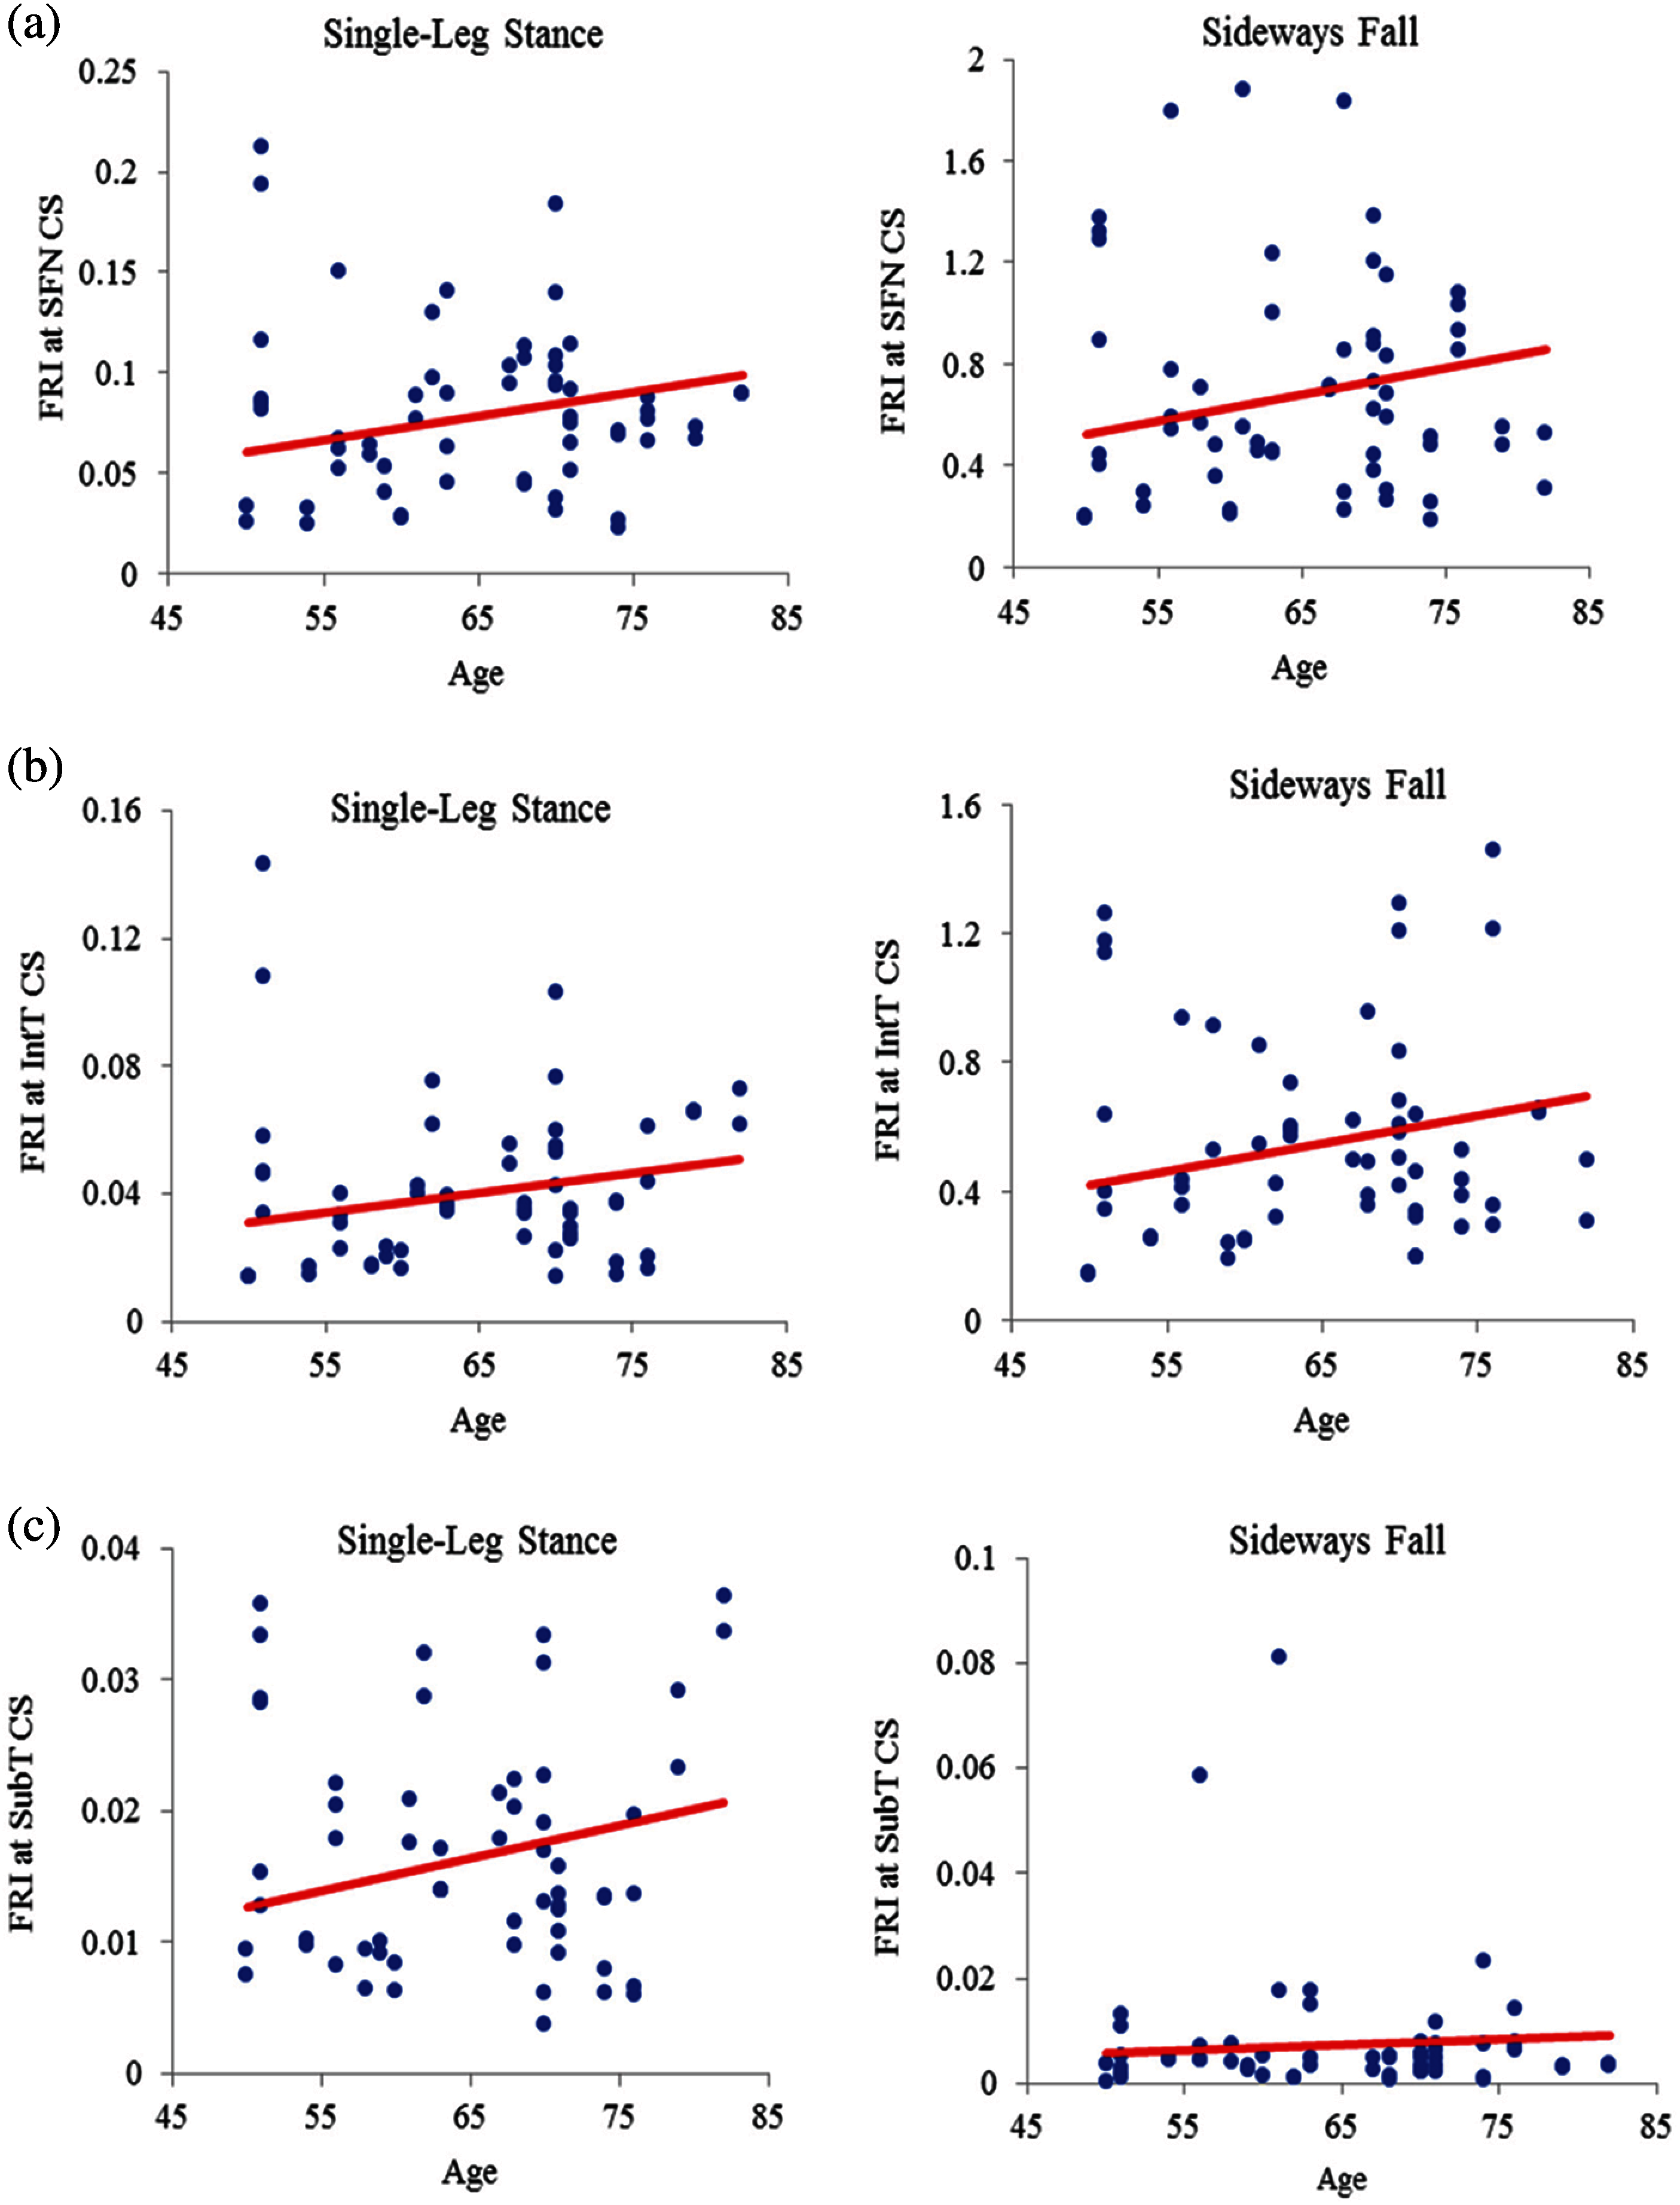
Figure 7: Variations of FRI with age in 30 females at (a) the smallest femoral neck cross-section (SFN CS), (b) the intertrochanteric cross-section (IntT CS), and (c) the subtrochanteric cross-section (SubT CS)
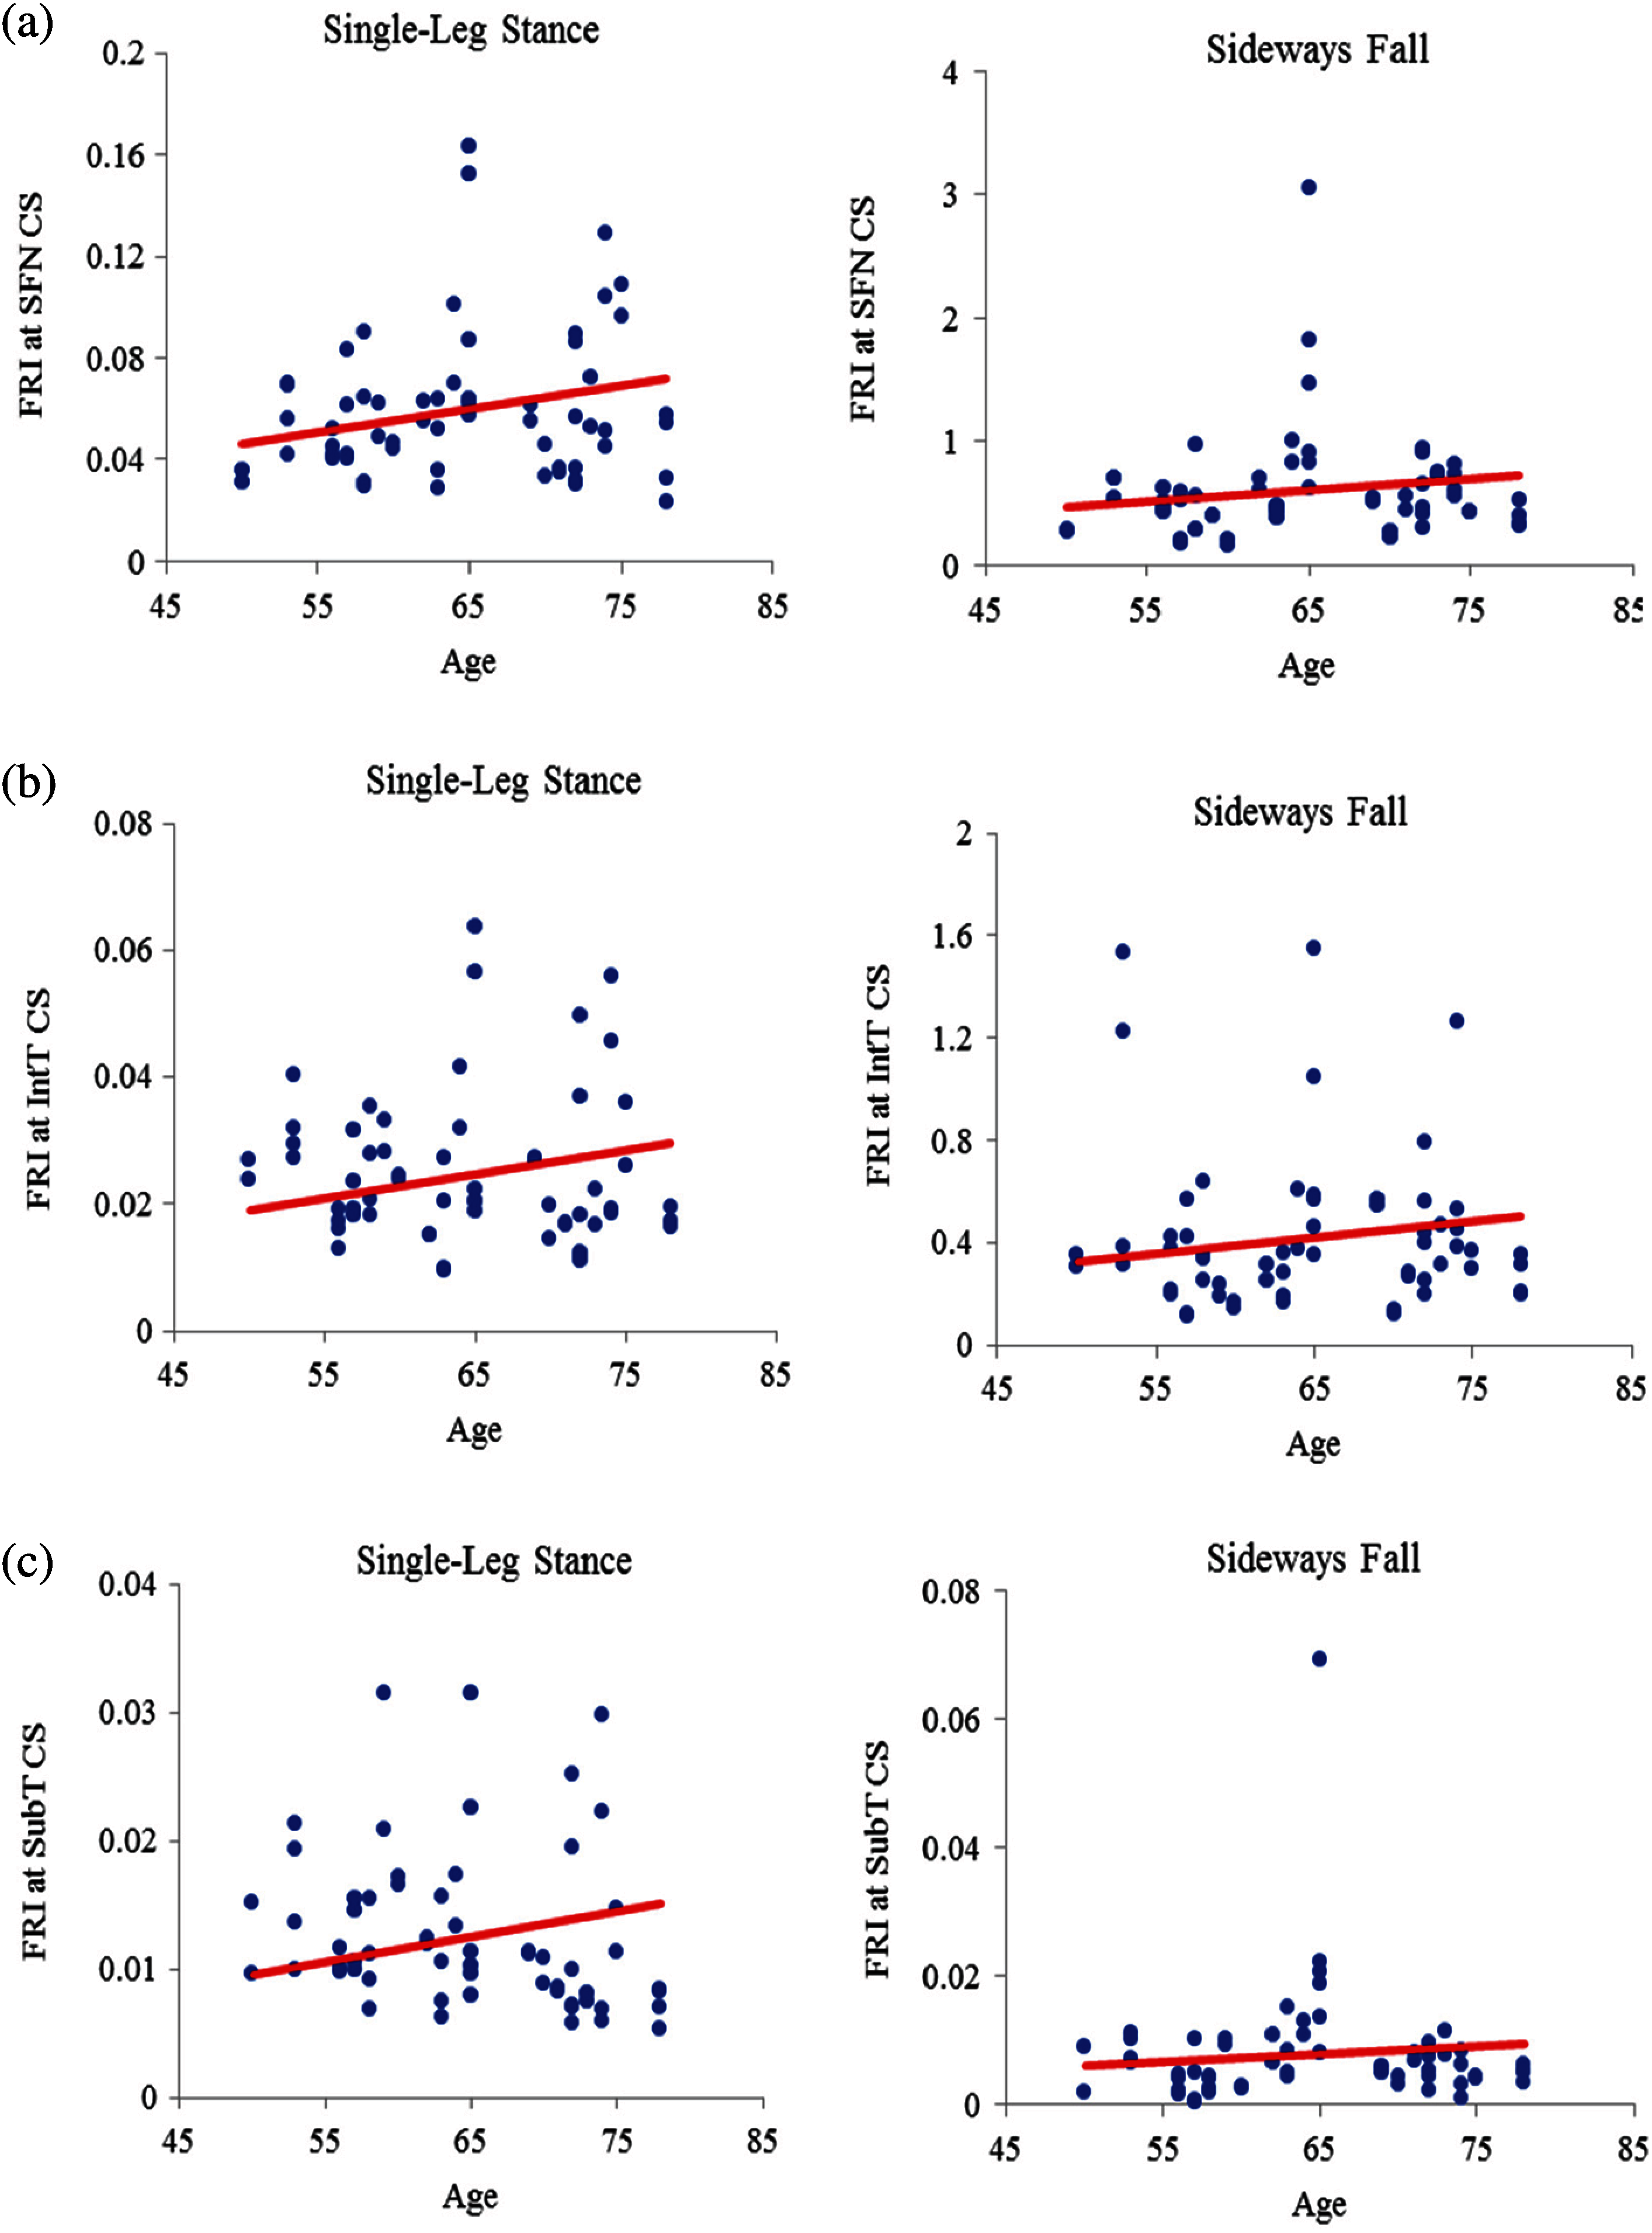
Figure 8: Variations of FRI with age in 30 males at (a) the smallest femoral neck cross-section (SFN CS), (b) the intertrochanteric cross-section (IntT CS), and (c) the subtrochanteric cross-section (SubT CS)
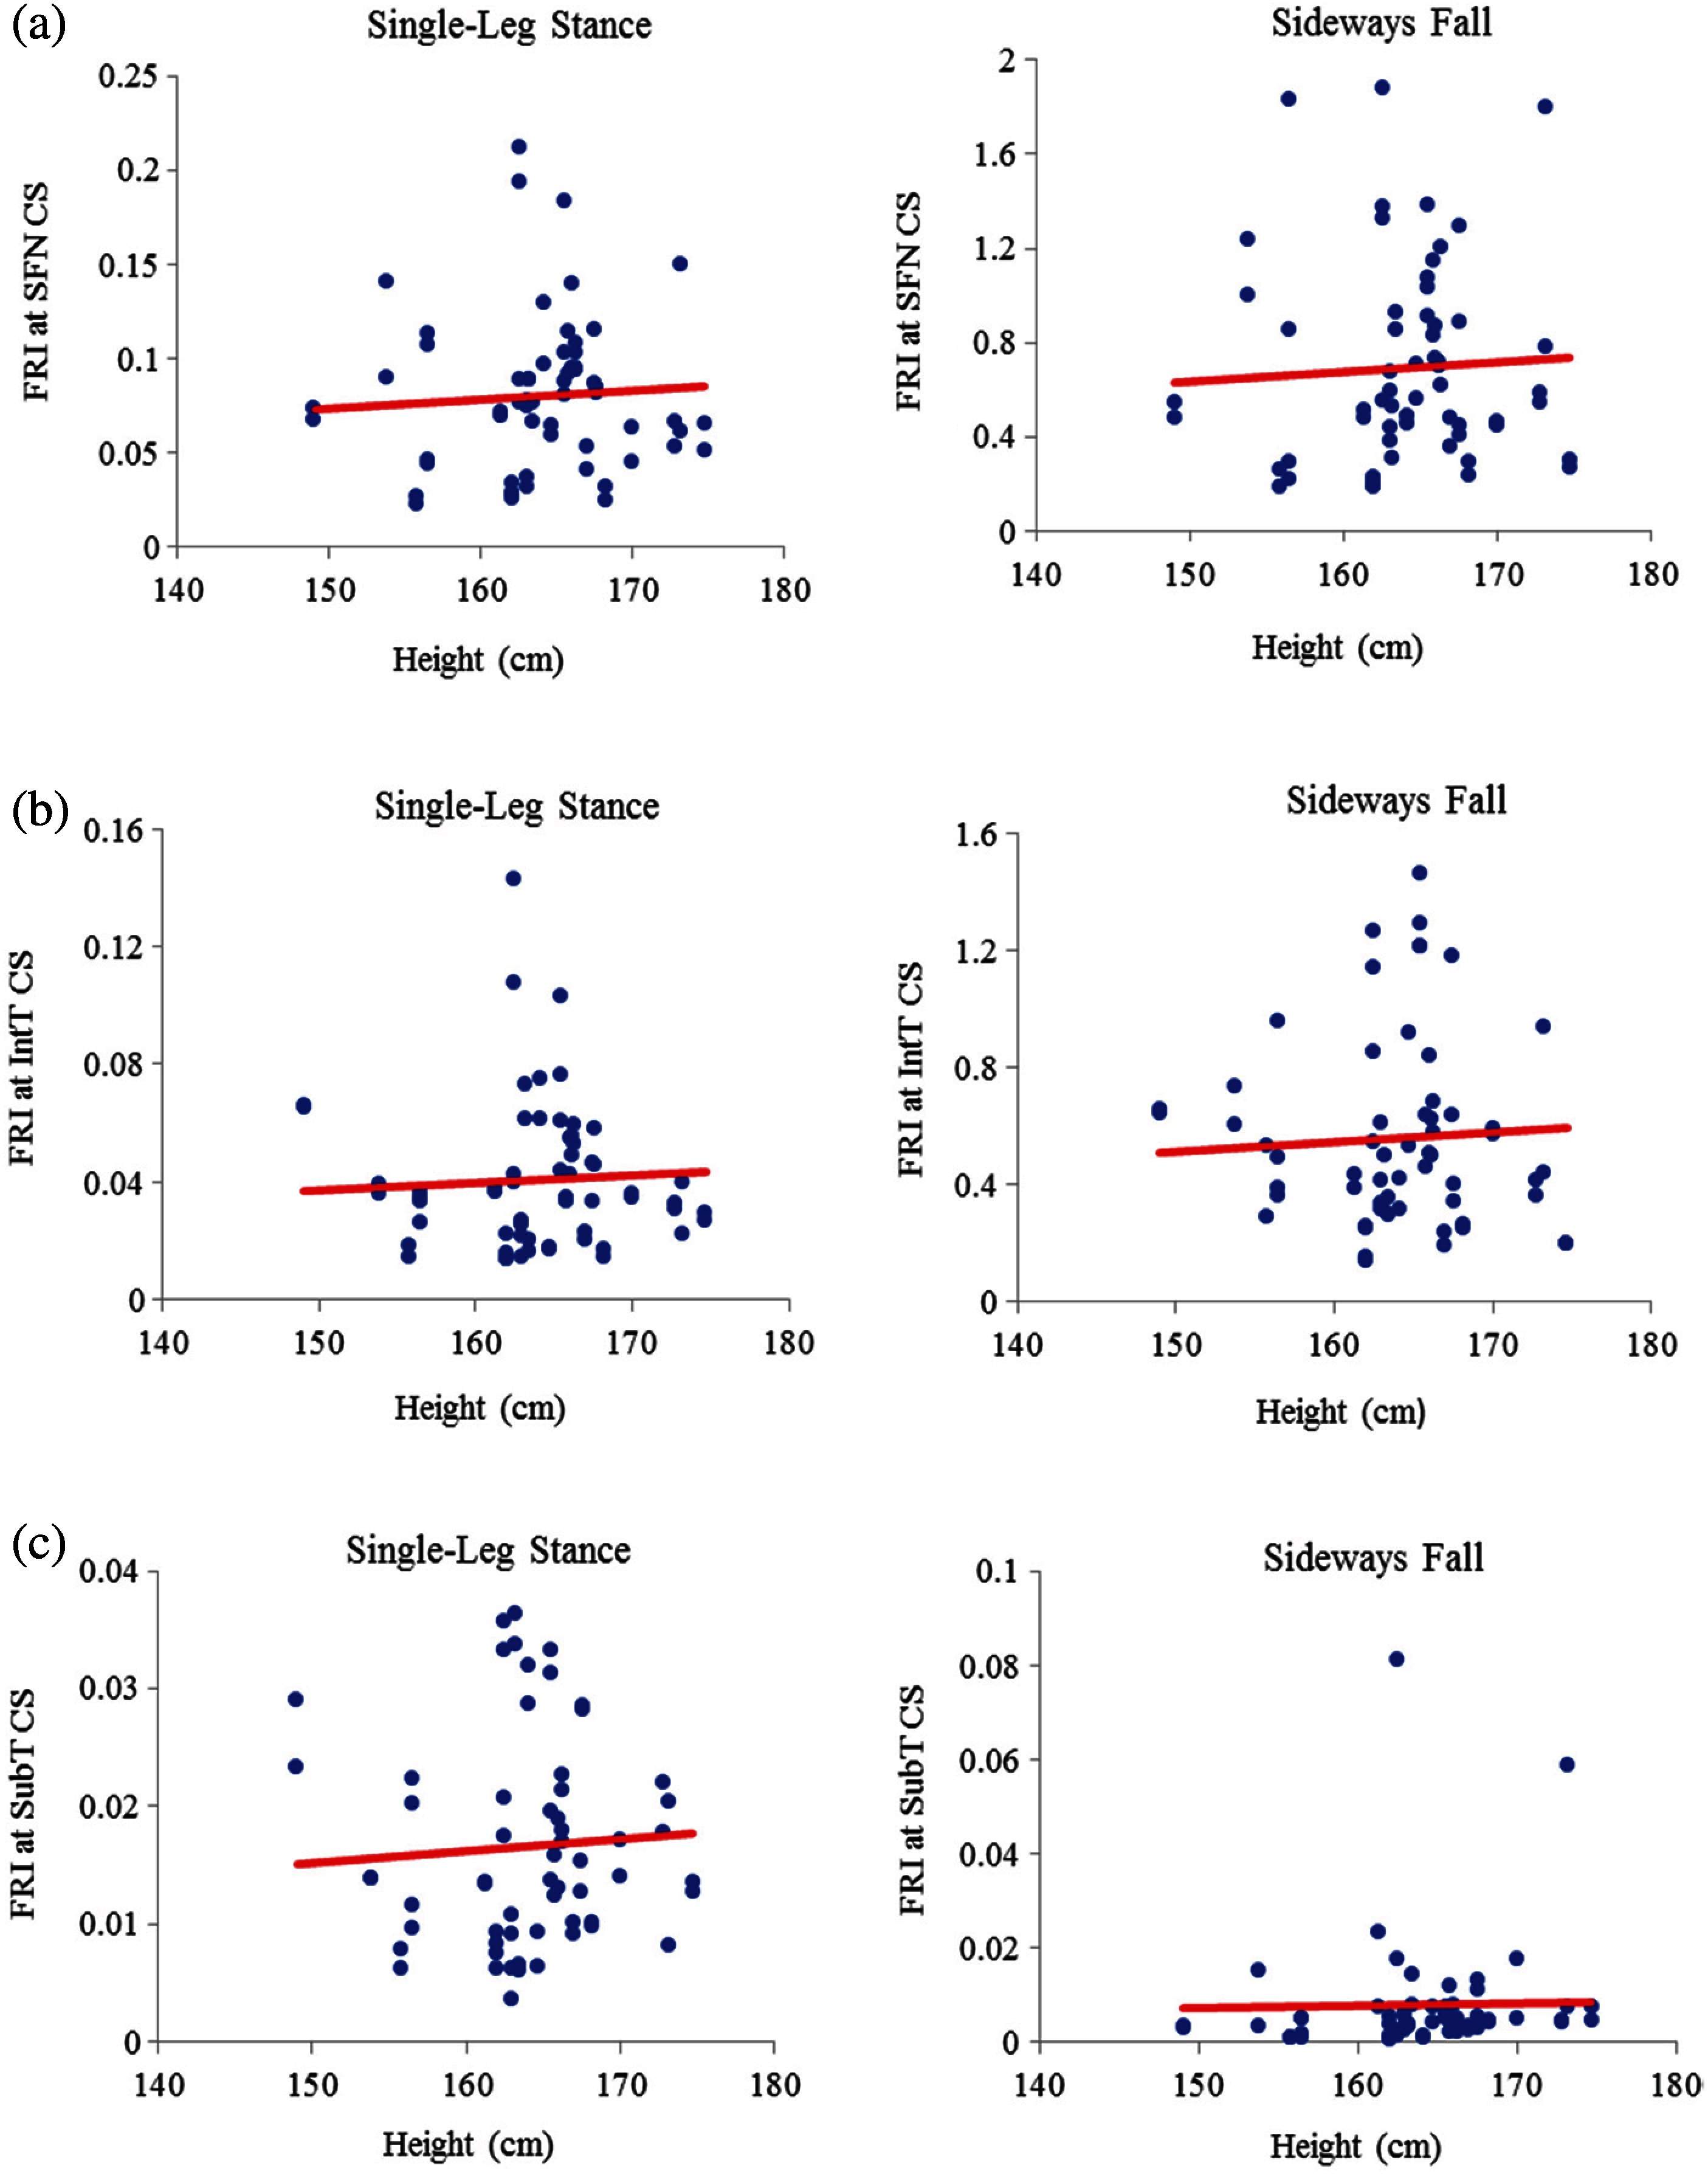
Figure 9: Variations of FRI with height in 30 females at (a) the smallest femoral neck cross-section (SFN CS), (b) the intertrochanteric cross-section (IntT CS), and (c) the subtrochanteric cross-section (SubT CS)
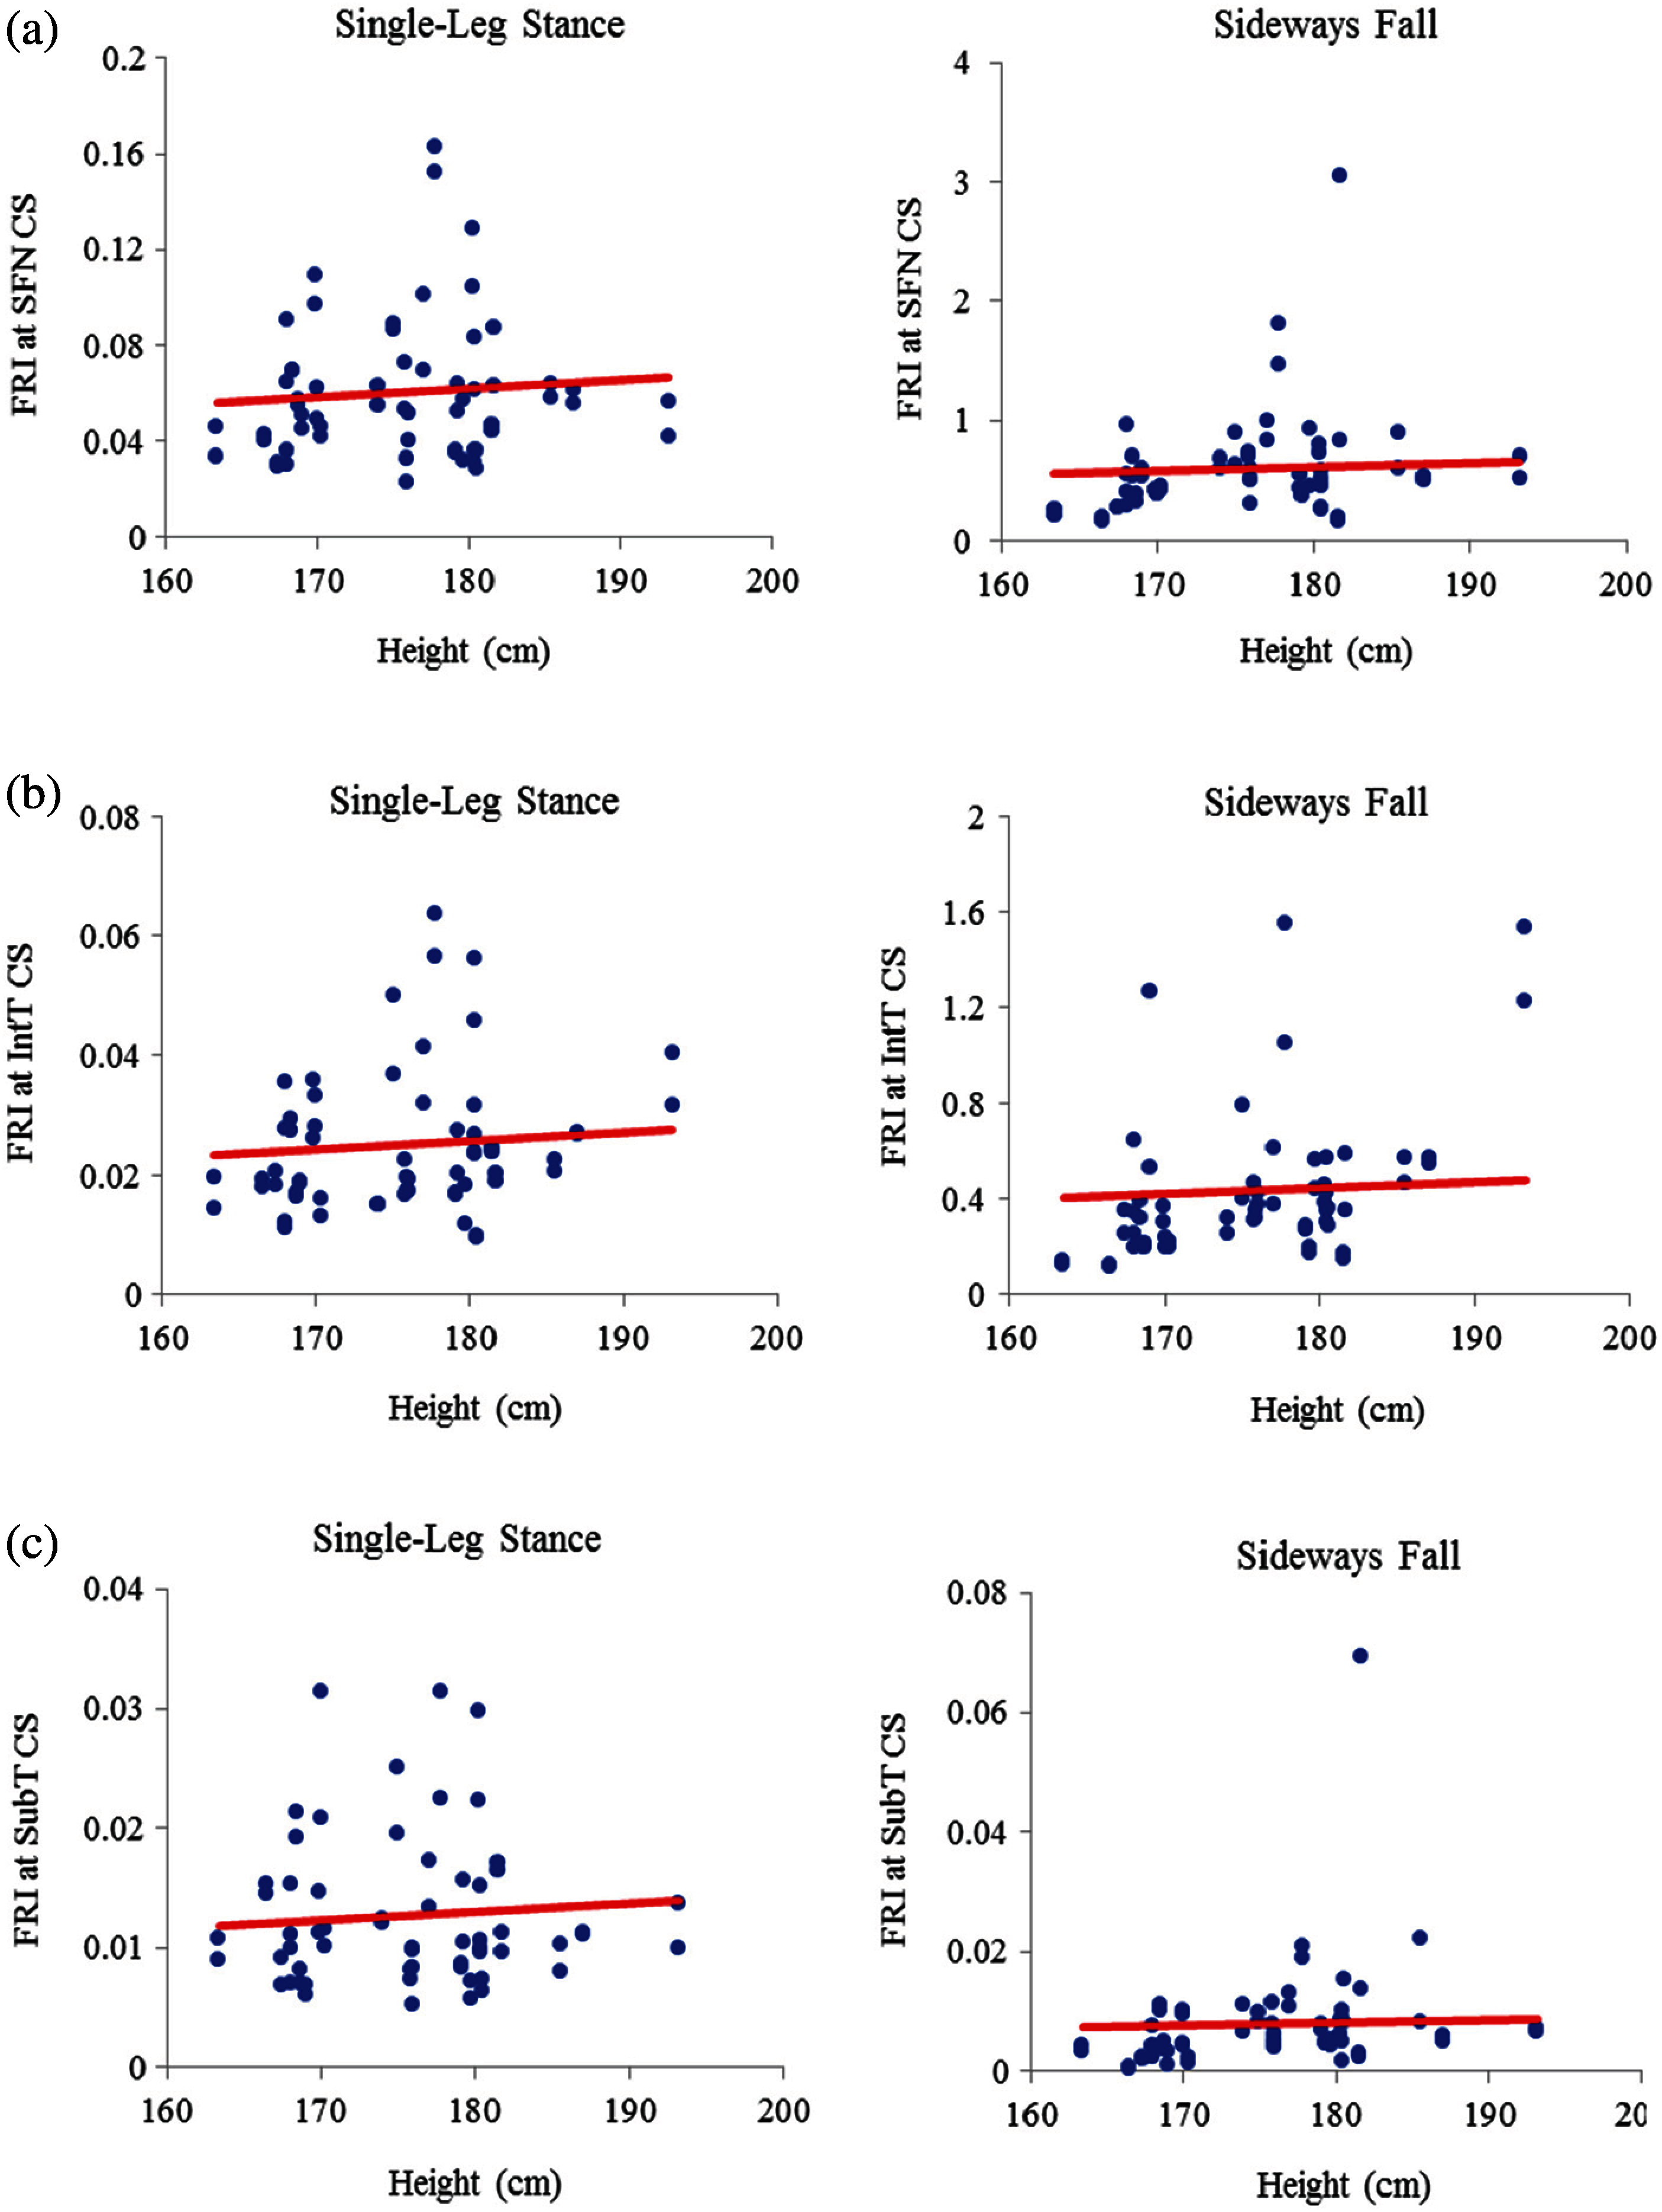
Figure 10: Variations of FRI with height in 30 males at (a) the smallest femoral neck cross-section section (SFN CS), (b) the intertrochanteric cross-section (IntT CS), and (c) the subtrochanteric cross-section (SubT CS)
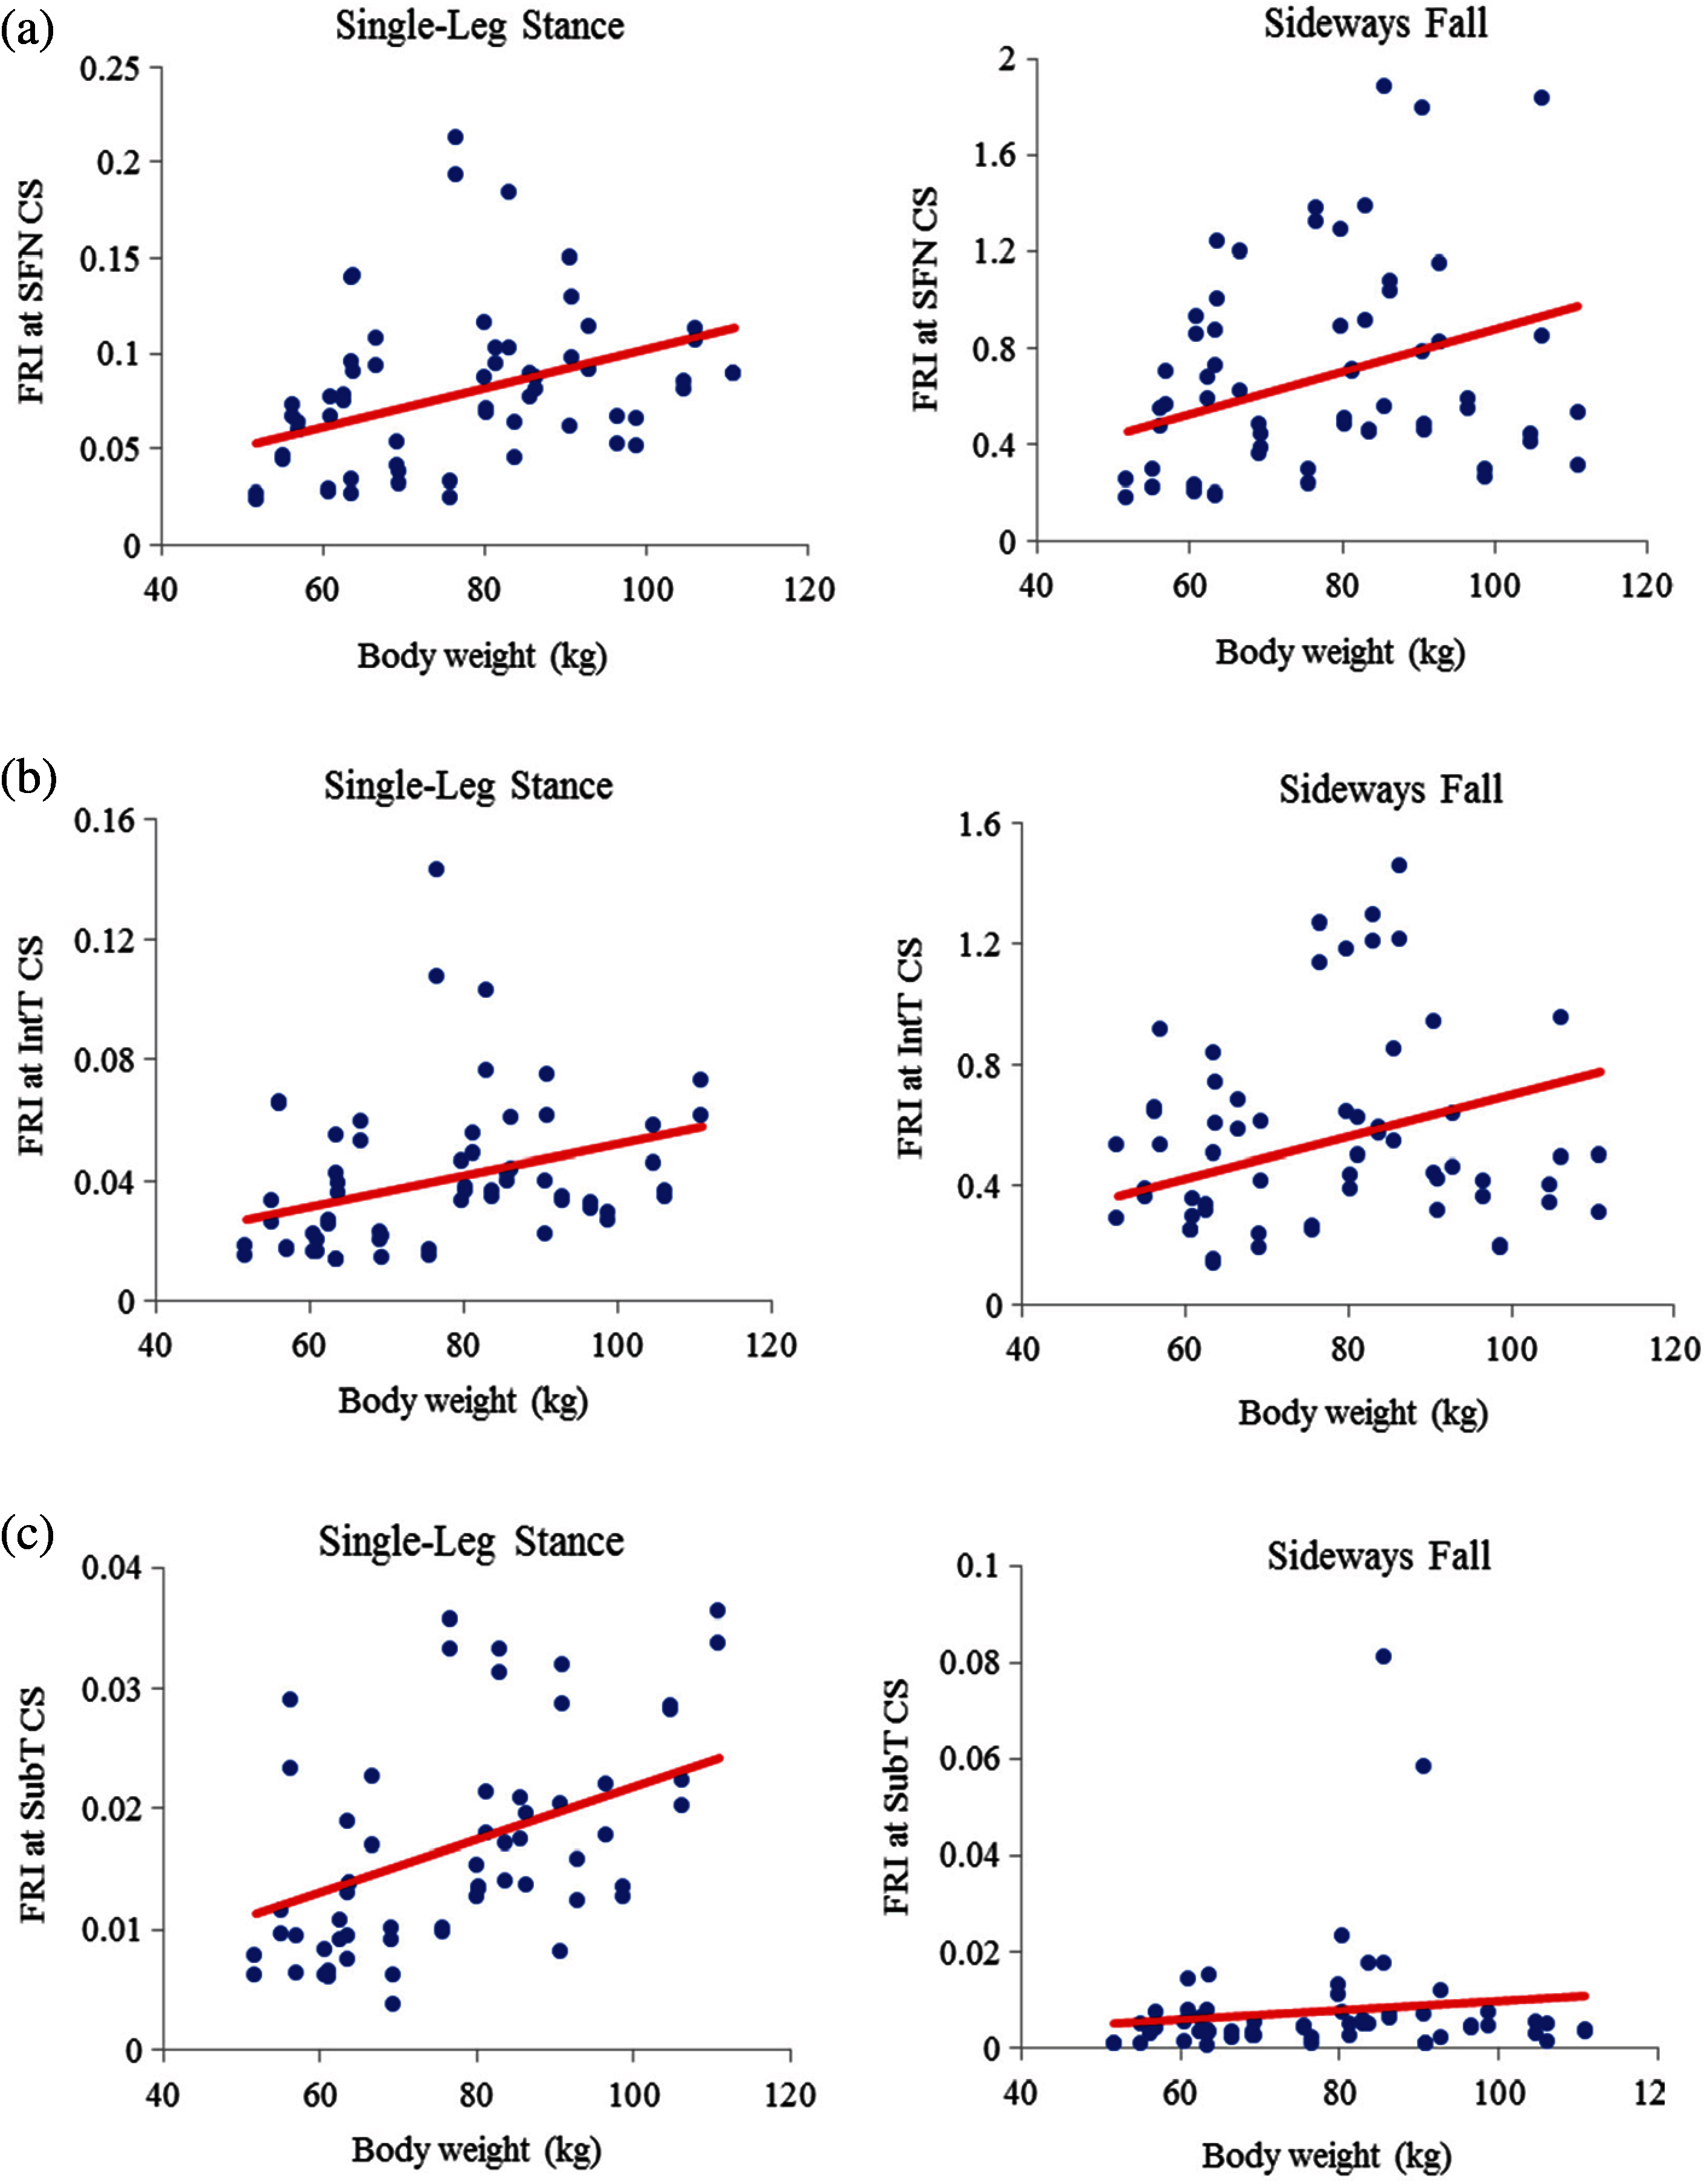
Figure 11: Variations of FRI with body weight in 30 females at (a) the smallest femoral neck cross-section section (SFN CS), (b) the intertrochanteric cross-section (IntT CS), and (c) the subtrochanteric cross-section (SubT CS)
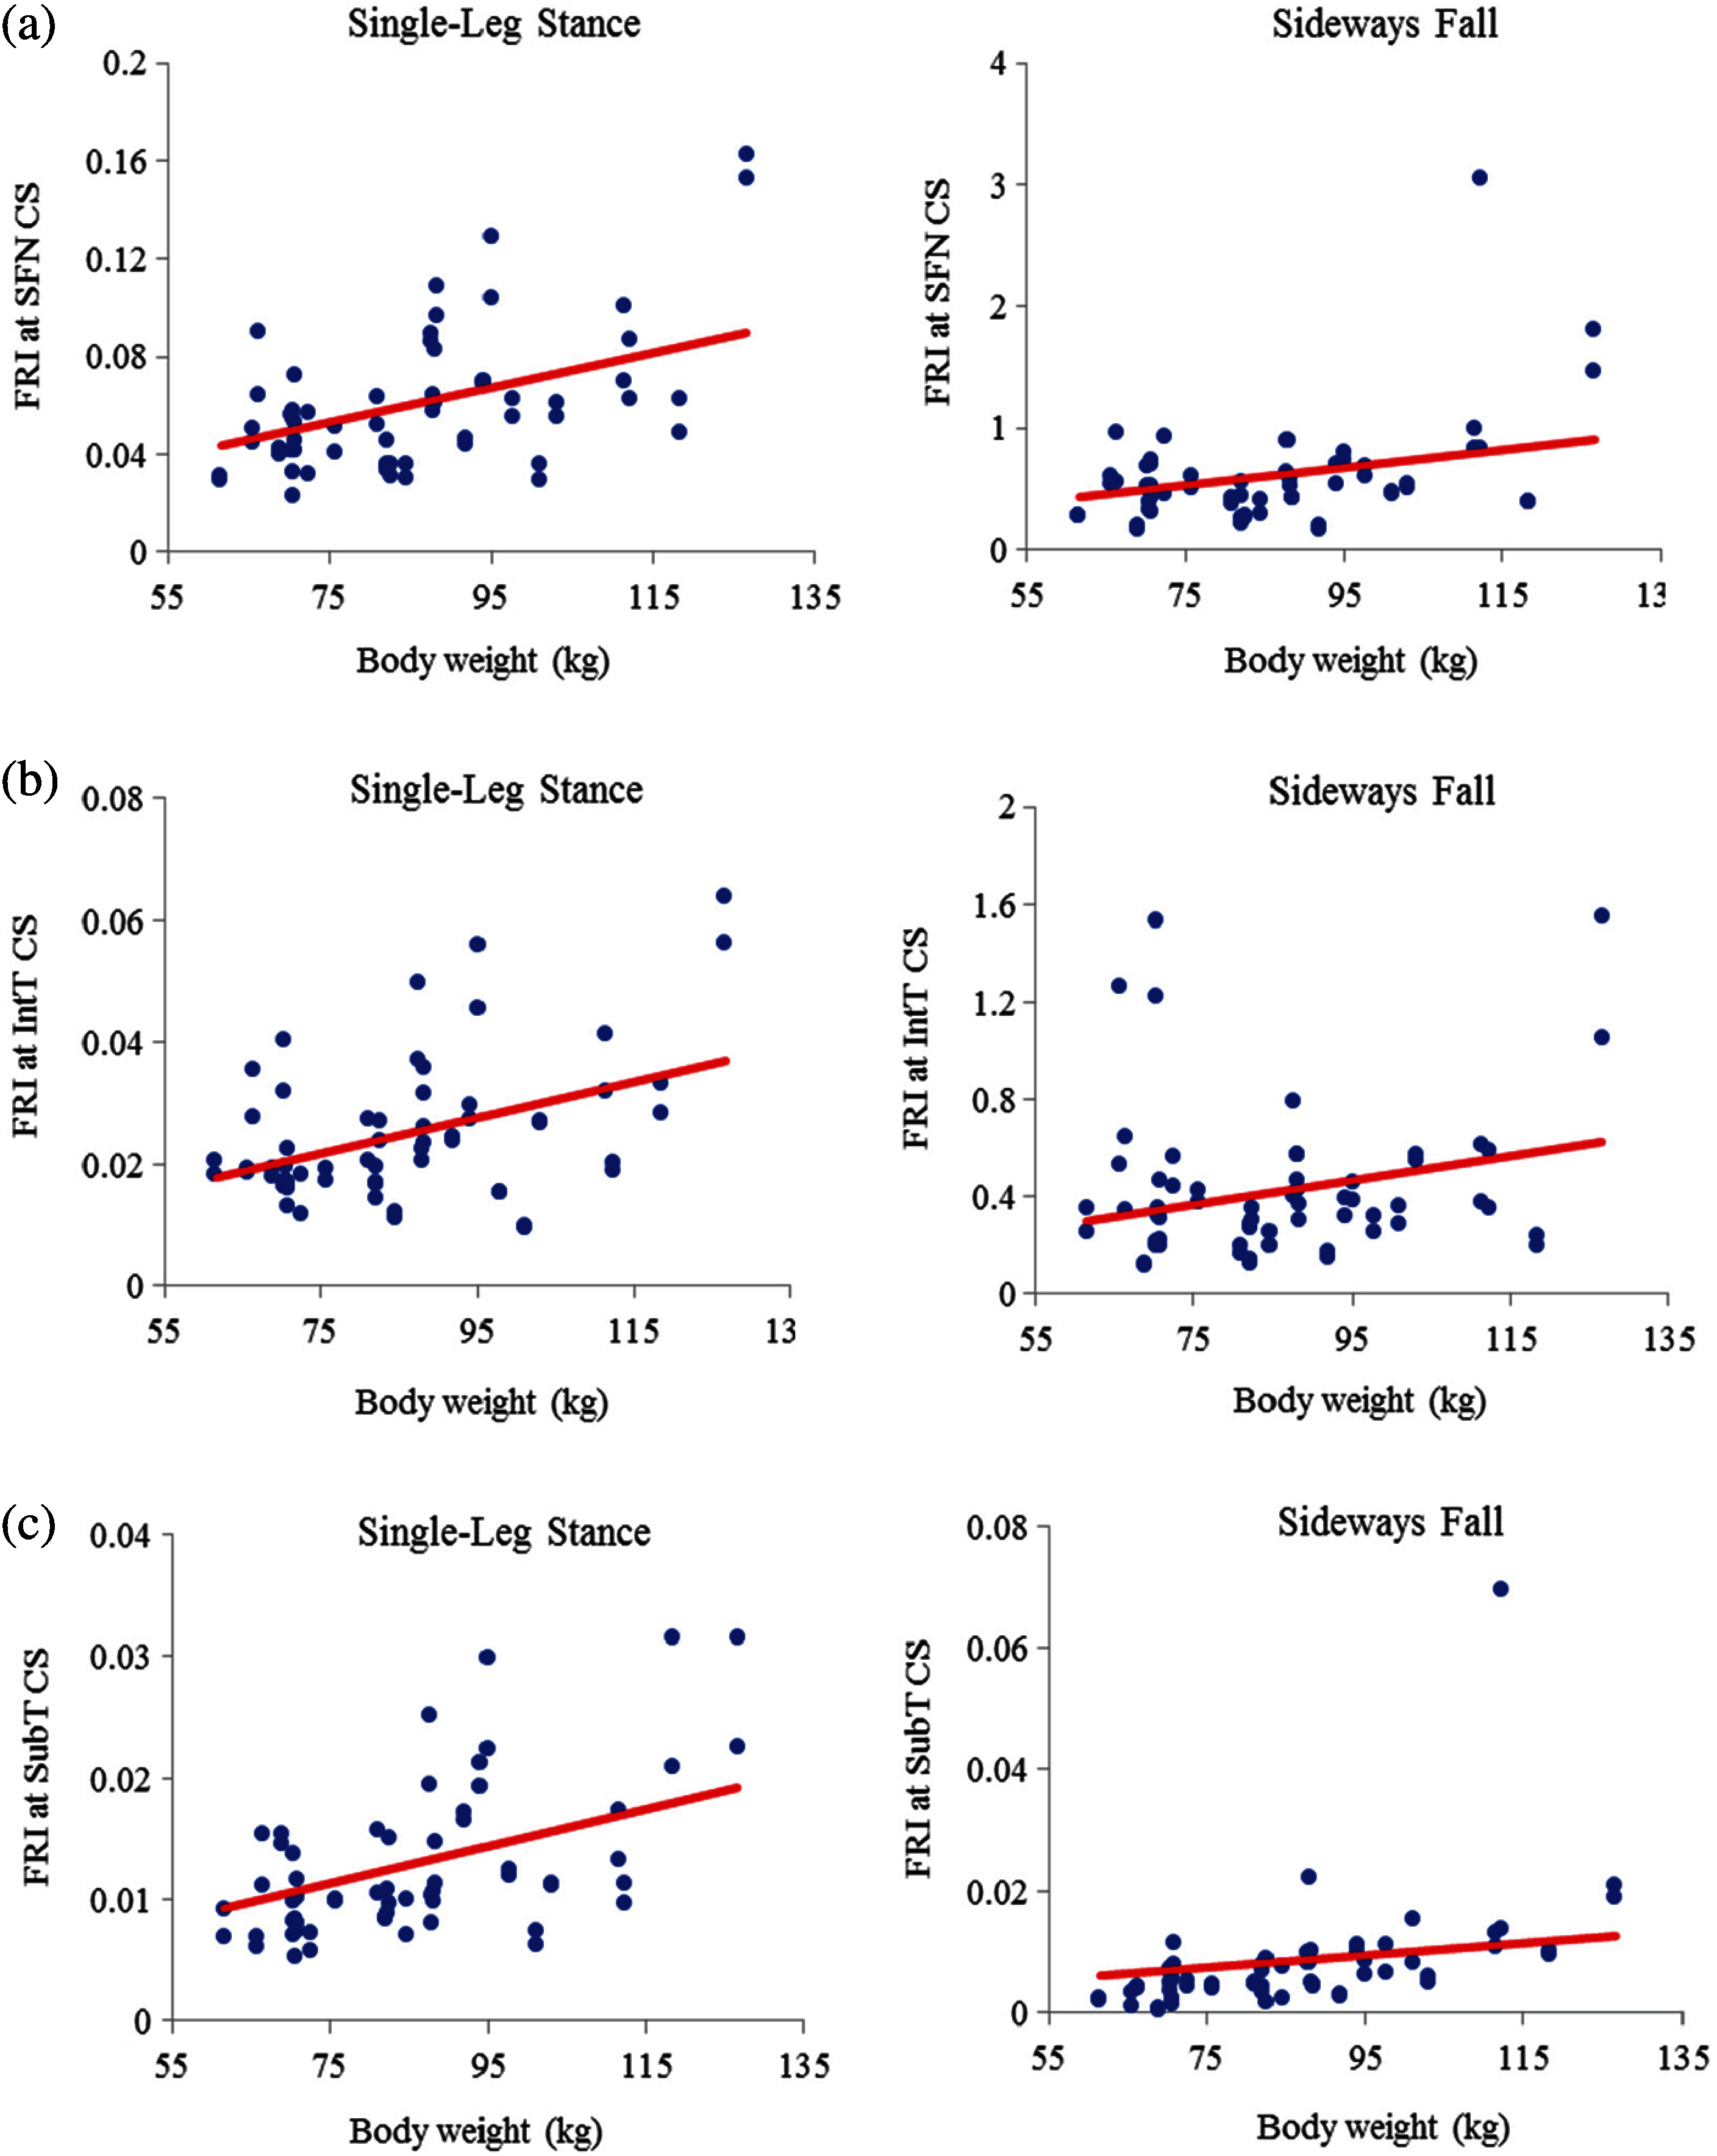
Figure 12: Variations of FRI with body weight in 30 males at (a) the smallest femoral neck cross-section section (SFN CS), (b) the intertrochanteric cross-section section (IntT CS), and (c) the subtrochanteric cross-section section (SubT CS)
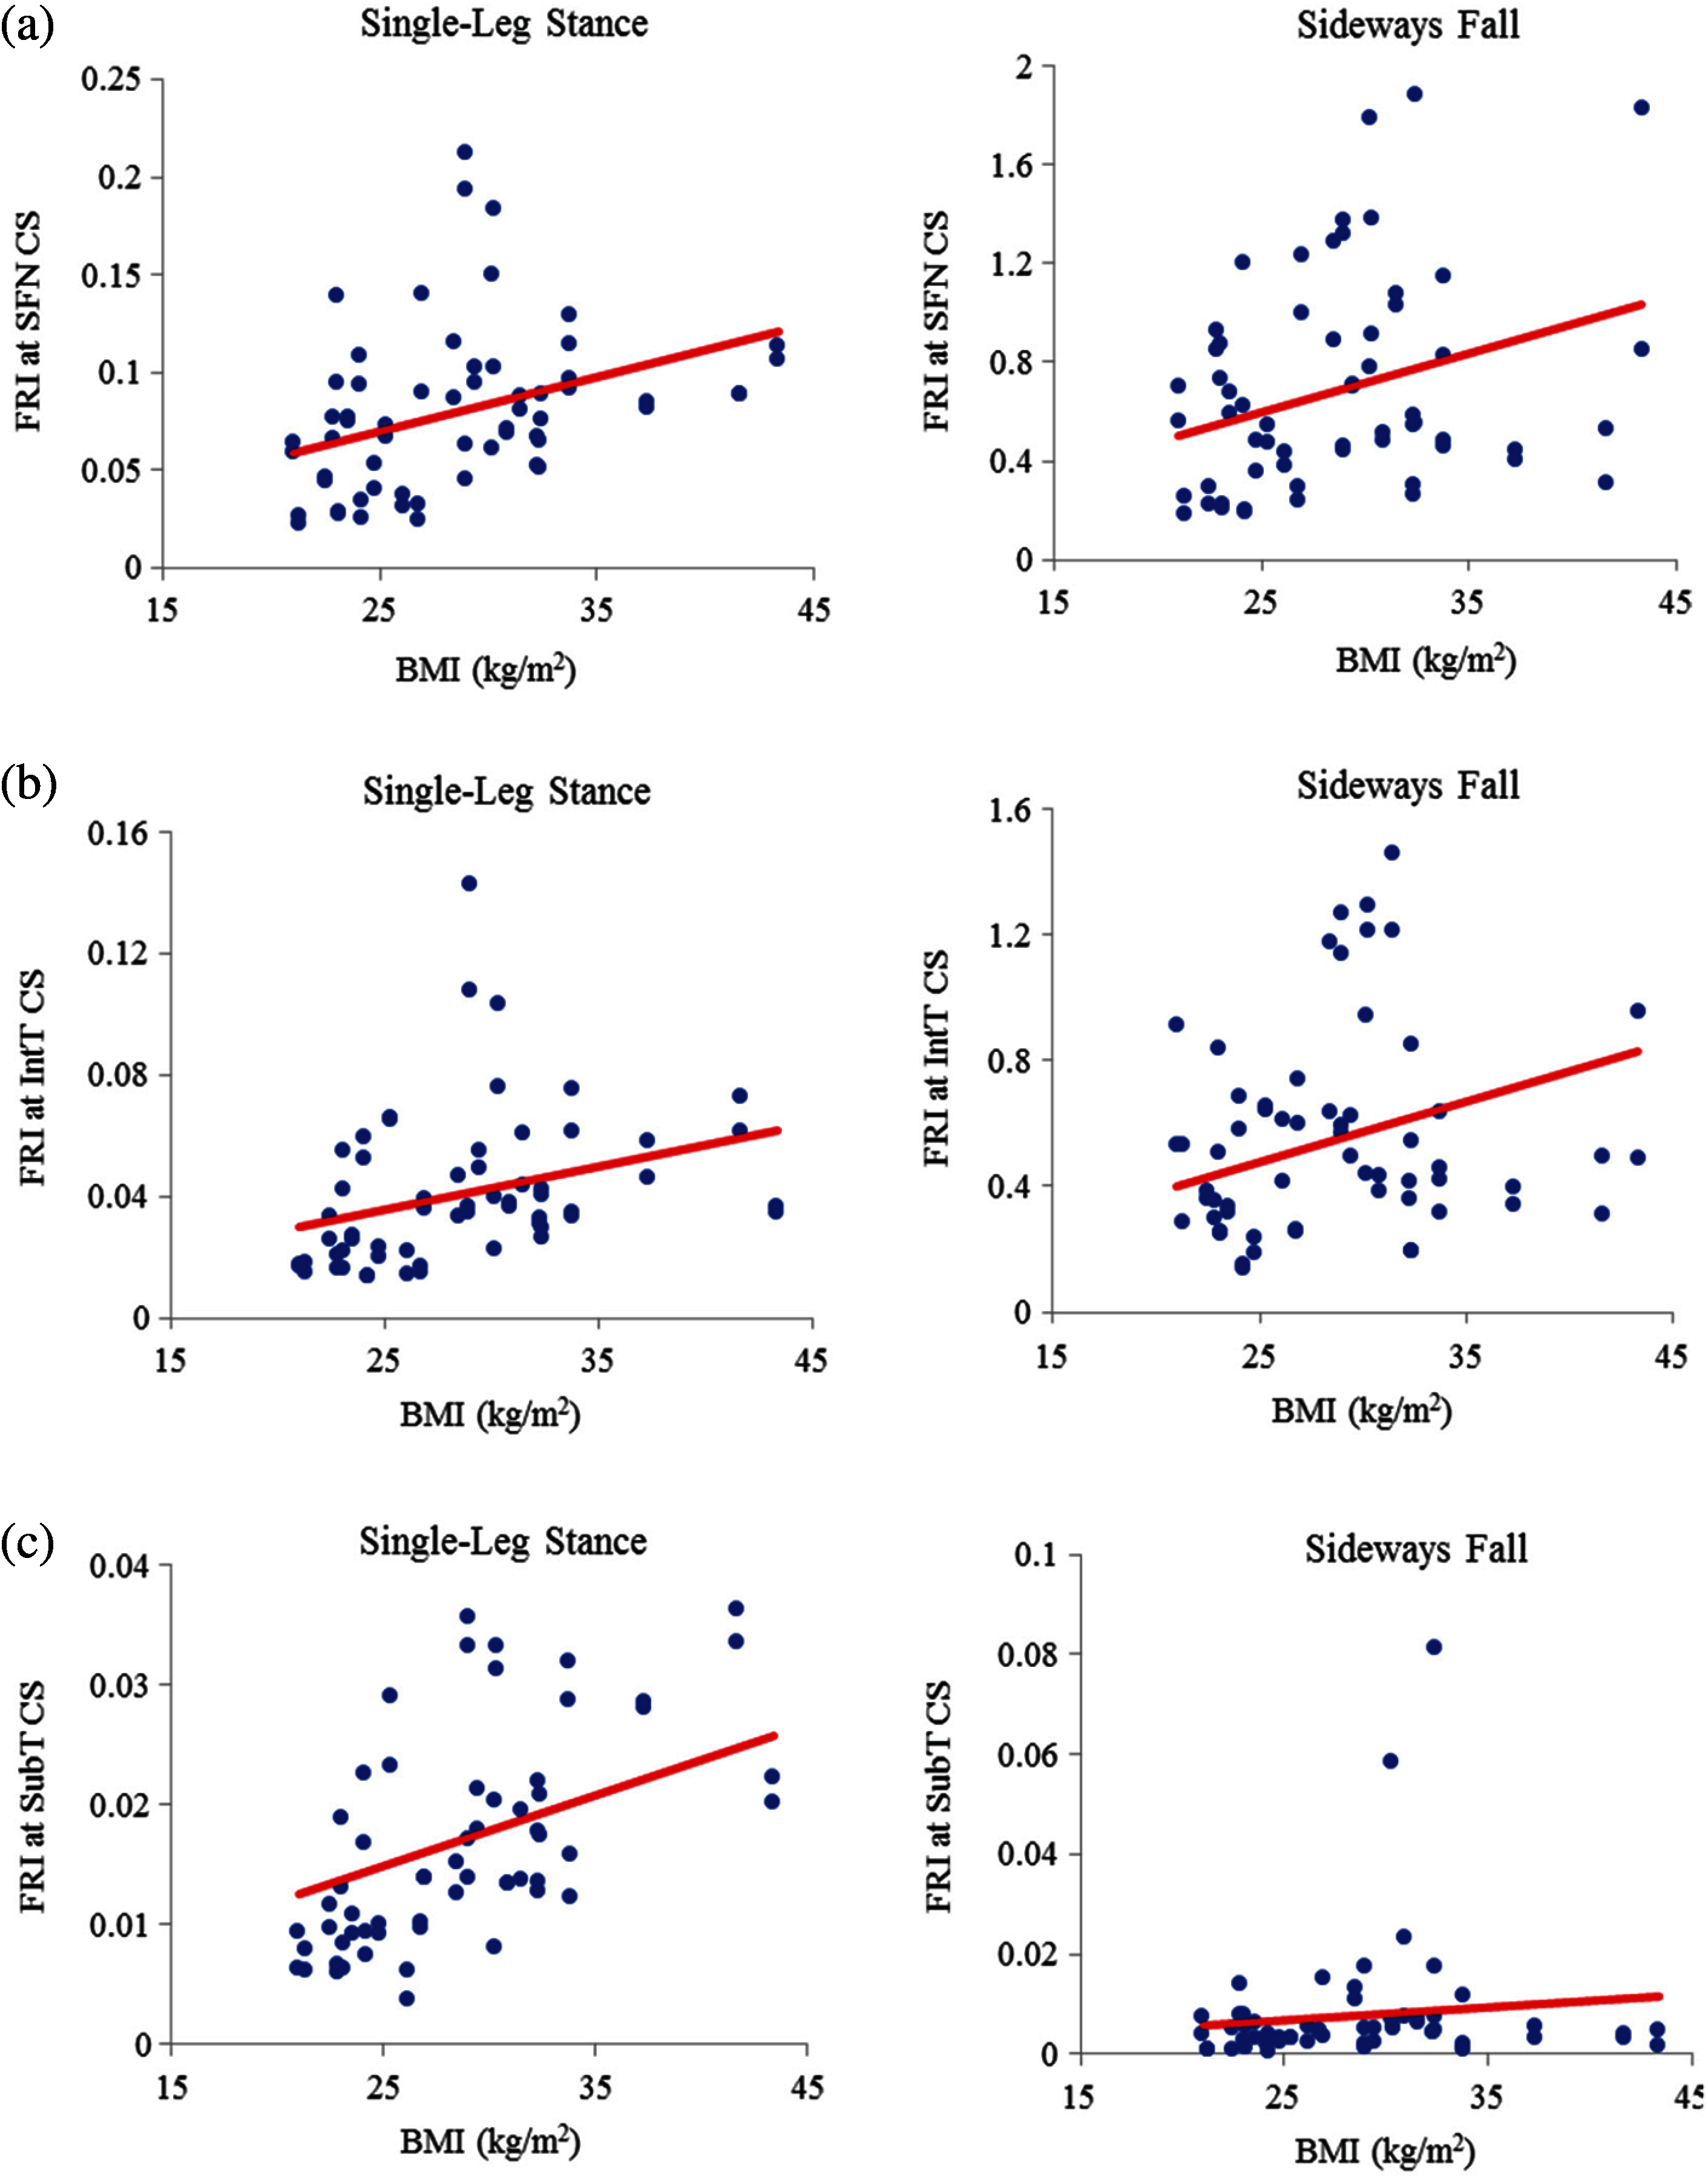
Figure 13: Variations of FRI with BMI in 30 females at (a) the smallest femoral neck cross-section section (SFN CS), (b) the intertrochanteric cross-section section (IntT CS), and (c) the subtrochanteric cross-section section (SubT CS)
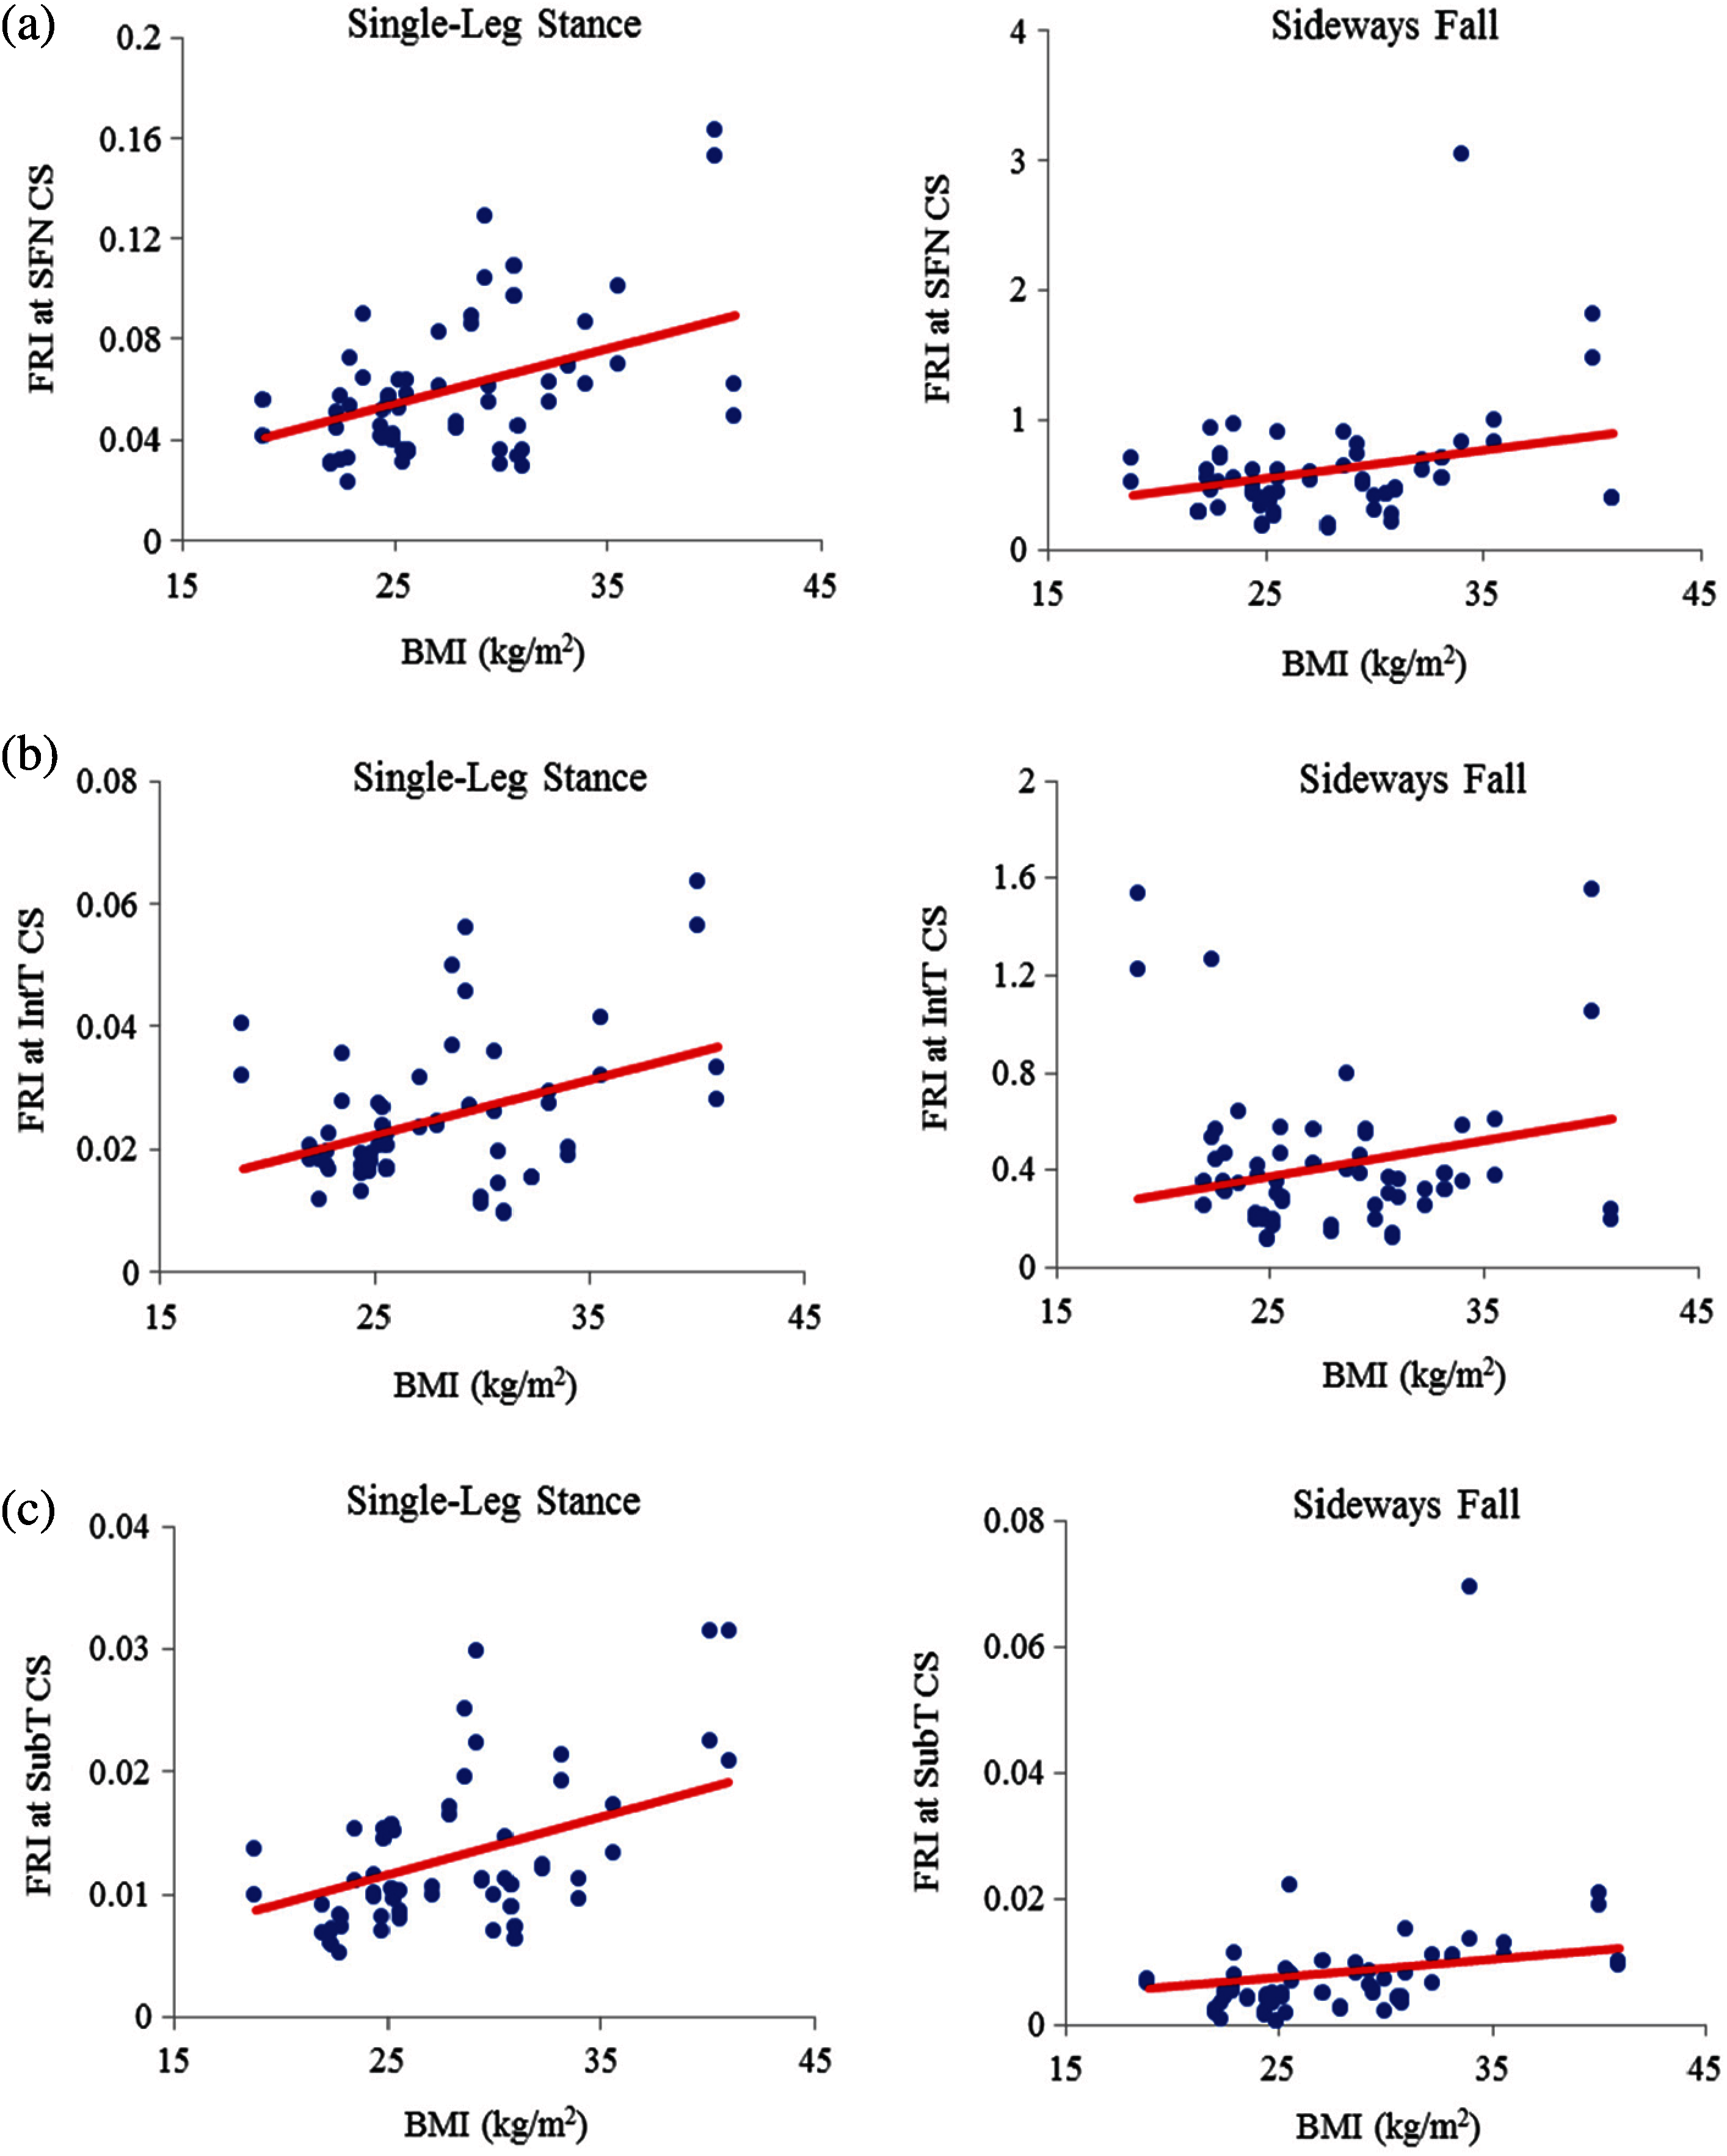
Figure 14: Variations of FRI versus BMI in 30 males at (a) the smallest femoral neck cross-section section (SFN CS), (b) the intertrochanteric cross-section section (IntT CS), and (c) the subtrochanteric cross-section section (SubT CS)
Different human body parameters such as age, height, weight, and BMI influence hip fracture risk in the elderly. Therefore, the correlations of hip fracture risk with age, body height, body weight, and BMI are investigated in this study and the corresponding correlation coefficients are obtained. Generally, there is an increasing trend of hip fracture risk with age, body height, body weight, and BMI at the three critical regions of the femur in both women and men during the single-leg stance and the sideways fall configurations.
The correlations of hip fracture risk with age and height are not significant (
The results of this study also show that to some extent there is a strong correlation between the hip fracture risk and body weight and BMI (
Acknowledgement: The authors thank the Winnipeg Health Science Centre for providing the QCT images of clinical cases.
Funding Statement: The reported research was supported financially by the Natural Sciences and Engineering Research Council (NSERC) and Research Manitoba of Canada, which are gratefully acknowledged.
Conflicts of Interest: The authors declare that they have no conflicts of interest to report regarding the present study.
Ethical Approval: The QCT images used in this study were acquired from Health Science Centre located at Winnipeg under an Ethical Approval issued by the Research Ethics Board (REB) of the University of Manitoba.
1. N. M. Resnick and S. L. Greenspan, “Senile’ osteoporosis reconsidered,” Journal of the American Medical Association, vol. 261, no. 7, pp. 1025–1029, 1989. [Google Scholar]
2. B. Gullberg, O. Johnell and J. A. Kanis, “World-wide projections for hip fracture,” Osteoporosis International, vol. 7, no. 5, pp. 407–413, 1997. [Google Scholar]
3. H. Kheirollahi Nataj Bisheh, “Assessment of hip fracture risk using cross-section strain energy determined from QCT-based finite element model,” M.Sc. thesis, University of Manitoba, Canada, 2015. [Google Scholar]
4. H. Kheirollahi and Y. Luo, “Assessment of hip fracture risk using cross-section strain energy determined by QCT-based finite element modeling,” BioMed Research International, vol. 2015, Article ID 413839, 2015. [Google Scholar]
5. H. Kheirollahi and Y. Luo, “Identification of high stress and strain regions in proximal femur during single-leg stance and sideways fall using QCT-based finite element model,” International Journal of Biomedical and Biological Engineering, vol. 9, no. 8, pp. 633–640, 2015. [Google Scholar]
6. H. Kheirollahi and Y. Luo, “Understanding hip fracture by QCT-based finite element modeling,” Journal of Medical and Biological Engineering, vol. 37, no. 5, pp. 686–694, 2017. [Google Scholar]
7. H. Bisheh, Y. Luo and T. Rabczuk, “Hip fracture risk assessment based on different failure criteria using QCT-based finite element modeling,” Computers, Materials & Continua, vol. 63, no. 2, pp. 567–591, 2020. [Google Scholar]
8. D. Dragomir-Daescu, J. O. D. Buijs, S. McEligot, Y. Dai, R. C. Entwistle et al., “Robust QCT/FEA models of proximal femur stiffness and fracture load during a sideways fall on the hip,” Annals of Biomedical Engineering, vol. 39, no. 2, pp. 742–755, 2010. [Google Scholar]
9. H. Gong, M. Zhang, Y. Fan, W. L. Kwok and P. C. Leung, “Relationships between femoral strength evaluated by nonlinear finite element analysis and BMD, material distribution and geometric morphology,” Annals of Biomedical Engineering, vol. 40, no. 7, pp. 1575–1585, 2012. [Google Scholar]
10. J. E. M. Koivumäki, J. Thevenot, P. Pulkkinen, V. Kuhn, T. M. Link et al., “CT-Based finite element models can be used to estimate experimentally measured failure loads in the proximal femur,” Bone, vol. 50, no. 4, pp. 824–829, 2012. [Google Scholar]
11. Y. Luo, Z. Ferdous and W. D. Leslie, “Precision study of DXA-based patient-specific finite element modeling for assessing hip fracture risk,” International Journal for Numerical Methods in Biomedical Engineering, vol. 29, no. 5, pp. 615–629, 2013. [Google Scholar]
12. M. Mirzaei, M. Keshavarzian and V. Naeini, “Analysis of strength and failure pattern of human proximal femur using quantitative computed tomography (QCT)-based finite element method,” Bone, vol. 64, pp. 108–114, 2014. [Google Scholar]
13. J. H. Keyak, J. M. Meagher, H. B. Skinner and C. D. Mote Jr., “Automated three-dimensional finite element modelling of bone: A new method,” Journal of Biomedical Engineering, vol. 12, no. 5, pp. 389–397, 1990. [Google Scholar]
14. T. M. Keaveny, R. E. Borchers, L. J. Gibson and W. C. Hayes, “Trabecular bone modulus and strength can depend on specimen geometry,” Journal of Biomechanics, vol. 26, no. 8, pp. 991–1000, 1993. [Google Scholar]
15. C. M. Les, J. H. Keyak, S. M. Stover, K. T. Taylor and A. J. Kaneps, “Estimation of material properties in the equine metacarpus with use of quantitative computed tomography,” Journal of Orthopaedic Research, vol. 12, no. 6, pp. 822–833, 1994. [Google Scholar]
16. T. S. Keller, “Predicting the compressive mechanical behavior of bone,” Journal of Biomechanics, vol. 27, no. 9, pp. 1159–1168, 1994. [Google Scholar]
17. J. H. Keyak, S. A. Rossi, K. A. Jones and H. B. Skinner, “Prediction of femoral fracture load using automated finite element modeling,” Journal of Biomechanics, vol. 31, no. 2, pp. 125–133, 1997. [Google Scholar]
18. D. T. Reilly and A. H. Burstein, “The elastic and ultimate properties of compact bone tissue,” Journal of Biomechanics, vol. 8, no. 6, pp. 393–405, 1975. [Google Scholar]
19. T. Yoshikawa, C. H. Turner, M. Peacock, C. W. Slemenda, C. M. Weaver et al., “Geometric structure of the femoral neck measured using dual-energy X-ray absorptiometry,” Journal of Bone and Mineral Research, vol. 9, no. 7, pp. 1053–1064, 1994. [Google Scholar]
20. M. Bessho, I. Ohnishi, T. Matsumoto, S. Ohashi, J. Matsuyama et al., “Prediction of proximal femur strength using a CT-based nonlinear finite element method: Differences in predicted fracture load and site with changing load and boundary conditions,” Bone, vol. 45, no. 2, pp. 226–231, 2009. [Google Scholar]
21. K. K. Nishiyama, S. Gilchrist, P. Guy, P. Cripton and S. K. Boyd, “Proximal femur bone strength estimated by a computationally fast finite element analysis in a sideways fall configuration,” Journal of Biomechanics, vol. 46, no. 7, pp. 1231–1236, 2013. [Google Scholar]
22. S. N. Robinovitch, W. C. Hayes and T. A. McMahon, “Prediction of femoral impact forces in falls on the hip,” Journal of Biomechanical Engineering, vol. 113, no. 4, pp. 366–374, 1991. [Google Scholar]
23. J. D. Michelson, A. Myers, R. Jinnah, Q. Cox and M. Van Natta, “Epidemiology of hip fractures among the elderly. risk factors for fracture type,” Clinical Orthopaedics and Related Research, vol. Feb, no. 311, pp. 129–135, 1995. [Google Scholar]
 | This work is licensed under a Creative Commons Attribution 4.0 International License, which permits unrestricted use, distribution, and reproduction in any medium, provided the original work is properly cited. |