DOI:10.32604/cmc.2022.019257
| Computers, Materials & Continua DOI:10.32604/cmc.2022.019257 | |
| Article |
Modeling and Optimization of Surface Roughness of Epoxy/Nanoparticles Composite Coating
1Department of Mechanical Engineering, College of Engineering & Islamic Arch., Umm Alqura University, Makkah, Saudi Arabia
2Department of Mechanical Engineering, Faculty of Engineering, Sohag University, Sohag, Egypt
3Department of Systems Engineering, King Fahd University of Petroleum & Minerals, Dhahran, 31261, KSA
4College of Engineering at Wadi Addawaser, Prince Sattam Bin Abdulaziz University, Al-Kharj, 11911, Saudi Arabia
5Department of Electrical Engineering, Faculty of Engineering, Minia University, Minia, 61517, Egypt
6Department of Production Engineering and Design, Faculty of Engineering, Minia University, Minia, 61517, Egypt
*Corresponding Author: Mujahed Al-Dhaifallah. Email: mujahed@kfupm.edu.sa
Received: 08 April 2021; Accepted: 10 May 2021
Abstract: In power plants, flue gases can cause severe corrosion damage in metallic parts such as flue ducts, heat exchangers, and boilers. Coating is an effective technique to prevent this damage. A robust fuzzy model of the surface roughness (Ra and Rz) of flue gas ducts coated by protective composite coating from epoxy and nanoparticles was constructed based on the experimental dataset. The proposed model consists of four nanoparticles (ZnO, ZrO2, SiO2, and NiO) with 2%, 4%, 6%, and 8%, respectively. Response surface methodology (RSM) was used to optimize the process parameters and identify the optimal conditions for minimum surface roughness of this coated duct. To prove the superiority of the proposed fuzzy model, the model results were compared with those obtained by ANOVA, with the coefficient of determination and the root-mean-square error (RMSE) used as metrics. For Ra, for the first output response, using ANOVA, the coefficient-of-determination values were 0.9137 and 0.4037, respectively, for training and prediction. Similarly, for Rz, the second output response, the coefficient-of-determination results were 0.9695 and 0.4037, respectively, for training and prediction. In the fuzzy modeling of Ra, for the first output response, the RMSE values were 0.0 and 0.1455, respectively, for training and testing. The values for the coefficient of determination were 1.00 and 0.9807, respectively, for training and testing. The results prove the superiority of fuzzy modeling. For modeling the second output response Rz, the RMSE values were 0.0 and 0.0421, respectively, for training and testing, and the coefficient-of-determination values were 1.00 and 0.9959, respectively, for training and testing.
Keywords: Materials; coating; nanoparticles; modeling and optimization
The two main cycles in steam power plants are the water-steam cycle and the air-gas cycle [1]. In the air-gas cycle, a forced draft fan sucks the air from the atmosphere supply boiler furnace with enough air for combustion while the flue gas, which is the result of combustion of fuel inside the boiler furnace, is released to the atmosphere by an induced draft fan through duct to chimney. Flue gases represent an extremely important combustion process for the power generation industry. Due to environmental limitations, industrial power plants must use various methods to control these emissions to the atmosphere [2]. These fuel gases are the main reason for the occurrence of corrosion in the chimneys of steam power plants (as well as any industrial plant) [3]. The holes in the flue gas duct cause the ingress of fresh air into flue gas, which decreases the temperature of flue gas to its dew point. In addition, ash becomes sticky and adheres to the duct wall as well as the induced draft fan. This sticky ash accumulate also causes damage to the flue gas duct, including cracks on the internal surface of the duct, as shown in Fig. 1. These holes allow air to enter the interior of the duct and interact with the combustion gas, causing the formation of sulfuric acid (SOx) and ash, which can accumulate on the internal surface (Fig. 1) of the duct, as well as in the induced draft fan, causing corrosion.
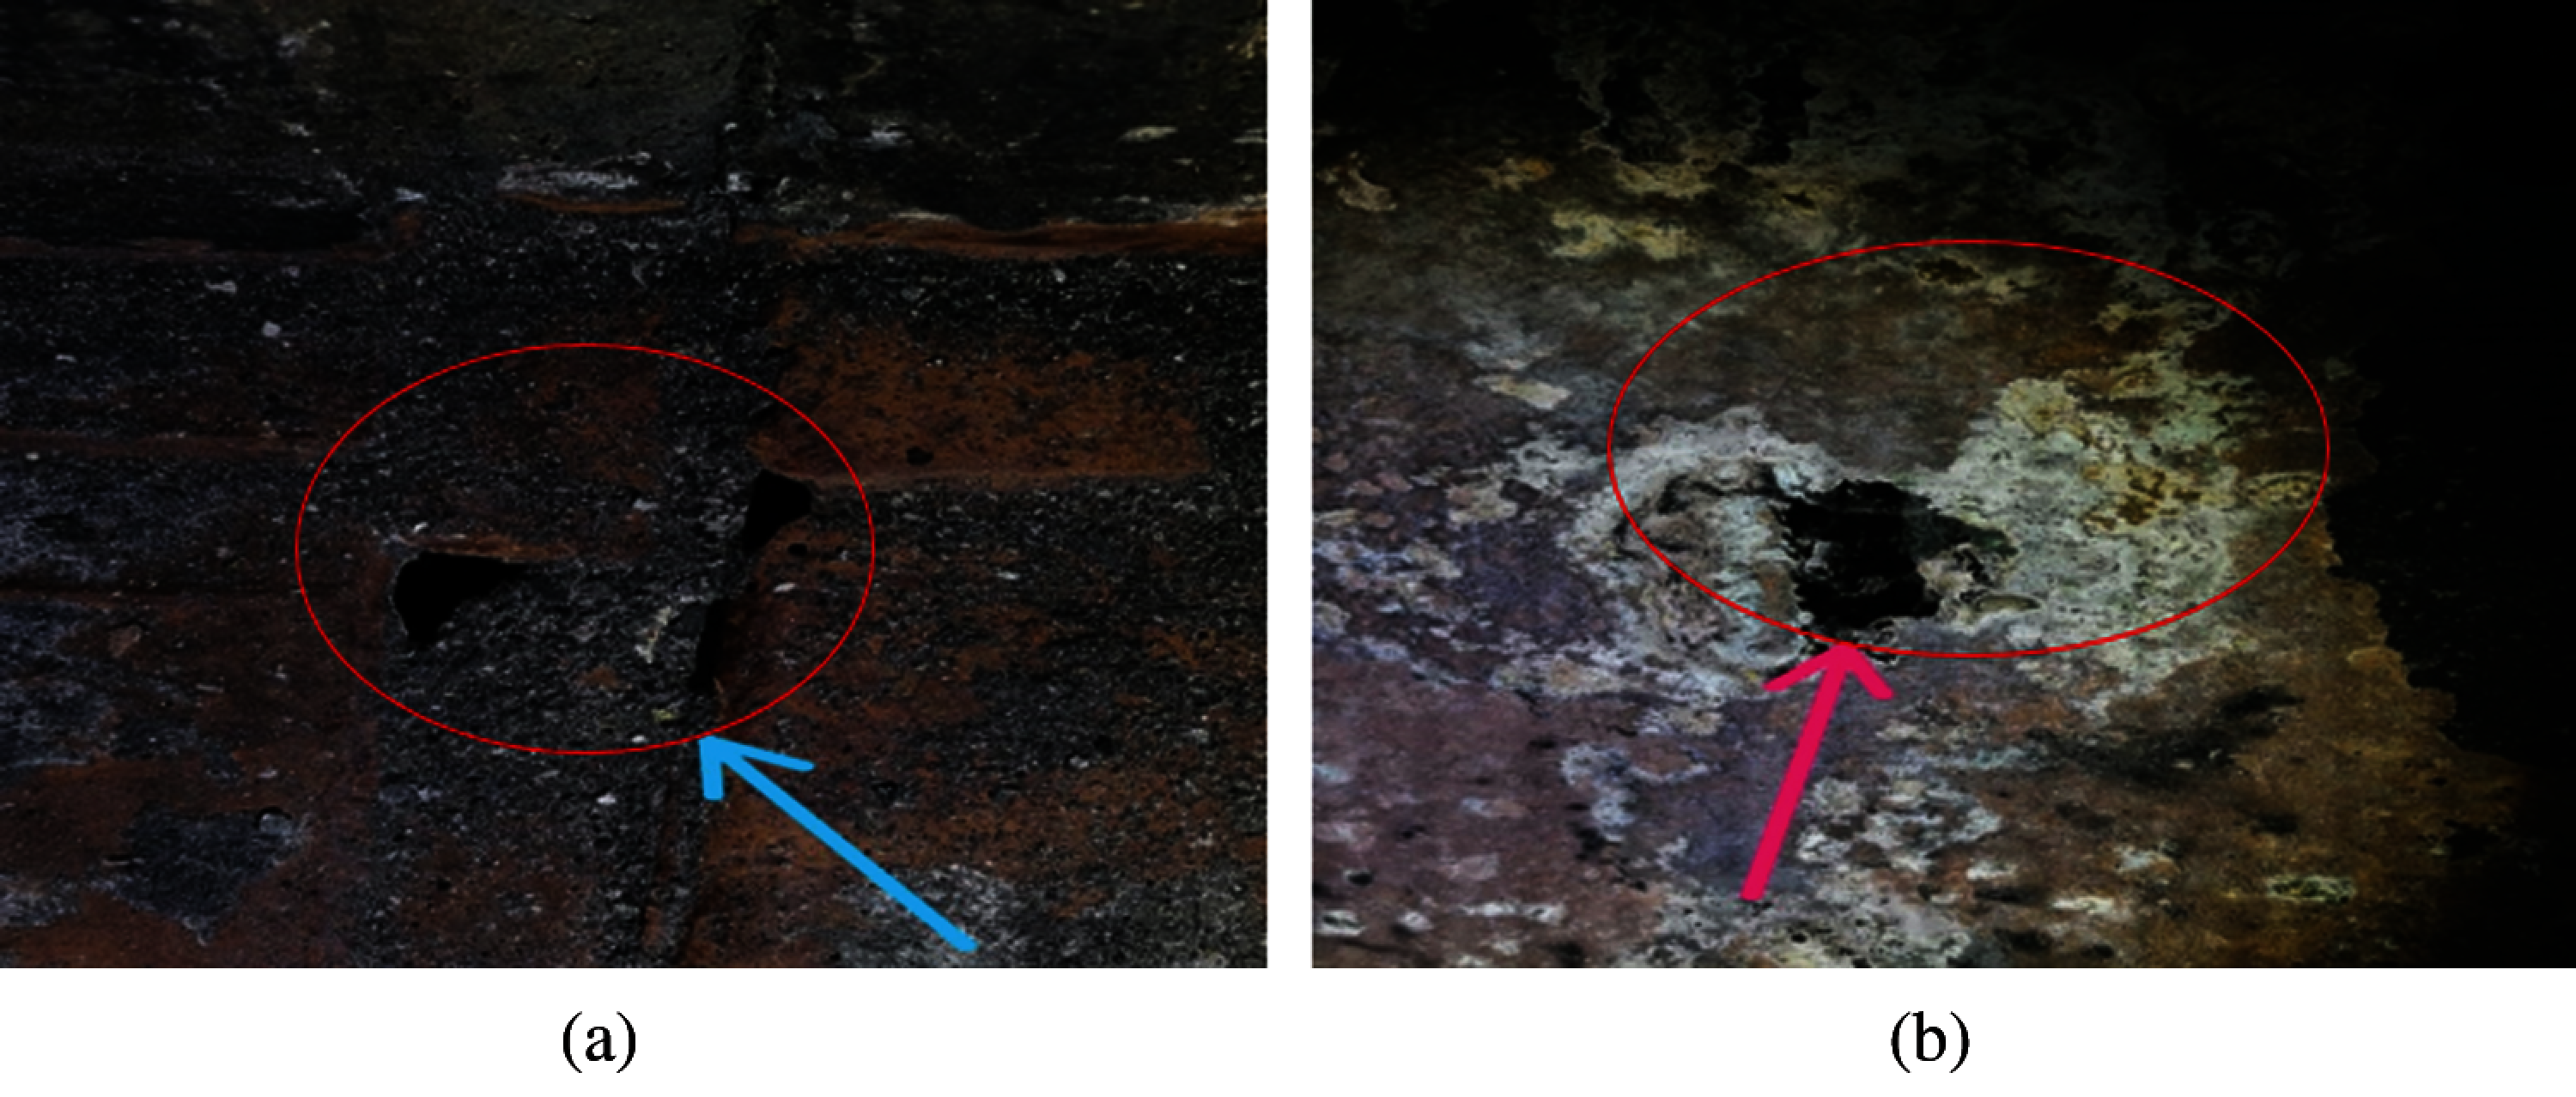
Figure 1: Mechanism for occurrence of corrosion in flue gas duct [1]. (a) Formation of cracks and holes inside flue duct (b) Formation of sulfuric acid
The corrosion caused by flue gases of power plant equipment has been studied [4]. The general objective of the study was, first, to discover the factors that contribute most to corrosion, and then to study the methods of eliminating or preventing them by other means. This study also outlined the conditions that prevail in corrosive flue gases and the steps that can be taken to eliminate them. The reactions that occur in the boiler furnace were discussed, as well as their effect on corrosion and slag formation. The experimental work carried out in the laboratory on corrosion and its results were also discussed. These corroborated the ideas about the cause of corrosion suggested by the manufacturer’s data. Test results were reported on various corrosion resistant alloys and protective coatings under the conditions found in flue gases. New methods for determining the concentrations of dew point, sulfur dioxide and trioxide in flue gases were also presented.
In a related study, the corrosion in the flue gas cleaning system of a biomass-fired power plant was investigated [5]. Corrosion damage had been observed on the weather steel used in the heat exchanger. Thick iron oxides containing chlorine and sulfur were formed, as well as deposits of Zn-K-Cl conglomerates in the channel. More recently, the corrosion of the elbows in the flue gas cooler of a coal-fired power plant were investigated [6]. This research indicated that, unexpectedly, chlorides had formed in the flue gas before the dew point of hydrochloric acid was reached. The wear layer on the surface of steel is mainly made up of Fe2O3, Fe3O4, and FeO (OH), with an oxidation gradient shown in depth.
Much research has been devoted to overcoming corrosion formation due to flue gases in the aerospace industry [7] and power plants [8]. Previous research has shown that the best solution for resisting corrosion is to use a conducting polymeric coating [9] and/or polymeric liner [10].
In this work, the author’s previous experimental results will be used to model and optimize the surface roughness of epoxy/nanoparticles coating composites. These composite coatings are used as a protective layer against the formation of corrosion by performing two roles: preventing the flue gases from reacting with the duct material, and minimizing the surface roughness, thereby leading to less friction with these gases.
For decades, fuzzy logic (FL) has demonstrated its efficacy in both modeling and control of linear as well as nonlinear systems. In the system’s modeling, the advantage of using FL emerges when the available data has some sort of uncertainty or is superimposed with noise, which is the case in most real-life application measurements.
The main contribution of the current research is to present a robust fuzzy model of the surface roughness (Ra and Rz) of a flue gas duct coated by protective composite coating from epoxy and nanoparticles based on the experimental dataset. The proposed model consists of four nanoparticles (ZnO, ZrO2, SiO2, and NiO) with 2%, 4%, 6%, and 8%. Response surface methodology (RSM) was used to optimize the process parameters and identify the optimal conditions for minimum surface roughness of this coated duct. To prove the superiority of the proposed fuzzy model, the model results were compared with those obtained by ANOVA, with the coefficient of determination and root-mean-square error (RMSE) as metrics.
The experimental data for this research was obtained from our previous research [1]. Tab. 1 shows the input and output matrices used for the modeling and optimization.
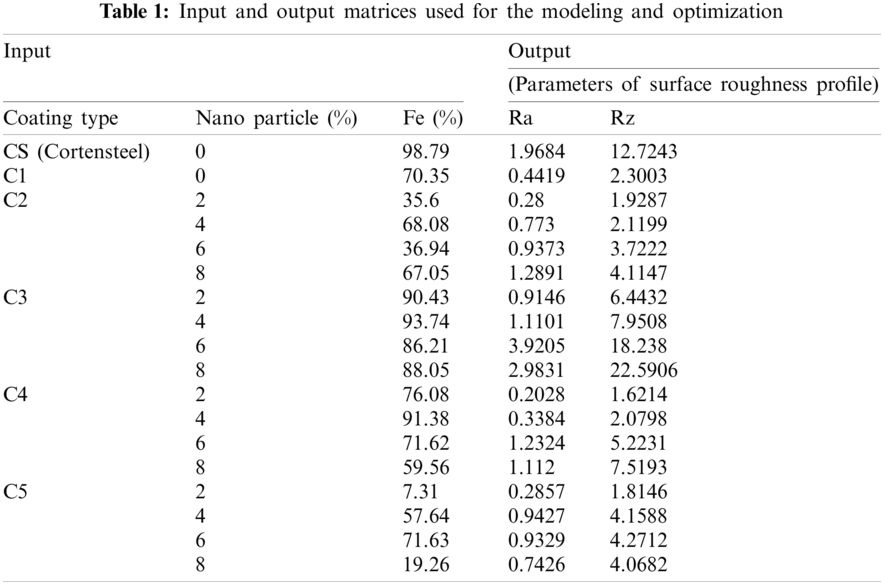
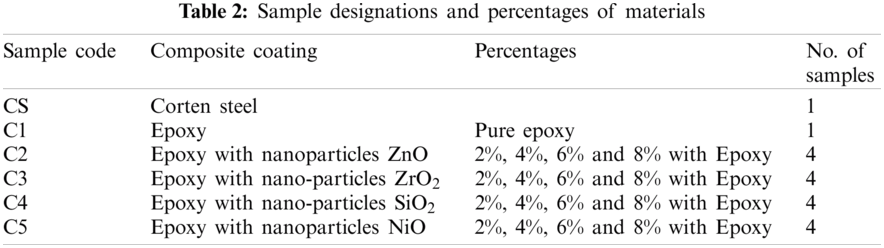
The materials used in this study were Corten Steel, Belzona 1391T epoxy, and nanoparticles, such as zinc oxide (ZnO, 99%, 35–45 nm), zirconium oxide (ZrO2, 99+%, 40 nm), silicon dioxide (SiO2, 99+%, 20–30 nm), and nickel oxide (NiO, 99%, 10–20 nm) [1]. Tab. 2 shows the sample designations along with percentage compositions of materials.
2.2 Surface Roughness Measurements
To measure the surface roughness of all the samples, the stylus-based tester from Taylor Hobson [1] was used. The values were measured by commonly used roughness parameters, such as average roughness (Ra), the average absolute deviation of the profile points from a mean line, and the 10-point height method (Rz), the distance between the average of the five highest points and the average of the five lowest points on a digitized profile.
Modeling by fuzzy logic involves three phases. The first phase consists of fuzzifying the values of the input signals. This is performed by mapping the crisp values, through their corresponding membership functions (MFs), to fuzzy values. This phase is called fuzzification. These MFs can take either gaussian or triangular shapes, depending on the application. The fuzzified inputs are logically processed to obtain the fuzzy output according to the pre-set fuzzy rules [11,12]. The second phase is the fuzzy inference system. In this phase, the fuzzy output is then passed to the defuzzification in order to return the output to its crisp values again. There are two common methods of fuzzification: center of gravity and weighted average. Unlike mathematical modeling, which formulates the relation between the inputs and the corresponding output as a mathematical equation, fuzzy modeling describes this relationship via a set of IF (premise) THEN (consequence) rules. These rules are generally created based on experimental datasets. An example of a fuzzy rule statement, for a two-input single-output system, simply takes the form:
IF a is MFa and b is MFb, THEN c is MFc, where MFa and MFb denote the fuzzy membership functions of the two inputs a and b, respectively, and MFc is the fuzzy membership function of the output c.
4.1 Results from Response Surface Methodology
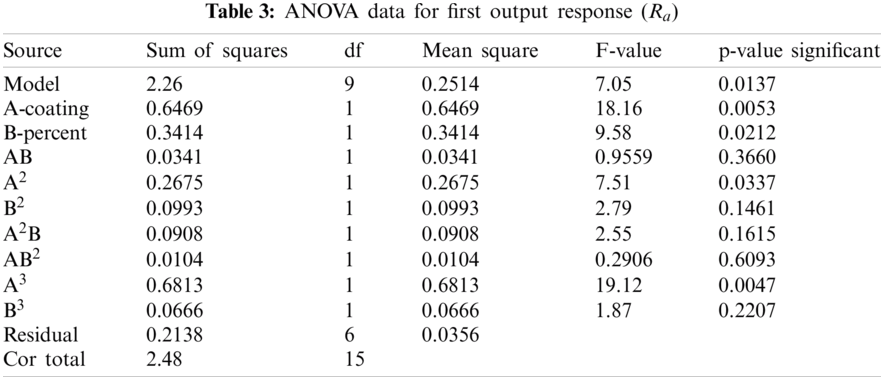
Tabs. 3 and 4 show the ANOVA results for the roughness parameters Ra and Rz, respectively. The data from Tab. 3, for the first output response, show the Model F-value of 7.05; this implies that the model is significant. There is only a 1.37% chance that an equivalent F-value can occur due to noise. The P-values less than 0.05 indicate that the model terms are significant [13–15]. In this case, the model terms A, B, A², A³ are also significant terms. The values greater than 0.1 indicate that the model terms are not significant. In Eq. (1), in terms of actual factors, the following relationship can be used to make predictions about the first output response.
Regarding the second output response Rz, the ANOVA data shown in Tab. 4 indicate that the Model F-value of 21.20 implies that the model is significant. There is only a 0.07% chance that an F-value this large can occur due to noise. A P-value of less than 0.05 indicates that the model terms are significant. Here, A, B, A², A²B, and A³ are significant model terms. The following relationship in terms of actual factors can be used to make predictions about the second output response.
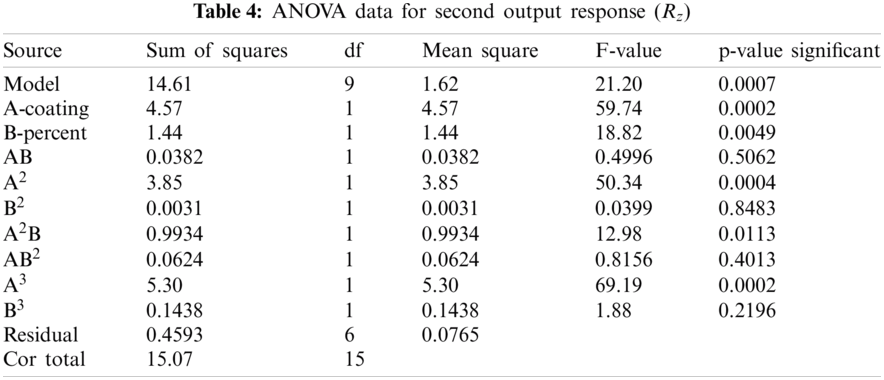
The statistical analysis of the ANOVA model for both output responses can be seen in Tab. 5.
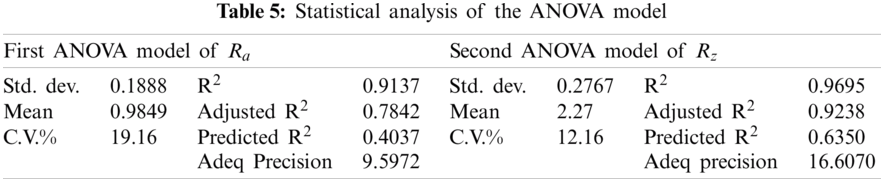
In addition to p and f-values, other statistical parameters such as coefficient of determination or R2, adjusted R2, predicted R2, and coefficient of variation (C.V.%) were used to evaluate the effectiveness of the developed models [3]. For Ra, the first output response, the coefficient-of-determination values were 0.9137 and 0.4037, respectively, for training and prediction, whereas for the second output response, Rz, the coefficient-of-determination values were 0.9695 and 0.4037, respectively, for training and prediction. The predicted R² value of 0.4037 is not that close to the adjusted R² of 0.7842. The difference of more than 0.2 may indicate a large block effect or a possible problem with the model and/or data. The values can be improved by model reduction, response transformation, or outliers. The standard deviations for both models were also found to be small, i.e., 0.1888 and 0.2767, respectively. R² values close to unity and smaller standard deviation values indicate a better-predicted response of the model.
For the adequate precision and the signal-to-noise ratio, values for both the output responses were 9.597 and 16.6070, respectively. A signal-to-noise ratio greater than 4 indicates an adequate signal, confirming that each model can be used to navigate the design space.
Fig. 2 shows the 3-D surface plots for the two output response models. The red-filled circles show the response values above the predicted values, and the pink-filled circles show the values below the predicted one. The yellow curvature lines show the high roughness values.
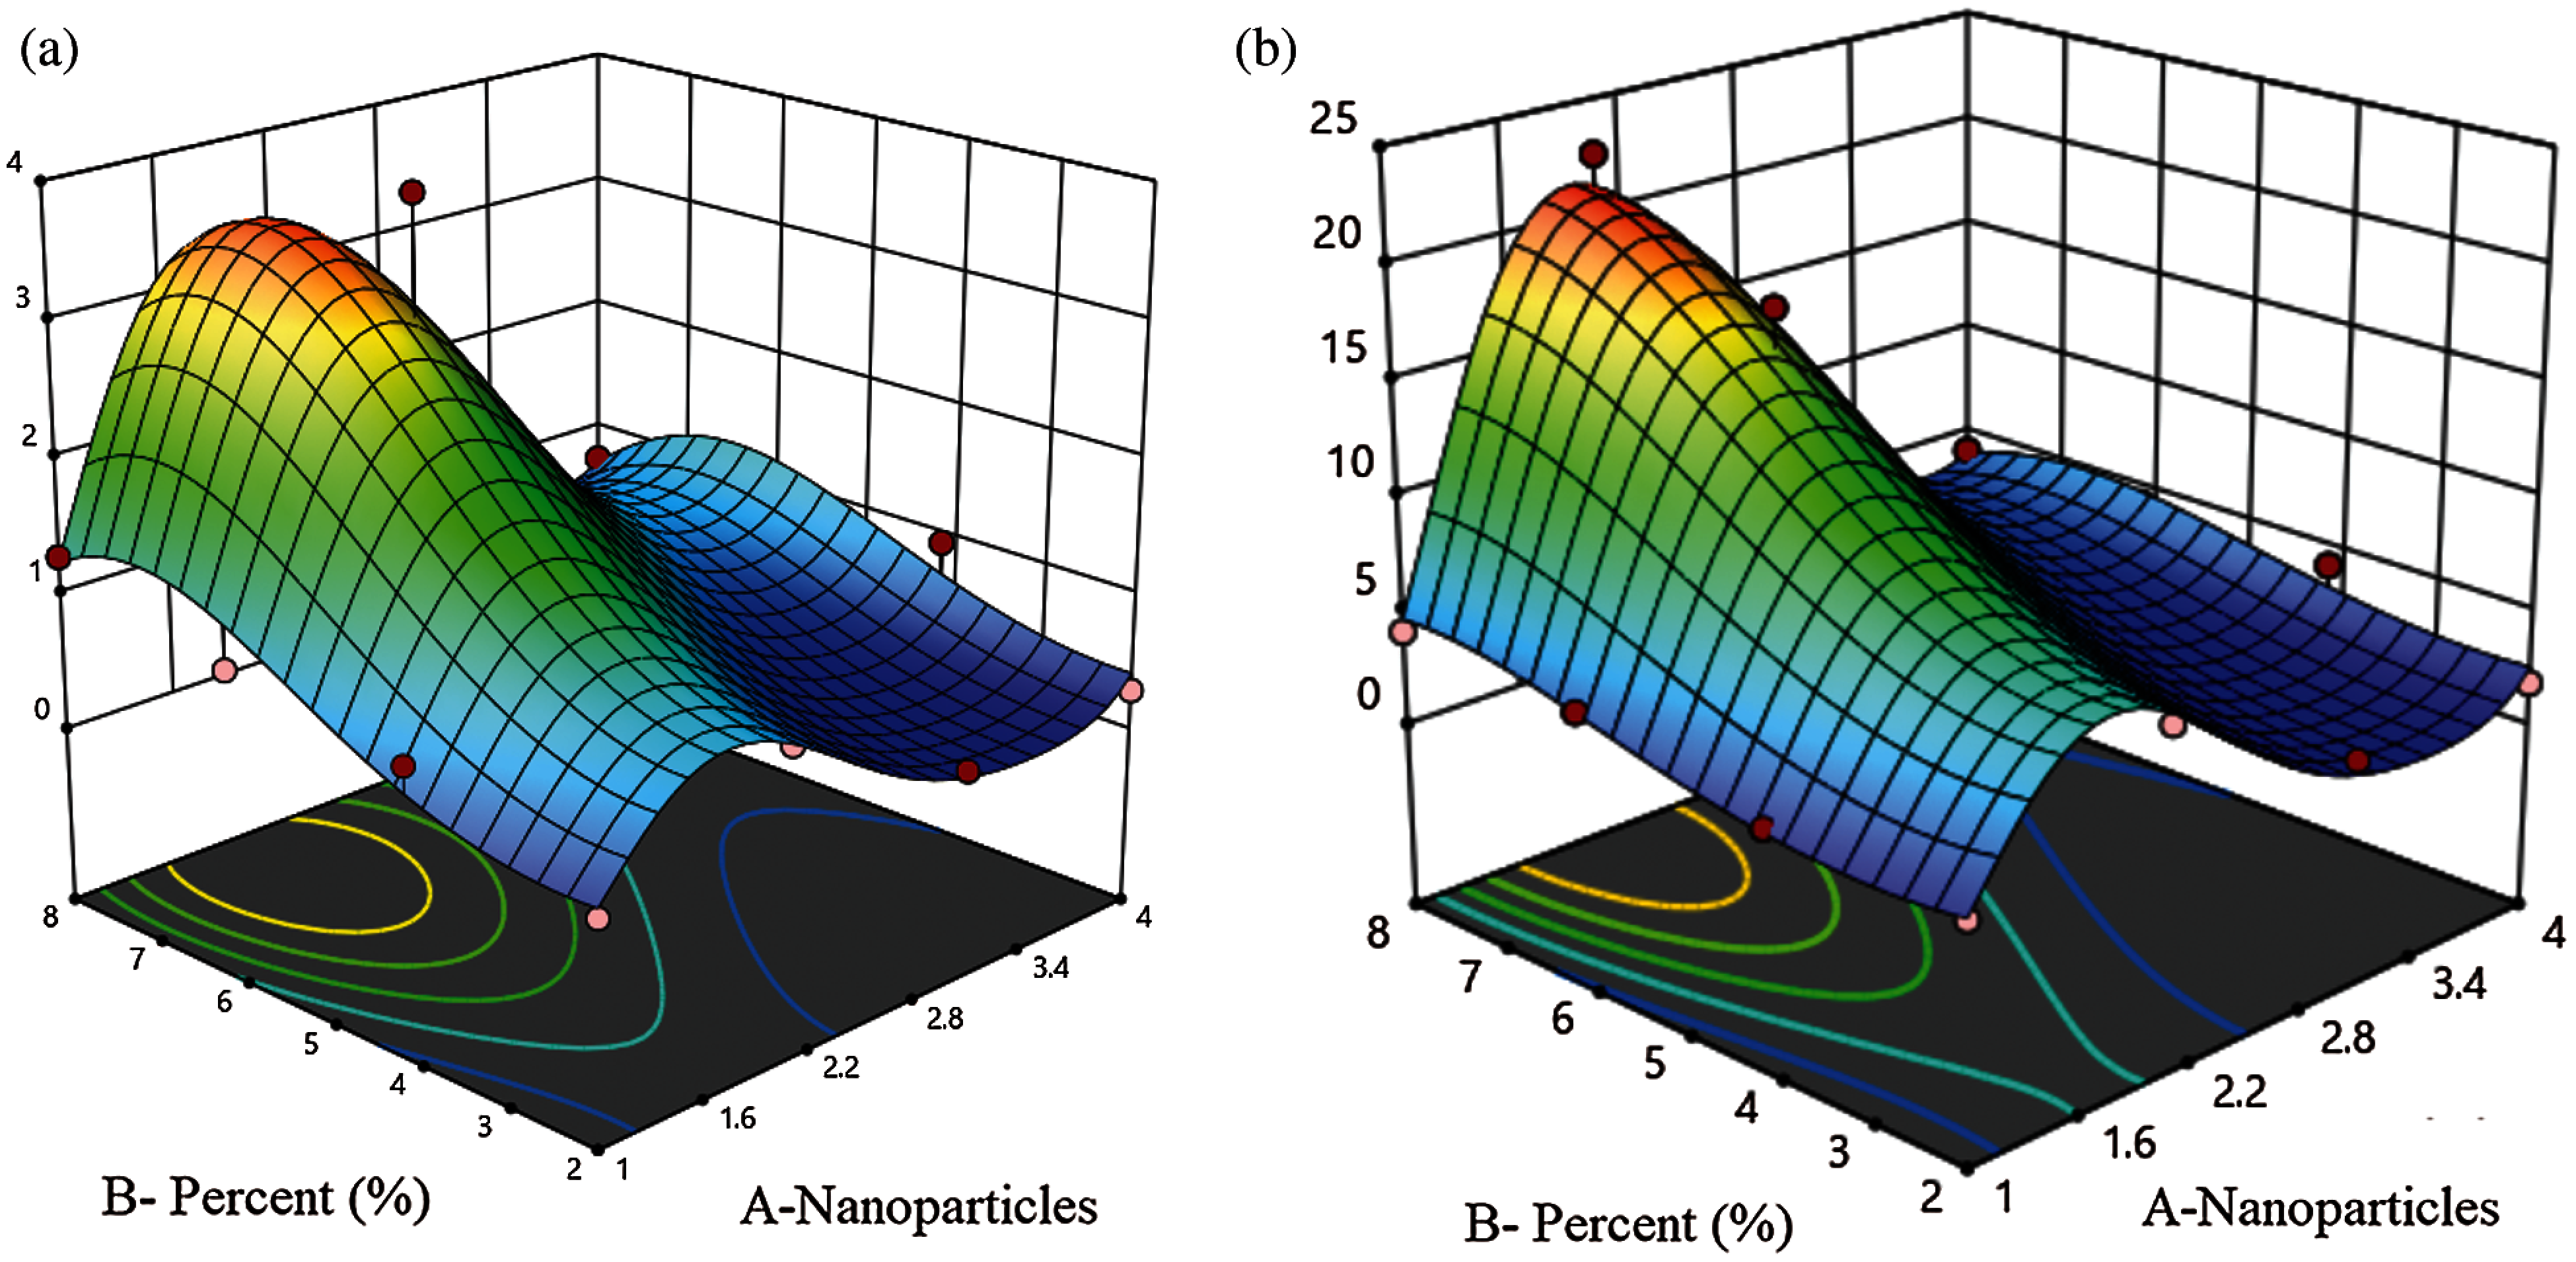
Figure 2: 3-D response surface plots for both output responses. (a) Ra (b) Rz
As shown in Fig. 3, the actual values are the measured response, and the predicted response is determined by using the approximate function values to evaluate the model. Most of the results of both models are close to the diagonal, indicating an excellent correlation between the expected and the actual values. The optimal input parameters and minimum corrosion resistance values for Ra and Rz from the RSM optimization method can be seen in Fig. 4. The minimum roughness values can also be seen in Fig. 4.
A fuzzy system is used to simulate and model the surface roughness of the flue gas duct coated by nanoparticles. To detect the minimum values of surface roughness parameters such as Ra and Rz, different materials and percentages of nanoparticles were used. The system inputs are epoxy with varying percentages of nanoparticles, and the outputs of fuzzy logic system are surface roughness parameters values.
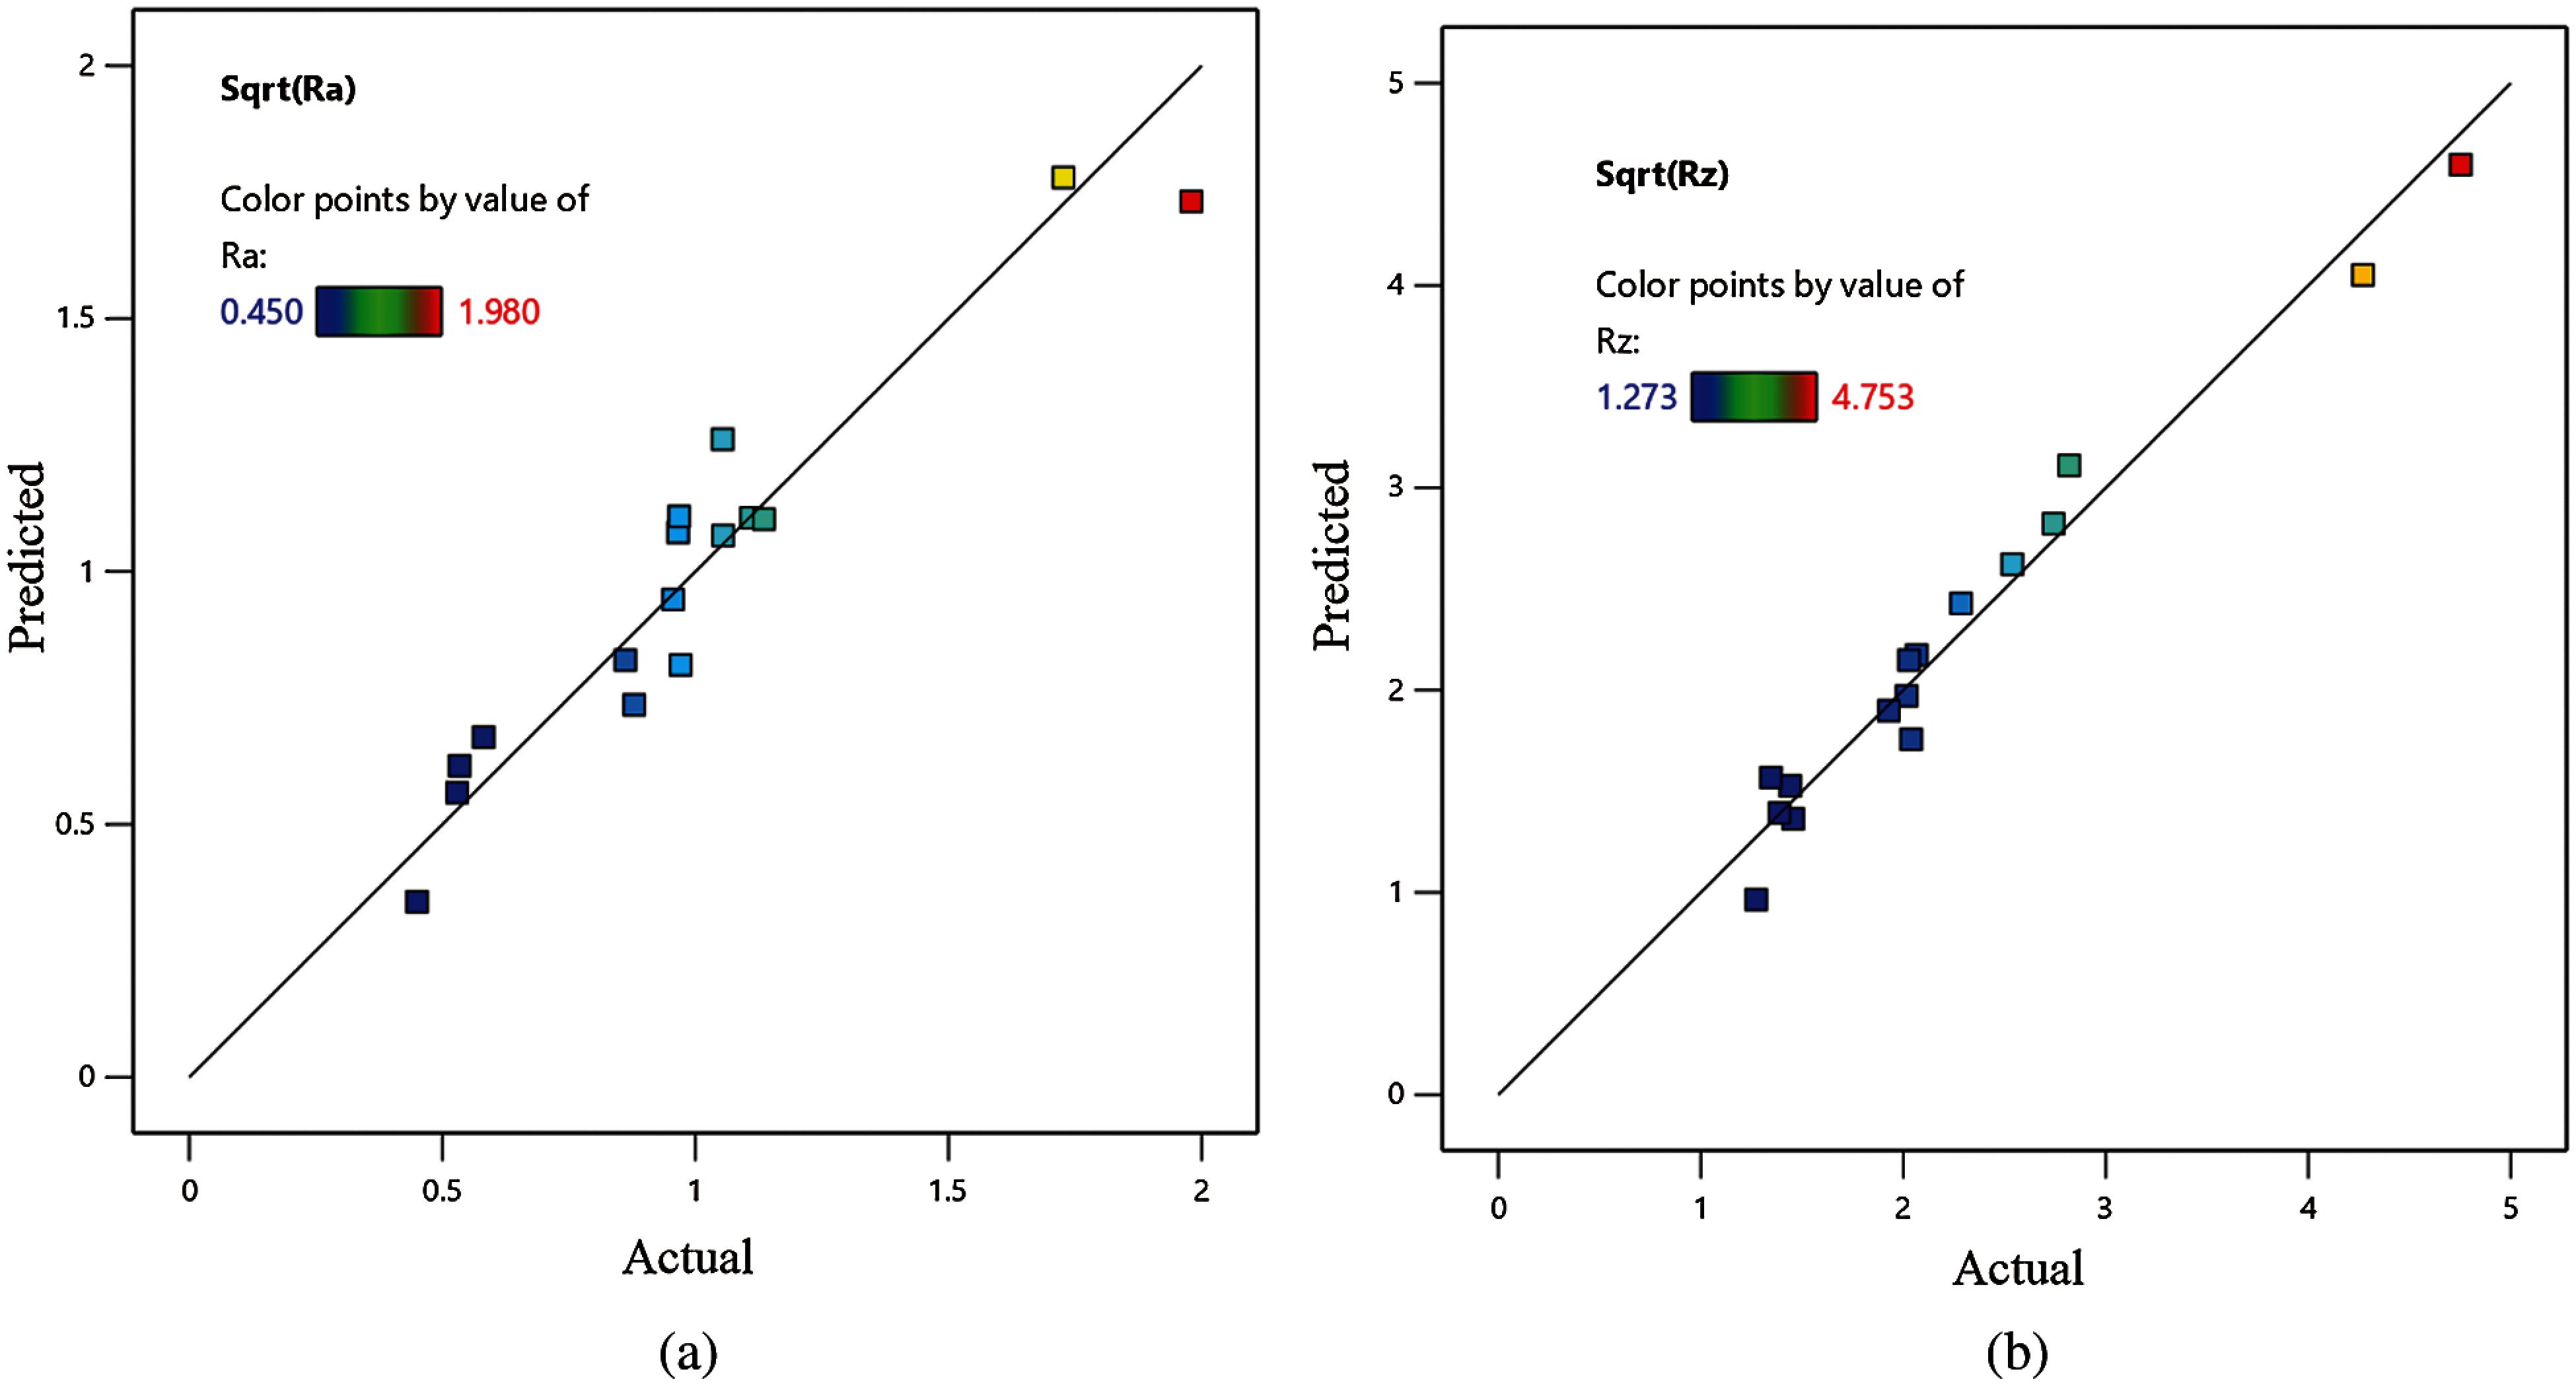
Figure 3: Comparison of the predicted values of output response: (a) for Ra and (b) for Rz
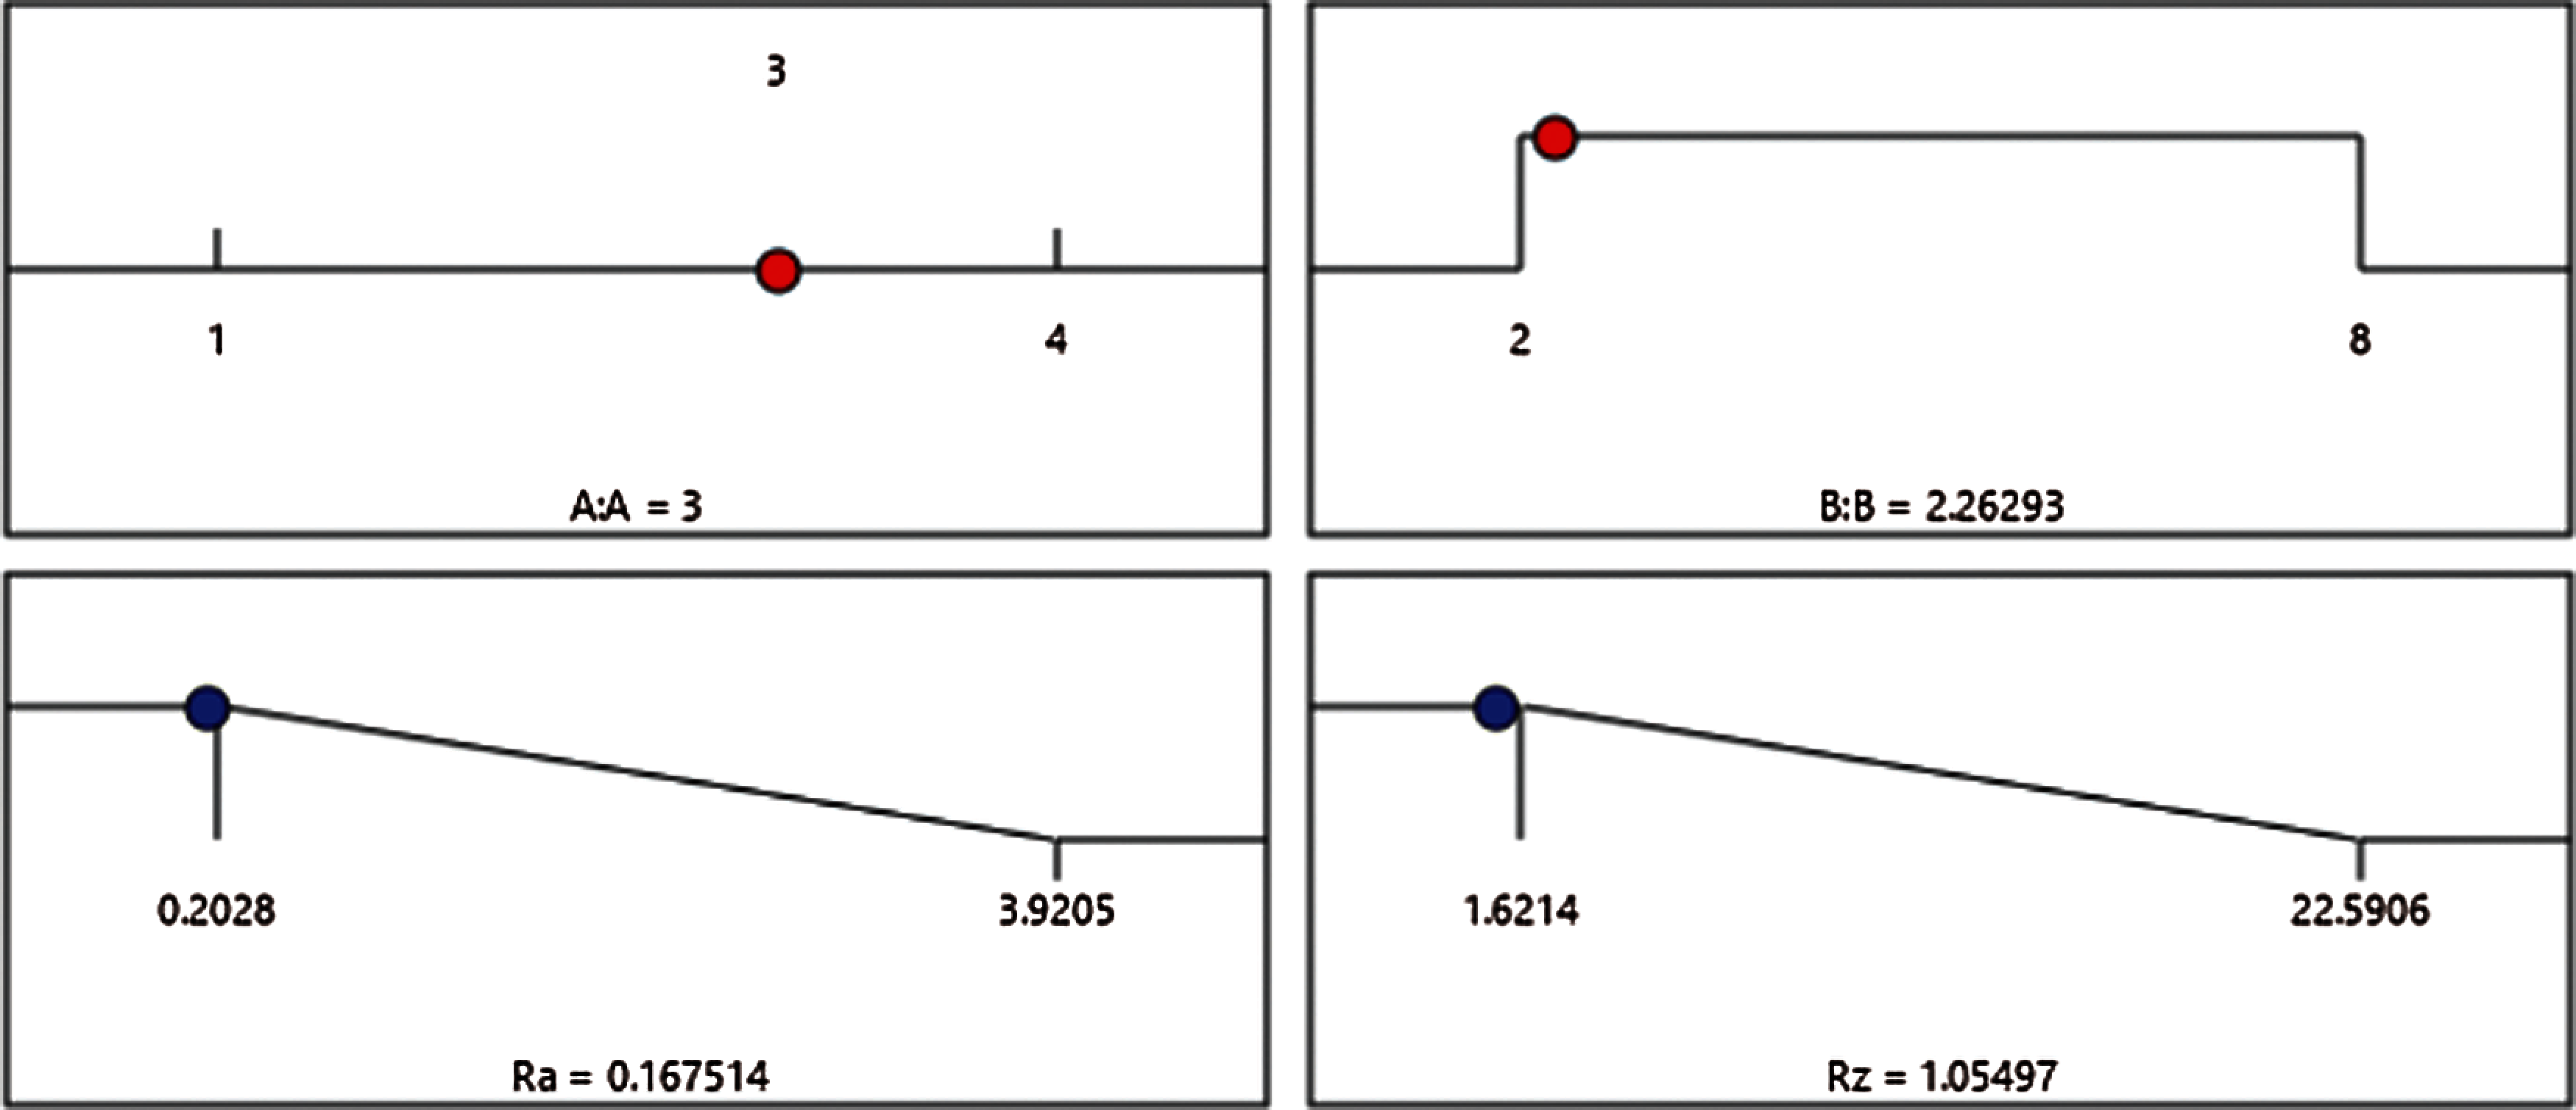
Figure 4: Optimal input parameters and minimum corrosion resistance from the RSM optimization method
A plot of the system’s I/O data showed a nonlinear relationship that requires a robust tool to handle this kind of data. Fuzzy logic is one of the best tools for building an efficient and robust model for the data under consideration. Therefore, each of the experiment used a dual-input single-output data sample to construct the fuzzy model. This set of data was divided into two portions with a ratio of 70:30 for the training and testing phases. In system modeling, the most appropriate fuzzy model structure is the Takagi–Sugeno adaptive neuro-fuzzy inference system (ANFIS), which can track the nonlinear data accurately, and this was the artificial neural network used in this work. Furthermore, the subtractive clustering (SC) technique was utilized to construct the fuzzy rules, which produced seven and 10 fuzzy rules, respectively, for Ra and Rz. However, the minimum, maximum, and Wavg were selected for the implication, aggregation, and defuzzification methods, respectively. In addition, the inputs’ MFs were selected as the Gaussian shape for the fuzzification process, and only 10 epochs were found to be sufficient for the current training phase. The statistical measures were used for the assessment of model performance during the training and testing phases. These measures include the RMSE and the covariance, R2, between the model’s output and the experimental data.
Fig. 5 shows the fuzzification step in creating a fuzzy logic system, in which the fuzzy control system has two inputs and one output for each model. Fig. 6 illustrates the input and the output membership functions of the fuzzy system for nanoparticle percentages. Tab. 6 presents a statistical evaluation of the fuzzy-based models.
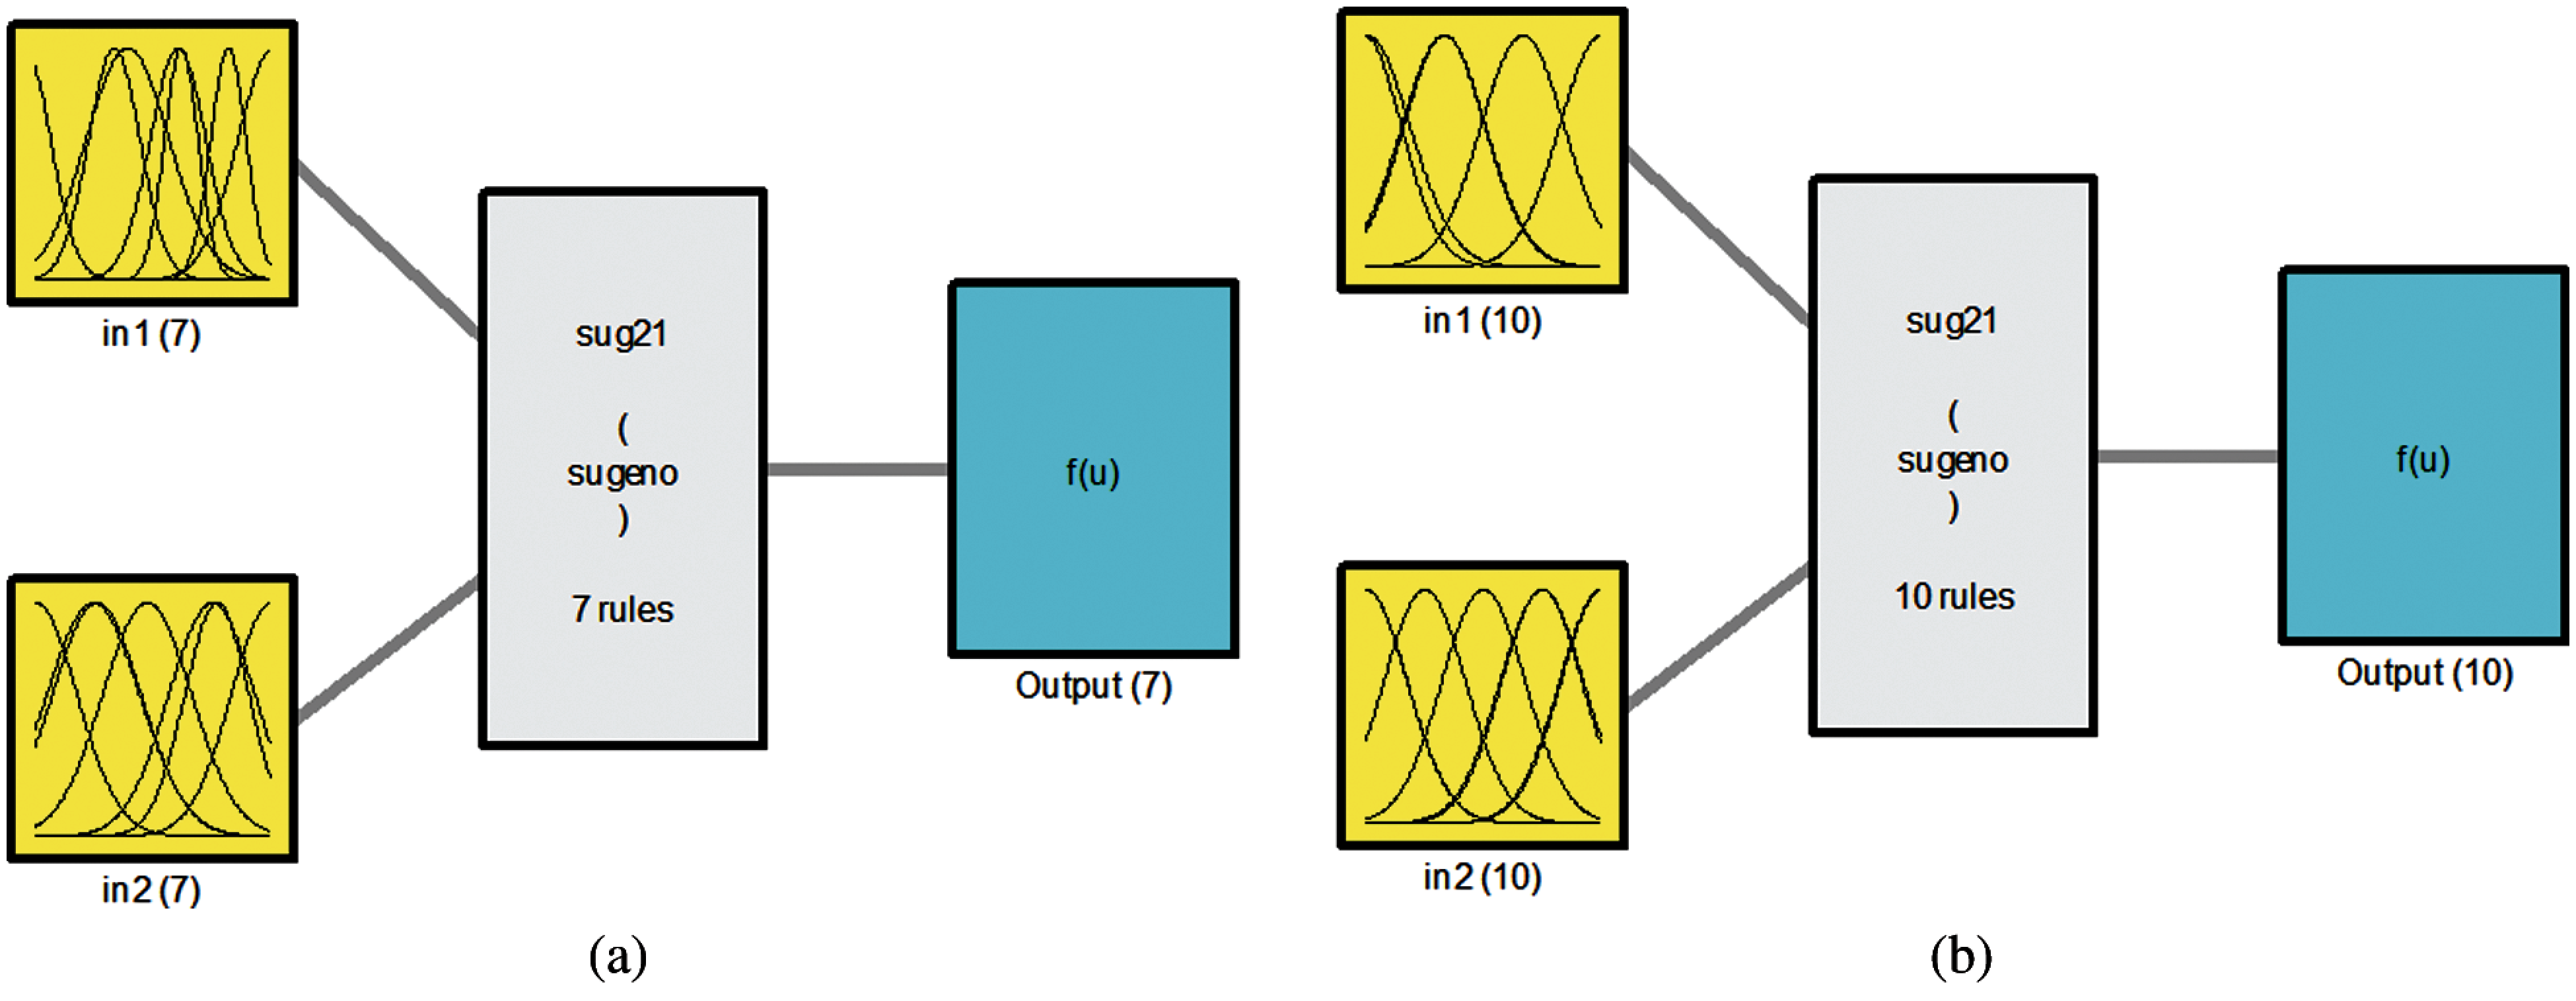
Figure 5: Inputs and outputs of fuzzy system: (a) for Ra and (b) for Rz
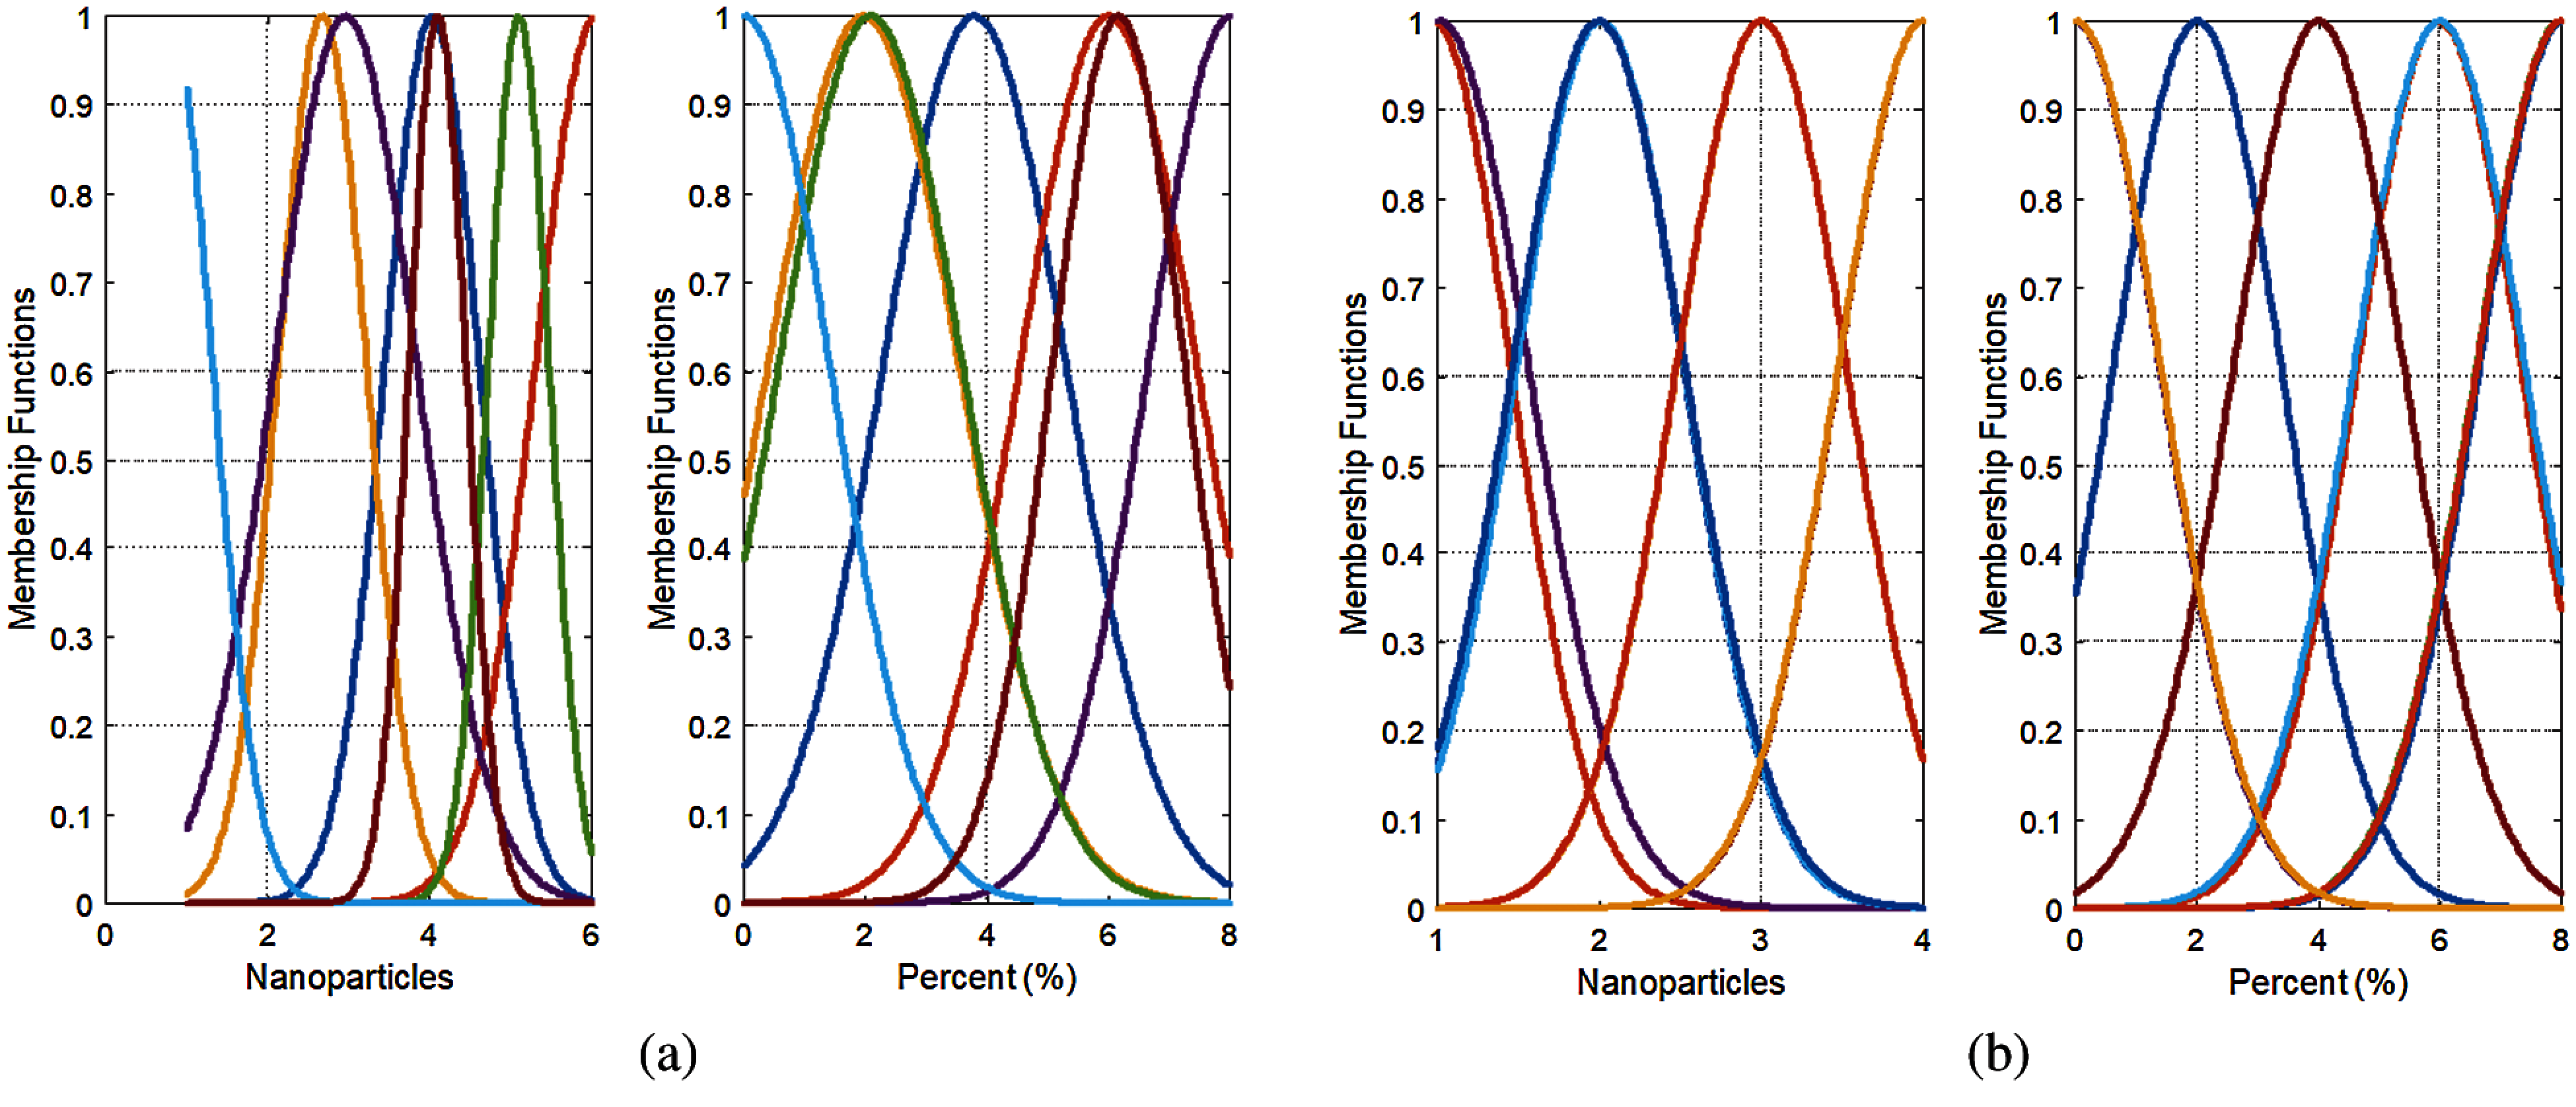
Figure 6: Input membership functions of the fuzzy system: (a) for Ra and (b) for Rz
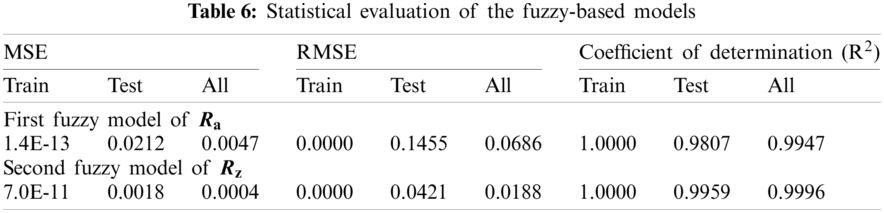
As shown in Tab. 6, for modeling the first output of Ra, the RMSE values are 0.0 and 0.1455, respectively, for training and testing. The coefficient-of-determination values are 1.00 and 0.9807, respectively, for training and testing. This proves the superiority of fuzzy modeling. For modeling the second output of Rz, the RMSE values are 0.0 and 0.0421, respectively, for training and testing. The coefficient-of-determination values are 1.00 and 0.9959, respectively, for training and testing.
The training and testing data for predicted and experimental results are plotted in Figs. 7 and 8, respectively, in order to show the training and testing data’s prediction accuracy. The figures illustrate the high level of correlation for both system outputs.
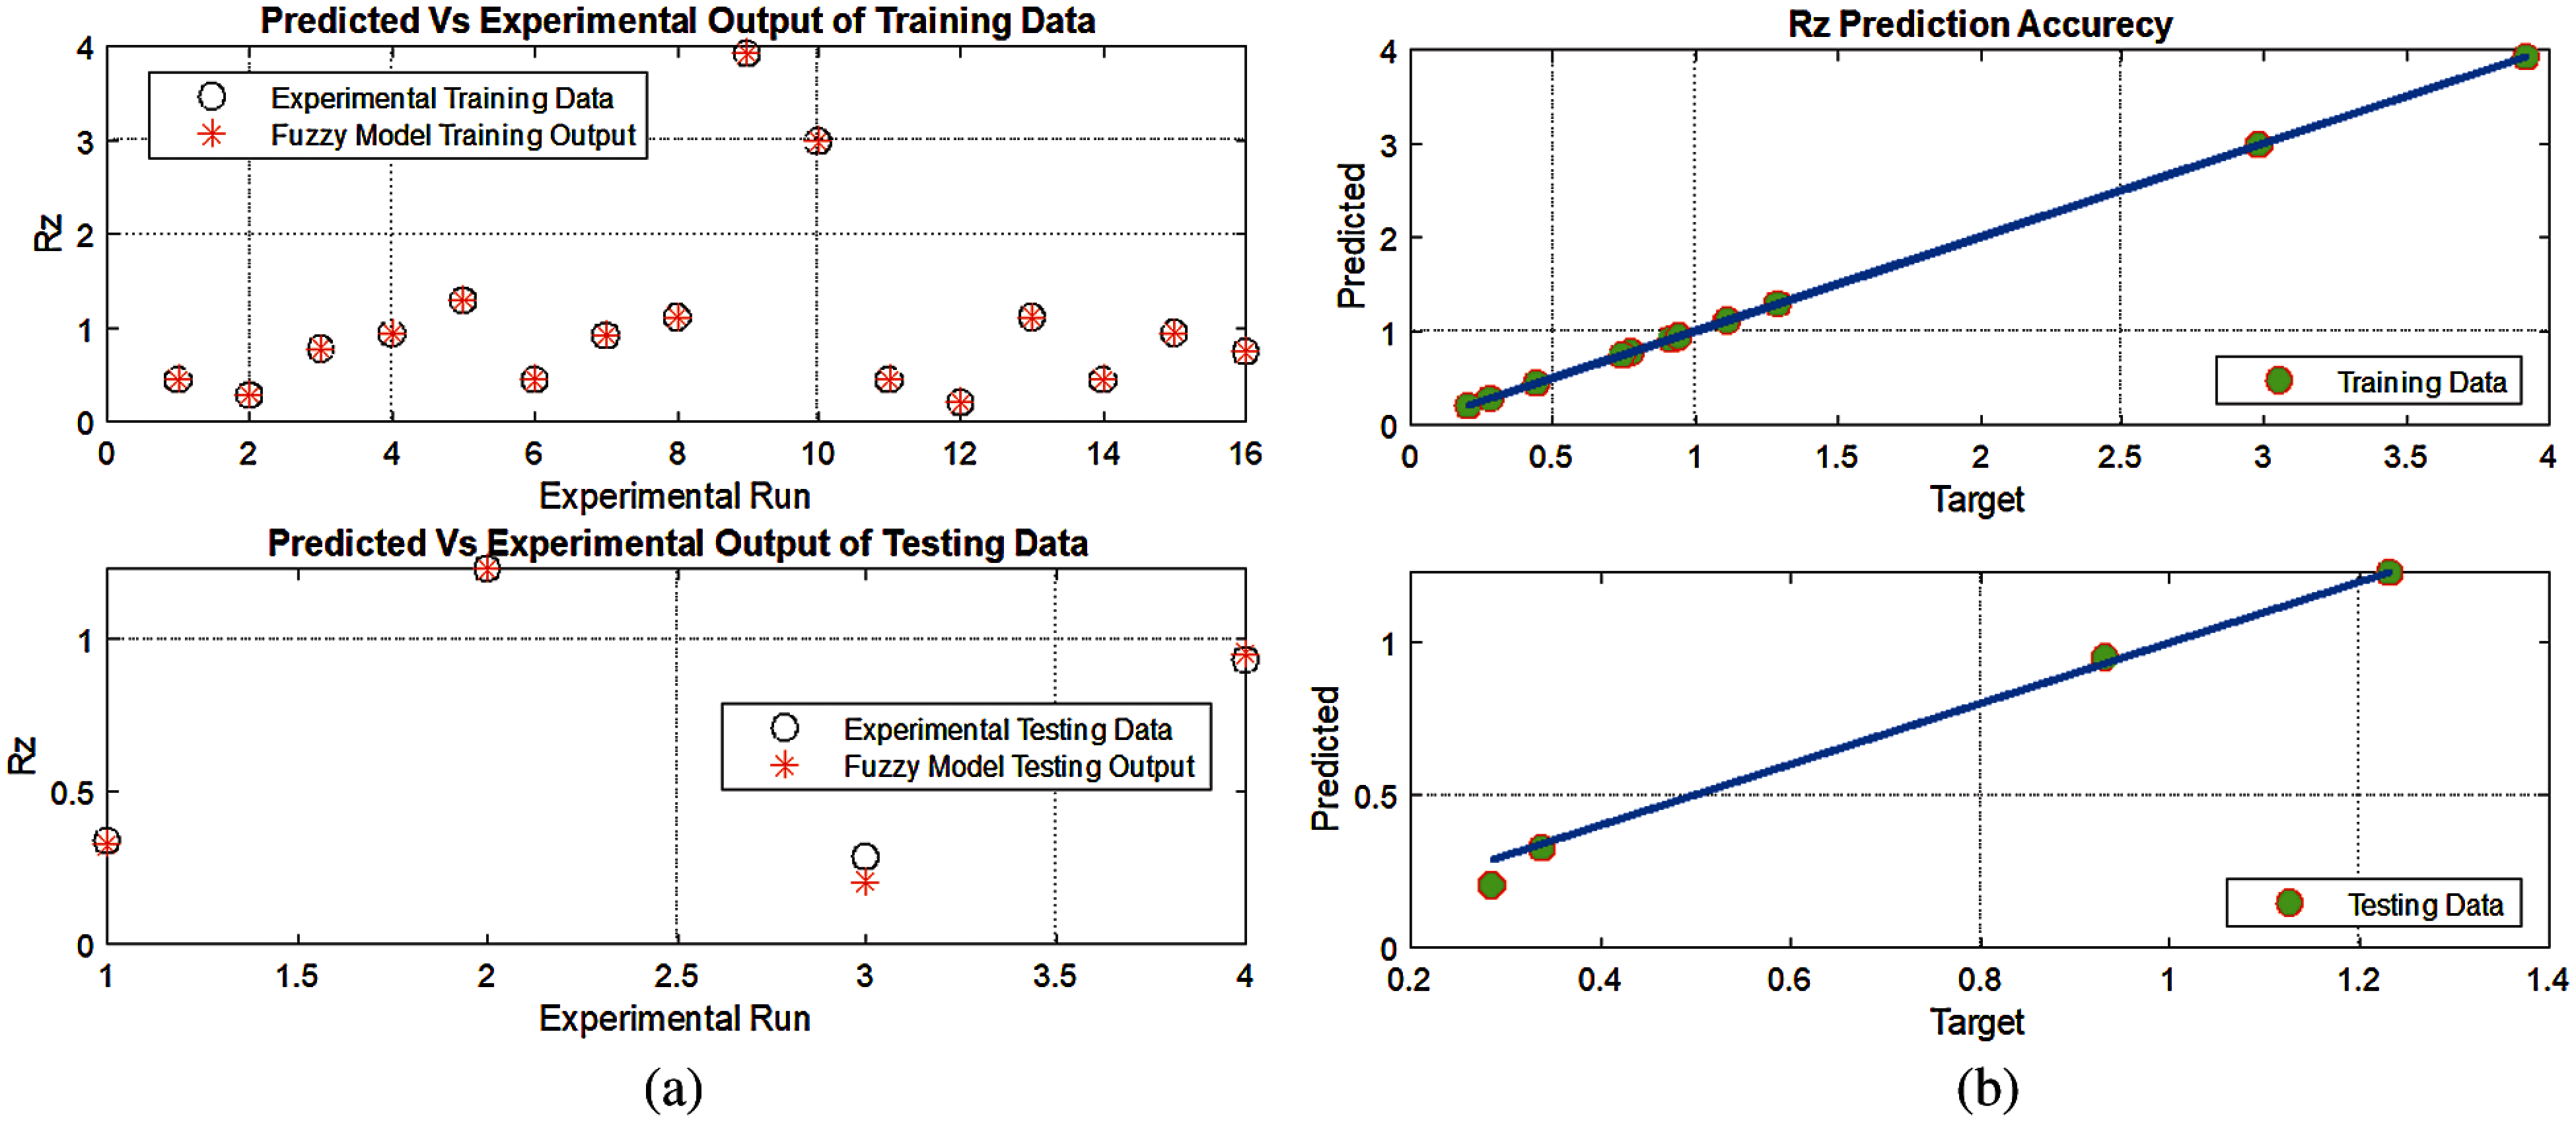
Figure 7: Comparison of the training and testing data: (a) predicted vs. experimental outputs of Rz and (b) prediction accuracy of training and testing data for Rz
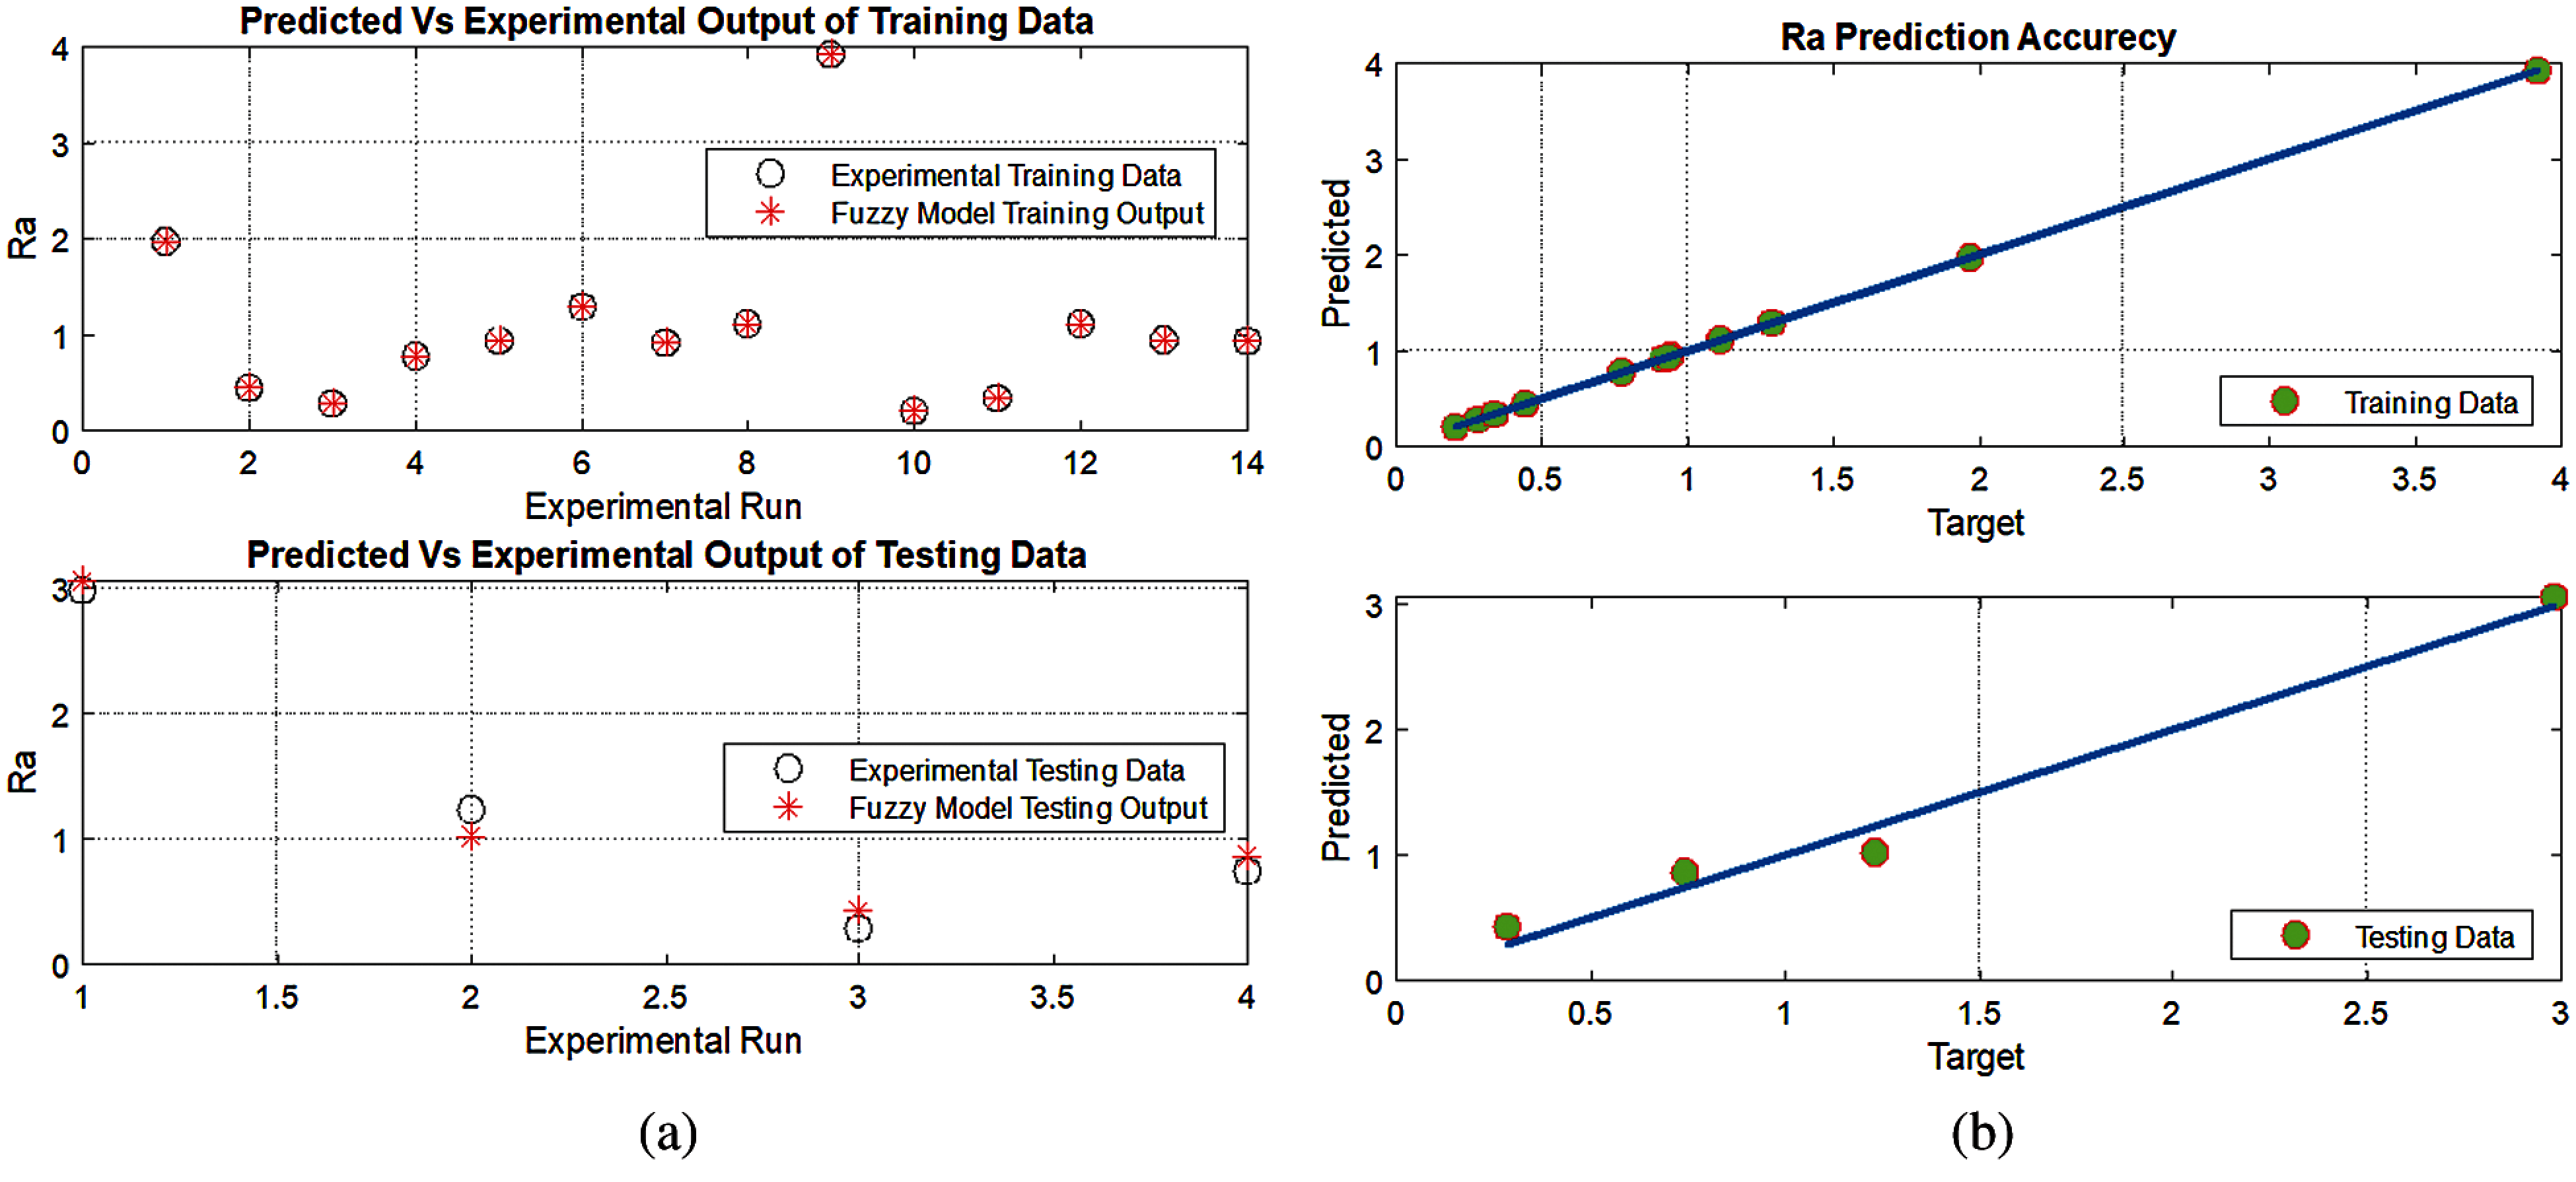
Figure 8: Accuracy of training and testing data for Ra: (a) predicted vs. experimental outputs of Ra and (b) prediction accuracy of training and testing data for Ra
Fig. 9 shows the Ra and Rz surface changing values related to percent (%) and nanoparticles for the fuzzy system.
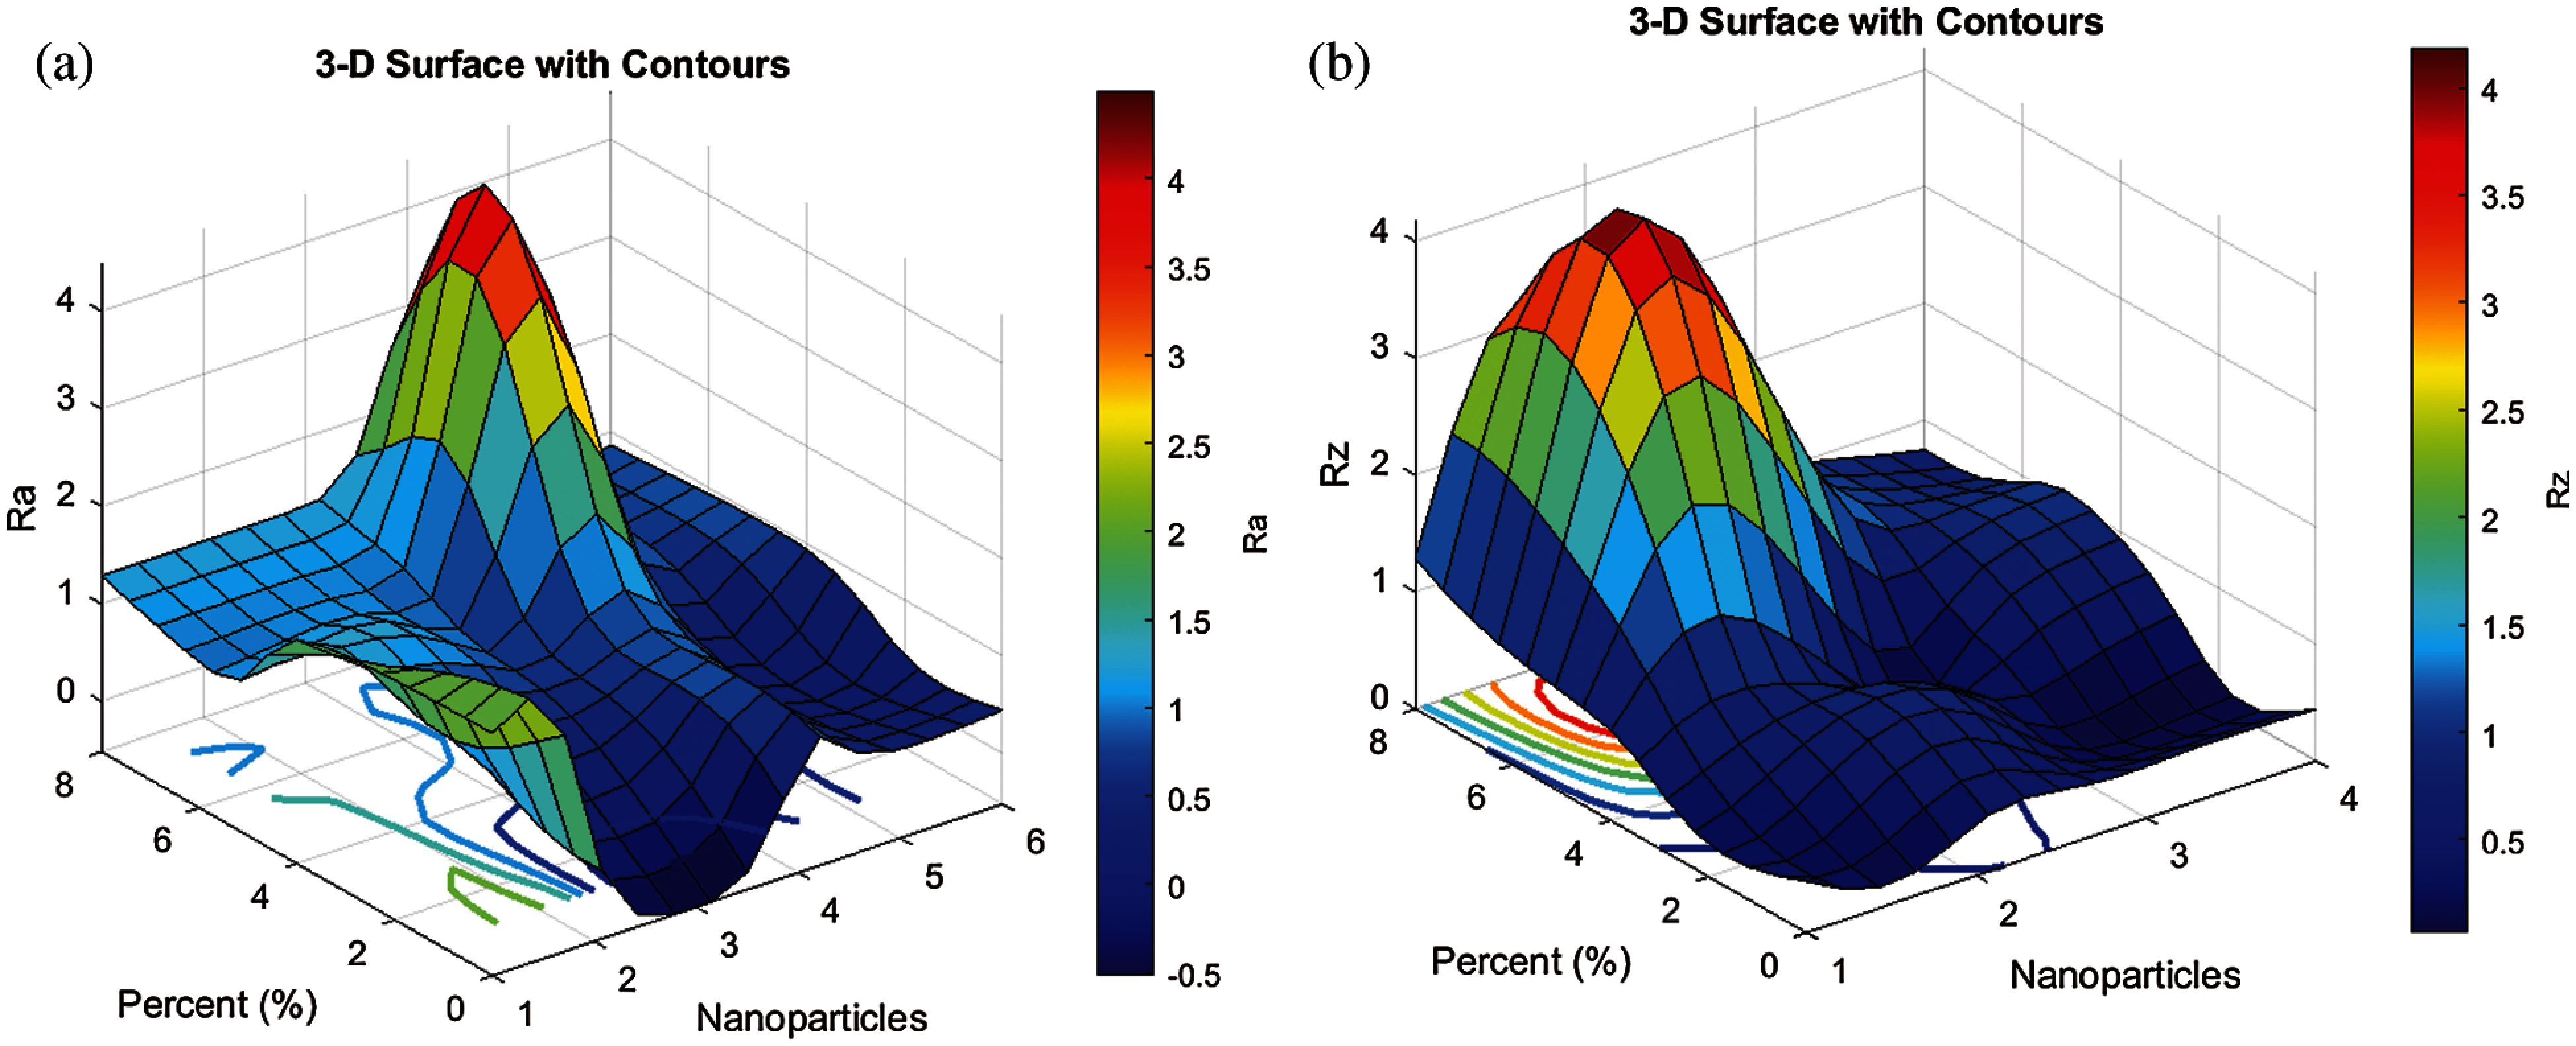
Figure 9: 3-D surface plot of Ra (a) and Rz (b) with changing values related to percent (%) and nanoparticles for fuzzy system
Optimization and robust fuzzy modeling were performed for the surface roughness of the protective composite coating of flue ducts in power plants. These composites consisted of epoxy reinforced by four nanoparticles, namely, Zno, ZrO2, SiO, and NiO, in percentages of 2%, 4%, 6%, and 8%, respectively. These nano-epoxy composite coatings showed significant improvements in corrosion resistance, which were obtained by optimizing and modeling their surface roughness due to low Ra and Rz values compared with those of Corten Steel. The experimental results revealed that the surface roughness profile at 2% showed a dramatic improvement in all four types of nano-epoxy composite coatings (C2–C5), compared to the original Corten Steel. Moreover, increasing the intensity of the nanoparticles in the composite coating resulted in an increase of the surface roughness. The conclusion is that an increase in these valuable minerals will improve the resistance to corrosion and will strengthen the coating layer. In the future work, modern optimization algorithm will be considered to determine the optimal system parameters.
Acknowledgement: The authors acknowledge the support of King Fahd University of Petroleum & Minerals, Saudi Arabia.
Funding Statement: The authors received no specific funding for this study.
Conflicts of Interest: The authors declare that they have no conflicts of interest to report regarding the present study.
1. A. F. Mohamed, E. H. Mohammad, S. A. Mohammad and M. K. Hassan, “Failure analysis of flue gas duct in a steam power plant,” International Journal of Mechanical & Mechatronics Engineering, vol. 20, no. 1, pp. 48–58, 2020. [Google Scholar]
2. A. U. Malik, F. A. Muaili, M. A. Ayashi and A. Meroufel, “An investigation on the corrosion of flue gas sensor in boiler stack,” Case Studies in Engineering Failure Analysis, vol. 1, no. 3, pp. 200–208, 2013. [Google Scholar]
3. M. M. Stack, F. H. Stott and G. C. Wood, “Review of mechanisms of erosion-corrosion of alloys at elevated temperatures,” Wear, vol. 162, no. 2, pp. 706–712, 1993. [Google Scholar]
4. Y. Zhuang, C. Chen, R. Timpe and J. Pavlish, “Investigations on bromine corrosion associated with mercury control technologies in coal flue gas,” Fuel, vol. 88, no. 9, pp. 1692–1697, 2009. [Google Scholar]
5. M. Montgomery, R. E. Olesen and P. Gensmann, “Corrosion in the flue gas cleaning system of a biomass-fired power plant,” Journal of Failure Analysis and Prevention, vol. 17, no. 2, pp. 195–204, 2017. [Google Scholar]
6. P. Pan, W. Zhou, H. Chen and N. Zhang, “Investigation on the corrosion of the elbows in the flue gas cooler of a 600 MW coal-fired power plant,” ACS Omega, vol. 5, no. 50, pp. 32551–32563, 2020. [Google Scholar]
7. A. Nazeer and M. Madkour, “Potential use of smart coatings for corrosion protection of metals and alloys: A review,” Journal of Molecular Liquids, vol. 253, no. 4, pp. 11–22, 2018. [Google Scholar]
8. S. Zhao, Y. Zhao, Y. Han, A. Chunjiang, J. Wei et al., “Prevention of stack corrosion under wet flue gas desulfurization conditions in a coal-fired power plant: Performance analysis and comparative study,” Environmental Systems Research, vol. 5, no. 1, pp. 1–11, 2016. [Google Scholar]
9. P. P. Deshpande, N. G. Jadhav, V. J. Gelling and D. Sazou, “Conducting polymers for corrosion protection: A review,” Journal of Coatings Technology and Research, vol. 11, no. 4, pp. 473–494, 2014. [Google Scholar]
10. N. S. Zakaria, Z. M. A. Merican and M. F. Hamza, “Performance and critical issues of polymer liners in pipeline industry: A review,” Materials Today, vol. 16, no. 4, pp. 2389–2397, 2019. [Google Scholar]
11. W. H. Tanveer, H. Rezk, A. Nassef, M. A. Abdelkareem, B. Kolosz et al., “Improving fuel cell performance via optimal parameters identification through fuzzy logic based-modeling and optimization,” Energy, vol. 204, no. 1, pp. 117976, 2020. [Google Scholar]
12. B. Yousef, H. Rezk, M. A. Abdelkareem, A. G. Olabi and A. M. Nassef, “Fuzzy modeling and particle swarm optimization for determining the optimal operating parameters to enhance the bio-methanol production from sugar cane bagasse,” International Journal of Energy Research, vol. 44, no. 11, pp. 8964–8973, 2020. [Google Scholar]
13. M. Kumari and S. K. Gupta, “Modeling of trihalomethanes (THMs) in drinking water supplies: A case study of eastern part of India,” Environmental Science and Pollution Research, vol. 22, no. 16, pp. 12615–12623, 2015. [Google Scholar]
14. R. Rezaee, A. Maleki, A. Jafari, S. Mazloomi, Y. Zandsalimi et al., “Application of response surface methodology for optimization of natural organic matter degradation by UV/H2 O2 advanced oxidation process,” Journal of Environmental Health Science and Engineering, vol. 12, no. 1, pp. 1–8, 2014. [Google Scholar]
15. N. Danbaba, I. Nkama and M. H. Badau, “Application of response surface methodology (RSM) and central composite design (CCD) to optimize minerals composition of rice-cowpea composite blends during extrusion cooking,” International Journal of Food Science and Nutrition Engineering, vol. 5, no. 1, pp. 40–52, 2015. [Google Scholar]
 | This work is licensed under a Creative Commons Attribution 4.0 International License, which permits unrestricted use, distribution, and reproduction in any medium, provided the original work is properly cited. |