DOI:10.32604/cmc.2022.020714
| Computers, Materials & Continua DOI:10.32604/cmc.2022.020714 | |
| Article |
Prediction of COVID-19 Transmission in the United States Using Google Search Trends
1College of Computer and Information Sciences, Jouf University, Sakaka, 72314, Saudi Arabia
2Faculty of Engineering, Al-Azhar University, Cairo, 11651, Egypt
3Faculty of Computers and Informatics, Zagazig University, Zagazig, 44519, Egypt
4RIADI Laboratory, La Manouba University, Manouba, 2010, Tunisia
5Department of Translational Data Science and Informatics, Geisinger, Danville, PA, 17822, USA
*Corresponding Author: Yasser El-Manzalawy. Email: yelmanzalawi@geisinger.edu
Received: 04 June 2021; Accepted: 08 September 2021
Abstract: Accurate forecasting of emerging infectious diseases can guide public health officials in making appropriate decisions related to the allocation of public health resources. Due to the exponential spread of the COVID-19 infection worldwide, several computational models for forecasting the transmission and mortality rates of COVID-19 have been proposed in the literature. To accelerate scientific and public health insights into the spread and impact of COVID-19, Google released the Google COVID-19 search trends symptoms open-access dataset. Our objective is to develop 7 and 14-day-ahead forecasting models of COVID-19 transmission and mortality in the US using the Google search trends for COVID-19 related symptoms. Specifically, we propose a stacked long short-term memory (SLSTM) architecture for predicting COVID-19 confirmed and death cases using historical time series data combined with auxiliary time series data from the Google COVID-19 search trends symptoms dataset. Considering the SLSTM networks trained using historical data only as the base models, our base models for 7 and 14-day-ahead forecasting of COVID cases had the mean absolute percentage error (MAPE) values of 6.6% and 8.8%, respectively. On the other side, our proposed models had improved MAPE values of 3.2% and 5.6%, respectively. For 7 and 14 -day-ahead forecasting of COVID-19 deaths, the MAPE values of the base models were 4.8% and 11.4%, while the improved MAPE values of our proposed models were 4.7% and 7.8%, respectively. We found that the Google search trends for “pneumonia,” “shortness of breath,” and “fever” are the most informative search trends for predicting COVID-19 transmission. We also found that the search trends for “hypoxia” and “fever” were the most informative trends for forecasting COVID-19 mortality.
Keywords: Forecasting COVID-19 transmission and mortality in the US; stacked LSTM; SARS-COV-2 and google COVID-19 search trends
In March 1st, 2020, the COVID-19 outbreak was declared a national emergency in the US. After exactly one year of this declaration and according to the JHU dashboard, the numbers of COVID-19 confirmed and death cases have reached more than 500 K and 17 M, respectively. This rapid spread of the virus in the US had negative impacts on several sectors including economy [1], education [2–4], health [5,6]. Reliable real-time forecasting of the spread of infectious diseases, including COVID-19, can improve public health response to outbreaks and save lives [7,8].
Since the emergence of the COVID-19 outbreak in late 2019, several scientists have developed computational models for forecasting COVID-19 confirmed cases, deaths, and recovery [9,10]. Commonly used statistical methods for time series forecasting such as autoregressive integrated moving average (ARIMA) [11] have been used in multiple studies for forecasting COVID-19 (e.g., [12–14]). These methods are typically based on historical data and do not account directly for disease transmission dynamics or any relevant biological process [15–17]. To account for these factors, epidemiological methods have been proposed for forecasting infectious diseases. Examples of the application of epidemiological methods for modeling the spread of COVID-19 infection include several frameworks based on the adaption of the SEIR (Susceptible, Exposed, Infected, and Recovered) method [18–20]. Because the time series forecasting task can be formulated as a supervised learning problem [21], several machine learning algorithms have been used for forecasting COVID-19 (e.g., [22–25]).
Recurrent neural networks (RNNs) [26,27] are machine learning based models that have been successfully applied to the problem of forecasting time series [28–30]. In RNNs, recurrent layers consist of a sequence of recurrent cells whose states are determined by past states and current inputs. Long short-term memory (LSTM) [31,32] is a variant of RNN designed to capture long-term dependencies by introducing gate functions into the recurrent cell structure. Since its introduction, LSTM is probably the most widely used form of RNNs and have been successfully used in a broad range of sequence classification tasks including financial time series prediction [33], speech recognition [34], sentiment classification [35], traffic forecasting [36], and anomaly detection [37]. Deep neural network architectures can better model real-world time series with complex non-linear relationships [38,39]. A deep LSTM architecture, also called stacked LSTM (SLSTM), consists of several hidden LSTM layers and has been shown more effective in modeling complex sequence data [40].
Recently, Abbas et al. [41] have shown that Google search trends for nine COVID-19 related symptoms (namely, hypoxemia, ageusia, anosmia, dysgeusia, hypoxia, fever, pneumonia, chills, and shortness of breath (SOB)) are strongly associated with COVID-19 confirmed as well as death cases in the US. Results of their analysis suggested that these Google trends can be used (in combination with COVID-19 historical data) to forecast COVID-19 spread and mortality up to three weeks ahead in time. The main goal of this study is to validate this finding. Specifically, we propose a stacked LSTM (SLSTM) model for forecasting state-level daily cumulative COVID-19 confirmed and death cases in the US. We then use this model to quantify the importance of each Google search trend for forecasting COVID-19 transmission and mortality in the US. Finally, we demonstrate substantial improvements in the predictive performance of the SLTSM models when the data for up to three Google search trends are incorporated in the training of these models. Our results demonstrate the viability of incorporating Google search trends for COVID-19 related symptoms into deep learning models for forecasting COVID-19 transmission and mortality in the US.
Daily cumulative counts for COVID-19 confirmed and death cases were downloaded from a publicly available repository maintained by the Center for Systems Science and Engineering (CSSE) at Johns Hopkins University (JHU) [42]. We considered the data aggregated at the state level for the 50 US states plus the District of Columbia. We experimented with the data from March 1st, 2020 to September 31st, 2020. The downloaded counts were then normalized to count per million people in each state using 2019 census population estimates.
State-level aggregated and normalized Google COVID-19 search trends symptoms [43] were downloaded from https://github.com/google-research/open-covid-19-data/. The data includes search trends for 422 symptoms that might be related to COVID-19. However, we limited our experiments to the nine symptoms suggested by the exploratory functional data analysis [44] provided in [41]. Therefore, our final symptoms dataset includes time series for the following nine symptoms: hypoxemia, ageusia, anosmia, dysgeusia, hypoxia, fever, pneumonia, chills, and shortness of breath (SOB). Each time series were split into three sets for training, validation, and testing. The test set covers the last 45 days in our study interval (i.e., from August 17th to September 31st). The data for the remaining study time (from March 1st to August 16th) were split into training and validation such that the data from the last 45 days in this interval were used for validation.
Given a time series with n time points,
In the presence of an auxiliary time series (i.e., one time series corresponding to the Google search trends for COVID-19 related symptoms),
3 Our Proposed Deep Learning Model
We used the Long short-term memory (LSTM) networks [31,32] for developing predictive models for the four COVID-19 forecasting tasks considered in this study. LSTM is a type of Recurrent Neural Network (RNN) that is suitable for learning long-term dependencies in sequence data [45]. Long-terms dependencies are modeled using memory blocks [46]. A memory block or a single LSTM cell is a recurrently connected sub-network that contains a memory cell and three gates. Fig. 1 shows the architectures of an LSTM cell in an LSTM layer. The memory cell remembers the temporal state of the cell and the gates control the pattern of information flow. Input and output gates control information flow into and from the cell, respectively. The forget gate controls what information will be thrown away from the memory cell. Mathematically, an LSTM is expressed using the following equations:
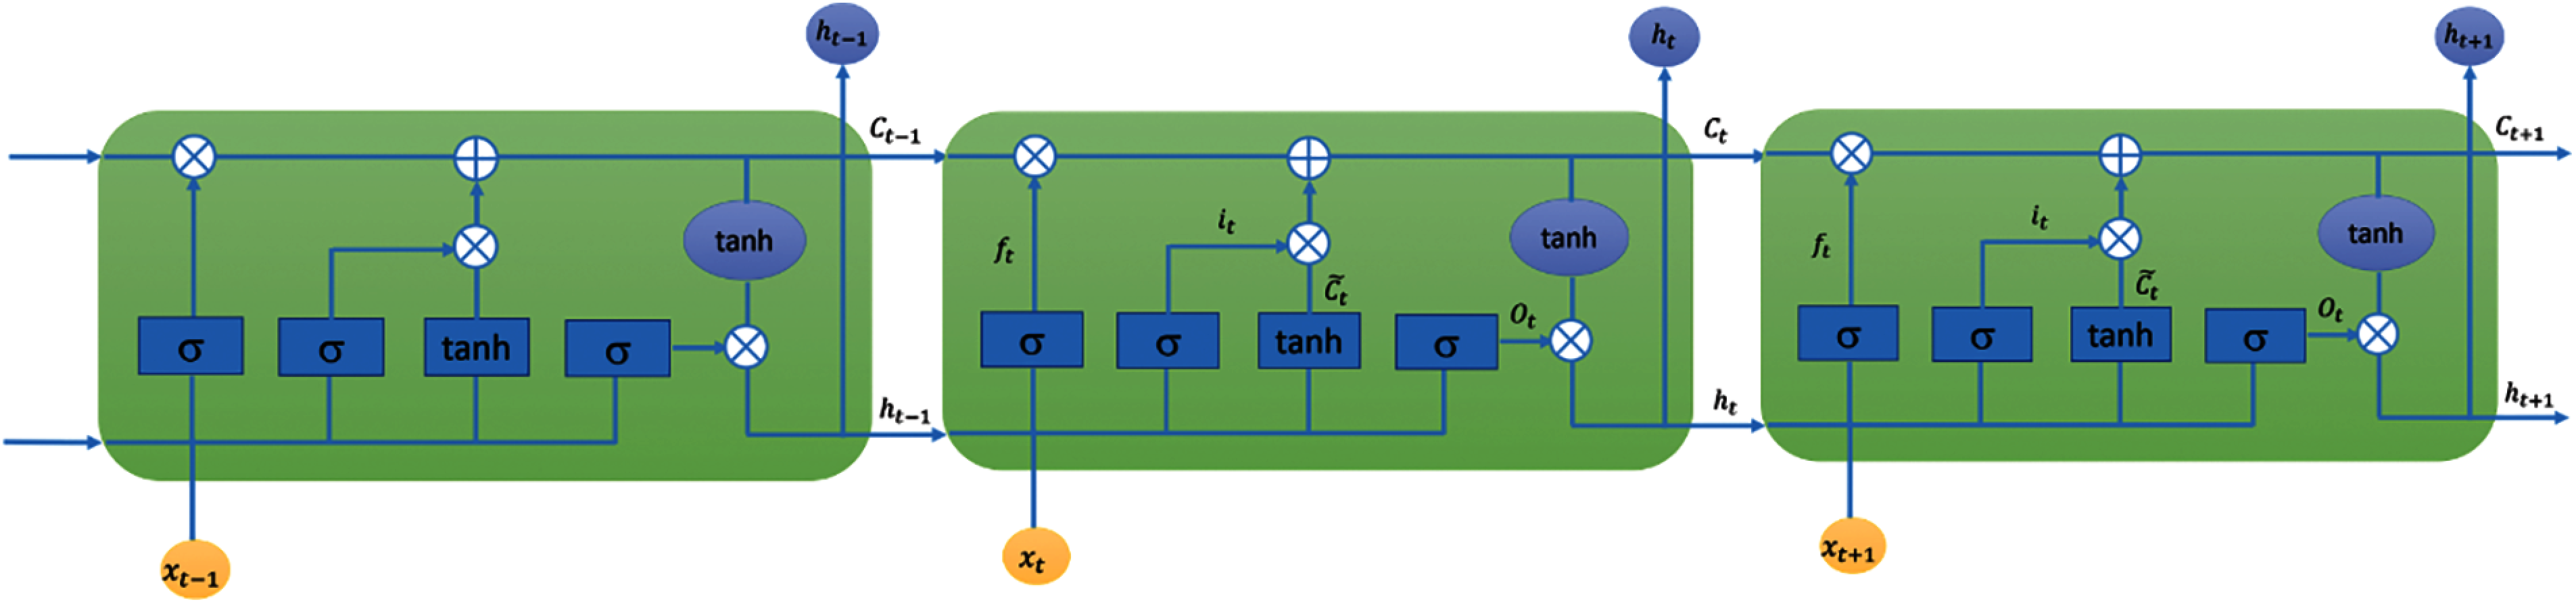
Figure 1: LSTM layer
A simple LSTM network includes a single LSTM layer. To add capacity and depth, multiple LSTM layers could be stacked together to form a multilayer fully connected structure [47]. Fig. 2 shows the structure of our proposed stacked LSTM (SLSTM) network, which included two LSTM layers. The first and second LSTM layers had 128 and 64 hidden units, respectively. The output of the second LSTM layer represents the deep features learned from the sequence data, which is then fed to a dense layer with 64 units followed by a single neuron, fully connected to the 64 neurons from the previous layer, for output. It is worth noting that this architecture had been used across all forecasting tasks and data representations as shown in the following subsection.
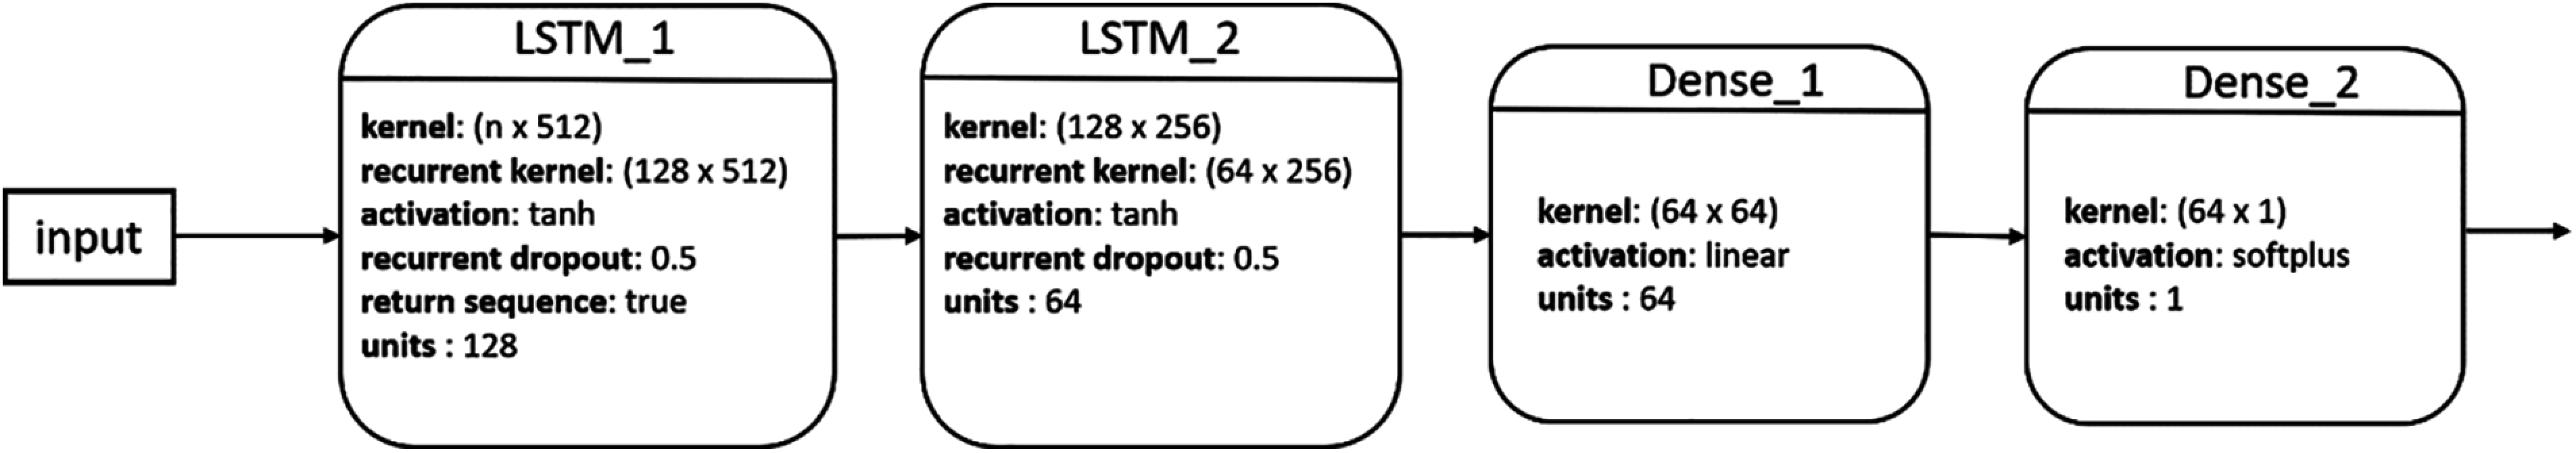
Figure 2: Architecture of our proposed SLSTM model
In our experiments, we considered
For implementing and evaluating the stacked LSTM models, we used the Keras version 2.4.3 and tensorflow version 2.3.1 libraries. For all experiments resulting from all possible combinations of the four forecasting tasks and the five types of inputs, we used the architecture and configurations shown in Fig. 2. The activation functions used were tanh, linear, and softplus for the two LSTM layers, dense layer, and output neuron, respectively. For the two LSTM layers, the recurrent dropout rate was set to 0.5. For training our models, we used the Mean Squared Logarithmic Error (MSLE) loss and an early stopping technique [48] such that the training process was stopped if no improvement in the model performance, in terms of MAPE on the validation set, was noted for 20 iterations.
We assessed the predictive performance of our models using the mean absolute percentage error (MAPE) defined as
5.1 Trajectories of COVID-19 Confirmed and Death Cases
Fig. 3 shows the cumulative COVID-19 confirmed case (left) and death (right) trajectories for the 51 US states. For COVID-19 confirmed cases, we noted that NY and NJ had the largest total per million counts of confirmed COVID-19 cases during mid-March until the third week of July. Starting the third week of July, several states, including LA, FL, and AZ, exceeded the number of confirmed cases in NY and NY as the rates of COVID-19 spread started to drop substantially in these two states. For COVID-19 death cases, we found that NJ and NY consistently had the highest number of total deaths and that their curves seemed to be flat starting the third week of July.
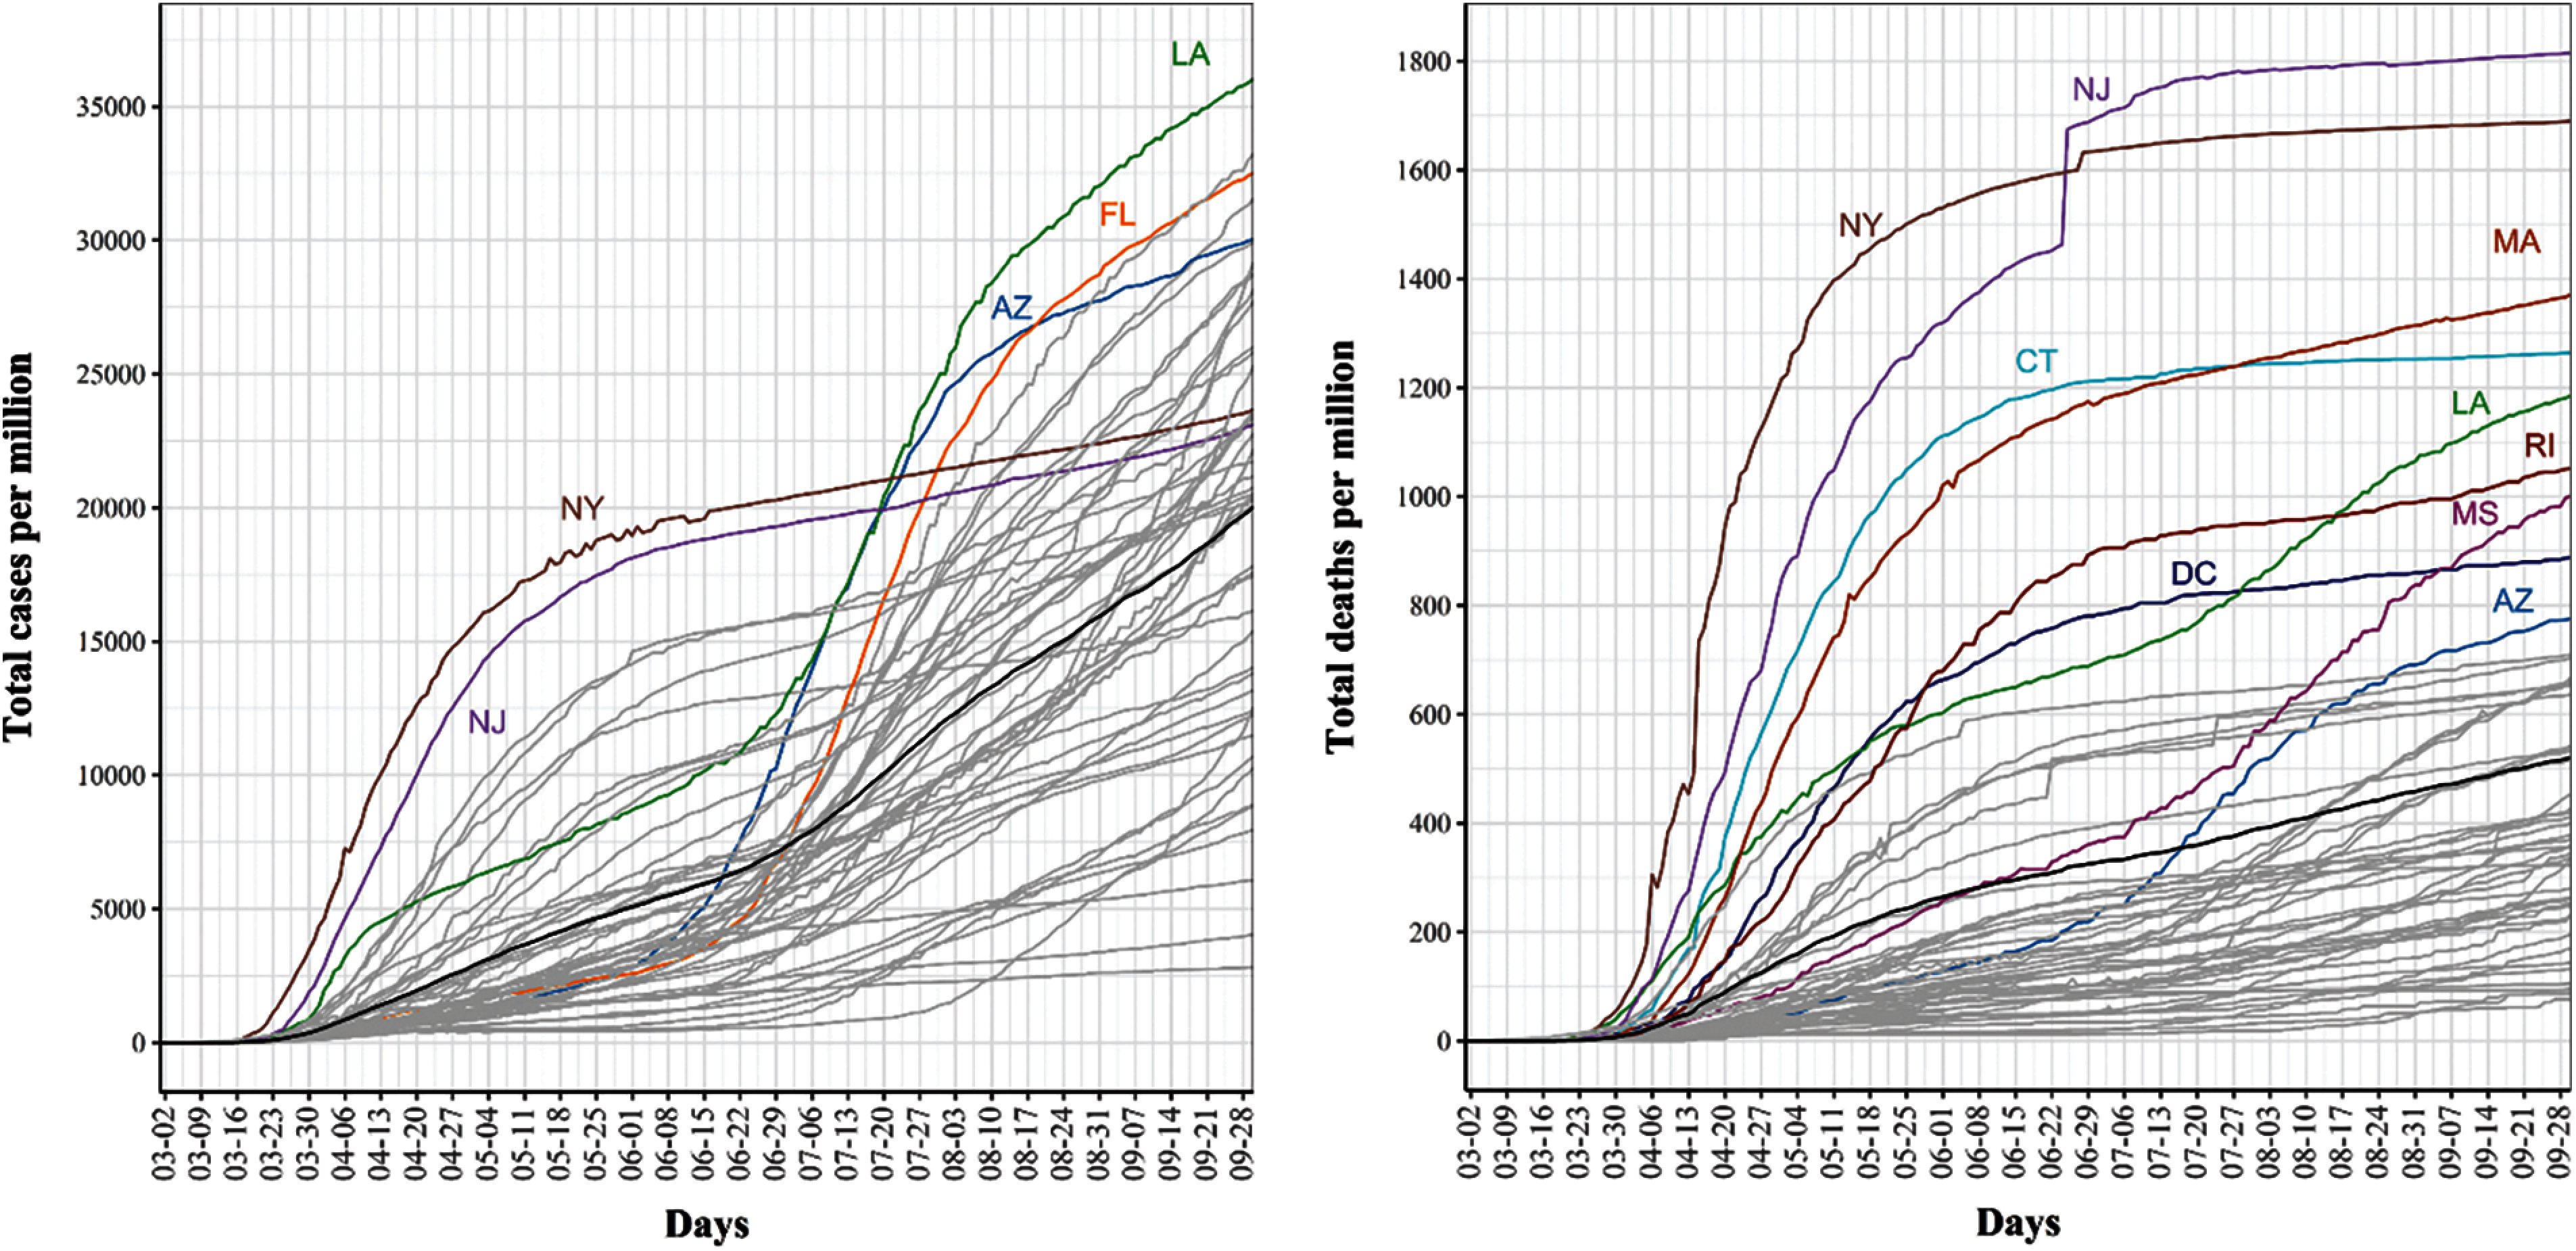
Figure 3: Trajectories for covid-19 daily cumulative per million confirmed (left) and death (Right) cases. The pointwise mean curve is highlighted in black
5.2 Prediction of COVID-19 Confirmed and Death Cases Using Historical Data and Univariate SLSTM
We report the performance of SLSTM models for predicting COVID-19 cases and mortality

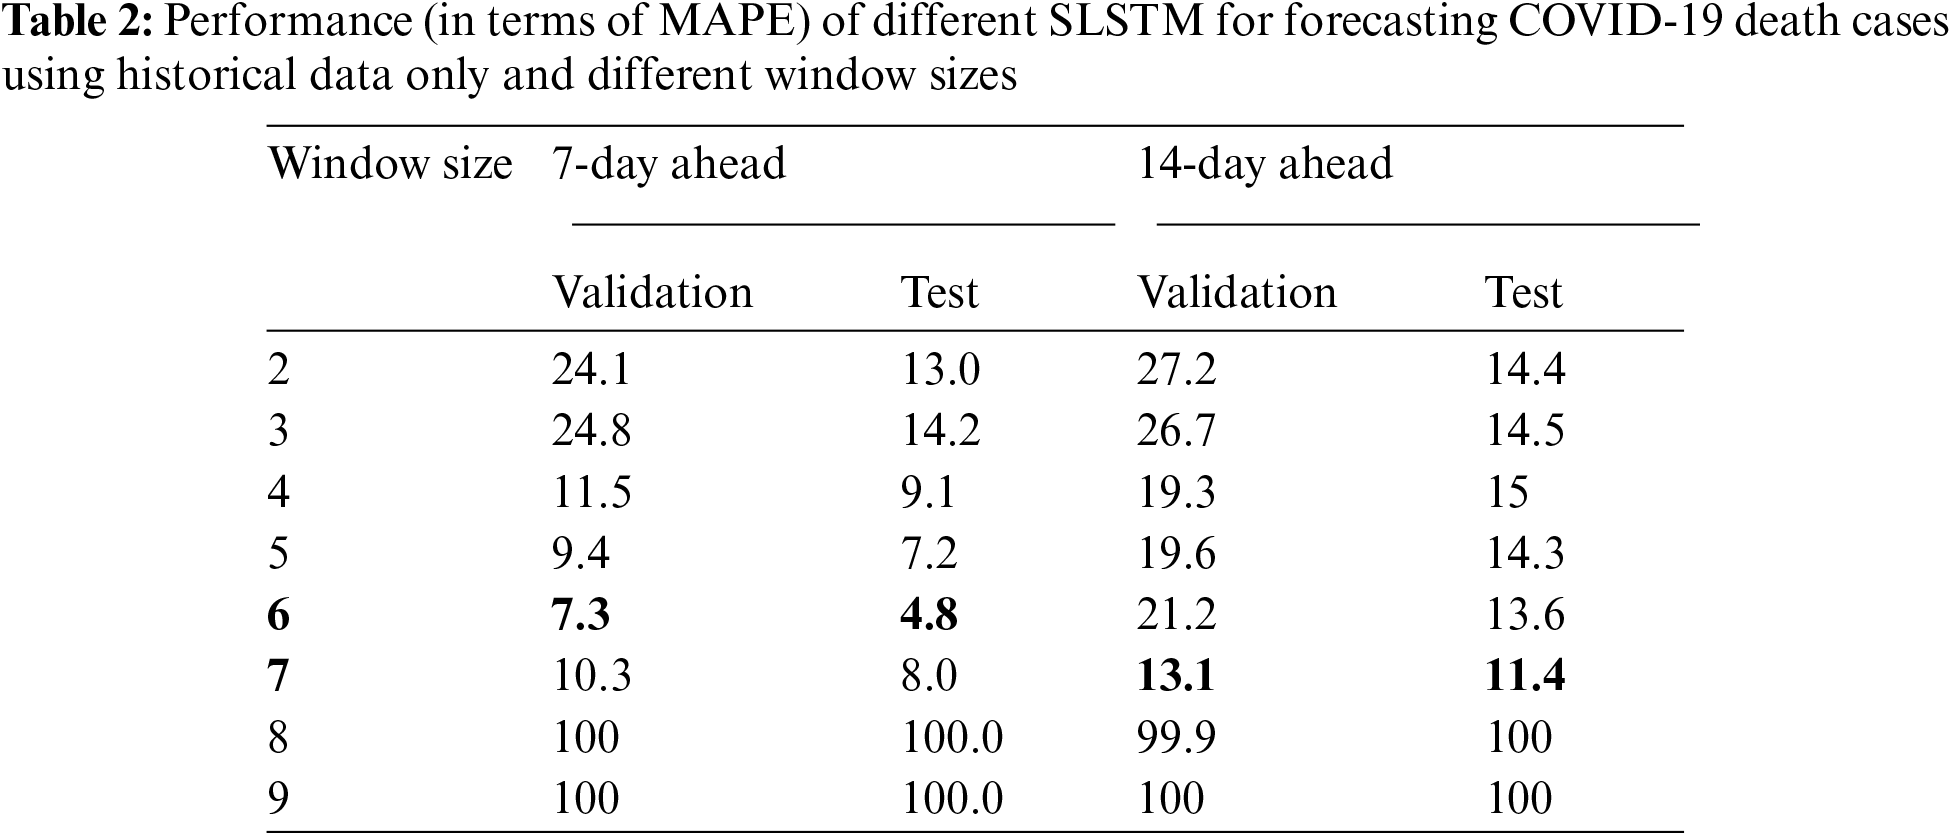
For 14-day-ahead COVID-19 case prediction, the best performing model used a window of size equals 9 and had the best observed MAPE scores of 11.8% and 8.8% on validation and test sets, respectively. Tab. 2 shows the performance of 16 SLSTM models for forecasting COVID-19 death cases. For the 7-day-ahead COVID-19 death prediction, the best SLSTM model was obtained using a window of size equals 6 and had the best observed MAPE scores of 7.3% and 4.8% on the validation and test sets, respectively. For the 14-day-ahead COVID-19 death prediction, the best model used a window of size equals 7 and had the lowest noted MAPE scores of 13.1% and 11.4% on the validation and test sets, respectively.
Interestingly, we found that: i) MAPE scores for best performing COVID-19 case prediction models were better than those for the best performing COVID-19 death prediction models; ii) Performance of the 7-day-ahead forecasting models was better than the performance of the 14-day-ahead forecasting models; iii) Performance of the models estimated using the validation sets was consistently lower than the performance of the models estimated using the test set. However, the validation test successfully identified the best performing model on the test set for 3 out of four prediction tasks.
5.3 Improved Prediction of COVID-19 Confirmed and Death Cases Using Google Search Trends for COVID-19 Symptoms
We proceed with reporting our experimental results for testing two hypotheses regarding the Google search trends for nine COVID-19 related symptoms: i) SLSTM models trained using any single symptom can predict COVID-19 confirmed and death cases; ii) SLSTM models trained using any single symptom combined with COVID-19 historical data can better predict COVID-19 confirmed and death cases compared with SLSTM models trained using historical data only. Our rationale is that these nine symptoms had been shown to have strong associations with both of COVID-19 transmission and mortality [41] and, therefore, could be used for forecasting COVID-19 transmission and mortality or for improving the performance of the models developed for the four tasks considered in this study.
Tabs. 3 and 4 show that the SLSTM models based on any of these nine symptoms failed to accurately predict COVID-19 cases 7 and 14-day-ahead. For these models, the best observed MAPE score was around 60%.


However, when any of these symptoms were combined with historical COVID-19 cases data, the best performing models, identified using the validation set, had MAPE scores on the test that was lower than the MAPE scores of the best performing SLSTM models trained using historical data only (i.e., MAPE scores of 6.6% and 8.8% for forecasting COVID-19 cases 7 and 14-day-ahead, respectively).
We also noted that, for predicting COVID-19 cases 7-day-ahead, the optimal SLSTM model used a window of size equals 3 and a combination of pneumonia and historical data as input. On the other hand, for predicting COVID-19 cases 14-day-ahead, the optimal SLSTM model used a window of size equals 5 and a combination of pneumonia and historical data as input. Despite these performance improvements, we observed that the MAPE scores estimated using the validation set failed to identify the best performing model on the test set. Overall, our results rejected the first hypothesis and accepted the second one for forecasting COVID-19 cases.
Similar findings were found for forecasting COVID-19 deaths (See Tabs. 5 and 6). Using any single symptom for training the SLSTM models for predicting COVID-19 death 7 and 14-day-ahead yielded poor models with MAPE scores of 75% or higher. When using search trends for hypoxia combined with historical death counts, the best SLSTM had a MAPE score of 4.7%. That was a slight performance improvement over the best SLSTM model using historical death counts only with MAPE score of 4.8% for predicting COVID-19 deaths 7-day-ahead. However, there existed a model with an improved MAPES score of 3.9%, but our selection criteria of the best model based on its performance on the validation set failed to suggest it. For 14-day-ahead forecasting of COVID-19 deaths, the best SLSTM model, based on search trends for favor and historical death counts, had a MAPE score of 8.7%, which is a considerable performance improvement compared with the SLSTM model based on historical data only with a MAPE score of 11.4%.

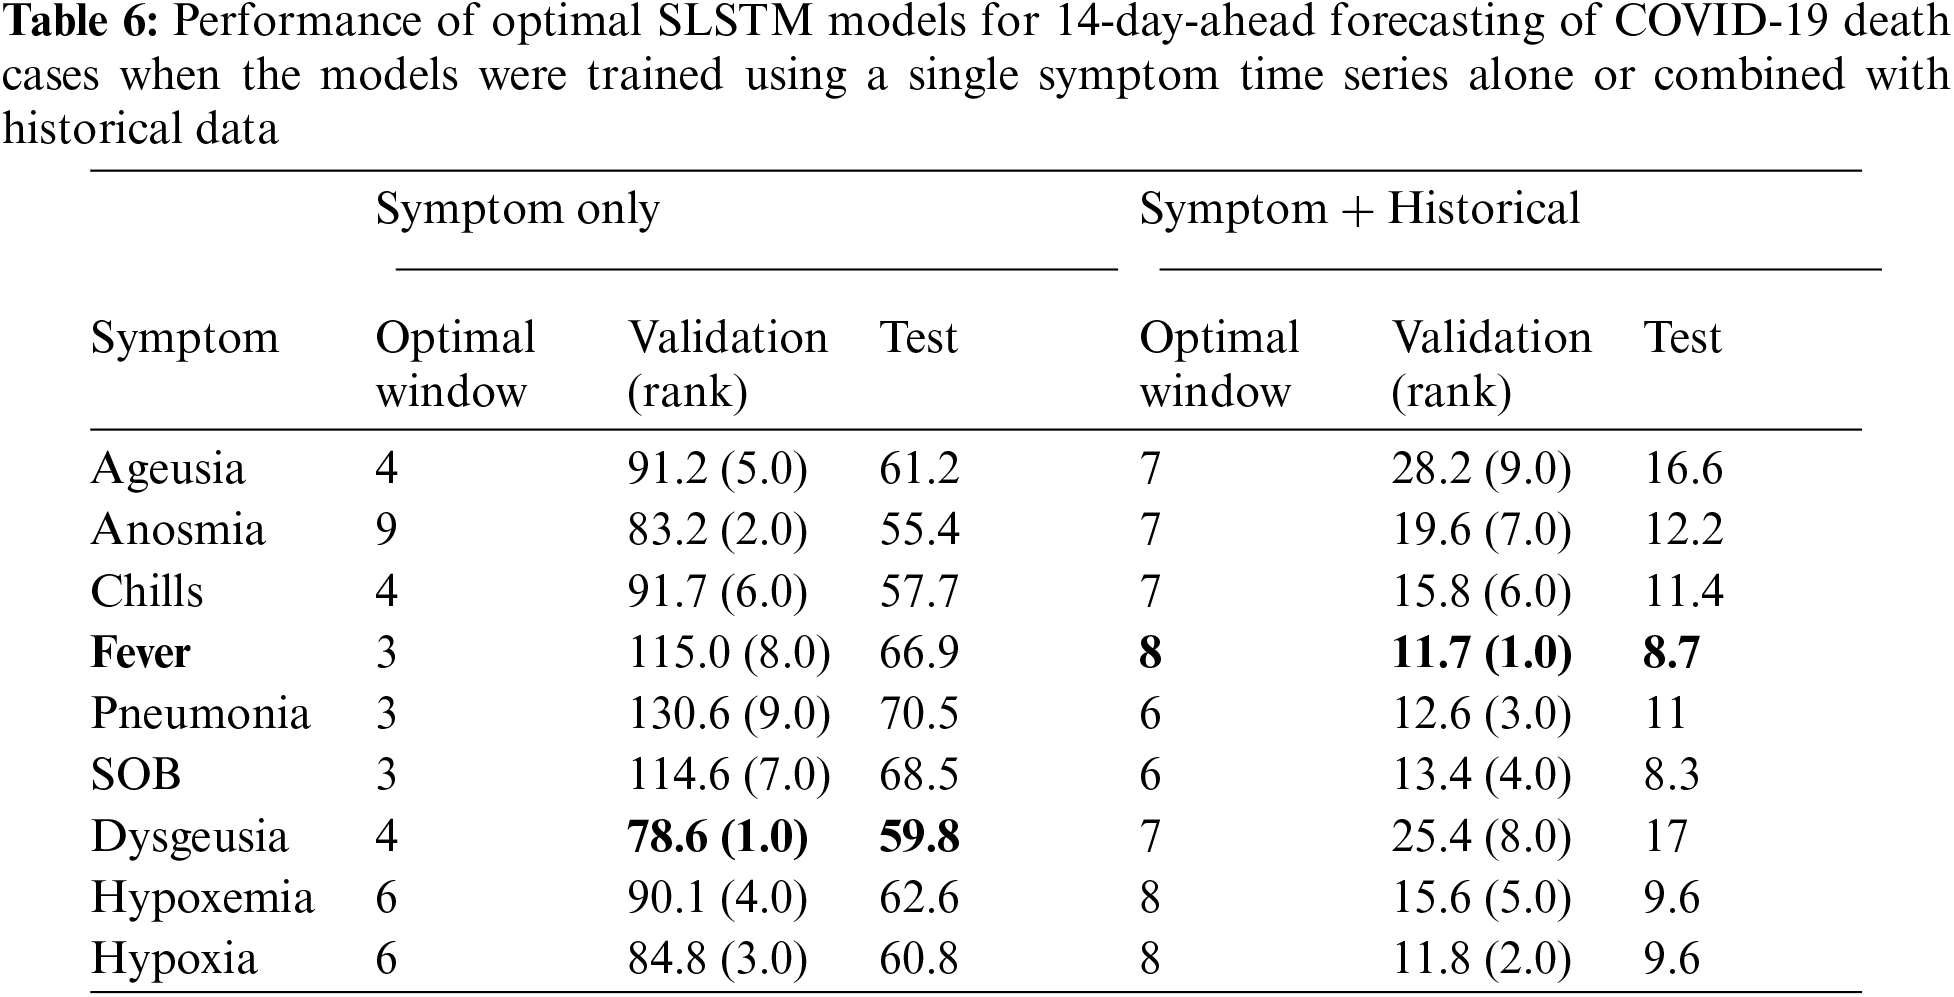
In summary, our results suggested that developing SLSTM models trained using historical data and search trends for pneumonia yielded improvements in predicting 7 and 14-day-ahead COVID-19 cases. Including search trends for fever in the development of the SLSTM models for forecasting 7-day-ahead COVID-19 deaths improved the performance. However, the model did not perform the best on the evaluation set. Thus, we failed to identify it as the optimal model. Finally, incorporating search trends for fever in training the SLSTM models led to improvement in the performance of the best model for predicting 14-day-ahead COVID-19 deaths. Next, we show that including search trends for two or three symptoms (instead of just one) yielded consistent improvements in the performance of the learned models. Besides, it also improved the agreement between the validation and test sets for identifying the best performing models.
5.4 Further Improved Forecasting of COVID-19 Using Google Search Trends for More Than One COVID-19 Symptom
Results reported in Tabs. 3–6 demonstrated the viability of including Google search trends for one COVID-19 related symptom in training the SLSTM models. Here, we assessed whether including Google search trends for two or three COVID-19 related symptoms could further improve the predictive performance of the models. In this experiment, for each prediction task, we ranked the symptoms based on their MAPE scores obtained using the validation set for the bivariate SLSTM models (See Tabs. 3–6). Then, we considered the combinations of historical data with the top two and top three symptoms data series. Tab. 7 shows the best performing SLSTM models trained using historical data and Google search trends for up to three symptoms.
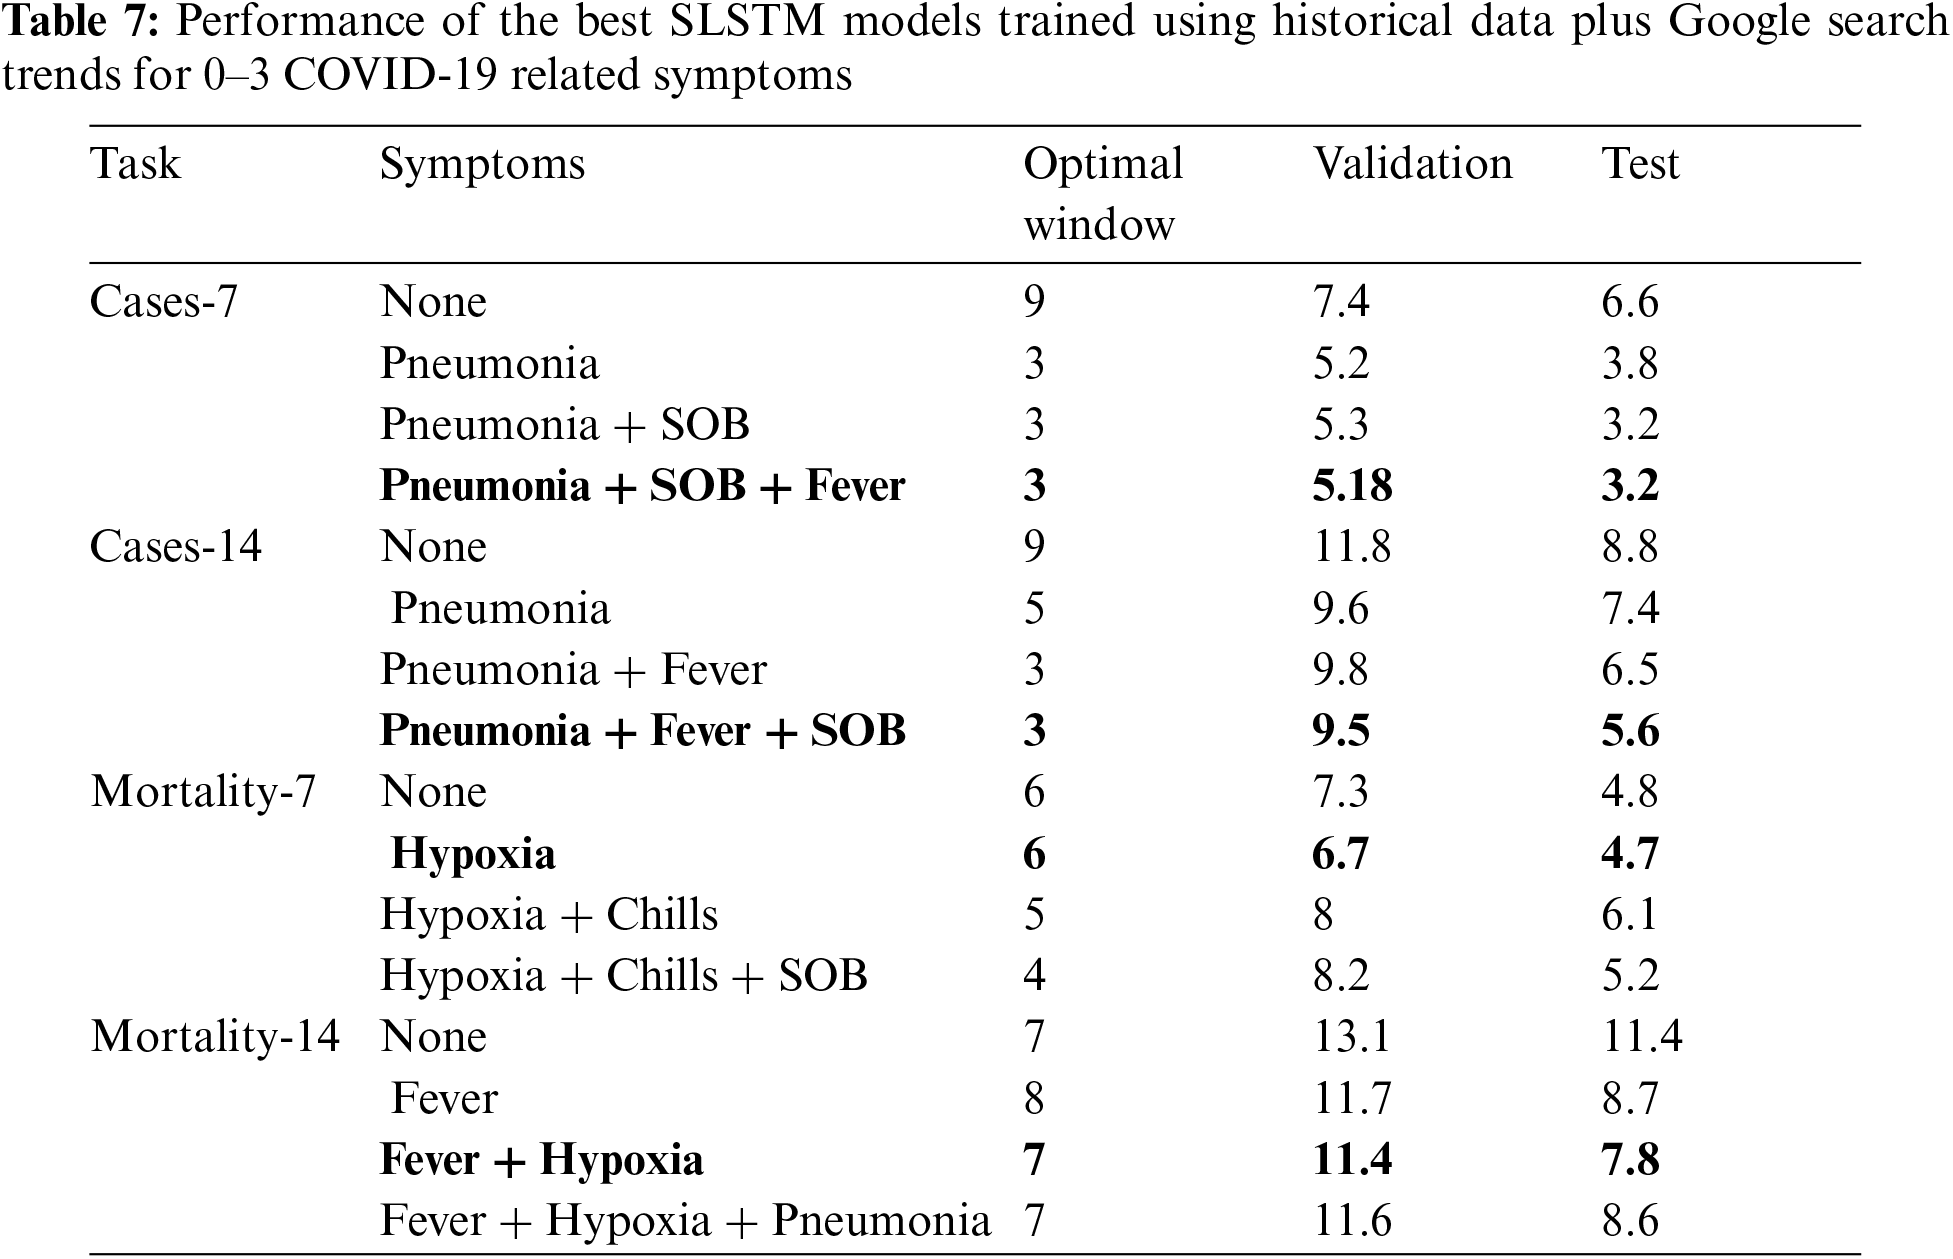
For 7 and 14-day-ahead forecasting of COVID-19 transmission, the best performed models used a window of size equals 3 and utilized the historical data and the top three symptoms data series to achieve the best reported MAPE values of 3.2% and 5.6%, respectively. Although including the time series for the top three symptoms relevant for forecasting COVID-19 mortality provided SLSTM models with better performance than those trained using historical data only, the best performing models for 7 and 14-day-ahead forecasting of COVID-19 mortality were obtained using one and two symptoms, respectively.
Interestingly, all optimal models highlighted in bold in Tab. 7 had their lowest MAPE values on both validation and test sets. Another interesting observation is that results in Tab. 7 suggest that forecasting COVID-19 mortality is more challenging than forecasting COVID-19 transmission: training COVID-19 mortality forecasting models required longer window sizes that span 6 or 7 days and MAPE scores for these models is worse than those for the COVID-19 transmission forecasting models.
5.5 Analysis of State-Level Predictions of the Best Performing Models
State-level predictions of the four best performing models highlighted in Tab. 7 are provided in Supplementary files 1–4. Fig. 4 shows sample test results for three states (AZ, UT, and CA) on predicting 7-day-ahead COVID-19 confirmed cases, where true and predicted trajectories are highlighted in blue and red, respectively. Based on this figure, we categorized the 51 states into one of three categories based on the relationship between true and predicted trajectories: i) over-estimated group, where at least 90% of the predictions are over-estimated; ii) under-estimated group, where at least 90% of the predictions are under-estimated; and iii) others.

Figure 4: Examples of (left) over-estimated predictions (middle) under-estimated predictions (right) other predictions
For the four classification tasks considered in this study, Fig. 5 shows the categorization of states into three groups such that states with over-estimated predictions are highlighted in red, states with under-estimated predictions are highlighted in yellow and the remaining states are highlighted in gray. Interestingly, the US states with shared borders were more likely to be assigned to the same category. An interesting exception is WA, which always appeared as an isolated state belonging to the over-estimated category.

Figure 5: US states with over-estimated (red), under-estimated (yellow), and others (gray) for the four prediction tasks: (A) Cases-7; (B) Cases-14; (C) Mortality-7; (D) Mortality-14
To get insights into when we should expect our best performing models to have over/under- estimated predictions, we examined the trajectories of the member states in the three groups for each of the four tasks. Fig. 6 represents the trajectories in each cluster using their pointwise mean curve. For COVID-19 cases prediction tasks, Cases-7 and Cases-14, we found that, during the test interval, states in the over-estimated groups had mean curves at the top of the entire data mean curve, while states in the ‘others’ group had a mean curve that is close to the whole data mean curve. Surprisingly, this observation did not apply to the COVID-19 death prediction tasks, Mortality-7 and Mortality-14.

Figure 6: Mean curve for: over-estimated (red); under-estimated (yellow); others (gray); and all (blue) US states. Vertical dotted line indicates the beginning of the test time series
Recent advances in machine learning based time series forecasting, particularly deep LSTM networks, enabled the development of complex non-linear deep architectures for modeling dynamics and long-term dependencies in real-world time series data. To date, several COVID-19 forecasting models have been developed using several variants of the LSTM architecture (e.g., [21,49–51]). However, the size of the test data in existing studies was relatively small because it equals the number of days in the test time interval. Fortunately, this is not the case in this study. Though our test data spans 45 days interval (from August 17th to end of September), the size of our test data was
Since the beginning of the COVID-19 pandemic in 2020, tracking and modeling its spread have gained considerable attention from health agencies. Therefore, it is not surprising that numerous computational methods for forecasting the transmission, mortality, and recovery of COVID-19 have been proposed in the literature. Among these methods, few methods incorporated other sources of relevant data such as Google trends [53,54], climate [55], and mobility [56] in their forecasting systems. To the best of our knowledge, our proposed models are the first models that use queries from the Google COVID-19 symptoms database [43] to improve their predictive performance on forecasting COVID-19 transmission and mortality.
It is worse noting that our results demonstrated the added value of using Google search trends for COVID-19 related symptoms (i.e., fever, pneumonia, shortness of breath, and hypoxia) combined with historical data in forecasting COVID-19 confirmed and death cases. However, despite their strong and significant correlations with COVID-19 spread and death trajectories reported in [41], we found that SLSTM models trained using any of these symptoms alone yielded models with poor performance. In addition to the improvement in predictive performance obtained via using Google symptoms time series along with the historical data in training our models, another significant gain is improving the generalizability of the models on both validation and test sets (i.e., the best performing model on the validation set is the model with the best performance on the test set).
Our analysis of state-level predictions demonstrated high variability in the observed performance across various US states. This observation suggests that the identified Google search trends, though leading to the optimal overall performance, might not be the best for some US states. To overcome this limitation, we are interested in developing state-specific models, which is the subject of our ongoing work.
We have developed deep learning models for forecasting COVID-19 infection and mortality in the US using historical data and Google search trends for COVID-19 related symptoms. Out of 422 symptoms included in the Google COVID-19 symptoms database [43], we have focused on the nine symptoms identified in [41] using dynamic correlation analysis. We then re-ranked these nine symptoms based on the performance of deep learning models trained using historical data and every single symptom. Finally, we used the top three symptoms to develop our final and best performing models. Our results suggest that Google search trends for the symptoms related to a target infectious disease could potentially improve the performance of the forecasting models for that disease. Our future work aims at: including more relevant time series data (e.g., mobility and climate) and assessing the improvement in performance for forecasting over longer intervals (e.g., 21 and 30 days); experimenting with other deep learning models for time series (e.g., Convolutional LSTM [57] and Bidirectional LSTM [47]); and developing state-specific forecasting models.
Funding Statement: This work is supported in part by the Deanship of Scientific Research at Jouf University under Grant No. (CV-28–41).
Conflicts of Interest: The authors declare that they have no conflicts of interest to report regarding the present study.
1. W. McKibbin and R. Fernando, “The economic impact of COVID-19,” Economics in the Time of COVID-19, vol. 45, pp. 45–51, 2020. [Google Scholar]
2. G. Marinoni, H. Van't and T. Jensen, “The impact of covid-19 on higher education around the world,” IAU Global Survey Report, pp. 1–50, 2020. [Google Scholar]
3. M. N. Ferrel and J. J. Ryan, “The impact of COVID-19 on medical education,” Cureus, vol. 12, no. 3, pp. 1–8, 2020. [Google Scholar]
4. E. M. Aucejo, J. French, M. P. U. Araya, and B. Zafar, “The impact of COVID-19 on student experiences and expectations: Evidence from a survey,” Journal of Public Economics, vol. 191, pp. 104271, 2020. [Google Scholar]
5. J. Xiong, O. Lipsitz, F. Nasri, L. M. W. Lui, H. Gill et al., “Impact of COVID-19 pandemic on mental health in the general population: A systematic review,” Journal of Affective Disorders, vol. 277, pp. 55–64, 2020. [Google Scholar]
6. D. M. Mann, J. Chen, R. Chunara, P. A. Testa and O. Nov, “COVID-19 transforms health care through telemedicine: Evidence from the field,” Journal of the American Medical Informatics Association, vol. 27, no. 7, pp. 1132–1135, 2020. [Google Scholar]
7. D. B. George, W. Taylor, J. Shaman, C. Rivers, B. Paul et al., “Technology to advance infectious disease forecasting for outbreak management,” Nature Communications, vol. 10, no. 1, pp. 1–4, 2019. [Google Scholar]
8. C. Buckee, “Improving epidemic surveillance and response: Big data is dead, long live big data,” The Lancet Digital Health, vol. 2, no. 5, pp. 1–3, 2020. [Google Scholar]
9. I. Rahimi, F. Chen and A. H. Gandomi, “A review on COVID-19 forecasting models,” Neural Computing and Applications, pp. 1–11, 2021. [Google Scholar]
10. J. P. Ioannidis, S. Cripps and M. A. Tanner, “Forecasting for COVID-19 has failed,” International Journal of Forecasting, pp. 1–46, 2020. [Online] Available: http://doi.org/10.1016/j.ijforecast.2020.08.004. [Google Scholar]
11. B. K. Nelson, “Time series analysis using autoregressive integrated moving average (ARIMA) models,” Academic Emergency Medicine, vol. 5, no. 7, pp. 739–744, 1998. [Google Scholar]
12. R. K. Singh, M. Rani, A. S. Bhagavathula, R. Sah, A. J. Rodriguez-Morales et al., “Prediction of the COVID-19 pandemic for the top 15 affected countries: Advanced autoregressive integrated moving average (ARIMA) model,” JMIR Public Health and Surveillance, vol. 6, no. 2, pp. 1–10, 2020. [Google Scholar]
13. S. Singh, K. S. Parmar, J. Kumar and S. J. S. Makkhan, “Development of new hybrid model of discrete wavelet decomposition and autoregressive integrated moving average (ARIMA) models in application to one month forecast the casualties cases of COVID-19,” Chaos, Solitons & Fractals, vol. 135, pp. 1–8, 2020. [Online] Available: http://doi.org/10.1016/j.chaos.2020.109866. [Google Scholar]
14. S. Roy, G. S. Bhunia and P. K. Shit, “Spatial prediction of COVID-19 epidemic using ARIMA techniques in India,” Modeling Earth Systems and Environment, vol. 7, pp. 1385–1391, 2020. [Google Scholar]
15. F. Petropoulos, S. Makridakis and N. Stylianou, “COVID-19: Forecasting confirmed cases and deaths with a simple time series model,” International Journal of Forecasting, vol. 20, pp. 1–32, 2020. [Online] Available: http://doi.org/10.1016/j.ijforecast.2020.11.010. [Google Scholar]
16. L. C. Brooks, D. C. Farrow, S. Hyun, R. J. Tibshirani and R. Rosenfeld, “Flexible modeling of epidemics with an empirical Bayes framework,” PLOS Computational Biology, vol. 11, no. 8, pp. 1–18, 2015. [Online] Available: http://doi.org/10.1371/journal.pcbi.1004382. [Google Scholar]
17. S. Kandula, T. Yamana, S. Pei, W. Yang, H. Morita et al., “Evaluation of mechanistic and statistical methods in forecasting influenza-like illness,” Journal of the Royal Society Interface, vol. 15, no. 144, pp. 1–12, 2018. [Online] Available: http://doi.org/10.1098/rsif.2018.0174. [Google Scholar]
18. M. Gatto, E. Bertuzzo, L. Mari, S. Miccoli, L. Carraro et al., “Spread and dynamics of the COVID-19 epidemic in Italy: Effects of emergency containment measures,” Proceedings of the National Academy of Sciences, vol. 117, no. 19, pp. 10484–10491, 2020. [Google Scholar]
19. G. Pandey, P. Chaudhary, R. Gupta and S. Pal, “SEIR and regression model based COVID-19 outbreak predictions in India,” Reprint Server for Health Sciences, arXiv: 200400958, 2020. [Google Scholar]
20. N. Picchiotti, M. Salvioli, E. Zanardini and F. Missale, “COVID-19 pandemic: A mobility-dependent SEIR model with undetected cases in Italy, Europe and US,” Reprint Server for Health Sciences, arXiv: 200508882, 2020. [Google Scholar]
21. B. Lim and S. Zohren, “Time-series forecasting with deep learning: A survey,” Philosophical Transactions of the Royal Society A, vol. 379, no. 2194, 2021. [Google Scholar]
22. R. G. da Silva, M. H. D. M. Ribeiro, V. C. Mariani and L. dos Santos Coelho, “Forecasting Brazilian and American COVID-19 cases based on artificial intelligence coupled with climatic exogenous variables,” Chaos, Solitons & Fractals, vol. 139, pp. 1–13, 2020. [Online] Available: http://doi.org/10.1016/j.chaos.2020.110027. [Google Scholar]
23. S. Ballı, “Data analysis of covid-19 pandemic and short-term cumulative case forecasting using machine learning time series methods,” Chaos, Solitons & Fractals, vol. 142, 2021. [Online] Available: http://doi.org/10.1016/j.chaos.2020.110512. [Google Scholar]
24. R. Majhi, R. Thangeda, R. P. Sugasi and N. Kumar, “Analysis and prediction of COVID-19 trajectory: A machine learning approach,” Journal of Public Affairs, pp. 1–8, 2020. [Online] Available: DOI http://doi.org/10.1002/pa.2537. [Google Scholar]
25. G. Pinter, I. Felde, A. Mosavi, P. Ghamisi and R. Gloaguen, “COVID-19 pandemic prediction for Hungary; a hybrid machine learning approach,” Mathematics, vol. 8, no. 6, pp. 1–20, 2020. [Google Scholar]
26. L. Medsker and L. C. Jain, “Recurrent Neural Networks: Design and Applications,” CRC press, 1999. [Google Scholar]
27. R. Pascanu, T. Mikolov and Y. Bengio, “On the difficulty of training recurrent neural networks,” in Int. Conf. on Machine Learning, PMLR, USA, pp. 1310–1318, 2013. [Google Scholar]
28. J. T. Connor, R. D. Martin and L. E. Atlas, “Recurrent neural networks and robust time series prediction,” IEEE Transactions on Neural Networks, vol. 5, no. 2, pp. 240–254, 1994. [Google Scholar]
29. Z. Che, S. Purushotham, K. Cho, D. Sontag and Y. Liu, “Recurrent neural networks for multivariate time series with missing values,” Scientific Reports, vol. 8, no. 1, pp. 1–12, 2018. [Google Scholar]
30. H. Hewamalage, C. Bergmeir and K. Bandara, “Recurrent neural networks for time series forecasting: Current status and future directions,” International Journal of Forecasting, vol. 37, no. 1, pp. 388–427, 2021. [Online] Available: http//:doi.org/10.1016/j.ijforecast.2020.06.008. [Google Scholar]
31. S. Hochreiter and J. Schmidhuber, “Long short-term memory,” Neural Computation, vol. 9, no. 8, pp. 1735–1780, 1997. [Google Scholar]
32. F. A. Gers, J. Schmidhuber and F. Cummins, “Learning to forget: continual prediction with LSTM,” in IEEE Int. Conf. on Artificial Neural Networks, UK, pp. 850–855, 1999. [Google Scholar]
33. K. Chen, Y. Zhou and F. Dai, “A LSTM-based method for stock returns prediction: a case study of China stock market,” in IEEE Int. Conf. on Big Data, USA, pp. 2823–2824, 2015. [Google Scholar]
34. F. Weninger, H. Erdogan, S. Watanabe, E. Vincent, J. Le Roux et al., “Speech enhancement with LSTM recurrent neural networks and its application to noise-robust ASR,” in Int. Conf. on Latent Variable Analysis and Signal Separation, UK, Springer, pp. 91–99, 2015. [Google Scholar]
35. Y. Wang, M. Huang, X. Zhu and L. Zhao, “Attention-based LSTM for aspect-level sentiment classification,” in Proc. of the 2016 Conf. on Empirical Methods in Natural Language Processing, pp. 606–615, 2016. [Google Scholar]
36. Z. Zhao, W. Chen, X. Wu, P. C. Chen and J. Liu, “LSTM network: A deep learning approach for short-term traffic forecast,” IET Intelligent Transport Systems, vol. 11, no. 2, pp. 68–75, 2017. [Google Scholar]
37. T. Ergen and S. S. Kozat, “Unsupervised anomaly detection with LSTM neural networks,” IEEE Transactions on Neural Networks and Learning Systems, vol. 31, no. 8, pp. 3127–3141, 2019. [Google Scholar]
38. W. Bao, J. Yue and Y. Rao, “A deep learning framework for financial time series using stacked autoencoders and long-short term memory,” PLOS One, vol. 12, no. 7, pp. 1–24, 2017. [Google Scholar]
39. Y. LeCun, Y. Bengio and G. Hinton, “Deep learning,” Nature, vol. 521, no. 7553, pp. 436–444, 2015. [Google Scholar]
40. L. Sun, Y. Wang, J. He, H. Li, D. Peng et al., “A stacked LSTM for atrial fibrillation prediction based on multivariate ECGs,” Health Information Science and Systems, vol. 8, no. 1, pp. 1–7, 2020. [Google Scholar]
41. M. Abbas, T. B. Morland, E. S. Hall and Y. El-Manzalawy, “Associations between google search trends for symptoms and COVID-19 confirmed and death cases in the United States,” International Journal of Environmental Research and Public Health, MDPI, vol. 18, pp. 1–24, 2021. [Google Scholar]
42. E. Dong, H. Du and L. Gardner, “An interactive web-based dashboard to track COVID-19 in real time,” the Lancet Infectious Diseases, vol. 20, no. 5, pp. 533–534, 2020. [Google Scholar]
43. S. Bavadekar, A. Dai, J. Davis, D. Desfontaines, I. Eckstein et al., “Google COVID-19 search trends symptoms dataset: Anonymization process description (version 1.0),” arXiv preprint, arXiv: 200901265, 2020. [Google Scholar]
44. J. O. Ramsey and B. W. Silverman, “Functional Data Analysis, 2nd ed., Springer, 2005. [Google Scholar]
45. Y. Hua, Z. Zhao, R. Li, X. Chen, Z. Liu et al., “Deep learning with long short-term memory for time series prediction,” IEEE Communications Magazine, vol. 57, no. 6, pp. 114–119, 2019. [Google Scholar]
46. Y. Yu, X. Si, C. Hu and J. Zhang, “A review of recurrent neural networks: LSTM cells and network architectures,” Neural Computation, vol. 31, no. 7, pp. 1235–1270, 2019. [Google Scholar]
47. Z. Cui, R. Ke, Z. Pu and Y. Wang, “Stacked bidirectional and unidirectional LSTM recurrent neural network for forecasting network-wide traffic state with missing values,” Transportation Research Part C: Emerging Technologies, vol. 118, pp. 1–14, 2020. [Online] Available: DOI http://doi.org/10.1016/j.trc.2020.102674. [Google Scholar]
48. L. Prechelt, “Early stopping-but when?,” Neural Networks: Tricks of the Trade, Springer, Germany, pp. 55–69, 1998. [Google Scholar]
49. I. Kırbaş, A. Sözen, A. D. Tuncer and F. S., Kazancıoğlu, “Comparative analysis and forecasting of COVID-19 cases in various european countries with ARIMA, NARNN and LSTM approaches,” Chaos, Solitons & Fractals, vol. 138, pp. 1–7, 2020. [Online] Available: http://doi.org/10.1016/j.chaos.2020.110015. [Google Scholar]
50. A. Zeroual, F. Harrou, A. Dairi and Y. Sun, “Deep learning methods for forecasting COVID-19 time-series data: A comparative study,” Chaos, Solitons & Fractals, vol. 140, pp. 1–12, 2020. [Online] Available: http://doi.org/10.1016/j.chaos.2020.110121. [Google Scholar]
51. F. Liu, J. Wang, J. Liu, Y. Li, D. Liu et al., “Predicting and analyzing the COVID-19 epidemic in China: Based on SEIRD, LSTM and GWR models,” PLOS One, vol. 15, no. 8, pp. 1–12, 2020. [Google Scholar]
52. S. J. Raudys and A. K. Jain, “Small sample size effects in statistical pattern recognition: Recommendations for practitioners,” IEEE Transactions on Pattern Analysis and Machine Intelligence, vol. 13, no. 3, pp. 252–264, 1991. [Google Scholar]
53. S. Prasanth, U. Singh, A. Kumar, V. A. Tikkiwal and P. H. Chong, “Forecasting spread of COVID-19 using google trends: A hybrid GWO-deep learning approach,” Chaos, Solitons & Fractals, vol. 142, pp. 1–22, 2021. [Online] Available: http://doi.org/10.1016/j.chaos.2020.110336. [Google Scholar]
54. A. Walker, C. Hopkins and P. Surda, “Use of google trends to investigate loss-of-smell-related searches during the COVID-19 outbreak,” International Forum of Allergy & Rhinology, Wiley Online Library, vol. 10, pp. 839–847, 2020. [Google Scholar]
55. M. Karimuzzaman, S. Afroz, M. M. Hossain and A. Rahman, “Forecasting the covid-19 pandemic with climate variables for top five burdening and three south asian countries,” Medrxiv, pp. 1–25, 2020. [Google Scholar]
56. P. Nouvellet, S. Bhatia, A. Cori, K. E. Ainslie, M. Baguelin et al., “Reduction in mobility and COVID-19 transmission,” Nature Communications, vol. 12, no. 1, pp. 1–9, 2021. [Google Scholar]
57. X. Shi, Z. Chen, H. Wang, D. Y. Yeung, W. K. Wong et al., “Convolutional LSTM network: A machine learning approach for precipitation nowcasting,” Advances in Neural Information Processing Systems, vol. 2, pp. 802–810, 2015. [Google Scholar]
 | This work is licensed under a Creative Commons Attribution 4.0 International License, which permits unrestricted use, distribution, and reproduction in any medium, provided the original work is properly cited. |