DOI:10.32604/cmc.2022.020914
| Computers, Materials & Continua DOI:10.32604/cmc.2022.020914 | |
| Article |
An Automated Deep Learning Based Muscular Dystrophy Detection and Classification Model
1School of Computer Science and Engineering, Vellore Institute of Technology, Vellore, 632014, India
2Department of Computer Science and Engineering, SRM TRP Engineering College, Tiruchirappalli, 621105, India
3Department of Electrical and Electronics Engineering, Sri Krishna College of Engineering and Technology, Coimbatore, 641008, India
4School of Computing, Kalasalingam Academy of Research and Education, Krishnankoil, 626128, India
5Department of Computer Science, King Khalid University, Muhayel Aseer, KSA
6Faculty of Computer and IT, Sana'a University, Yemen
7Department of Information Systems, College of Computer and Information Sciences, Princess Nourah Bint Abdulrahman University, Saudi Arabia
8Department of Computer and Self Development, Preparatory Year Deanship, Prince Sattam bin Abdulaziz University, Alkharj, Saudi Arabia
*Corresponding Author: Fahd N. Al-Wesabi. Email: falwesabi@kku.edu.sa
Received: 14 June 2021; Accepted: 15 July 2021
Abstract: Muscular Dystrophy (MD) is a group of inherited muscular diseases that are commonly diagnosed with the help of techniques such as muscle biopsy, clinical presentation, and Muscle Magnetic Resonance Imaging (MRI). Among these techniques, Muscle MRI recommends the diagnosis of muscular dystrophy through identification of the patterns that exist in muscle fatty replacement. But the patterns overlap among various diseases whereas there is a lack of knowledge prevalent with regards to disease-specific patterns. Therefore, artificial intelligence techniques can be used in the diagnosis of muscular dystrophies, which enables us to analyze, learn, and predict for the future. In this scenario, the current research article presents an automated muscular dystrophy detection and classification model using Synergic Deep Learning (SDL) method with extreme Gradient Boosting (XGBoost), called SDL-XGBoost. SDL-XGBoost model has been proposed to act as an automated deep learning (DL) model that examines the muscle MRI data and diagnose muscular dystrophies. SDL-XGBoost model employs Kapur's entropy based Region of Interest (RoI) for detection purposes. Besides, SDL-based feature extraction process is applied to derive a useful set of feature vectors. Finally, XGBoost model is employed as a classification approach to determine proper class labels for muscle MRI data. The researcher conducted extensive set of simulations to showcase the superior performance of SDL-XGBoost model. The obtained experimental values highlighted the supremacy of SDL-XGBoost model over other methods in terms of high accuracy being 96.18% and 94.25% classification performance upon DMD and BMD respectively. Therefore, SDL-XGBoost model can help physicians in the diagnosis of muscular dystrophies by identifying the patterns of muscle fatty replacement in muscle MRI.
Keywords: Muscle magnetic resonance imaging; XGBoost; synergic deep learning; roI detection; kapur's entropy; muscular dystrophies
In 1954, Walton and Nattrass defined Muscular Dystrophy (MD) as a heterogeneous set of primary genetic diseases that impact muscles and is medically characterized by advanced muscular weakness and waste. Psychologically, this group of diseases is united by the occurrence of necrotic and regenerative processes that are frequently related to an increasing number of connective and adipose tissues [1]. Among MD diseases, the current study concentrates on dystrophinopathies, Emery-Dreifuss muscular dystrophies, congenital muscular dystrophies, limb-girdle muscular dystrophies, and facioscapulohumeral MD. The heterogeneity of distinct disorders is commonly described through the integration of medical, genetic, molecular, and pathological features.
Dystrophinopathies, an X-linked advanced genetic degenerative disease, occurs as a result of deficiency or absence of dystrophin, a sarcolemmal protein. This disease primarily affects the skeletal muscles. Dystrophin and the proteins related to the family form a complex yet essential architecture that works with intracellular actin cytoskeleton to extra-cellular matrix. This association strengthens the sarcolemma from mechanical stress during muscle contraction. It is coded by a very huge chromosome that contains over 2.5 million base pairs and 79 exons. Dystrophin may experience an out-of-the-frame mutation and result in Duchenne Muscular Dystrophy (DMD) while an in-frame mutation may result in milder allelic structure, named as Becker Muscular Dystrophy (BMD). The large scale removal in both DMD and BMD is the most commonly studied mutation type. Fig. 1 shows the dystrophinopathies diagnostic technique [2].
DMD, the commonly recorded MD, occurs in a frequency of 1 out of 5000 male children across the globe. The symptoms are typically identified within two years of childbirth by identifying an obvious delay in motor growth. Muscle participation is frequently symmetrical and bilateral. Though similar dystrophin chromosomes undergo mutation, the medical characteristics of BMD differ significantly from DMD in terms of phenotype to no-weak subjective. The onset of disease is experienced at later stages. Calf hypertrophy and muscle cramp are often cited as primary diagnostic features for dystrophinopathies. In such case, multiplex Polymerase Chain Reaction (PCR) should be used for diagnosis [2].
With advantaged presentation of Medical Magnetic Resonance Imaging (MMRI) in radiographic sciences, the researchers have noticed the capability of MRI to generate high-resolution anatomical images of skeletal muscle. In comparison with previous imaging modes, MRI shows a great difference in between several soft tissue forms. Thus the physicians can investigate separate muscles in sharp difference to adapt fat. In the recent years, muscle MRI has attained extensive medical usage in inflammatory myopathies. This has become possible after the introduction of novel immunosuppressive agent that can precisely diagnose and monitor the responses of human body to the treatment. The capability of MRI to differentiate acute inflammation from chronic fatty replacement in muscle offers a significant predictive data [3]. Initially, inherited testing was used since it was progressively accessible and inexpensive. Further, it also provided extremely specific diagnostic data, an impossible achievement in muscle imaging. Various studies compared the features of muscle MRI and existing investigation techniques and clarified the former's advantages. Some of the features in MRI can create an impact upon clinical decision making too. In spite of these constraints, there is a rising attention upon imaging technique (especially MRI) to investigate genetic muscle diseases [4,5]. The initial trial, conducted in these disease populations, has emphasized the applicability of this study results for muscle dystrophy only [6]. The purpose of noninvasive measure, which is recurrent for numerous times, is only to enhance the quality of trials conducted for this disease.
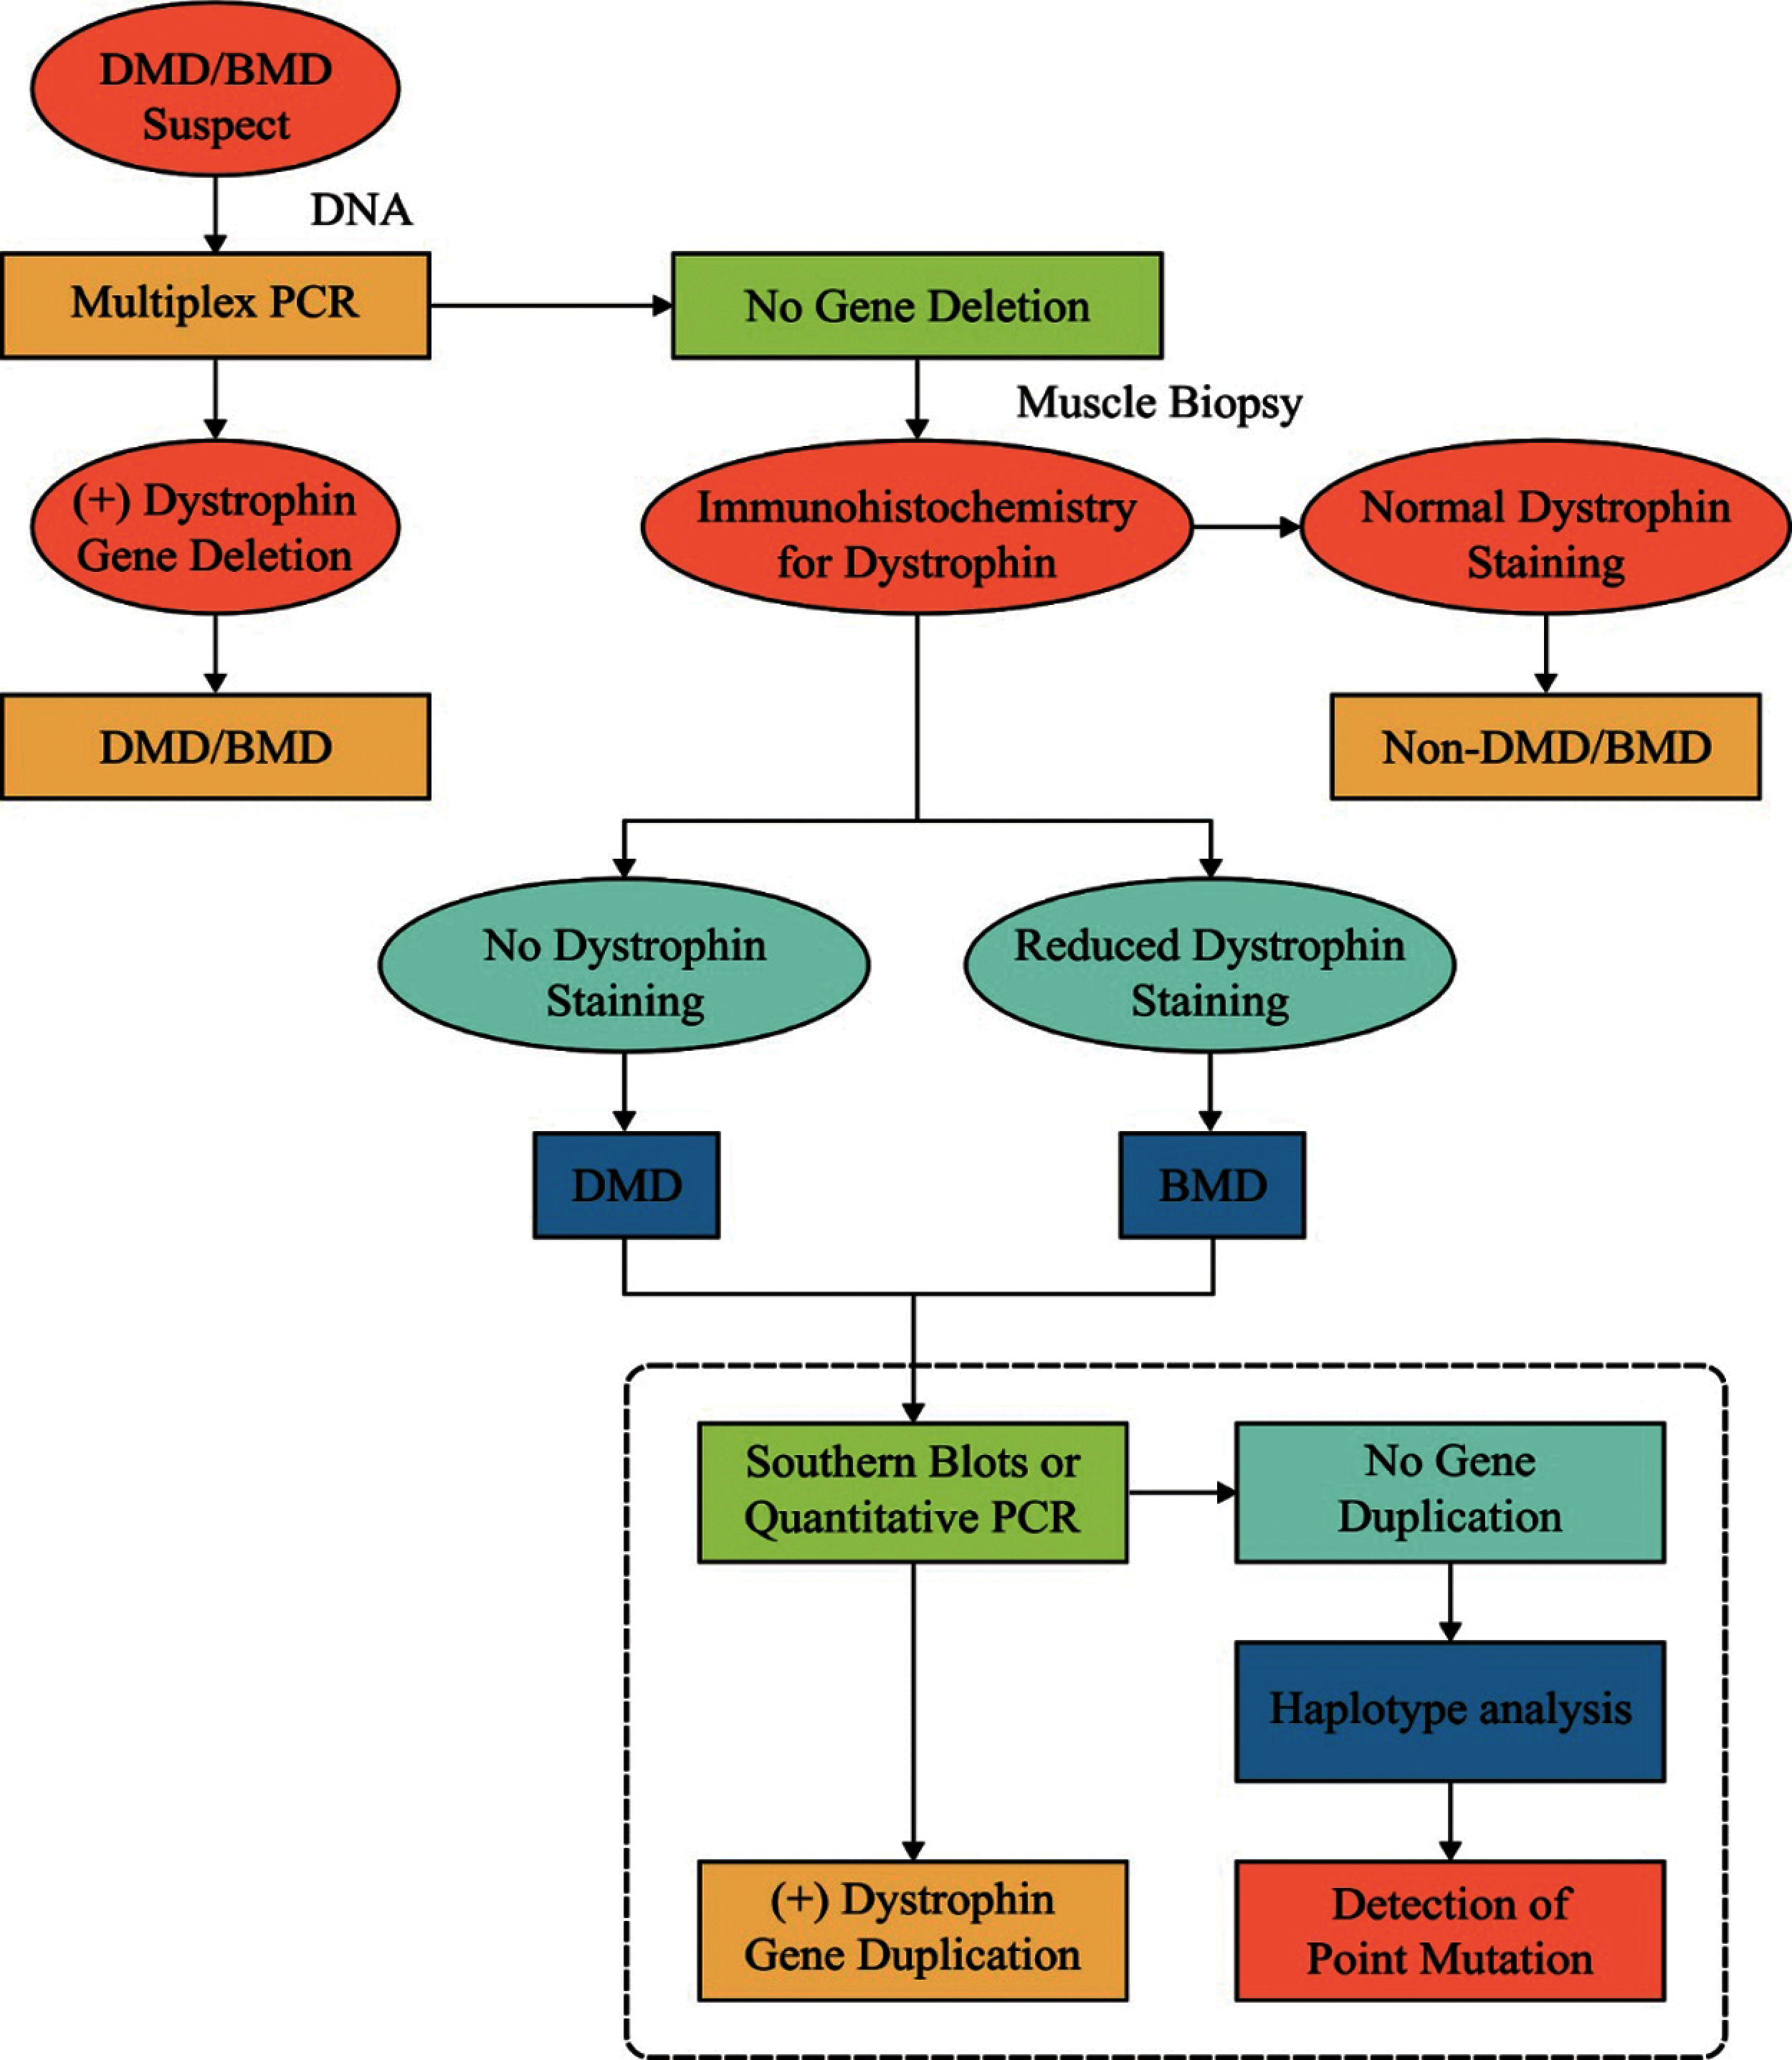
Figure 1: Diagnosis of dystrophinopathies
Muscle MRI recognizes the feature patterns usually observed in muscle participation and are associated with particular disorders [7]. But, majority of these patterns overlap in nature and high grade of specialty is required in MRI information to distinguish one disease from another. Artificial Intelligence (AI) technique has been applied successfully in most of the problem-solving techniques followed in healthcare domain [8]. Machine Learning (ML) utilizes techniques to examine information, learn and create a decision or forecast the future [9]. The study conducted earlier used ML approach upon a massive dataset of muscle MRIs which were taken from persons inherently confirmed with the diagnosis of MD. The goal of that study was to establish an information method that helps in the diagnostic procedure of these disorders.
The current research article presents an automated muscular dystrophy detection and classification model using Synergic Deep Learning (SDL) with extreme Gradient Boosting (XGBoost), called SDL-XGBoost. The aim of the proposed SDL-XGBoost model is to act as an automated Deep Learning (DL) model that examines muscle MRI data and diagnose the muscular dystrophies. In addition, the proposed SDL-XGBoost model employs Kapur's entropy-based Region of Interest (RoI) detection. Besides, SDL-based feature extraction process is applied to derive a useful set of feature vectors. Finally, XGBoost model is employed as a classification approach to determine proper class labels for muscle MRI data. The novelty of the current study lies in the design of SDL-XGBoost model proposed for diagnosing muscular dystrophies. A comprehensive experimental analysis was performed to showcase the superior performance of SDL-XGBoost model. The results were examined under different aspects. The contributions of the paper are summarized herewith.
• An automated muscular dystrophy detection and classification model i.e., SDL-XGBoost model is proposed.
• Kapur's entropy-based RoI detection and SDL based feature extraction processes are designed.
• XGBoost model is employed as a classification approach to determine proper class labels for muscle MRI data
Remaining sections of the article are organized as follows. Section 2 offers an overview of deep learning and the existing works. Section 3 introduces the proposed SDL-XGBoost model and the experimental results are discussed in Section 4. At last, Section 5 concludes the work.
2 Background Information and Literature Review
The current section briefs the basic concepts in DL models, existing works related to dystrophinopathy diagnosis and summarizes the existing works conducted so far in this domain.
In general, ML techniques undergo training to perform helpful tasks based on manual stimulation. This training process occurs through feature extraction from raw information or through feature learning by additional simply ML techniques. In DL techniques, the system learns the beneficial representation and automate the features from raw information, bypassing manual and problematic phases. DL techniques are gradually being applied in the improvement of medical practices while the healthcare industry is inclining towards technology on a gradual manner. In clinical imaging process, convolutional neural networks (CNN) generates the attention towards DL [10]. This is done in a helpful and influential manner to study the representation of images and additional integrated information. Earlier, effective utilization of CNN is probable since this feature is usually designed by hand or made by least powerful ML techniques. When it became probable to utilize feature learning from the information, several handmade image features were left out and it turned out to be almost a worthless method, related to feature detectors, as established by CNN [11].
CNN is utilized to enhance the efficiency in radiology practices via protocol determination based on short text classifiers [12]. CNN is applied to decrease gadolinium dosage and, in parallel enhance the brain MRI through an arrangement of greatness [13] with no substantial decline in image quality. DL is employed in radiotherapy [14] through the integration of confocal laser endomicroscopy for automated recognition of intra-operative CLE images [15]. One more significant application of CNNs is the advanced deformable image registration that allows measurable investigation over distinct physical imaging modals and time. For instance, elastic registration is used between 3D MRI and transrectal ultra-sound to direct the target prostate biopsy [16]. Deformable registration is applied for brain MRI if “cue-aware deep regression network” studies are provided with a group of trained images. Here, the displacement vectors are related to a pair of reference subject patches. The brain MR image pairs are quickly registered for deformable image through patch-wise forecasting of Large Deformation Diffeomorphic Metric Mapping technique. Without supervision, CNN-dependent technique is used for deformable image registration of cone beam CT to utilize a deep convolution inverse graphic networks [17].
2.2 Prior Works on Muscular Dystrophies Diagnosis
Díaz et al. [18] proposed an automated model that identifies muscle MRI pattern and its application upon the diagnoses of MD was studied earlier. Random Forest (RF) ML approach was utilized in this study to find a technique that can differentiate the distinct disorders. RF is an ML technique which can fit in huge datasets and can perform both classifiers and regression processes. Most of the constraints in ML approaches, like RF, are complex enough to decode. Yang et al. [19] included CNN and MRI imaging processes and proposed a method for testing as well as authenticating the consistency of dystrophinopathy diagnosis in muscle MRI. In ROI, every actual MRI image uses the Otsu threshold and adjective window technique.
2.3 Problem Identification/Summary of the Reviewed Works
MD can be particularly diagnosed based on specific signs and symptoms observed from medical records, physical investigation, and/or muscle biopsy, while the latter is further processed by geneticists through Sanger sequencing method. Recently, numerous muscle participation patterns are labeled for recognition and assistance for diagnostic procedures. But, it has been established that MRI-dependent diagnostic measures, projected for disease diagnosis, are not helpful always in regular healthcare setting, where MRI is examined by doctors. So, the researcher determines that a DL technique will be useful in recognizing the feature patterns that can guides the physicians towards genetic testing. This technique is created to differentiate the disorders with high accuracy over human specialists in the domain. These methods assist better in MD diagnostic procedure. Further, it provides a possible way for further genetic testing or strengthening the existing pathology to find the attained mutation. Researchers consider this as a proof of idea in which AI is employed in the domain of muscle MRI.
3 The Proposed Muscular Dystrophy Diagnosis and Classification Model
The presented SDL-XGBoost model utilizes the muscle MRI patterns to identify the presence of Muscular dystrophy as illustrated in Fig. 2. The proposed SDL-XGBoost method involves three major processes such as RoI detection, feature selection, and classification. At the initial stage, Kapur's thresholding is applied to determine the regions of interest. Next, SDL model is employed to derive a useful set of feature vectors. Finally, XGBoost model is utilized to allocate appropriate class labels for muscle MRI data.
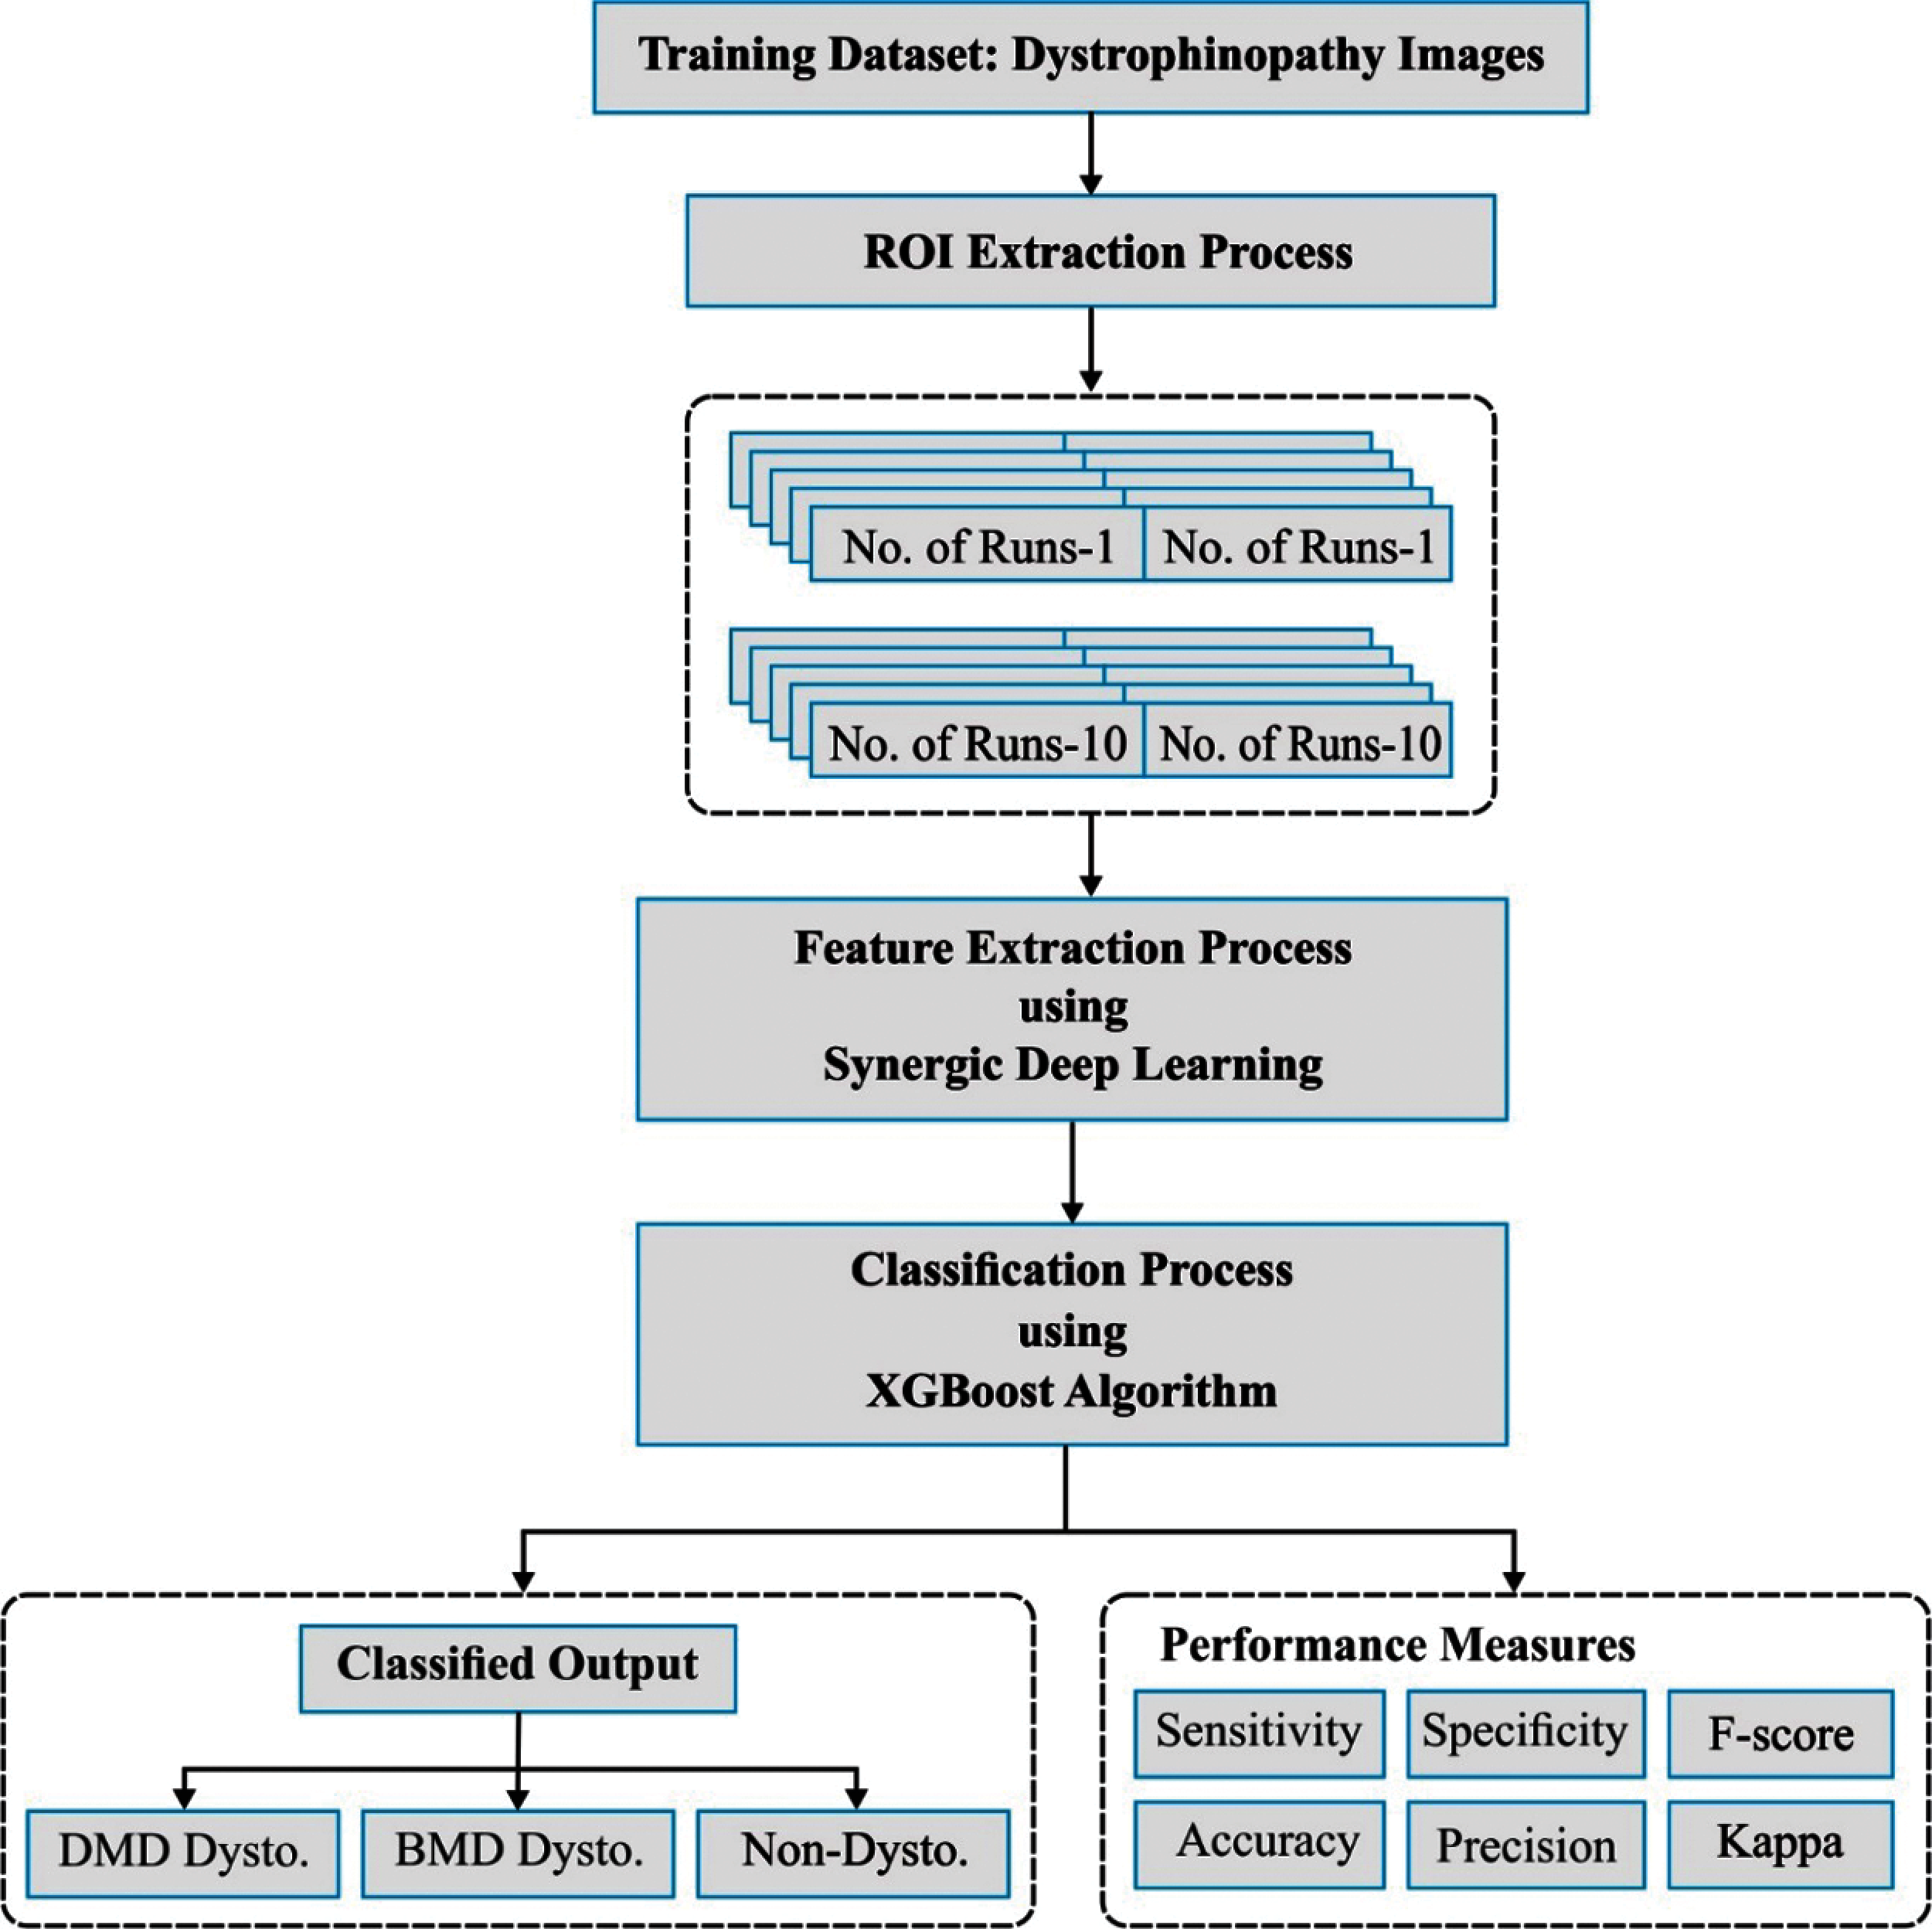
Figure 2: The working process of SDL-XGBoost model
3.1 Region of Interest Detection
Kapur [20] presented another thresholding approach which was utilized to find the best threshold for image segmentation. This method deploys entropy followed by probability distribution of the image histogram. This technique is custom-made to find an optimum
Let entropy
In Eq. (2),
where
Now, the probability occurrence
3.2 SDL Based Feature Extraction
The presented SDL technique, represented by
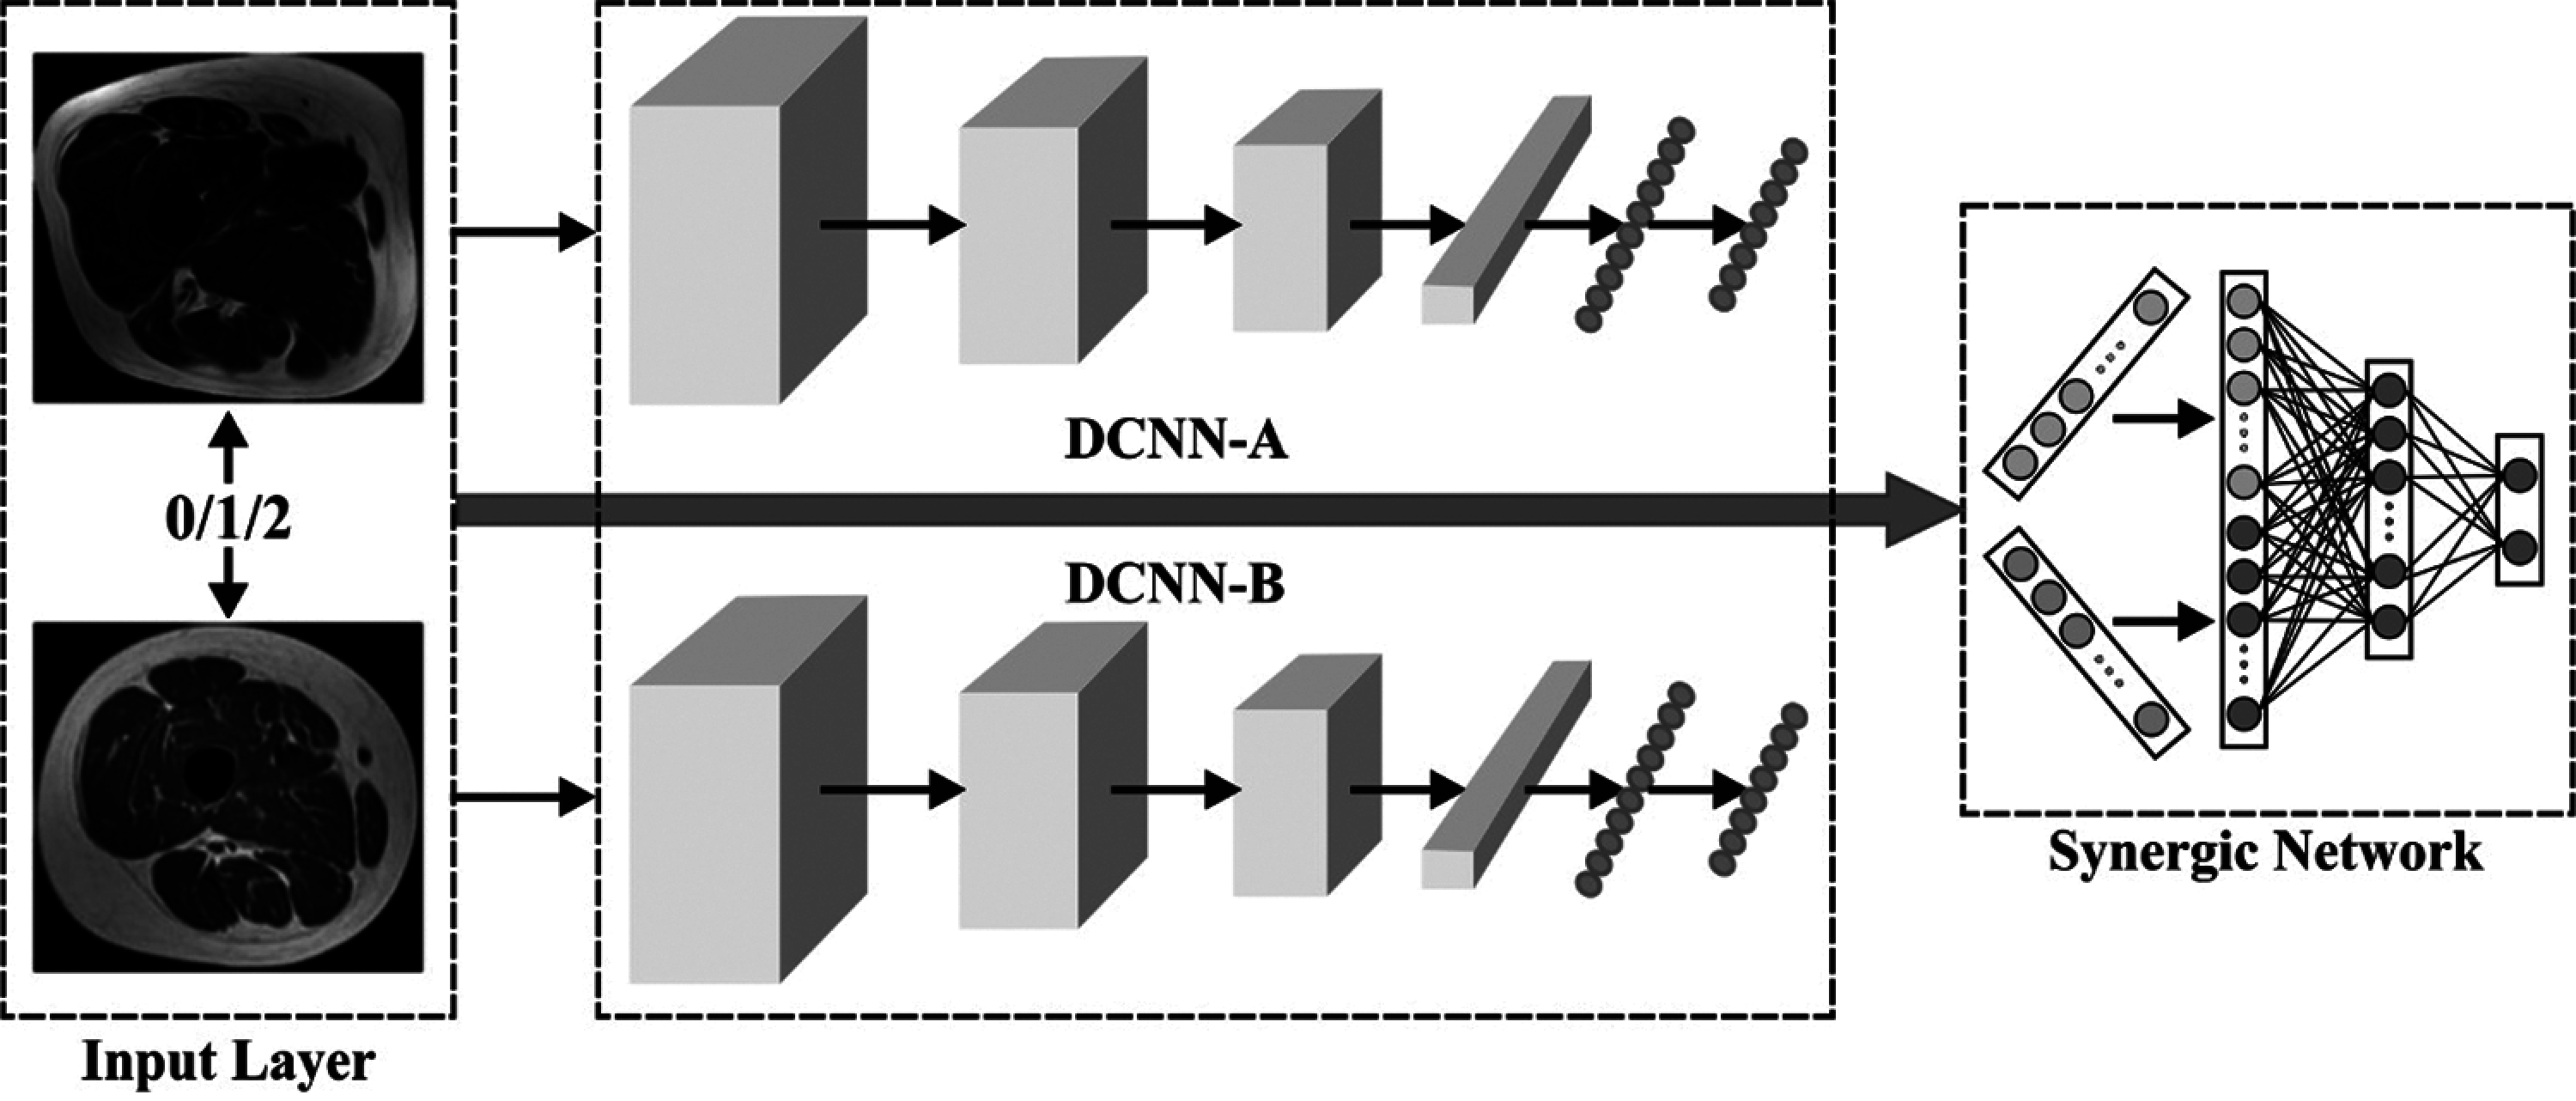
Figure 3: Architecture of SDL method
In comparison with conventional DCNN, the presented
The popular remaining network [23] possesses robust illustration capability due to which the researcher uses 50 pre-trained layers of residual NN (ResNet-50) in the beginning of all DCNN modules represented by DCNN-i
where K denotes the number of classes,
In addition, the trained modules of every DCNN are supervised by synergic label of all the pairs of images. The researcher implemented a synergic network that contains embedded layers, whole connected learning and output layers. Here, a pair of images
Next, both the images are concatenated as
To prevent the imbalanced data problem, the proportion of interclass image pairs in all the batches are maintained in the range of 45%–55%. It is comfortable to observe the synergic signal via additional sigmoid layers and utilize the subsequent binary cross-entropy loss which are defined herewith.
where
The presented
where
and
When employing the trained
3.3 XGBoost Based Classification
XGBoost is a supervised EL technique that simulates a generalization gradient boosting technique. A regulation term is involved in this technique to produce accuracy through multicore and distributed settings for classifiers, regression and ranking task [25]. The specific dataset comprises of n instances and
where
where l denotes the differentiable convex loss function that measures the variance between prediction
Eq. (14) involves parametric function for the elements that could not be optimized practically with the help of classical optimization technique in Euclidean space. Since the technique underwent additional training, the objective function is declared for present iteration t based on the forecast during former iteration
When dependent loss function in Taylor expansion i.e., Eq. (15), for 1st and 2nd order gradients, attain subsequent simplification, the objective function is then given by,
where
A DT forecasts a constant value over a leaf. Next, a tree
where
In suitable structure tree, the objective function is minimalized to
When substituting the formula by Eq. (17), the objective function to find the optimum tree structure is given herewith.
This equation is utilized in the practice to assess the splitting applicants in XGBoost. In order to find the optimum split, precise greedy technique and global and local (repropose applicants next every splits) variant approximation techniques are run for every possible splitting of the entire feature. This process is carried out by processing every splitting applicant in early stage, and similar split procedure is used to find the split on every leaf [26]. While this technique needs lower applicants over global technique, the outcome of global technique is precisely the local approach that provides sufficient applicants. In distributed tree learn approach, all the present approximations are utilized through the estimation of gradient statistics or quantile technique. XGBoost effectively assists in precise greedy technique for a single machine group or local and global variant approximation technique to entire sceneries [27].
In XGBoost by DART booster,
Let D and
Let
The current section validates the results of analysis of the proposed SDL-XGBoost model on the classification of DMD and BMD using muscle MRI images. The presented SDL-XGBoost model was simulated in Python 3.6.5 tool. A detailed comparative study was also conducted with recent state-of- the-art methods in terms of accuracy, sensitivity, and specificity.
Tab. 1 and Fig. 4 shows the results of analysis of the proposed SDL-XGBoost model on the classification of DMD vs. other diseases under distinct runs. The experimental values denote that SDL-XGBoost method showcased better results in comparison with other methods. For instance, on execution run-1, the presented SDL-XGBoost technique achieved an effective performance with an accuracy of 93.45%, precision of 80.52%, sensitivity of 95.38%, specificity of 92.86%, F-score of 87.32%, and kappa of 0.1706. Simultaneously, during execution run-3, the proposed SDL-XGBoost technique reached an efficient performance with an accuracy of 95.27%, precision of 84.67%, sensitivity of 97.69%, specificity of 94.52%, F-score of 90.71%, and kappa of 0.1779. Besides, during the execution run-5, the presented SDL-XGBoost approach attained an effective performance with an accuracy of 96%, precision of 86.49%, sensitivity of 98.46%, specificity of 95.24%, F-score of 92.09%, and kappa of 0.1806. Likewise, during execution run-7, the projected SDL-XGBoost methodology obtained superlative performance with an accuracy of 96.91%, precision of 89.51, sensitivity of 98.46%, specificity of 96.43%, F-score of 93.77%, and kappa of 0.1825. Moreover, during execution run-9, the presented SDL-XGBoost technique accomplished an excellent performance with its accuracy being 97.64% and a precision of 91.49%, sensitivity of 99.23%, specificity of 97.14%, F-score of 95.20%, and kappa of 0.1852. At last, the presented SDL-XGBoost model classified DMD and other diseases with a maximum accuracy of 96.18%, precision of 87.60%, sensitivity of 97.92%, specificity of 95.64%, F-score of 92.44%, and kappa of 0.1800.
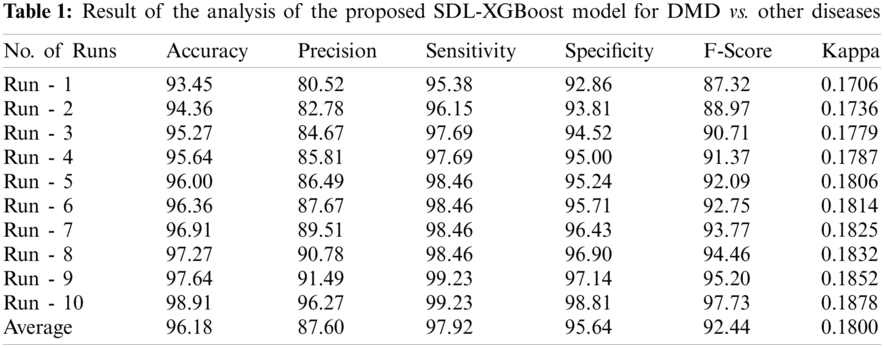
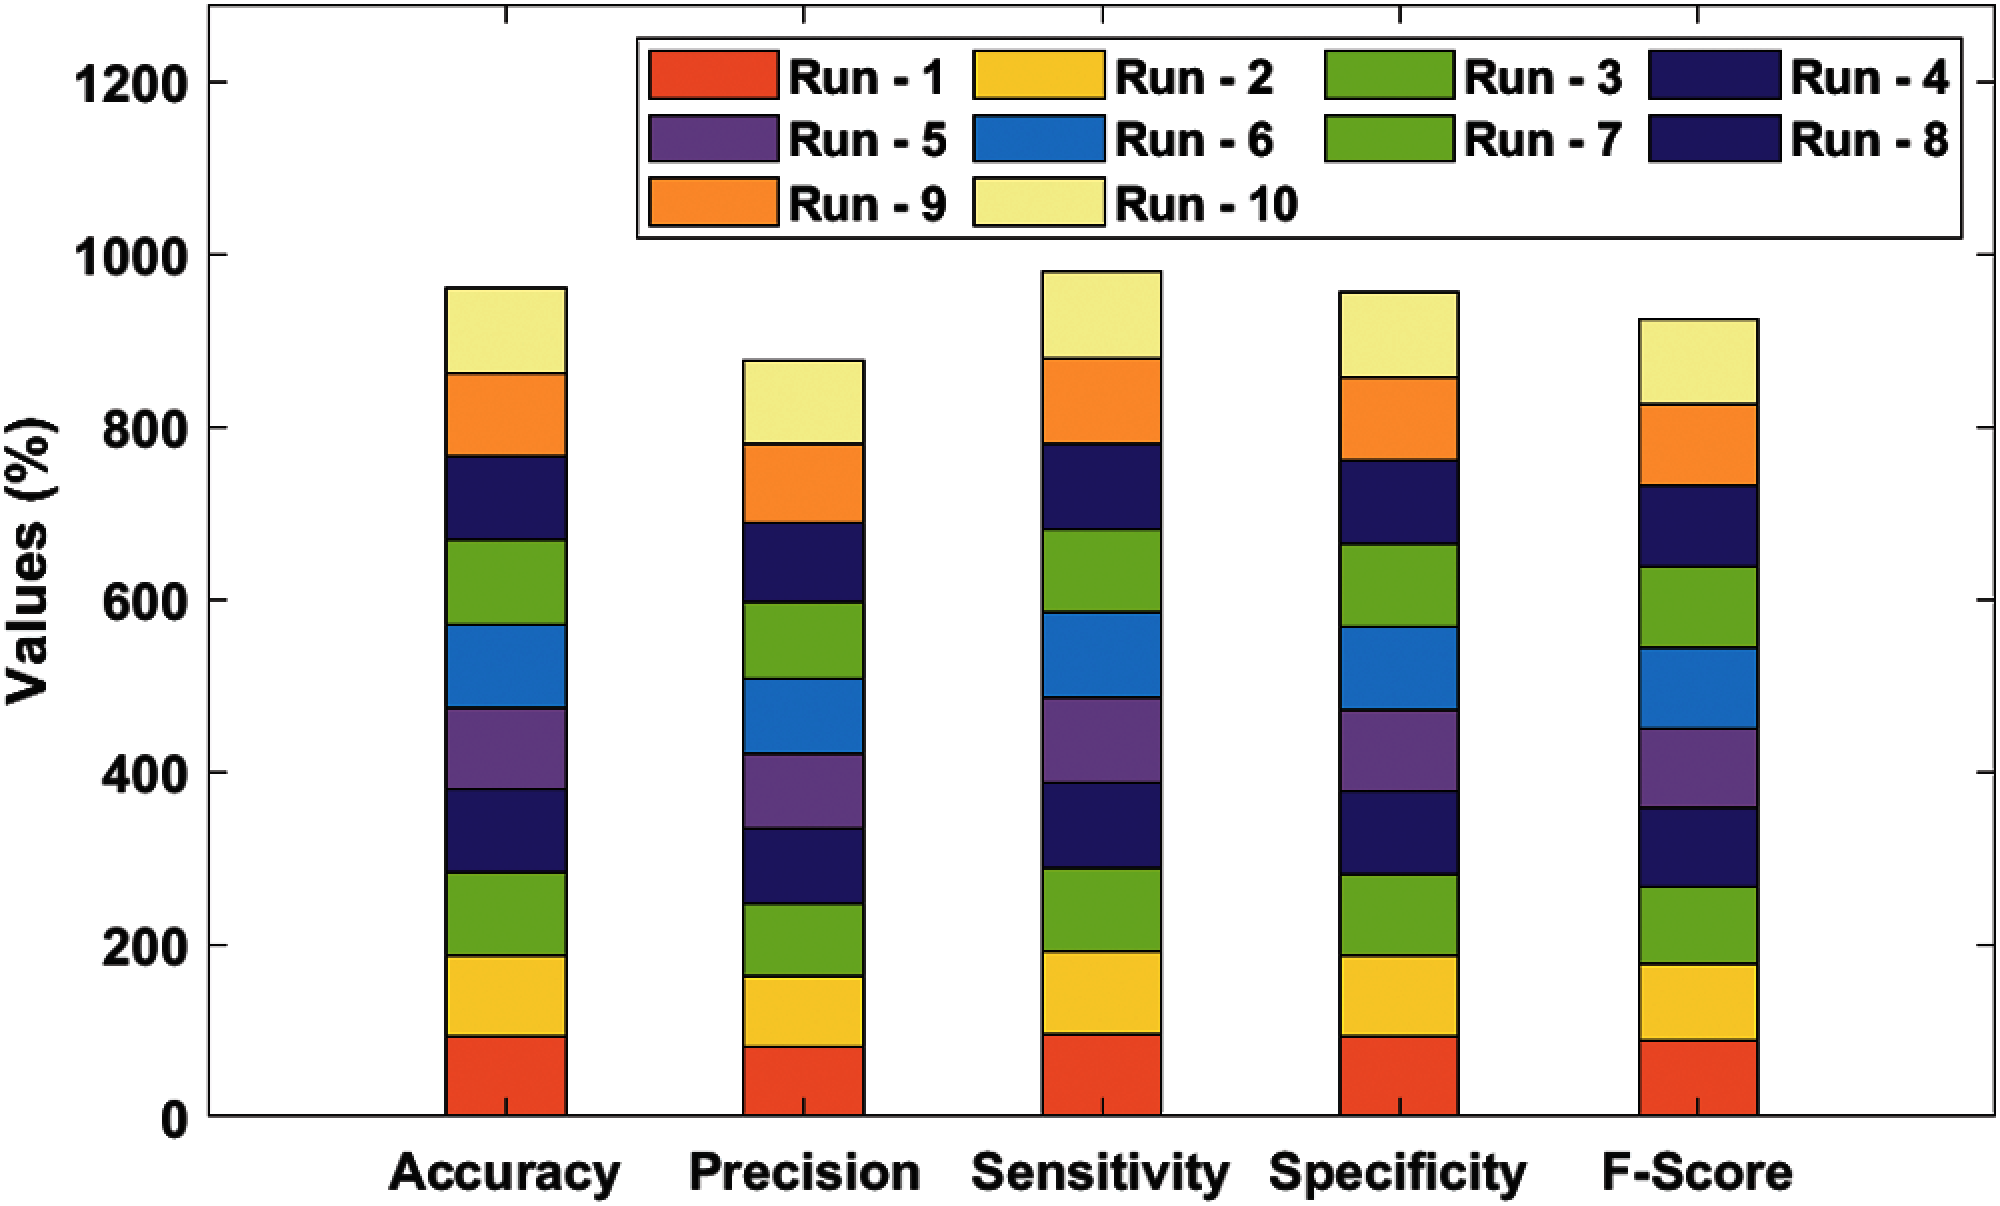
Figure 4: Result analysis of SDL-XGBoost model for DMD
Tab. 2 and Fig. 5 portrays the results of analysis for the proposed SDL-XGBoost technique on the classification of BMD vs. other diseases under different runs. The experimental values inferred that SDL-XGBoost method demonstrated optimal outcomes over other techniques compared in this study. For sample, during execution run-1, the proposed SDL-XGBoost method attained an effective performance with an accuracy of 90.73%, precision of 71.55%, sensitivity of 84.69%, specificity of 92.14%, F-score of 77.57%, and kappa of 0.1231. Likewise, during execution run-3, the projected SDL-XGBoost model reached an excellent performance with an accuracy of 92.47%, precision of 75.65%, sensitivity of 88.78%, specificity of 93.33%, F-score of 81.69%, and kappa of 0.1315. Also, under execution run-5, the presented SDL-XGBoost manner accomplished superlative performance with an accuracy of 93.24%, precision of 77.88%, sensitivity of 89.8%, specificity of 94.52%, F-score of 84.21%, and kappa of 0.1348. Similarly, during execution run-7, the presented SDL-XGBoost model gained superior performance with an accuracy of 94.98%, precision of 82.73, sensitivity of 92.86%, specificity of 95.48%, F-score of 87.5%, and kappa of 0.1412. Moreover, during the execution run-9, the proposed SDL-XGBoost methodology performed effectively with an accuracy of 96.91%, precision of 88.68%, sensitivity of 95.92%, specificity of 97.14%, F-score of 92.16%, and kappa of 0.1485.
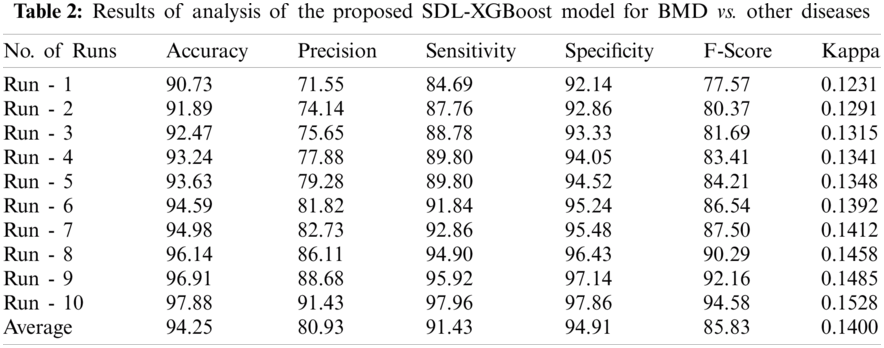
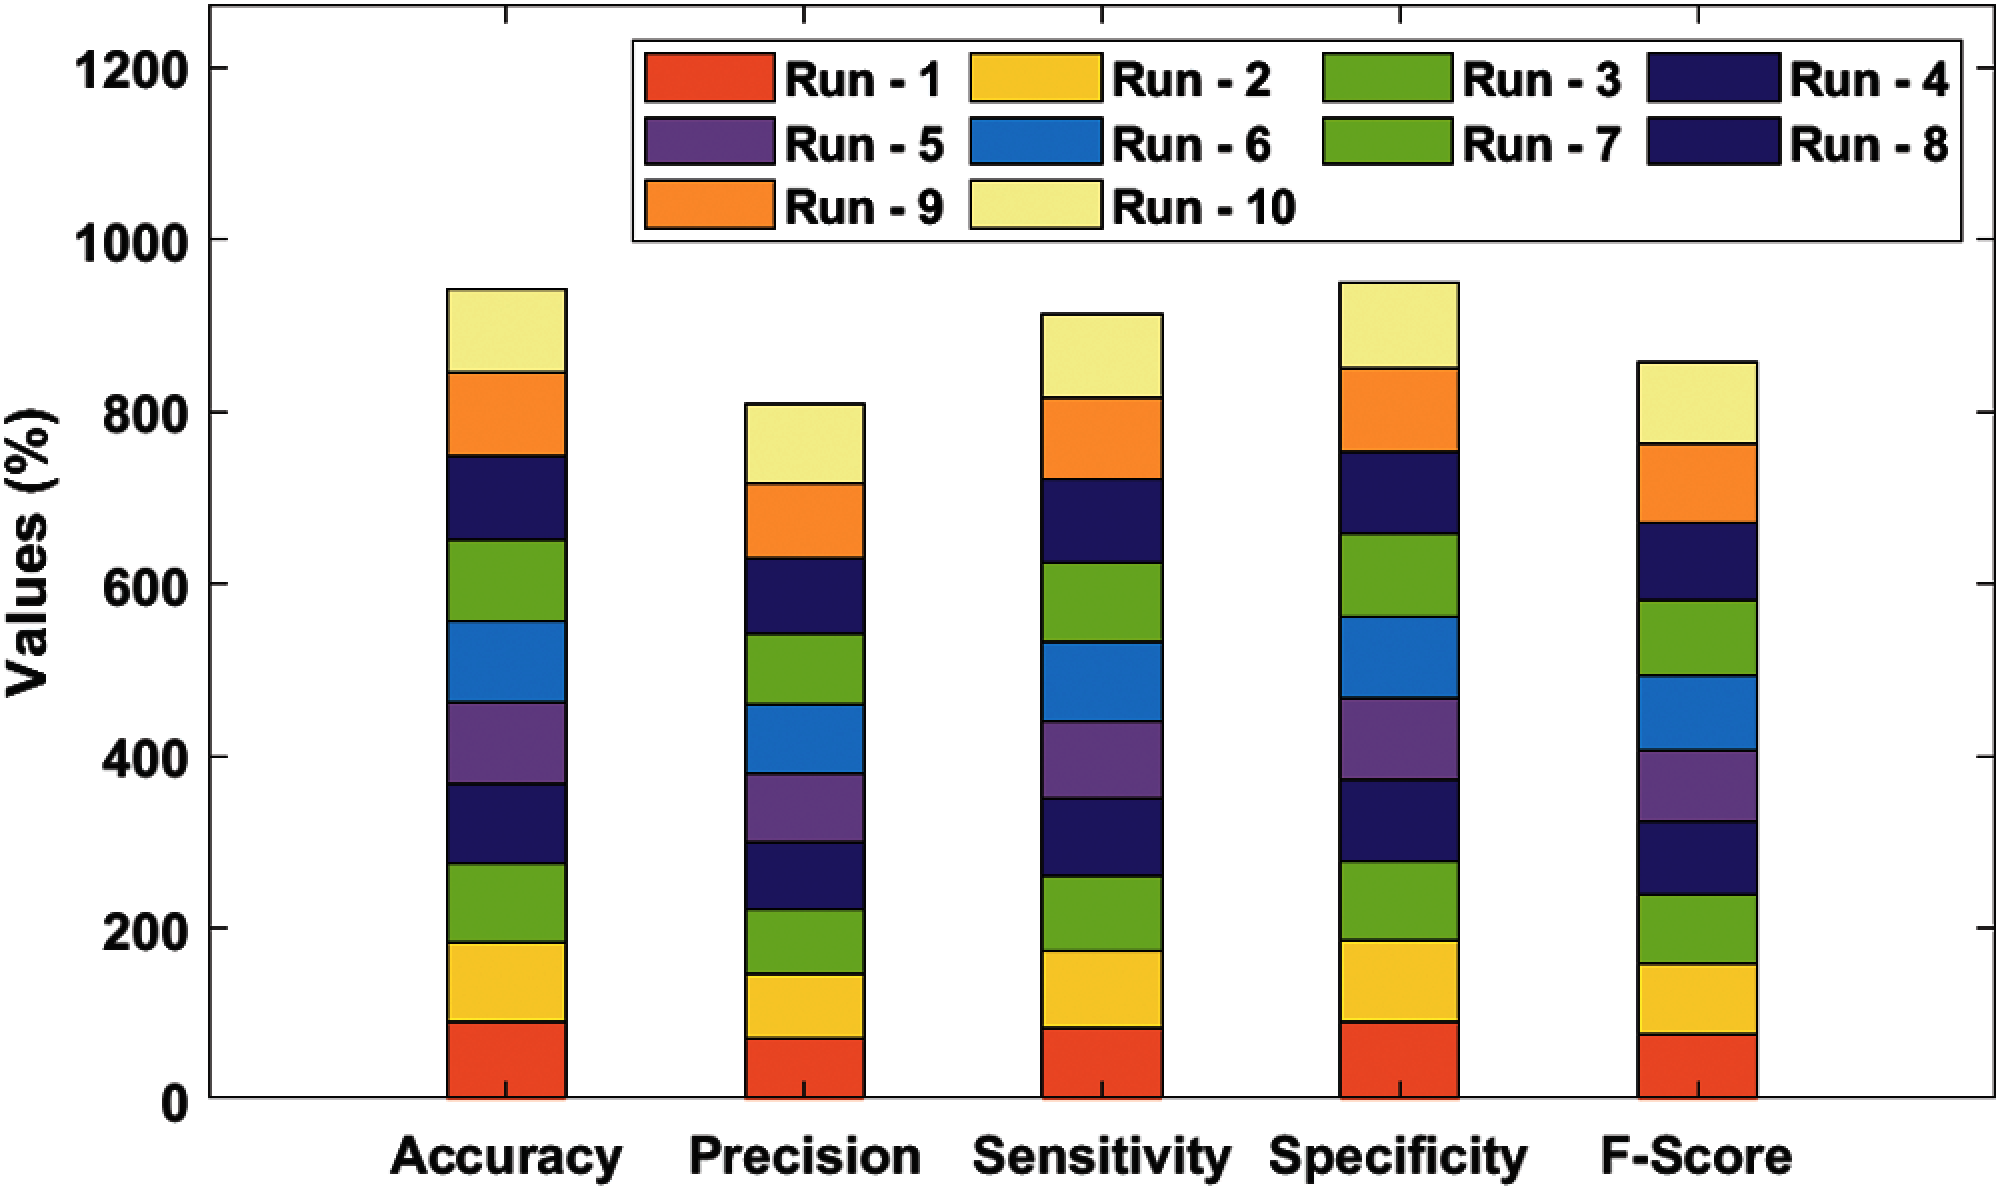
Figure 5: Result analysis of SDL-XGBoost model for BMD
Finally, the proposed SDL-XGBoost technique classified BMD vs. other diseases and attained a superior accuracy of 94.25%, precision of 80.93%, sensitivity of 91.43%, specificity of 94.91%, F-score of 85.83%, and kappa of 0.1400.
To further validate the supremacy of the presented SDL-XGBoost model, a detailed comparative analysis was conducted and the results were compared in terms of three distinct measures as given in Tab. 3 and Fig. 6.
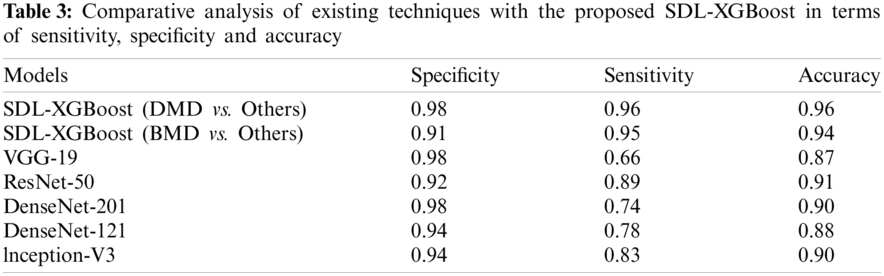
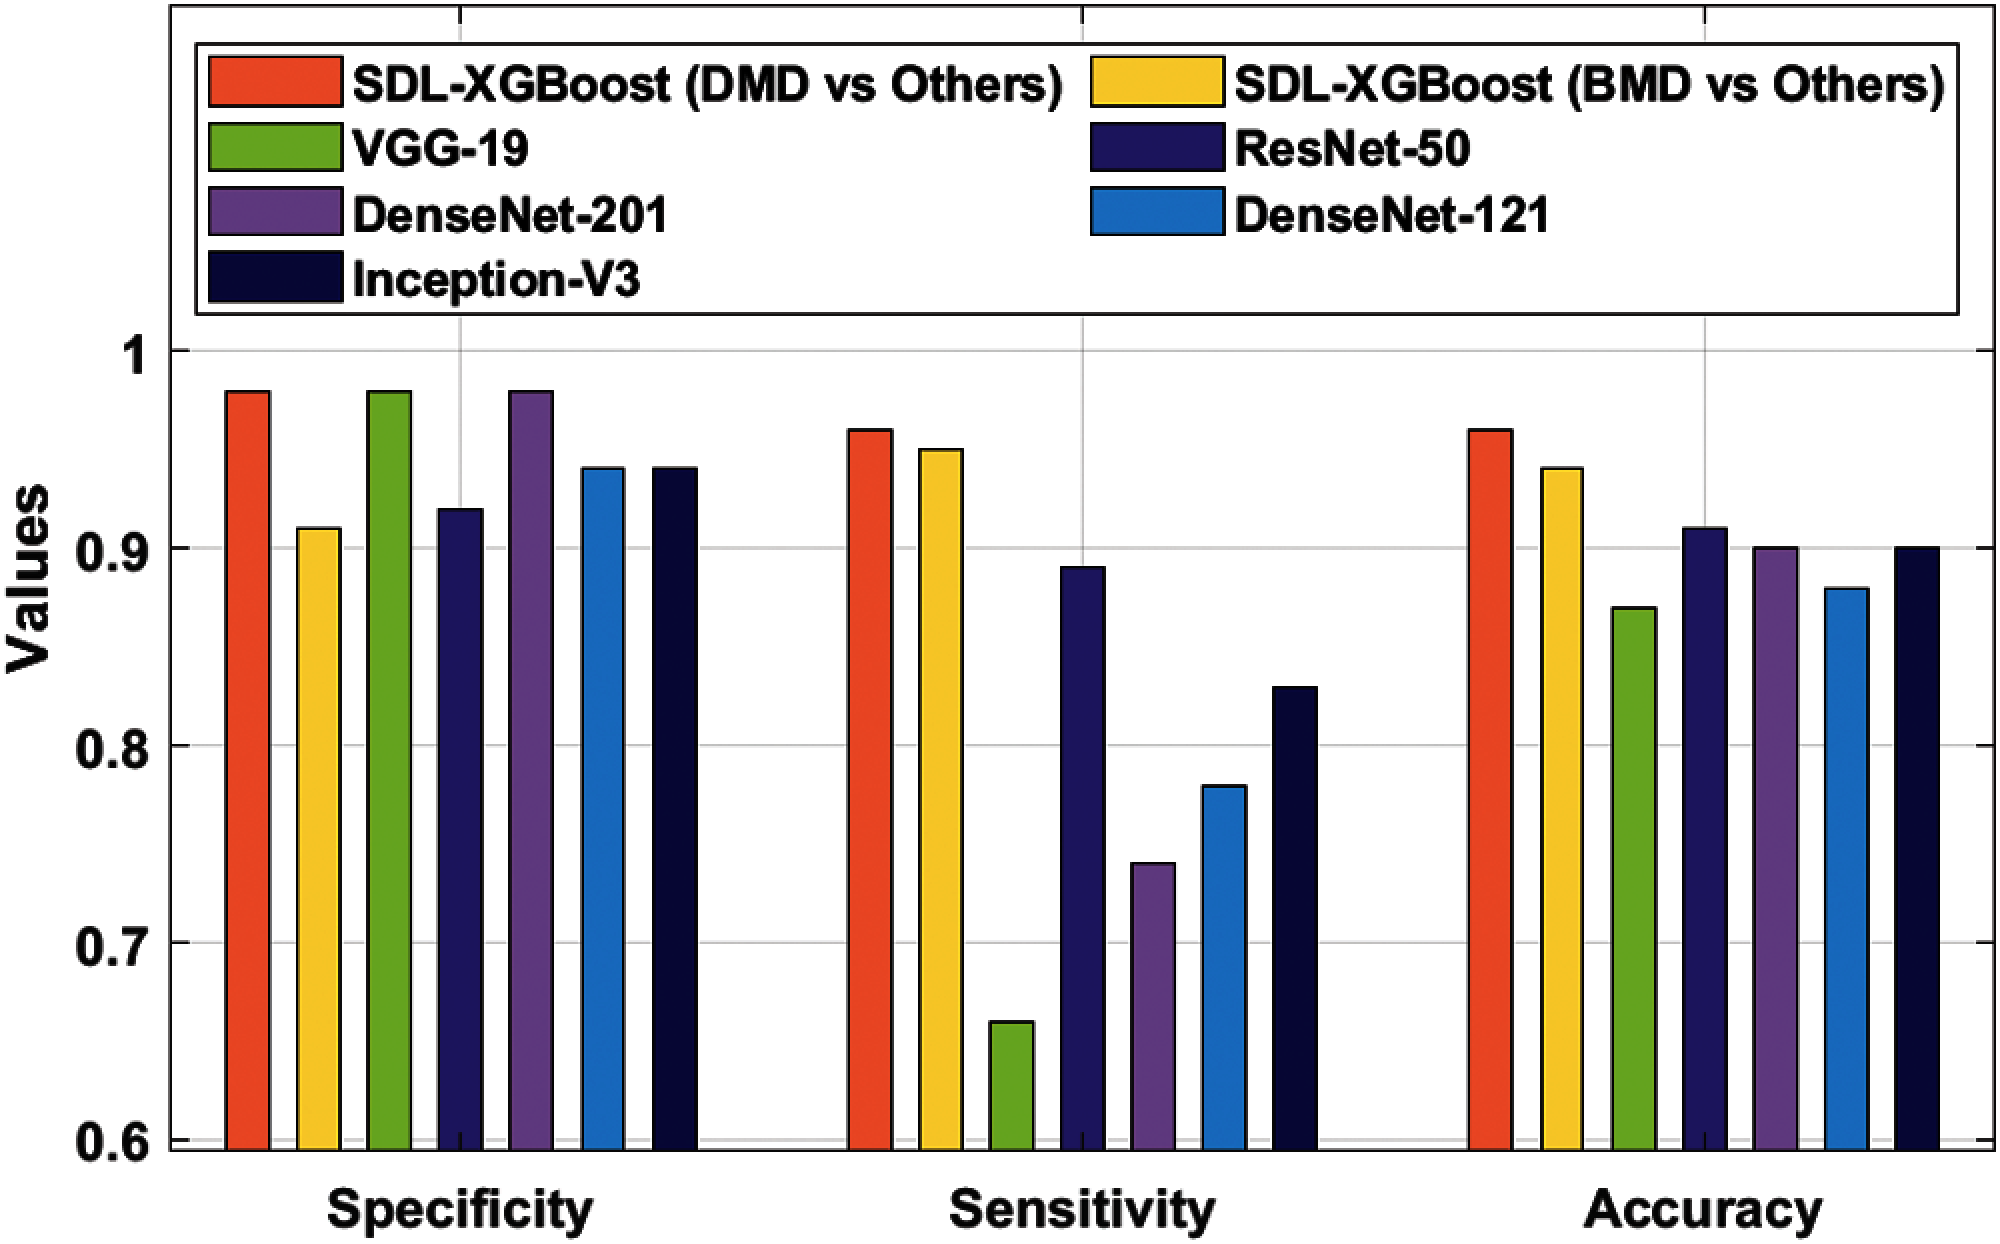
Figure 6: Comparative analysis of SDL-XGBoost model
The experimental values depict that VGG-19 model produced insignificant outcome with a sensitivity of 0.98, specificity of 0.66, and accuracy of 0.87. At the same time, the DenseNet-121 model accomplished a slightly enhanced classification result with a sensitivity of 0.94, specificity of 0.78, and accuracy of 0.88. Followed by, the Inception v3 model attained a certain increase in the outcome in terms of sensitivity 0.94, specificity 0.83, and accuracy 0.90. Moreover, the DesnseNet-201 model offered a moderate performance with a sensitivity of 0.98, specificity of 0.74, and accuracy of 0.90. Furthermore, the ResNet-50 model showcased moderate outcomes with a sensitivity of 0.92, specificity of 0.89, and accuracy of 0.91. But the presented SDL-XGBoost model produced enhanced outcomes by classifying BMD with a sensitivity of 0.91, specificity of 0.95, and accuracy of 0.94. At last, the SDL-XGBoost model has classified the DMD with a sensitivity of 0.98, specificity of 0.96, and accuracy of 0.96.
The current research article developed an automated muscular dystrophy detection and classification model using SDL-XGBoost. The presented SDL-XGBoost model makes use of muscle MRI patterns to identify the presence of muscular dystrophy. The proposed SDL-XGBoost model involves three major processes such as RoI detection, feature selection, and classification. Primarily, Kapur's thresholding is applied to determine the regions of interest. Afterwards, SDL model is employed to derive a set of useful feature vectors. Finally, XGBoost model is utilized in the allocation of appropriate class labels for muscle MRI data. A comprehensive experimental analysis was conducted to showcase the superior performance of the proposed SDL-XGBoost model. The results were examined under different aspects which inferred the supremacy of the proposed model. So, SDL-XGBoost model has been proved experimentally and can assist physicians in diagnosing muscular dystrophies through muscle fatty replacement patterns in muscle MRI. In future, the detection rate of muscular dystrophies can be improved with the help of learning rate schedulers.
Acknowledgement: The authors extend their appreciation to the Deanship of Scientific Research at King Khalid University for funding this work under grant number (RGP1/147/42), Received by Fahd N. Al-Wesabi. https://www.kku.edu.sa. This research was funded by the Deanship of Scientific Research at Princess Nourah bint Abdulrahman University through the Fast-track Research Funding Program.
Funding Statement: The authors received no funding for this study.
Conflicts of Interest: The authors declare that they have no conflicts of interest to report regarding the present study.
1. D. G. Leung, “Magnetic resonance imaging patterns of muscle involvement in genetic muscle diseases: A systematic review,” Journal of Neurology, vol. 264, no. 7, pp. 1320–1333, Jul. 2017. [Google Scholar]
2. A. E. Emery, “The muscular dystrophies,” The Lancet, vol. 359, no. 9307, pp. 687–695, 2002. [Google Scholar]
3. F. Del Grande, J. A. Carrino, M. Del Grande, A. L. Mammen and L. C. Stine, “Magnetic resonance imaging of inflammatory myopathies,” Topics in Magnetic Resonance Imaging, vol. 22, no. 2, pp. 39–43, 2011. [Google Scholar]
4. E. Mercuri, A. Pichiecchio, J. Allsop, S. Messina, M. Pane et al., “Muscle MRI in inherited neuromuscular disorders: Past, present, and future,” Journal of Magnetic Resonance Imaging, vol. 25, no. 2, pp. 433–440, 2007. [Google Scholar]
5. M. P. Wattjes, R. A. Kley and D. Fischer, “Neuromuscular imaging in inherited muscle diseases,” European Radiology, vol. 20, no. 10, pp. 2447–2460, 2010. [Google Scholar]
6. R. Tawil, G. W. Padberg, D. W. Shaw, S. M. v. d. Maarel, S. J. Tapscott et al., “Clinical trial preparedness in facioscapulo-humeral muscular dystrophy: Clinical, tissue, and imaging outcome measures 29–30 May 2015, Rochester, New York,” Neuromuscul Disord, vol. 26, no. 2, pp. 181–186, 2016. [Google Scholar]
7. J. D. Manera, J. Llauger, E. Gallardo and I. Illa, “Muscle MRI in muscular dystrophies,” Acta Myologica, vol. 34, no. 2–3, pp. 95–108, 2015. [Google Scholar]
8. A. Rajkomar, J. Dean and I. Kohane, “Machine learning in medicine,” The New England Journal of Medicine, vol. 380, pp. 1347–1358, 2019. [Google Scholar]
9. Z. Obermeyer and T. H. Lee, “Lost in thought — the limits of the human mind and the future of medicine,” The New England Journal of Medicine, vol. 377, no. 13, pp. 1209–1211, 2017. [Google Scholar]
10. Y. Lecun, L. Bottou, Y. Bengio and P. Haffner, “Gradient-based learning applied to document recognition,” in Proc. IEEE, vol. 86, no. 11, pp. 2278–2324, 1998. [Google Scholar]
11. D. Ravi, C. Wong, F. Deligianni, M. Berthelot, J. Andreu-Perez et al., “Deep learning for health informatics,” IEEE Journal of Biomedical and Health Informatics, vol. 21, no. 1, pp. 4–21, 2017. [Google Scholar]
12. Y. H. Lee, “Efficiency improvement in a busy radiology practice: Determination of musculoskeletal magnetic resonance imaging protocol using deep-learning convolutional neural networks,” Journal of Digital Imaging, vol. 31, no. 5, pp. 604–610, 2018. [Google Scholar]
13. E. Gong, J. M. Pauly, M. Wintermark and G. Zaharchuk, “Deep learning enables reduced gadolinium dose for contrast-enhanced brain MRI: Deep learning reduces gadolinium dose,” Journal of Magnetic Resonance Imaging, vol. 48, no. 2, pp. 330–340, 2018. [Google Scholar]
14. P. Meyer, V. Noblet, C. Mazzara and A. Lallement, “Survey on deep learning for radiotherapy,” Computers in Biology and Medicine, vol. 98, pp. 126–46, 2018. [Google Scholar]
15. M. Izadyyazdanabadi, E. Belykh, M. A. Mooney, J. M. Eschbacher, P. Nakaji et al., “Prospects for theranostics in neurosurgical imaging: Empowering confocal laser endomicroscopy diagnostics via deep learning,” Frontiers in Oncology, vol. 8, pp. 240, 2018. [Google Scholar]
16. G. Haskins, J. Kruecker, U. Kruger, S. Xu, P. A. Pinto et al., “Learning deep similarity metric for 3D MR–TRUS image registration,” International Journal of Computer Assisted Radiology and Surgery, vol. 14, no. 3, pp. 417–425, 2019. [Google Scholar]
17. V. Kearney, S. Haaf, A. Sudhyadhom, G. Valdes and T. D. Solberg, “An unsupervised convolutional neural network-based algorithm for deformable image registration,” Physics in Medicine and Biology, vol. 63, no. 18, pp. 185017, 2018. [Google Scholar]
18. J. V. Díaz, J. A. Pérez, C. N. Peralta, G. Tasca, J. Vissing et al., “Accuracy of a machine learning muscle MRI-based tool for the diagnosis of muscular dystrophies,” Neurology, vol. 94, no. 10, pp. e1094–e1102, 2020. [Google Scholar]
19. M. Yang, Y. Zheng, Z. Xie, Z. Wang, J. Xiao et al., “A deep learning model for diagnosing dystrophinopathies on thigh muscle MRI images,” BMC Neurology, vol. 21, no. 1, pp. 13, 2021. [Google Scholar]
20. J. N. Kapur, P. K. Sahoo and A. K. C. Wong, “A new method for gray-level picture thresholding using the entropy of the histogram,” Computer Vision, Graphics, and Image Processing, vol. 29, no. 3, pp. 273–285, 1985. [Google Scholar]
21. E. H. Houssein, B. E. Helmy, D. Oliva, A. A. Elngar and H. Shaban, “A novel black widow optimization algorithm for multilevel thresholding image segmentation,” Expert Systems with Applications, vol. 167, pp. 114159, 2021. [Google Scholar]
22. J. Zhang, Y. Xie, Q. Wu and Y. Xia, “Medical image classification using synergic deep learning,” Medical Image Analysis, vol. 54, pp. 10–19, 2019. [Google Scholar]
23. K. He, X. Zhang, S. Ren and J. Sun, “Deep residual learning for image recognition,” in 2016 IEEE Conf. on Computer Vision and Pattern Recognition (CVPRLas Vegas, NV, USA, pp. 770–778, 2016. [Google Scholar]
24. K. Shankar, A. R. W. Sait, D. Gupta, S. K. Lakshmanaprabu, A. Khanna et al., “Automated detection and classification of fundus diabetic retinopathy images using synergic deep learning model,” Pattern Recognition Letters, vol. 133, pp. 210–216, 2020. [Google Scholar]
25. T. Chen and C. Guestrin, “XGBoost: A scalable tree boosting system,” in Proc. of the 22nd ACM SIGKDD Int. Conf. on Knowledge Discovery and Data Mining, San Francisco California USA, pp. 785–794, 2016. [Google Scholar]
26. Preprint: H. Zhang, S. Si and C. J. Hsieh, “GPU-Acceleration for large-scale tree boosting,” arXiv 2017, arXiv:1706.08359, 2017. [Google Scholar]
27. T. Chen, T. He, M. Benesty, V. Khotilovich, Y. Tang et al., “Xgboost: Extreme gradient boosting. R package version 0.4–2,” Technical Report, vol. 1, no. 4, pp. 1–3, 2015. [Google Scholar]
28. A. Samat, E. Li, W. Wang, S. Liu, C. Lin et al., “Meta-XGBoost for hyperspectral image classification using extended mser-guided morphological profiles,” Remote Sensing, vol. 12, no. 12, pp. 1973, 2020. [Google Scholar]
 | This work is licensed under a Creative Commons Attribution 4.0 International License, which permits unrestricted use, distribution, and reproduction in any medium, provided the original work is properly cited. |