DOI:10.32604/cmc.2022.021154
| Computers, Materials & Continua DOI:10.32604/cmc.2022.021154 | |
| Article |
Convolutional Neural Network-Based Identity Recognition Using ECG at Different Water Temperatures During Bathing
Biomedical Information Engineering Laboratory, Graduate School of Computer Science and Engineering, University of Aizu, Aizu-Wakamatsu, 965-8580, Japan
*Corresponding Author: Wenxi Chen. Email: wenxi@u-aizu.ac.jp
Received: 25 June 2021; Accepted: 13 August 2021
Abstract: This study proposes a convolutional neural network (CNN)-based identity recognition scheme using electrocardiogram (ECG) at different water temperatures (WTs) during bathing, aiming to explore the impact of ECG length on the recognition rate. ECG data was collected using non-contact electrodes at five different WTs during bathing. Ten young student subjects (seven men and three women) participated in data collection. Three ECG recordings were collected at each preset bathtub WT for each subject. Each recording is 18 min long, with a sampling rate of 200 Hz. In total, 150 ECG recordings and 150 WT recordings were collected. The R peaks were detected based on the processed ECG (baseline wandering eliminated, 50-Hz hum removed, ECG smoothing and ECG normalization) and the QRS complex waves were segmented. These segmented waves were then transformed into binary images, which served as the datasets. For each subject, the training, validation, and test data were taken from the first, second, and third ECG recordings, respectively. The number of training and validation images was 84297 and 83734, respectively. In the test stage, the preliminary classification results were obtained using the trained CNN model, and the finer classification results were determined using the majority vote method based on the preliminary results. The validation rate was 98.71%. The recognition rates were 95.00% and 98.00% when the number of test heartbeats was 7 and 17, respectively, for each subject.
Keywords: Electrocardiogram; QRS; recognition rate; water temperatures; convolutional neural network; majority vote
With improvements in living standards, people have started to pay more attention to personal hygiene and health in daily life, and bathing has become increasingly popular. However, the number of drowning accidents while bathing has increased in recent years, with survey data showing more than 5,398 such accidents in Japan in 2018 [1]. Victims of fatal drowning accidents tend to die in the bathtub because they cannot be rescued in time. Also, some survivors suffer long-term psychological effects following the physical trauma because they fail to receive timely and appropriate treatment. If a bather's identity could be recognized, then their personal information could be sent immediately to the nearest emergency services, allowing for timely response and rescue. Traditional biometrics mainly include fingerprint, iris, face, voice, etc. However, all such biometrics rely on special equipment such as a scanner, camera, voice recorder, and so on. Moreover, as the bathroom is a private and humid environment, it is not suitable to install such equipment there. This study thus proposes a new identity recognition scheme using electrocardiogram (ECG) at different water temperatures (WTs) during bathing.
As an emerging biometric modality, ECG has seen about 20 years of academic development since Biel et al. [2] firstly proposed it as a new approach in human identification in 2001. ECG is a recording of electrical potential activities of the heart, and differs in all people owing to distinctions in anatomy, size, and position of the heart, sex, age, body weight, chest configuration, health conditions, and various other factors. It has three main characteristics. Firstly, it has universality–it exists in all living creatures. Secondly, it has distinguishability–there are no two identical ECGs in the world. Thirdly, it has invisibility–it is extremely difficult to forge. Therefore, many previous studies took ECG as a validated identity recognition tool and achieved the desired effect.
Traditional ECG collection mainly consists of attaching electrodes to the skin surface of the body. However, this method can cause many inconveniences to people during data collection. Kwatra et al. [3] thus firstly proposed collecting ECG signals using non-contact electrodes during bathing in 1986. Following this, an increasing number of studies explored bathtub ECG [4–9]. Many previous studies explored this relationship. For example, Yen et al. [10] designed a portable, real-time, smartphone-based ECG recognition system and achieved a high accuracy of 98.34% in identifying seven heartbeat types, with only 78 ms needed for identification. Since machine learning and deep learning have powerful recognition and classification functions [11,12], in recent years, many studies have applied them to ECG-related research. For example, Kim et al. [13] proposed a 1-D ensemble network to perform user recognition using ECG signals and showed an excellent 99.6% accuracy based on only 1-s non-fiducial ECG. Arteaga-Falconi et al. [14] proposed an ECG authentication algorithm for mobile devices and achieved a 1.41% false acceptance rate and an 81.82% true acceptance rate with 4 s of signal acquisition. Hussein et al. [15] designed an authentication system based on ECG fiducial extracted features using discrete cosine transform and the accuracy rate was 97.78% at around 1.21 s of processing time. Coutinho et al. [16] introduced an ECG-based personal identification method with an identification rate of around 99.5% only using 5 heartbeats for the test patterns. Fatemian et al. [17] proposed an ECG feature extractor for biometric recognition and achieved a 99.61% identification rate using only 2 heartbeats on average for everyone. Li et al. [18] designed an ECG biometrics system that achieved 98.3% accuracy and a 0.5% equal error rate (EER) based on a 10-s testing duration. Lourenço et al. [19] introduced a finger-based ECG biometric system with 30 heartbeats from each subject to form the enrolment template and the other 30 heartbeats (different from the previous) to construct test templates, and the system obtained a 94.3% recognition rate in subject identification and a 13.0% EER in subject authentication performed on a group of 16 subjects. Odinaka et al. [20] studied the impact of long-term variability, health status, data fusion, number of training and testing heartbeats, and database size on ECG biometric performance from a comparatively large sample of 269 subjects. They found that the EER decreased and recognition accuracy increased when the number of training or testing heartbeats increased, and their proposed method achieved 5.58% EER in verification, 76.9% accuracy in rank-1 recognition, and 93.5% accuracy in rank-15 recognition when training and testing heartbeats were from different days. Kim et al. [21] proposed a personal authentication system using ECG based on the long short-term memory. They achieved the 99.73% overall accuracy with only 3 test beats. Lynn et al. [22] designed a deep bidirectional GPU network model for biometric ECG classification based on the recurrent neural network. The best accuracy was 97.60% using only 3 test beats.
Although the above studies explored the relationship between ECG length and the recognition rate, none were based on ECG during bathing. Owing to differences in physical conditions, everyone has a different sensitivity to WTs. What is more, the water pressure on the chest and thermal stimulus on hemodynamics induce varying stress levels to subjects during bathing. As confirmed in a previous study of ours [23], different WTs have an important impact on the recognition rate during bathing. The impact of ECG length during bathing on the recognition rate has remained unknown until now. This study thus mainly aims to explore the impact of ECG length during bathing on the recognition rate using the convolutional neural network (CNN). Our hypothesis is that with the increase of testing ECG length, the recognition rate will monotonously and significantly increase and then remain almost unchanged until it reaches a maximum.
1.2 Contribution and Organization
This study's major contributions are as follows:
1. We formulate identity recognition as image classification by fully utilizing the powerful image classification capabilities of CNN. Specifically, the 1-D ECG signal is converted into a 2-D binary image.
2. We design a majority vote-based algorithm in the secondary classification stage to achieve an accurate and robust recognition system. This algorithm can increase the final recognition rate by 10%.
3. To address the low robustness problem, our training data, validation data, and test data are taken from different ECG recordings. All the experimental data is collected in the commonly used WT (36.5–41.5°C). Additionally, to meet practical application, all the test data is consecutive in the secondary classification stage. The final recognition rate is the average of 1000 randomly test results, which could fully ensure the robustness of the trained model.
The rest of this paper is structured as follows. The data collection system and data processing process, and the feature extraction and recognition are introduced in Section 2. Section 3 focuses on the performance evaluation of the validation and test processes; a discussion is provided in Section 4. Finally, in Section 5 we draw some conclusions and outline directions of future research.
This section mainly introduces the ECG collection system, subjects and ECG recordings, data processing, features extraction and identity recognition.
The ECG collection system in this study includes four rectangular stainless steel non-contact electrodes, all placed on the bathtub wall. When the subject is in the bathtub during bathing, the four non-contact electrodes are near the right foot, right arm, left foot, and left arm, respectively. The electricity on the skin surface, which is produced by the heart's electrical activity, arrives at the four non-contact electrodes through the water, and the four limb leads are recorded. Lead I is the potential difference between the left arm (positive) and right arm (negative); lead II is that between the left foot (positive) and right arm (negative); and lead III is that between the left foot (positive) and left arm (negative). Four shielded wires are respectively welded onto the four non-contact electrodes. The four limb leads arrive at the ECG collection monitor (Open Brain Computer Interface Biosensing Ganglion Board–OpenBCI Ganglion; OpenBCI, USA) through the shielded wires, the ECG monitor and the laptop (MacBook Pro) are connected using standard Bluetooth 4.0, and all the collected ECG recordings are stored on the laptop. The designed ECG collection system in this study is shown in Fig. 1.
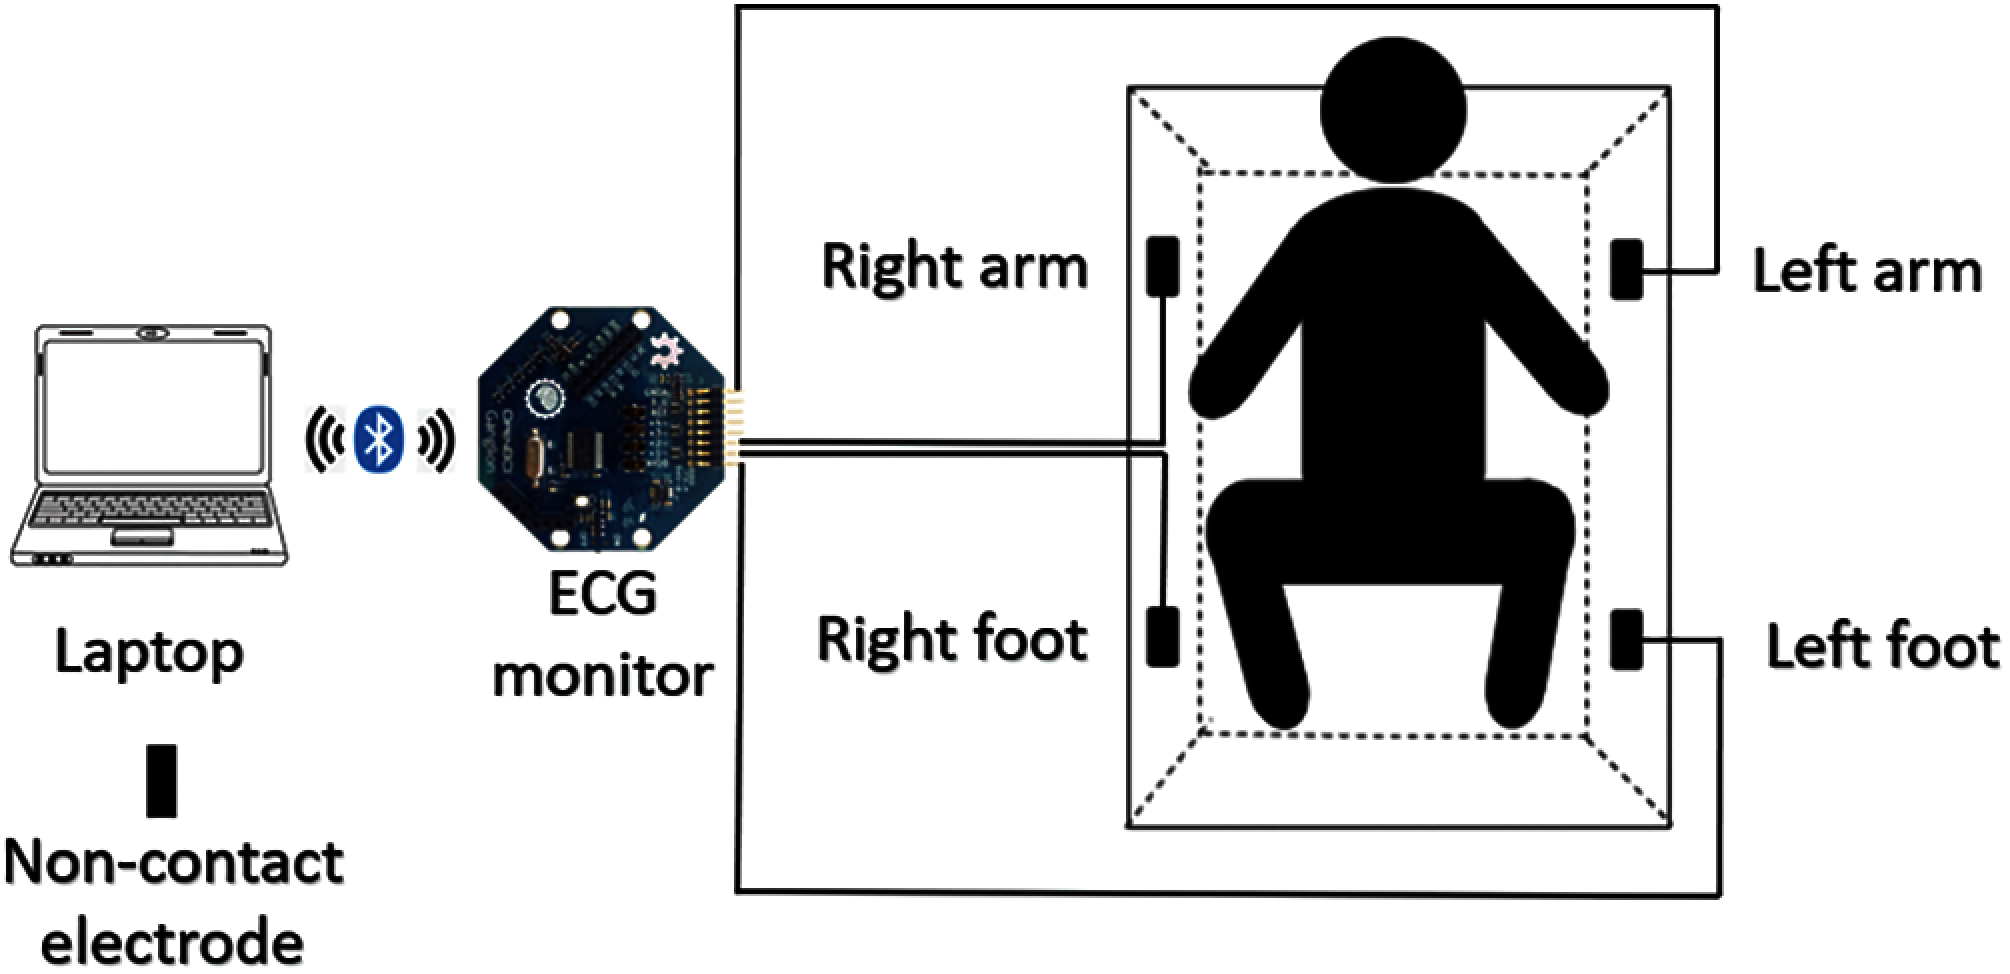
Figure 1: ECG collection system
2.2 Subjects and ECG Recordings
The ECG recording procedures were approved by the Public University Corporation, the University of Aizu Research Ethics Committee. Written informed consent was obtained from each participant before the experiment.
Ten subjects (seven men and three women) aged 23 to 40 years old (mean ± SD: 28.5 ± 4.78 years) who are students at the University of Aizu participated in the data collection. The blood pressure, body temperature, and body weight were recorded before and after the ECG collection, and the temperature profile for WT change and room temperature were recorded every second during the ECG collection using a temperature monitor (TR-71 wb/nw; T&D Corporation, Japan).
The ECG data was collected using non-contact electrodes at five different WTs during bathing: 36.5–37.5°C, 37.5–38.5°C, 38.5–39.5°C, 39.5–40.5°C, 40.5–41.5°C, respectively. Five ECG recordings were collected from each subject at each preset bathtub WT condition, and each recording is 18 min long with a sampling rate of 200 Hz, as is shown in Tab. 1. In total, 150 ECG recordings and 150 temperature recordings were collected during bathing.
The flowchart of ECG processing, feature extraction, and recognition is shown in Fig. 2. All data processing and analyses were performed using MATLAB (R2019a). Baseline wandering is clear in the raw ECG signal due to motion artifacts and respiration by the subjects. To remove the baseline wandering, the single-level discrete 1-D wavelet transform (DWT) was used to decompose the ECG, and the DWT was defined by Eqs. (1) and (2).
where x(t) is relative to a real-valued wavelet, s = 2j and τ = k * 2j are called scale and translation parameters, respectively, (j, k) ∈ Z2. Wψ(s, τ) denotes the wavelet transform coefficients, and ψ is the fundamental mother wavelet.

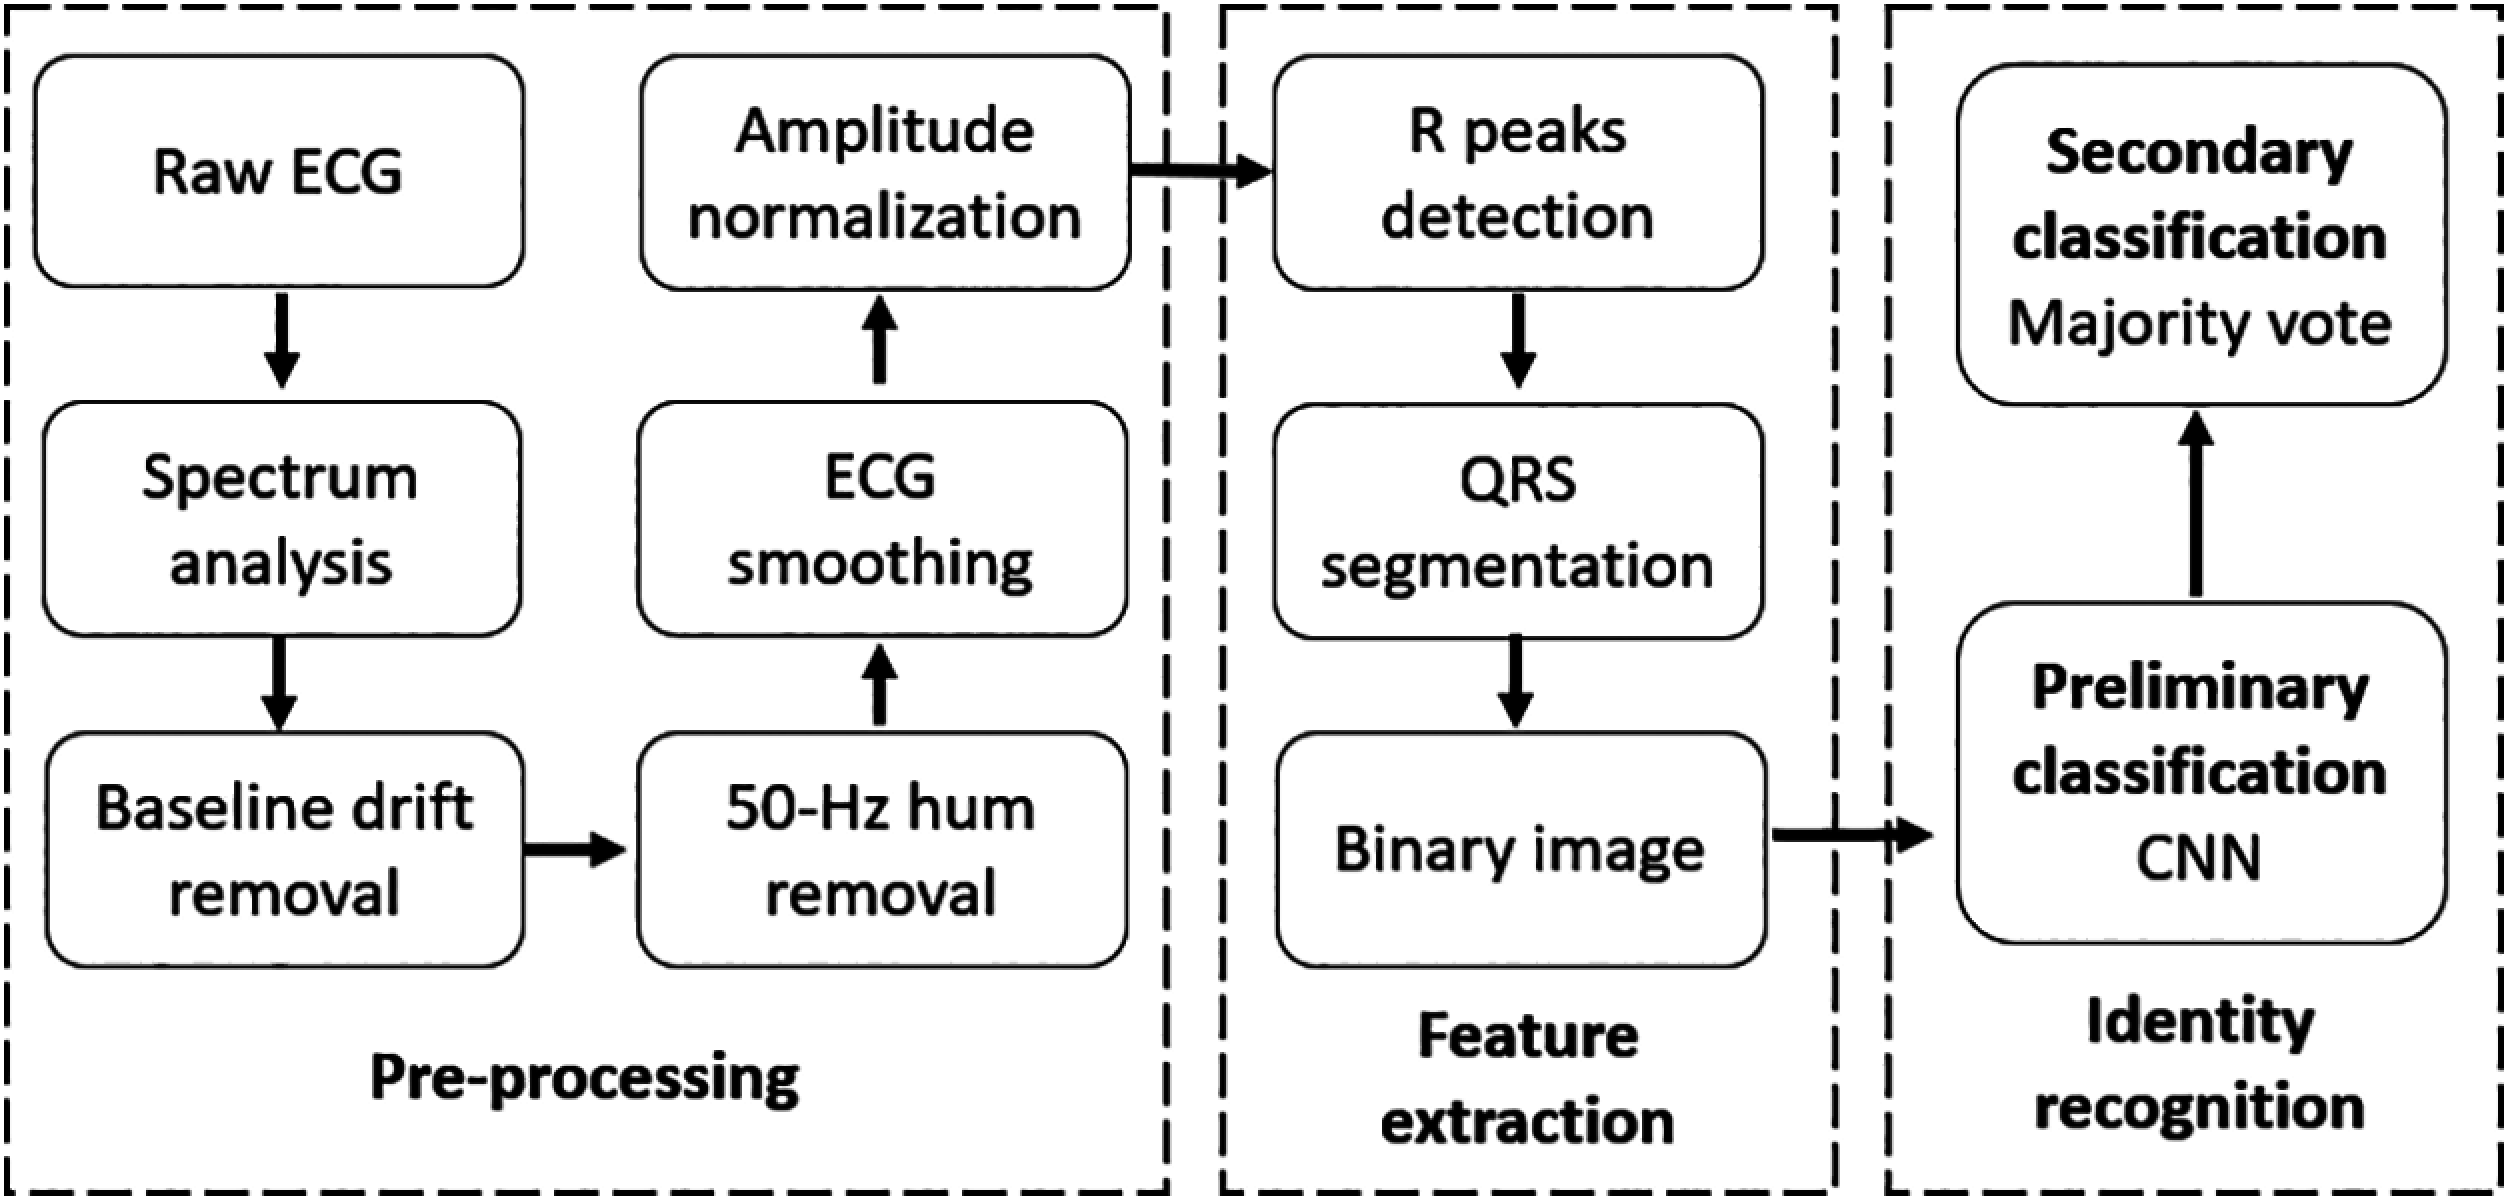
Figure 2: Flowchart of ECG processing, feature extraction, and recognition
The Daubechies wavelet at level 10 is used to decompose the raw ECG signal and the baseline wandering approximation coefficient is subtracted from the raw ECG signal after reconstructing at level 8. There is also an obvious hum noise after removing the baseline. Spectrum analysis was performed using fast Fourier transform (FFT), the FFT is defined in Eq. (3).
where x(n) is a sampled signal in time domain representation, as shown in Eq. (4).
f0 is the fundamental frequency, fs is the sampling frequency, A is the amplitude, θ is the initial phase angle, and n = 0, 1, 2, . . . , N − 1. N is the number of sampling points. Therefore, Eq. (3) can be replaced by Eq. (5).
The spectrum analysis results show that the main frequency component of the hum noise was 50 Hz, which was mainly produced by the electromagnetic interference between the power supply network and equipment. A second-order infinite impulse response digital notch filter was used to remove the 50-Hz hum noise. The numerator and denominator coefficients of the digital notch filter with the notch located at ω and the bandwidth at 0.0071 at the –3 dB level were calculated, with ω needing to meet the condition of 0.0 < ω < 1.0.
Next, the 5-point moving average method was used to smoothen the ECG signal. The mathematical formula for the moving average is shown in Eq. (6).
where x[n] is tphe input signal, y[n] is the output signal, and M is 5.
The ECG was then normalized into the 0–1 range using the ‘mapminmax’ function, the R peaks were detected using the ‘findpeaks’ function, and the outliers were removed using the 1-D 11th-order median filter because of its outstanding capability to suppress isolated outlier noise without blurring sharp changes in the original signal. The mathematical formula of the 1-D 11th-order median filter is shown in Eq. (7).
where x[i] is the input signal, y[i] is the output signal, and ω is the moving window length.
As the sampling rate is 200 Hz, the sampling interval is 5 ms. The length of a complete QRS complex wave is about 80–120 ms. Therefore, to segment a complete QRS complex wave, centered on the detected R peak, the segmented sampling points are 30 (150 ms). Then, each 1-D segmented QRS complex wave is transformed into a 2-D binary image, as shown in Fig. 3.
The training data is a 30 × 30 × 84297 3-D matrix, the validation data is a 30 × 30 × 83734 3-D matrix, and the test data is a 30 × 30 × 81867 3-D matrix. All the training, validation, and test data belonged to the first, second, and third ECG recordings, respectively. The classification process mainly consisted of two stages. A simple 2-D CNN is used during the first stage, as shown in Fig. 4.
In the input layer, the input data is a 30 × 30 binary image of the QRS complex. In the convolution layer, there are 20 filters with a size of 9 × 9, the output of the convolution layer is a 22 × 22 × 20 3-D matrix, and the size is unchanged after the ‘ReLU’ operation. In the pooling layer, the down-sampling result is an 11 × 11 × 20 3-D matrix. After the ‘reshape’ operation, two times fully connected operations are performed. In the output layer, the ‘Softmax’ function is used to calculate the identification rate. There are 10 values in the output of the ‘Softmax’ function, each indicating the possibility of every subject. If the row of the maximum of these 10 values in the ‘Softmax’ function is the same as the label of the input data, then let the accuracy increase by 1.
To explore the impact of ECG length on the recognition rate, the majority vote method is used in the second stage. N (1 to 60) consecutive QRS complex waves are randomly selected for each subject from the third recording and are then fed into the trained CNN model. For each subject, if the selected QRS complex number correctly identified is greater than or equal to half of N, then it is accepted; otherwise, it is rejected.
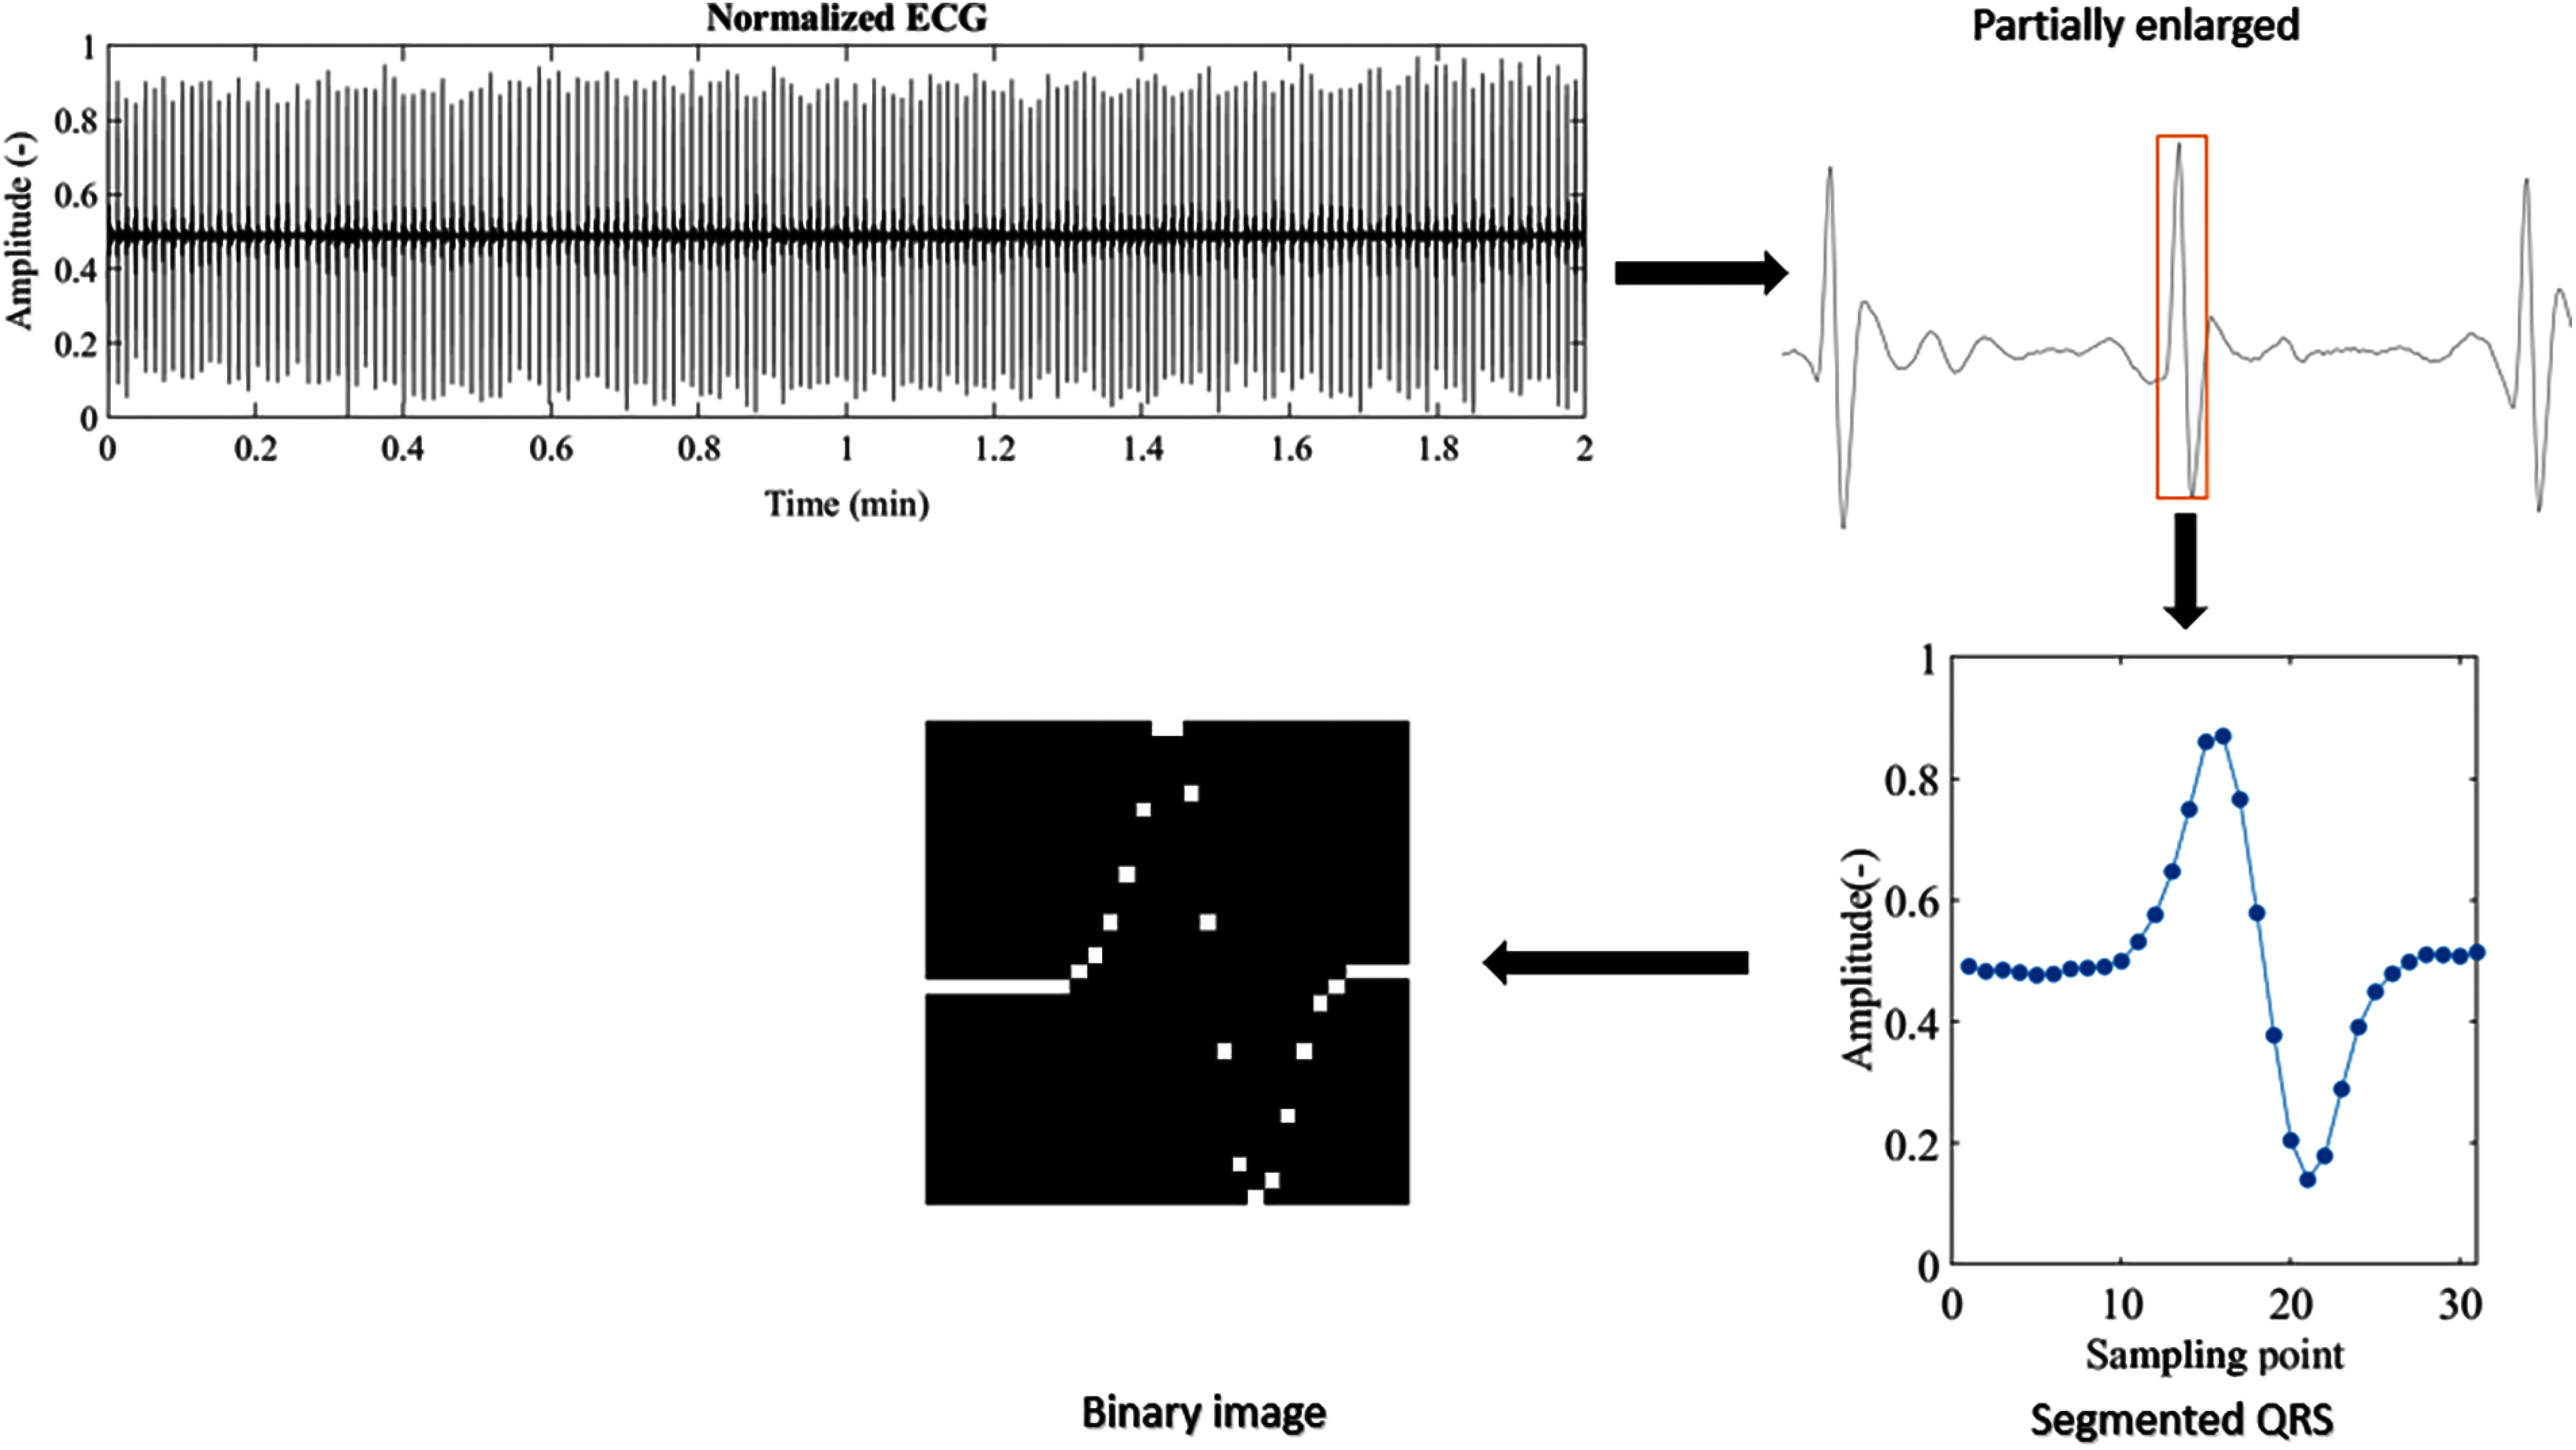
Figure 3: 1-D QRS complex to 2-D binary image
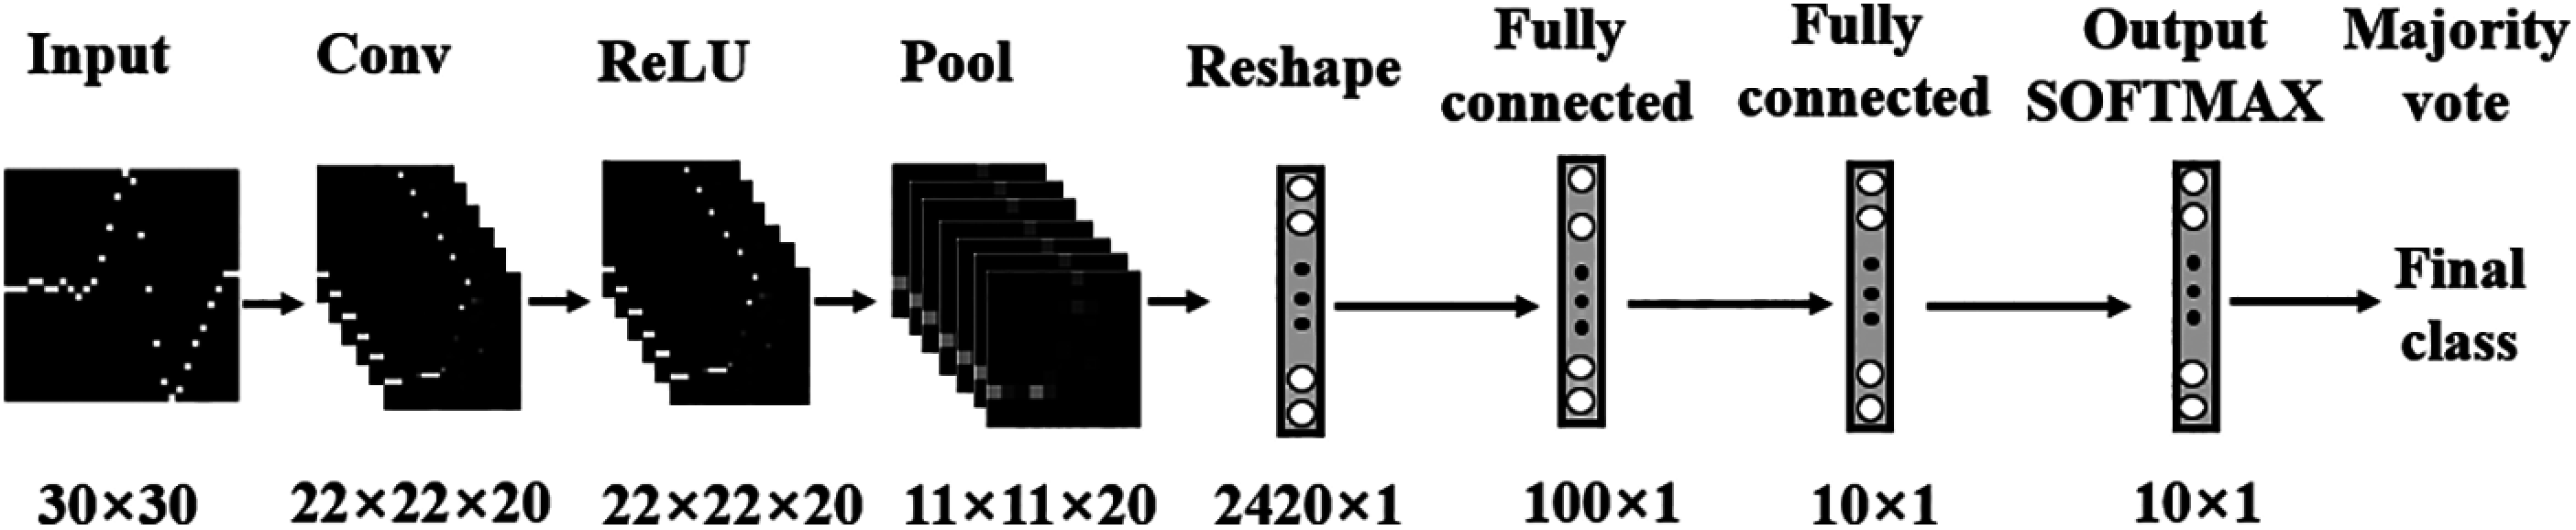
Figure 4: CNN model
To evaluate the performance of the trained model, we define some performance evaluation parameters: true positive (TP), false positive (FP), true negative (TN), false negative (FN), precision, recall, F-score, TP rate (TPR), FP rate (FPR). Specifically,
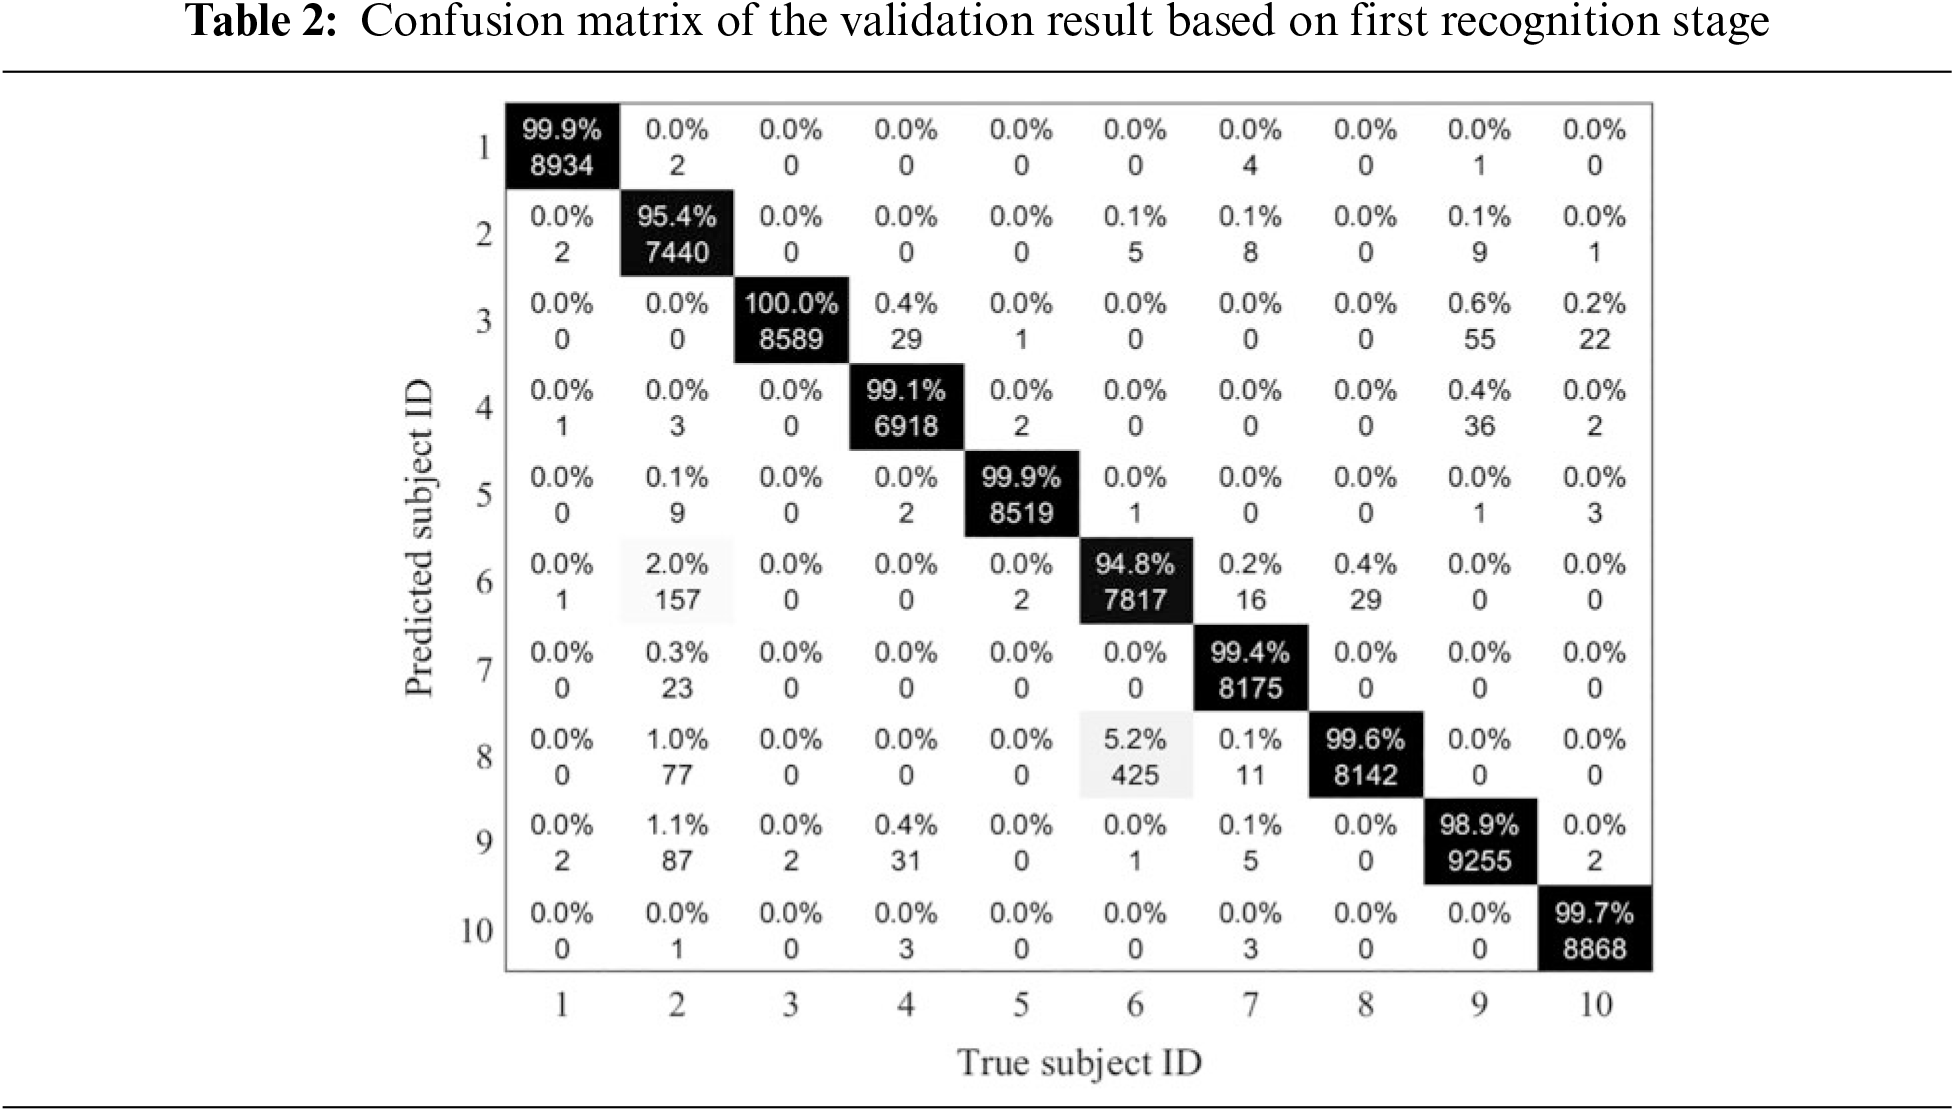
During the training stage, different combinations of important training parameters were tested. Finally, the learning rate was set to 0.01, the batch size to 256, and the epoch to 40. When the training process was finished, the validation data was used to test the trained model and the validation result is shown in Tabs. 2 and 3. The FPR of subject 6 was highest (0.57%). The confusion matrix result shows that the trained model easily predicted subject 6 to subject 8, and predicted subject 2 to subject 6, 8, and 9. The trained model had the best discrimination ability against subject 3, with a precision of 99.98% and an FPR of 0%. The total precision of this trained model was 98.71%. Therefore, this trained model could be applied in the next stage.
Before the majority vote process, the trained model was directly used to explore the impact of the ECG length on the recognition rate using the test data. The majority vote based on the trained model classification result was then used to explore the impact of ECG length on the recognition rate using the test data. To verify the robustness and reduce the random errors of the trained model, 1000 times operations were conducted in both above two conditions. The relationship between ECG length and recognition rate based on 1000 times experiments before and after majority vote is shown in Fig. 5. The test recognition rate is about 90% based on the trained model. After the majority vote algorithm was used, the final recognition rate was found to be more than 98%, an increase of about 8.89%. Based on the results shown in Fig. 5, we see that the recognition rate at 20 QRS complex or greater for each subject is better and almost becomes stable. Fig. 5 confirms that the recognition rate is very stable when the number of QRS is 20 and later. Fig. 6 clarifies the variation in recognition rate of each subject with QRS increase. Figs. 5 and 6 together provide direct evidence that the designed system is accurate and robust. Therefore, we recommend taking the 20 QRS complex as the most appropriate ECG length in the application of identity recognition at different WTs during bathing.
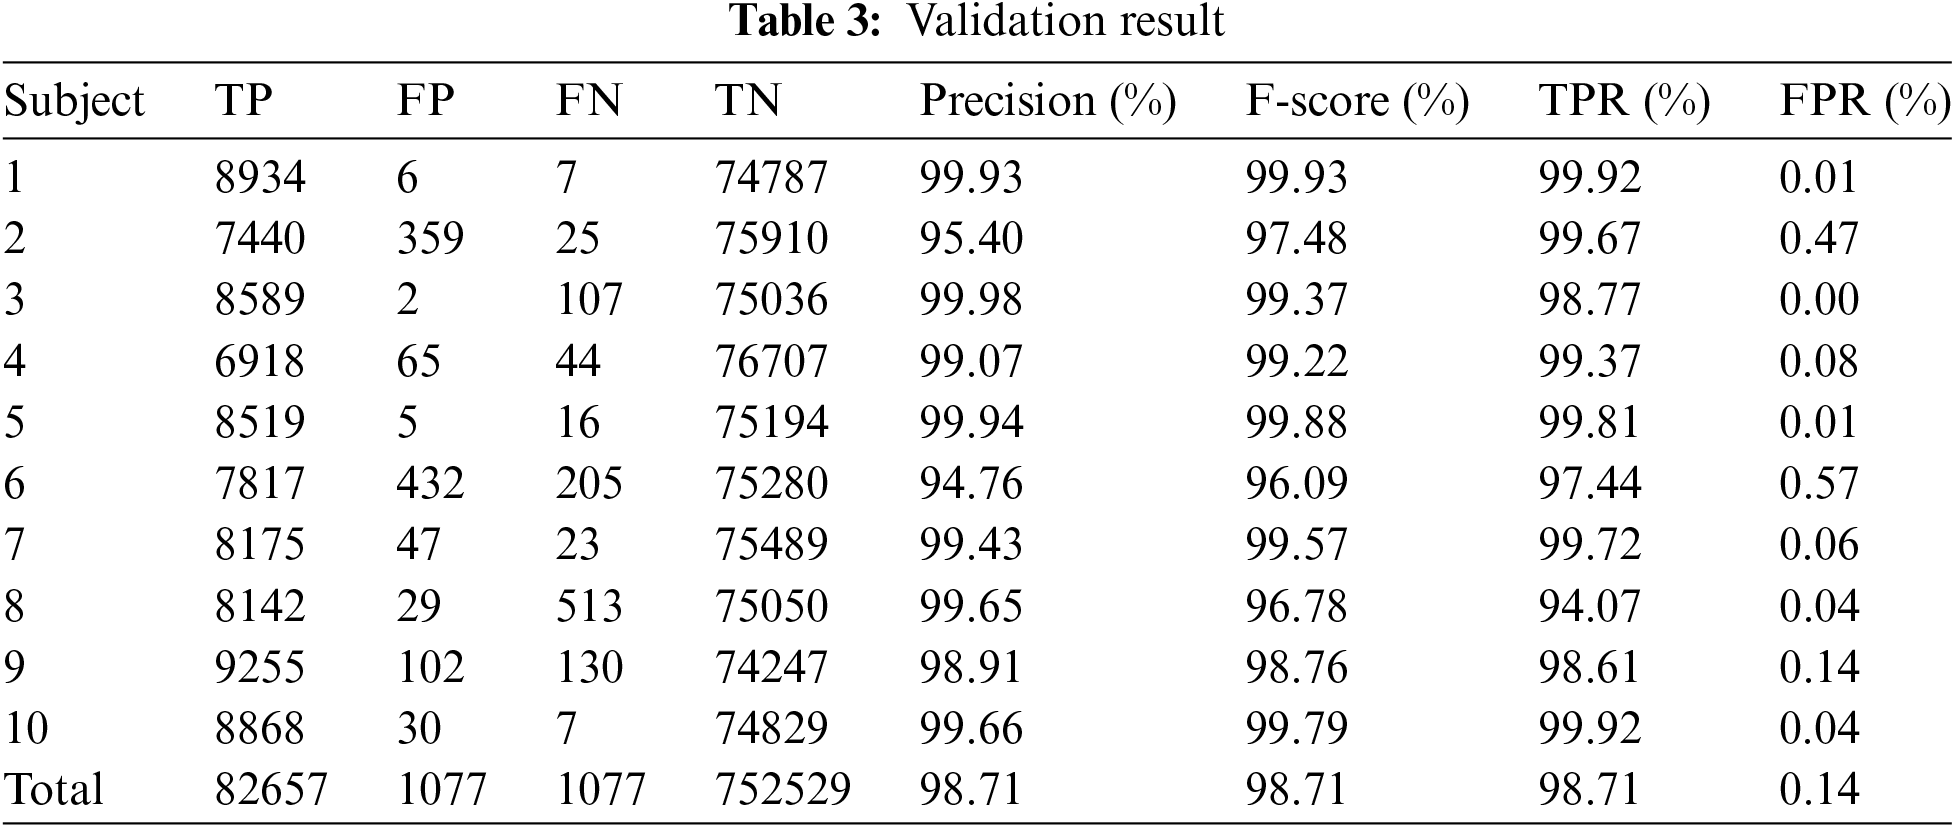
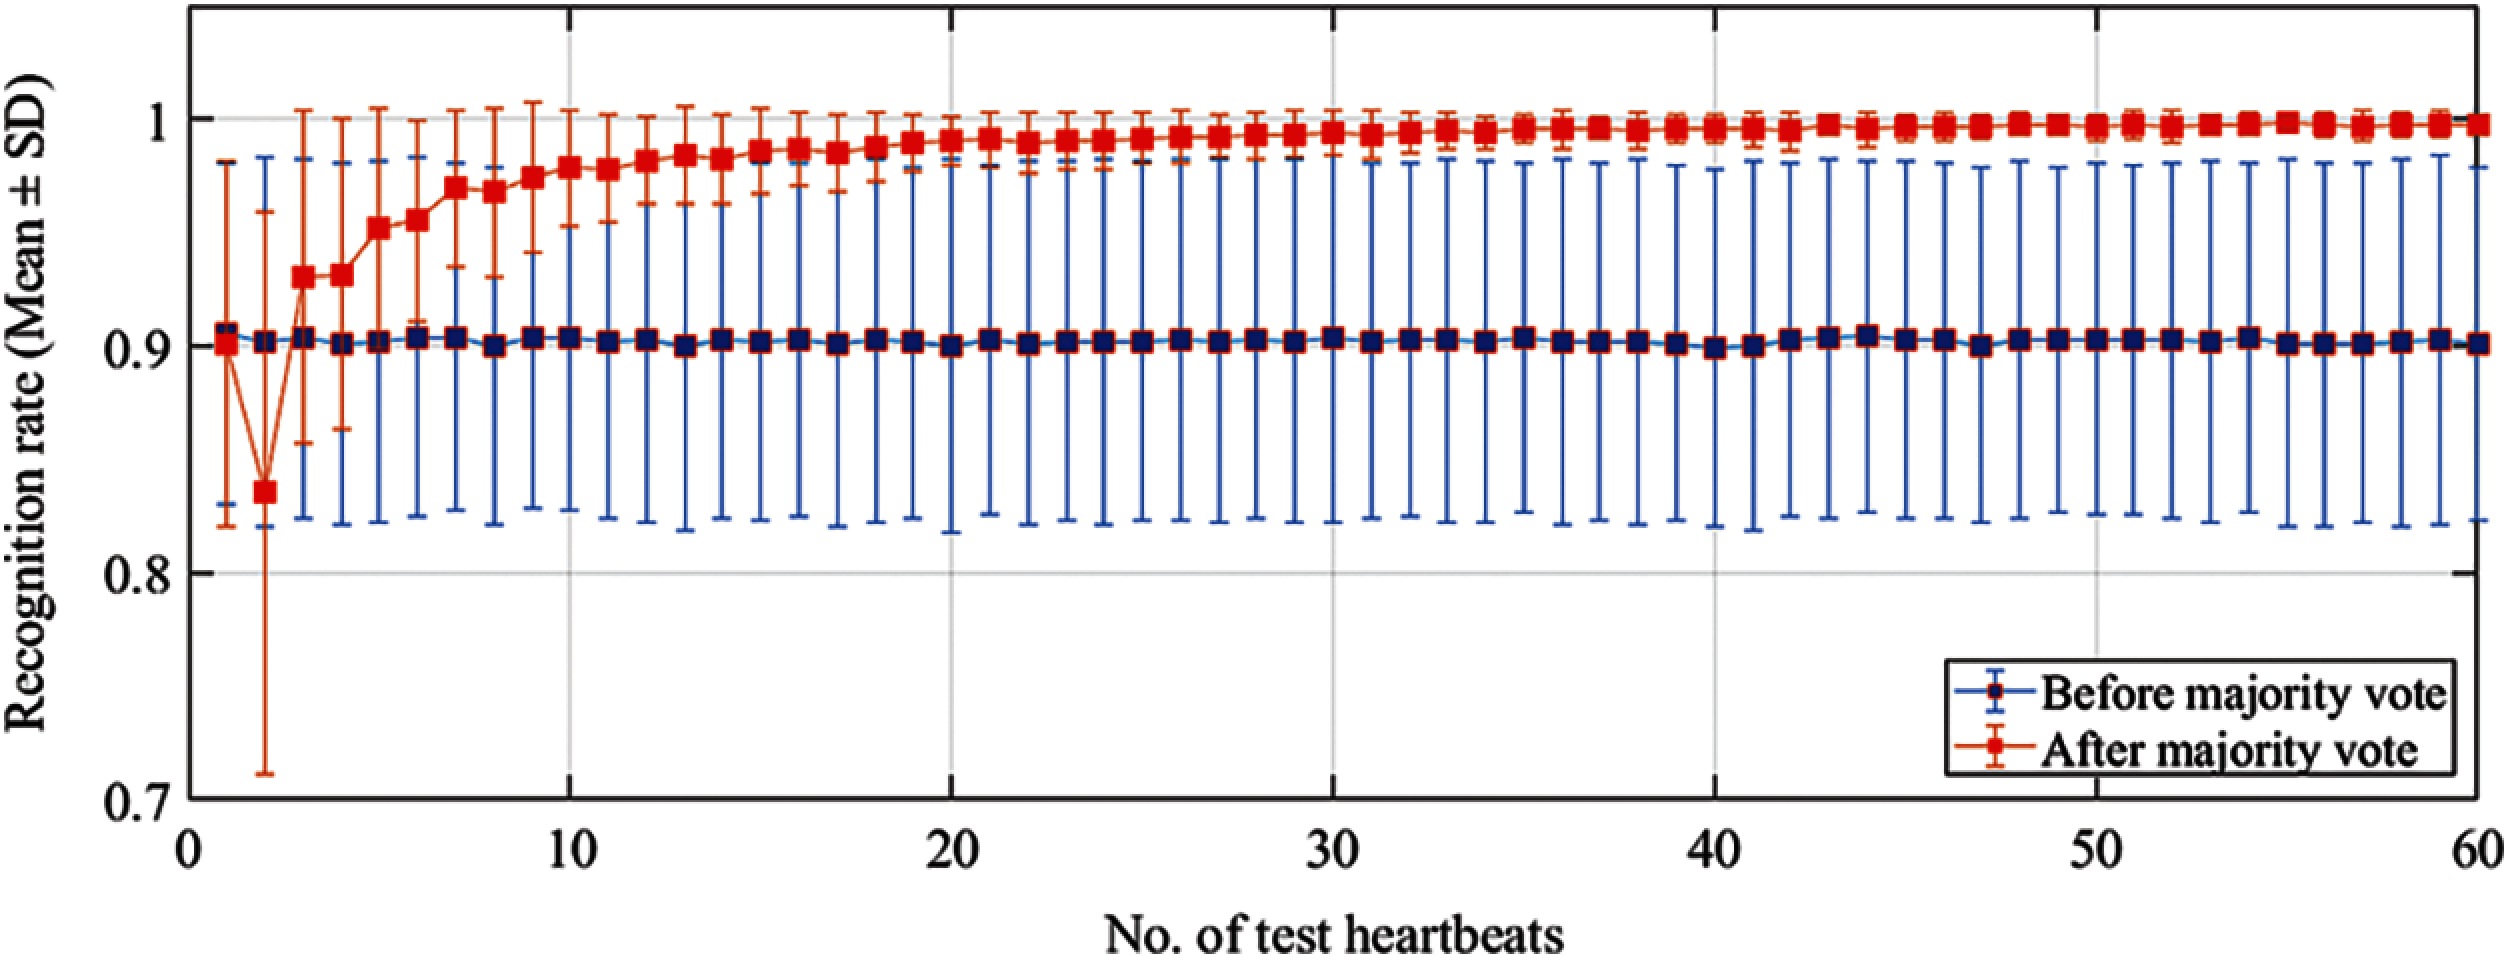
Figure 5: Variety of mean recognition rate based on different testing ECG length
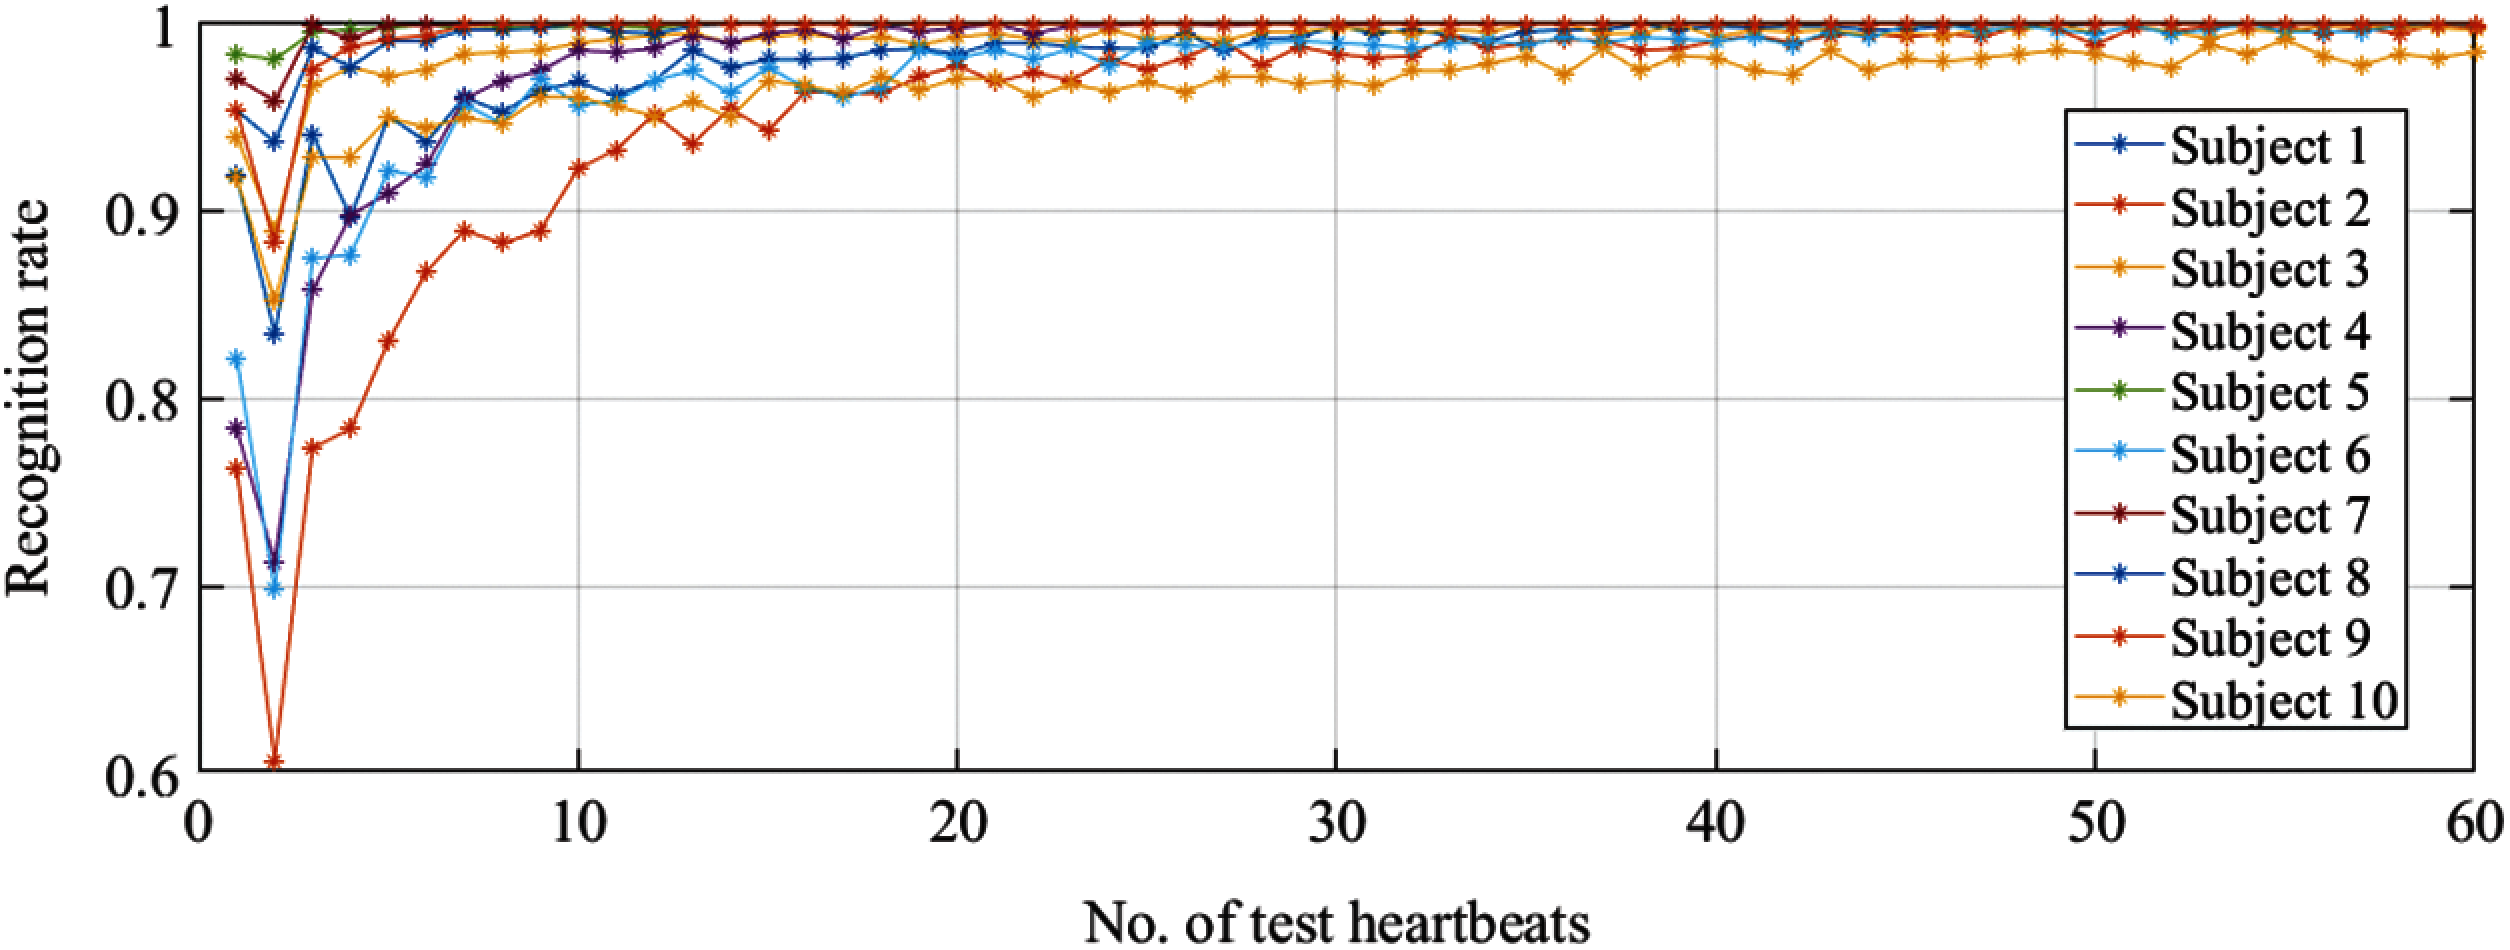
Figure 6: Variation in recognition rate for each subject
This study explores the impact of ECG length on the recognition rate at different WTs during bathing. Because of differences in sex, age, height, weight, heart shape and size, etc., the ECG pattern differs among individuals. As the most discriminative feature, the QRS complex is often taken as the biometric marker. The proposed method thus transforms the 1-D QRS complex into a 2-D binary image and takes this binary image as the recognition marker. The binary image includes a complete QRS complex with 30 × 30 pixels. Unlike the RGB and grayscale images, the binary image only includes 0 and 1, which can greatly reduce the computational complexity. The CNN has a powerful image classification ability. We thus transform the identity recognition problem into an image classification problem. To address the problem of computational complexity, the designed system only includes input layer, convolutional layer, ReLU layer, pooling layer, and fully connected layer. This model has very low computational complexity and high classification ability. The classification curve can thus quickly converge and achieve high accuracy.
In the experiment, the training, validation, and test data are from different ECG recordings. Such a data structure ensures that the experimental results are robust and practical. When the training process is finished, the final validation precision is 98.71%, as shown in Tab. 2; 82657 QRS waves are correctly recognized and 1077 QRS waves are incorrectly recognized. The confusion matrix as shown in Tab. 1 shows that the trained model easily recognizes subject 2 as subject 6 and recognizes subject 6 as subject 8, which greatly reduces the overall recognition precision. To explore the impact of ECG length on the recognition rate, N (1 to 60) adjacent and consecutive QRS complex waves are randomly selected for each subject from the third recording and are then fed into the trained CNN model. As shown in Fig. 5, although the average recognition rate is about 90%, the SD of the recognition rates of 10 subjects is large, which shows that the trained model is fluctuating and not robust. To improve the precision and robustness of the trained model, post-processing based on the test results is performed. According to the majority vote mechanism, if the number of QRS correctly identified is greater than or equal to half of N, then it is accepted; otherwise, it is rejected. After the majority vote is used, the recognition rate is about 98.00% when the number of selected QRS is greater than 20, an increase of about 8.89 percentage points. The average recognition rate curve is convergent and stable, as shown in Fig. 5. Fig. 6 shows that the recognition rate curve of each subject is robust when the number of testing QRS is 20 or greater.
The entire signal acquisition process can be divided into three stages. The first stage is the adaptation period, with about two minutes duration. Because of the water pressure on the chest and thermal stimulus on hemodynamics, the heart rate changes considerably after the subject enters the bathtub, and the ECG signal fluctuates greatly during this period. The second stage is the stable period, with a duration of about 10 min. In this stage, the subject has adapted to the WT environment, the heart rate is relatively more stable, and the ECG is not as fluctuating as it was in the first stage. The third stage is the pressure rise period, with a duration of about 6 min. In this stage, the subject has been in the bathtub for about 12 min and has become very tired because of the water pressure on the chest and thermal stimulus on hemodynamics. Mental and physical stress greatly increases in this stage. For one subject, the ECG signals of the three different periods vary greatly. For different subjects, due to individual differences, especially sensitivity to water pressure and WT, the ECG signals are extremely different. In this study, R peaks detection is necessary before the QRS complex is segmented. The biggest challenge of this study is thus accurately detecting the locations of the R peaks. Bathtub ECG is unlike ECG in a resting state. The same algorithm is somewhat powerless in terms of accurate detection of all the R peaks of the bathtub ECG within 18 min, but it is even more strained in terms of accurate detection of R peaks of different subjects. The detected R peaks result includes many outliers, and they must be removed before the QRS complex is segmented.
During the feature extraction stage, the 1-D QRS complex is transformed into a 2-D binary image. The positions of the sampling points are slightly changed after the transformation, where they are resaved in the matrix of the new binary image after being rounded up. Although such a transformation method could greatly reduce the computational complexity, it will also lose much useful QRS information. The designed algorithm cannot ensure that all the inherent features are fully retained. What's more, the segmented QRS complex only includes 30 sampling points (150 ms). The duration of a normal and complete QRS complex is about 80 to 120 ms. In terms of QRS duration, this segmentation is reasonable. However, from the perspective of converting it into a binary image, the number of sampling points is insufficient. The conventional assumption is that the more sampling points, the more the converted image can retain the inherent characteristics of the original signal. Of course, further experiments are needed to verify whether the sampling points will also affect the recognition rate.
To the best of our knowledge, this is the first study of the impact of ECG length on the identity recognition rate at different WTs during bathing. Our experimental results show that the recognition rate exceeds 98% when the number of QRS is 20 and then almost becomes stable. The designed recognition system has high precision and robustness, which could make it suitable for practical application.
Although some discoveries were made in this study, there were also some limitations. First, during the ECG collection stage, all the subjects were told to keep as still as possible, which caused them some inconvenience. This measure can greatly reduce the noise of the ECG signal and bring convenience to the later signal processing and experiment. However, it is quite different from an actual application scenario, where a person cannot always stay still while in a bathtub. The ECG signal is very weak, in the order of millivolts. During the ECG collection process, non-contact electrodes are used. The weak electricity on the skin surface is conducted to the electrode through the water medium. Strenuous movement induces considerable motion artifacts to the ECG signal. Second, the number of subjects is too small. Third, the controlled WT conditions are not unified for all subjects. When the WT exceeds 40°C, some subjects feel that it is uncomfortably hot. Therefore, for personal safety, we must temporarily lower the WT. Fourth, the water pressure on the chest and thermal stimulus on hemodynamics caused additional stress to the subjects during the ECG collection process, which may create some bias regarding the results.
In future research, we will explore factors behind false recognition for the designed system and increase its recognition rate and robustness. We will also explore other automatic identity recognition methods using ECG during bathing. What is more, we will change time domain ECG to frequency domain and extract its feature as a biometric marker. Besides, in terms of long-term health care purposes, various security and privacy challenges of the physiological signals have been widely concerned, which need to be addressed. Therefore, we will explore how to use some latest encryption technology to strengthen the security of physiological signals [24–28].
Acknowledgement: The authors thank all participants for their cooperation during the data collection.
Funding Statement: This study is supported in part by the University of Aizu's Competitive Research Fund (2020-P-24).
Conflicts of Interest: The authors declare that they have no conflicts of interest to report regarding the present study.
1. Data resource: Ministry of Health, “Labor and welfare,” URL = https://www.nippon.com/ja/japan-data/h00623/, 2020. [Google Scholar]
2. L. Biel, O. Pettersson, L. Philipson and P. Wide, “ECG analysis: A new approach in human identification,” IEEE Transactions on Instrumentation and Measurement, vol. 50, no. 3, pp. 808–812, 2001. [Google Scholar]
3. S. C. Kwatra and V. K. Jain, “A new technique for monitoring heart signals-part I: Instrumentation design,” IEEE Transactions on Biomedical Engineering, vol. 33, no. 1, pp. 35–41, 1986. [Google Scholar]
4. Y. K. Lim, K. K. Kim and K. S. Park, “The ECG measurement in the bathtub using the insulated electrodes,” in 26th Annual Int. Conf. of the IEEE Engineering in Medicine and Biology Society, San Francisco, CA, USA, pp. 2383–2385, 2004. [Google Scholar]
5. T. Togawa, T. Tamura, J. Zhou, H. Mizukami and M. Ishijima, “Physiological monitoring systems attached to the bed and sanitary equipments,” in Proc. of the Annual Int. Conf. of the IEEE Engineering in Medicine and Biology Society, Seattle, WA, USA, pp. 1461–1463, 1989. [Google Scholar]
6. K. Motoi, S. Kubota, A. Ikarashi, M. Nogawa, S. Tannaka et al., “Development of a fully automated network system for long-term health-care monitoring at home,” in 29th Annual Int. Conf. of the IEEE Engineering in Medicine and Biology Society, Lyon, France, pp. 1826–1829, 2007. [Google Scholar]
7. M. Ishijima, “Unobtrusive approaches to monitoring vital signs at home,” Medical & Biological Engineering & Computing, vol. 45, no. 11, pp. 1137–1141, 2007. [Google Scholar]
8. S. -J. Jang, J. -H. Lee, J. -H. Lee, S. -B. Park, S. Hwang et al., “Ubiquitous home healthcare management system with early warning reporting,” in Int. Conf. on Convergence Information Technology, Gwangju, Korea (Southpp. 2394–2401, 2007. [Google Scholar]
9. K. Motoi, Y. Yamakoshi, T. Yamakoshi, H. Sakai, N. Tanaka et al., “Measurement of electrocardiograms in a bath through tap water utilizing capacitive coupling electrodes placed outside the bathtub wall,” Biomedical Engineering Online, vol. 16, no. 12, pp. 1–13, 2017. [Google Scholar]
10. T. Yen, C. Chang and S. Yu, “A portable real-time ECG recognition system based on smartphone,” in 35th Annual Int. Conf. of the IEEE Engineering in Medicine and Biology Society (EMBCOsaka, Japan, pp. 7262–7265, 2013. [Google Scholar]
11. T. R. Gadekallu, N. Khare, S. Bhattacharya, S. Singh, P. K. R. Maddikunta et al., “Early detection of diabetic retinopathy using PCA-firefly based deep learning model,” Electronics, vol. 9, no. 2, pp. 1–16, 2020. [Google Scholar]
12. T. R. Gadekallu, M. Alazab, R. Kaluri, P. K. R. Maddikunta, S. Bhattacharya et al., “Hand gesture classification using a novel CNN-crow search algorithm,” Complex & Intelligent Systems, vol. 2021, no. 1, pp. 1–14, 2021. [Google Scholar]
13. M. Kim and S. B. Pan, “Deep learning based on 1-d ensemble networks using ECG for real-time user recognition,” IEEE Transactions on Industrial Informatics, vol. 15, no. 10, pp. 5656–5663, 2019. [Google Scholar]
14. J. S. Arteaga-Falconi, H. A. Osman and A. E. Saddik, “ECG authentication for mobile devices,” IEEE Transactions on Instrumentation and Measurement, vol. 65, no. 3, pp. 591–600, 2015. [Google Scholar]
15. A. F. Hussein, A. K. AlZubaidi, A. Al-Bayaty and Q. A. Habash, “An IoT real-time biometric authentication system based on ECG fiducial extracted features using discrete cosine transform,” ArXiv preprint arXiv:1708.08189, vol. 1, no. 1, pp. 1–6, 2017. [Google Scholar]
16. D. P. Coutinho, A. L. Fred and M. A. Figueiredo, “One-lead ECG-based personal identification using ziv-merhav cross parsing,” in 20th Int. Conf. on Pattern Recognition, Istanbul, Turkey, pp. 3858–3861, 2010. [Google Scholar]
17. S. Z. Fatemian and D. Hatzinakos, “A new ECG feature extractor for biometric recognition,” in 16th Int. Conf. on Digital Signal Processing, Santorini, Greece, pp. 1–6, 2009. [Google Scholar]
18. M. Li and S. Narayanan, “Robust ECG biometrics by fusing temporal and cepstral information,” in 20th Int. Conf. on Pattern Recognition, Istanbul, Turkey, pp. 1326–1329, 2010. [Google Scholar]
19. A. Lourenco, H. Silva and A. Fred, “Unveiling the biometric potential of finger-based ECG signals,” Computational Intelligence and Neuroscience, vol. 2011, no. 1, pp. 1–8, 2011. [Google Scholar]
20. I. Odinaka, P. Lai, A. D. Kaplan, J. A. OSullivan, E. J. Sirevaag et al., “ECG biometrics: a robust short-time frequency analysis,” in IEEE Int. Workshop on Information Forensics and Security, Seattle, WA, USA, pp. 1–6, 2010. [Google Scholar]
21. B. -H. Kim and J. -Y. Pyun, “ECG identification for personal authentication using LSTM-based deep recurrent neural networks,” Sensors, vol. 20, no. 11, pp. 1–17, 2020. [Google Scholar]
22. H. -M. Lynn, S. -B. Pan and P. Kim, “A deep bidirectional GRU network model for biometric electrocardiogram classification based on recurrent neural networks,” IEEE Access, vol. 7, no. 1, pp. 145395–145405, 2019. [Google Scholar]
23. J. Xu, T. Li, Y. Chen and W. Chen, “The impact of bathtub water temperature on personal identification with ECG signal based on convolutional neural network,” in IEEE 4th Int. Conf. on Computer and Communications (ICCCChengdu, China, pp. 1341–1345, 2018. [Google Scholar]
24. J. Song, Q. Zhong, W. Wang, C. Su, Z. Tan et al., “Flexible privacy-preserving data publishing scheme for smart agriculture,” IEEE Sensors Journal, vol. 20, no. 1, pp. 1–9, 2020. [Google Scholar]
25. W. Wang, H. Xu, M. Alazab, T. R. Gadekallu, Z. Han et al., “Blockchain-based reliable and efficient certificateless signature for IIoT devices,” IEEE Transactions on Industrial Informatics, vol. 2021, no. 1, pp. 1–9, 2021. [Google Scholar]
26. W. Wang, H. Huang, L. Zhang and C. Su, “Secure and efficient mutual authentication protocol for smart grid under blockchain,” Peer-to-Peer Networking and Applications, vol. 2020, no. 1, pp. 1–13, 2020. [Google Scholar]
27. L. Zhang, Z. Zhang, W. Wang, Z. Jin, Y. Su et al., “Research on a covert communication model realized by using smart contracts in blockchain environment,” IEEE Systems Journal, vol. 2021, no. 1, pp. 1–12, 2021. [Google Scholar]
28. L. Zhang, Y. Zou, W. Wang, Z. Jin, Y. Su et al., “Resource allocation and trust computing for blockchain-enabled edge computing system,” Computers & Security, vol. 105, no. 1, pp. 1–13, 2021. [Google Scholar]
 | This work is licensed under a Creative Commons Attribution 4.0 International License, which permits unrestricted use, distribution, and reproduction in any medium, provided the original work is properly cited. |