DOI:10.32604/cmc.2022.021502
| Computers, Materials & Continua DOI:10.32604/cmc.2022.021502 | |
| Article |
Artificial Intelligence Based Sentiment Analysis for Health Crisis Management in Smart Cities
1Department of Computer and Self Development, Preparatory Year Deanship, Prince Sattam Bin Abdulaziz University, Alkharj, Saudi Arabia
2Department of Computer Science, College of Computer and Information Sciences, Princess Nourah Bint Abdulrahman University, Saudi Arabia
3Department of Computer Science, King Khalid University, Muhayel Aseer, Saudi Arabia
4Faculty of Computer and IT, Sana'a University, Sana'a, Yemen
5Department of Natural and Applied Sciences, College of Community-Aflaj, Prince Sattam Bin Abdulaziz University, Saudi Arabia
6School of Computing, Faculty of Engineering, Universiti Teknologi Malaysia, Malaysia
*Corresponding Author: Manar Ahmed Hamza. Email: ma.hamza@psau.edu.sa
Received: 05 July 2021; Accepted: 07 August 2021
Smart city promotes the unification of conventional urban infrastructure and information technology (IT) to improve the quality of living and sustainable urban services in the city. To accomplish this, smart cities necessitate collaboration among the public as well as private sectors to install IT platforms to collect and examine massive quantities of data. At the same time, it is essential to design effective artificial intelligence (AI) based tools to handle healthcare crisis situations in smart cities. To offer proficient services to people during healthcare crisis time, the authorities need to look closer towards them. Sentiment analysis (SA) in social networking can provide valuable information regarding public opinion towards government actions. With this motivation, this paper presents a new AI based SA tool for healthcare crisis management (AISA-HCM) in smart cities. The AISA-HCM technique aims to determine the emotions of the people during the healthcare crisis time, such as COVID-19. The proposed AISA-HCM technique involves distinct operations such as pre-processing, feature extraction, and classification. Besides, brain storm optimization (BSO) with deep belief network (DBN), called BSO-DBN model is employed for feature extraction. Moreover, beetle antenna search with extreme learning machine (BAS-ELM) method was utilized for classifying the sentiments as to various classes. The use of BSO and BAS algorithms helps to effectively modify the parameters involved in the DBN and ELM models respectively. The performance validation of the AISA-HCM technique takes place using Twitter data and the outcomes are examined with respect to various measures. The experimental outcomes highlighted the enhanced performance of the AISA-HCM technique over the recent state of art SA approaches with the maximum precision of 0.89, recall of 0.88, F-measure of 0.89, and accuracy of 0.94.
Keywords: Smart city; sentiment analysis; artificial intelligence; healthcare management; metaheuristics; deep learning; parameter tuning
In recent times, Smart Cities is dynamically giving support for quick response in healthcare crisis management. The Integrated Command and Control Centers (ICCC) system under the mission in several Smart Cities comprising Pune, Bangalore, Vadodara, and Agra have been converted to war rooms for effective management and real-world monitoring of the epidemic using technologies [1]. This mission gathered optimal practices through Smart Cities in struggling healthcare crises, like COVID-19. Such practices are collecting data, active management, rapid communication of COVID diseased people and areas, and take preventive steps in evading spread of the disease [2]. This has been shared and documented with every Smart Municipal Commissioner and City CEO and could be repeated in other cities. Smart city projects have gathered data on shelter and food provision with contact details and locations of shelter homes, kitchens and food distribution that newly started/exist through the Smart Cities. This data has been shared through the city stakeholders and is available through Google maps. COVID Response in Smart Cities could be categorized into 4 parts, i.e., Communication, Information, Preparedness, and Management.
The epidemic of COVID-19 has caused an extraordinary loss of human lives worldwide and presented a sensational problem to food systems, work universe, and global health [3]. The social disturbance and monetary is demolished by this epidemic. A lot of people are at risk of undernourishment, and it can be increased up to 132 million by the end of 2020 [4,5]. The dynamics of COVID-19, comprising contagion factors, mortality, initial deaths, and time of country virus, have been introduced by the responsive variances among financial markets and social media results in serious disease spread [6]. The world that we know till now has been transformed and now we are living in a novel scenario in endless change progress, where how we speak, live, and relate with other people is changed forever. In this certain situation, disease threat is supposing a great work while diverting, educating, and sending the progression of data in the public domain [7]. The current disaster is because COVID19 is generating a socially innovative scenario which is sensational for healthcare communities [8]. They live in an exceedingly globalized world, in which free travel among nations, relocation adaptability, utilization of Information and Communication Technologies (ICTs), and the turn of events are significantly evolved. They must feature the emerging connections among the world economies that are reflected in the individual knowledge and financial progress [9]. Also, due to this disease outbreak, large number of criticism on movements and fake news constantly appears on social media sites.
The first lockdown in India started on March 22, 2020, and was extended from April 15 to May 3, making it the longest lockdown in the country. As of April 22, India has reported 18,985 confirmed cases and 603 deaths from COVID-19 in its 31 states and associated domains since its first reported case on January 30. India rushed to close its borders and upheld a quick lockdown, which the World Health Organization lauded as “extreme and convenient.” The lockdown has likewise given the public authority time to plan for a potential worsening of situations when the pandemic is estimated to peak in the coming weeks. India's population has reached 1.3 billion, and well-being imbalances, extending monetary and social inconsistencies, and social hygiene issues present novel challenges. Readiness and response to COVID-19 have contrasted at the state level. Kerala has drawn on its involvement in the Nipah virus infection in 2018 to utilize comprehensive testing, contact tracing, and network preparation to contain the infection and maintain a low death rate. It has likewise set up a vast number of small safe houses for transient specialists. Odisha's introduction to past cataclysmic events implied that emergency safety measures were at that point set up and have been repurposed. Maharashtra has utilized robots for cleaning during the lockdown and applied a group of control methodologies: if at least three patients are analyzed, then all houses inside the 3 km radius are examined to detect other cases, trace contacts, and determining possible cases. However, whether this procedure is useful is still unclear at present. The reason depends on the presence of network transmission, and there is a risk of slander and compulsion. Nevertheless, states merit a large part of the credit for India's COVID-19 response. As India is the second most highly populated country after China, it is necessary to examine the spread and impacts of COVID-19 (“India Likely to Surpass China as World's Most Populous Country in the Next 8 Years: U.N.,” 2019). Microblog writing, particularly Twitter, has been considered to help express individuals’ emotions in India. However, a few occurrences of disgust, sadness, and anger were reported in Indians during the main lockdown.
In recent times, particularly in the latter half of May, when this worldwide outbreak has continually affected the lives of millions of people in many nations, and they have no other solution however to resort to overall lockdowns [10]. Such tweets create an easy way for the user to exchange and share their ideas, opinions, and points of view regarding a provided topic. Alternatively, sentiment analysis (SA) is the process of classifying and recognizing a certain text polarity regarding phrase, document, and sentence [11]. A lot of people have utilized social networks like Twitter for expressing their attitudes and opinions toward COVID19 and share their proficiencies in confronting this disease [12]. Thus, the significance of Twitter has improved ever more, and SA for Twitter data becomes hot research in data science research. Consequently, Twitter has to turn into a rich amount of data or information regarding people's opinions on COVID19 that has managed few investigators for using this data to carry out their research experiments and studies regarding COVID19. Few scientists have employed SA to study people's opinions regarding COVID19.
Gulati et al. [13] presented relative analyses of common ML based classifications. They have created investigations with the tweet datasets interrelated to the COVID19 pandemic. They have utilized 7 ML based classifications. Such classifications are employed to over 72,000 tweets interrelated to COVID19. They have executed research utilizing 3 manners i.e., Trigram, Unigram, and Bigram. According to the outcomes, Perceptron, Linear SVC, LR, and Passive Aggressive Classifier can attain the highest accuracy score in classification (trigram, unigram, bigram) and are closer to one another regarding their efficiency. Satu et al. [14] intended for designing a smart clustering based classification and topic removing module called TClustVID that analyses COVID19 interrelated public tweets for extracting substantial sentiments with higher accuracy.
Garcia et al. [15] presented a topic detection and SA for exploring a huge amount of tweets in both nations with a huge amount of mortalities and spreading by COVID-19, USA, and Brazil. In Shah et al. [16], text data have been gathered, comprising 55,612 PORs of 3430 physicians from 3 standard PRWs in the US (Vitals, RateMDs, and HealthGrades) from 01-03-2020 to 27-06-2020. An enhanced LDA based TCLDA, SA, and manual annotation tools have been employed for extracting an appropriate amount of topics, create respective keywords, allocate topic name, and define trend in the extracted topics and certain sentiments.
This paper presents a new AI based SA tool for healthcare crisis management (AISA-HCM) in smart cities. The AISA-HCM technique aims to determine the emotions of the people during the healthcare crisis time, such as COVID-19. Besides, brain storm optimization (BSO) with deep belief network (DBN), called BSO-DBN model is employed for feature extraction. Moreover, beetle antenna search with extreme learning machine (BAS-ELM) technique was utilized for classifying the sentiments as to many classes. The use of BSO and BAS algorithms helps to effectively modify the parameters involved in the DBN and ELM models respectively. The performance validation of the AISA-HCM technique takes place using Twitter data and the outcomes are examined with respect to different measures.
In short, the paper contributions can be listed as follows.
• Designs a new AI based SA tool for healthcare crisis management (AISA-HCM) in smart cities.
• Employs preprocessing in different levels such as noise removal, stemming, normalization, and tokenization.
• Aims to determine the emotions of the people during the healthcare crisis time, such as COVID-19.
• Proposes BSO-DBN model by the hyperparameter tuning of DBN model using BSO algorithm for feature extraction.
• Employs a BAS-ELM based classifier model to allocate the proper class labels of the people sentiments.
• Validate the performance of the proposed model on benchmark dataset and examine the results interms of different performance measures.
The rest of the paper is organized as follows.
This paper is structured as follows: Section 1 describes the introduction of the sentiment analysis and followed by the literature review. Next, the materials and method of our approach focus on finding the sentiments are given in Section 2. The results and discussion present the data used, and the obtained results is given in Section 3 and concluded in Section 4.
2 The Proposed Healthcare Crisis Management Model
In this study, a new AISA-HCM technique is designed to analyse people sentiments using Twitter data in the aspect of healthcare management. The working principle of the AISA-HCM technique is clearly demonstrated in Fig. 1. The proposed AISA-HCM technique involves distinct operations such as pre-processing, BSO-DBN based feature extraction, and BAS-ELM based classification. The detailed working of every module is offered in the succeeding sections.
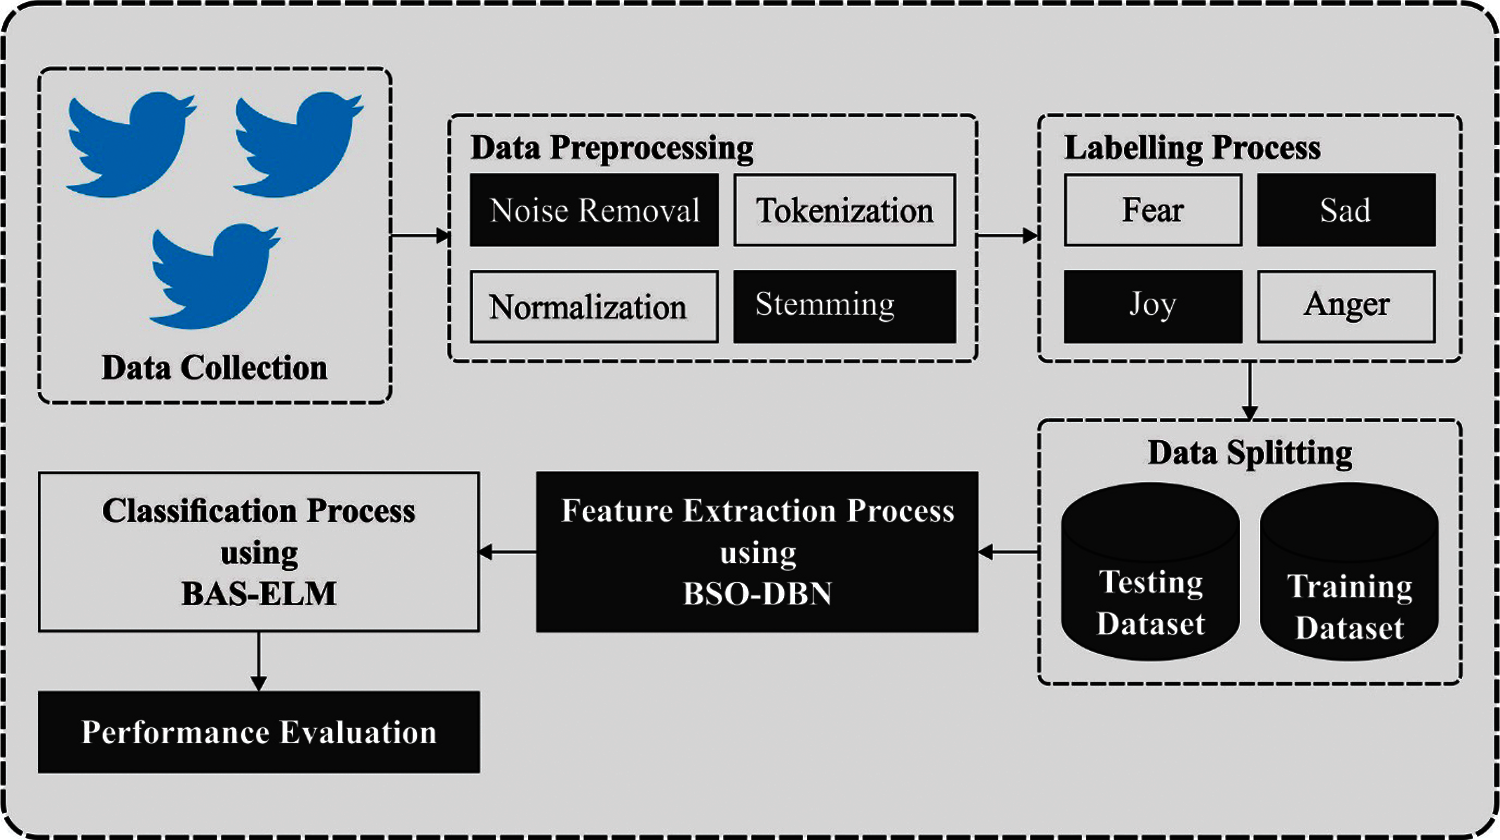
Figure 1: Overall process of proposed method
Data pre-processing is vital in some social networks based analyses scheme (for instance, SA of issuing Twitter data) as it immediately affects the efficacy of SA because of data's difficulty. Based on this work, but Twitter is regarded as gold mine of data, it can be considered as noisiest data as it has several links like hashtags, special symbols, emoji, etc. Hence, the gathered Twitter data is pre-processed utilizing the following steps: noise elimination, tokenization, normalization, and stem that are explained as follows:
Noise Removal
In this stage, the inadequate data is eliminated in the following phases:
Lower Case
The lowercase is one of the effectual methods of text pre-processing that assurances correlation within the features set and sparsity problem. For instance, CovId and CovID should be transformed to COVID-19.
Remove URL
During this stage, it can be eliminated unrelated connects embedding as to Twitter posts.
Remove Special Symbols
During this phase, it can be eliminated special symbol as punctuation.
Remove Hashtag
The Twitter hashtag is utilized for index keywords or topics on Twitter, expressed as #symbol. During this case, the important hashtags #COVID-19 and #Coronavirus are eliminated.
Remove Stop Word
The stop words are irrelevant words in language and inadequate in SA that are utilized to language grammar framework. It can be filtered out these stop words are containing article, conjunction, preposition, any pronoun, and common word like the, a, an, about, by, from, to, etc.
Tokenization
It is used for breaking extended strings of text as tokens (for instance, smaller pieces). These tokens are paragraphs which is more split as to shorter sentences that are, in turn, separated as to words. For instance, regarded as this sentence before tokenization: “hard work pays off.”
Normalization
It is used for changing a text as to typical procedure for increasing the uniformity of text pre-processing. It contains the change of every text it also upper/lower cases.
Stemming
Afterward the tokenization phase, the next phase is stemming. The stemming step was altering the word as to its original procedure (for instance, the root process for decreasing the amount of word kinds/classes in data). For sample, the expressed “Walking,” “Walked,” and “Walker” are decreased to words “walk”.
2.2 Feature Extraction: BSO-DBN Model
Once the input tweets are preprocessed, they are fed into the BSO-DBN model for feature extraction purposes. DBN comes under the family of DNN with massive hidden layers and any number of hidden units in all layers. In classic DBN is similar to RBM technique that is comprised of resultant layer. Also, the DBN executes robust, greedy unsupervised learning techniques to trained RMB and supervised fine-tuned approach for changing the model by labeled data. The RBM is comprised of visible layers
The RBM explains equivalent energy as exhibited under:
and the joint probability distribution of
But marginal probability distributions of
In order to gain optimum
where
The activation purpose is denoted as sigmoid functions [18]. In the event
In order to fine tune the hyperparameters involved in the DBN model, the BSO algorithm is utilized. The BSO method is inspired by the concept of brainstorming, and it is a broadly utilized tool for growing creativeness in the organization that has attained wider acceptance as a means of assisting creativeness [19]. In the process of BSO, initially, N concepts are arbitrarily initiated within the solution space, and later every concept is calculated based on its fitness function. Then m point of cluster center is arbitrarily chosen and initiated as N concepts, whereas m denotes lesser compared to N. As the remaining procedure in BSO could be defined below.
Clustering Individuals is a procedure of sorting equivalent objects together, and, in all generations, each idea is re clustered to m clusters based on the concept (or individual) features. K means is one of the common methods utilized in clustering; here it is utilized in clustering process. The cluster center disrupting process arbitrarily selects a cluster center and substitutes by a recently created concept with a likelihood of
For maintaining the population diversity, a novel concept (individual) could be produced on the basis of one idea or 2 in 1 cluster or 2, correspondingly. Later, based on the selecting of 1 cluster or 2, the concept of cluster center or an arbitrary concept is chosen by a likelihood of
Whereas rand denotes an arbitrary value among zero and one. Afterward selecting one idea or two, the chosen idea(s) is upgraded based on
Whereas
Whereas rand denotes an arbitrary value among zero and one. The current iteration and
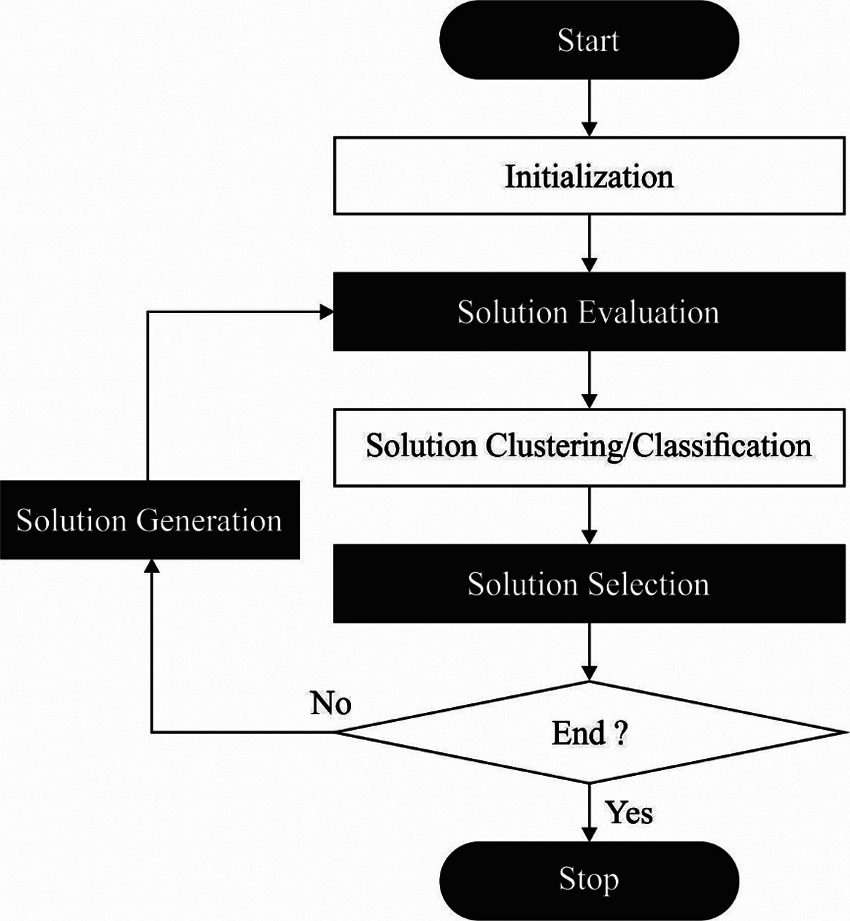
Figure 2: Flowchart of bso
2.3 Data Classification: BAS-ELM Model
During the data classification process, the BAS-ELM model receives the feature vectors as input and determines the appropriate class labels of sentiments. At this point, ELM is established by G. B. Huang that is included with 3 important layers. Assume that size of trained data is
where
where
where
Therefore, the resultant weight
where
The adding of training ELM network uses for computing the output weight
Usually, the actual ELM approach doesn't need training hidden layer bias and input weight. But, the ELM is able of decreasing the processing time, it restricts the consistency and working function. The location communication to different particles develops robust, and MBAS has adjustable to complex optimizing problems. It can be recognized with new kinds of ELM like MBAS-ELM. An important objective of MBAS-ELM is to elect important FF for processing the implemented process. For developing the stable networks, four approaches like RMSE,
where
where
Also, the norm of output weights
where
where
The presented technique is simulated utilizing Twitter dataset. The performance of the presented techniques has been investigated under different aspects.
Fig. 3 demonstrates the set of confusion matrices produced by the proposed model under distinct runs. On the execution of run-1, the proposed model has classified a set of 110 instances into fear, 95 instances into sad, 102 instances into anger, and 98 instances into joy. Likewise, on the execution of run-2, the presented technique has classified a set of 110 instances into fear, 91 instances into sad, 95 instances into anger, and 94 instances into joy. Similarity, on the execution of run-3, the projected manner has classified a set of 110 instances into fear, 93 instances into sad, 111 instances into anger, and 93 instances into joy. Eventually, on the execution of run-4, the proposed methodology has classified a set of 113 instances into fear, 115 instances into sad, 100 instances into anger, and 107 instances into joy. Meanwhile, on the execution of run-5, the presented method has classified a set of 116 instances into fear, 115 instances into sad, 101 instances into anger, and 101 instances into joy.
Tab. 1 examines the classification results analysis of the AISA-HCM with existing techniques under diverse runs. From the table values, it can be evident that the proposed AISA-HCM manner has accomplished maximal classification performance under diverse runs.
On the execution run 1, the AISA-HCM technique has classified the instances into fear class with the prec. of 0.803, rec. of 0.859, and F1-score of 0.830. Besides, the AISA-HCM technique has classified the instances into sad class with the prec. of 0.856, rec. of 0.826, and F1-score of 0.841. Likewise, the AISA-HCM technique has classified the instances into anger class with the prec. of 0.843, rec. of 0.887, and F1-score of 0.864. At last, the AISA-HCM technique has classified the instances into joy class with the prec. of 1.000, rec. of 0.899, and F1-score of 0.947. Next to that, on the execution run 2, the AISA-HCM technique has classified the instances into fear class with the prec. of 0.733, rec. of 0.859, and F1-score of 0.791. In addition, the AISA-HCM technique has classified the instances into sad class with the prec. of 0.820, rec. of 0.791, and F1-score of 0.805. Also, the AISA-HCM technique has classified the instances into anger class with the prec. of 0.941, rec. of 0.826, and F1-score of 0.880. Finally, the AISA-HCM technique has classified the instances into joy class with the prec. of 0.895, rec. of 0.862, and F1-score of 0.879.
Simultaneously, on the execution run 3, the AISA-HCM technique has classified the instances into fear class with the prec. of 0.880, rec. of 0.859, and F1-score of 0.870. Additionally, the AISA-HCM technique has classified the instances into sad class with the prec. of 0.782, rec. of 0.809, and F1-score of 0.795. Furthermore, the AISA-HCM technique has classified the instances into anger class with the prec. of 0.925, rec. of 0.965, and F1-score of 0.945. At last, the AISA-HCM technique has classified the instances into joy class with the prec. of 0.903, rec. of 0.853, and F1-score of 0.877. On the execution run 4, the AISA-HCM technique has classified the instances into fear class with the prec. of 0.983, rec. of 0.883, and F1-score of 0.930. Besides, the AISA-HCM technique has classified the instances into sad class with the prec. of 0.810, rec. of 1.000, and F1-score of 0.895. Likewise, the AISA-HCM technique has classified the instances into anger class with the prec. of 0.971, rec. of 0.870, and F1-score of 0.917. At last, the AISA-HCM technique has classified the instances into joy class with the prec. of 1.000, rec. of 0.982, and F1-score of 0.991. At last, on the execution run 5, the AISA-HCM technique has classified the instances into fear class with the prec. of 1.000, rec. of 0.906, and F1-score of 0.951. Besides, the AISA-HCM technique has classified the instances into sad class with the prec. of 0.827, rec. of 1.000, and F1-score of 0.906. Likewise, the AISA-HCM technique has classified the instances into anger class with the prec. of 0.910, rec. of 0.878, and F1-score of 0.894. At last, the AISA-HCM technique has classified the instances into joy class with the prec. of 1.000, rec. of 0.928, and F1-score of 0.928.
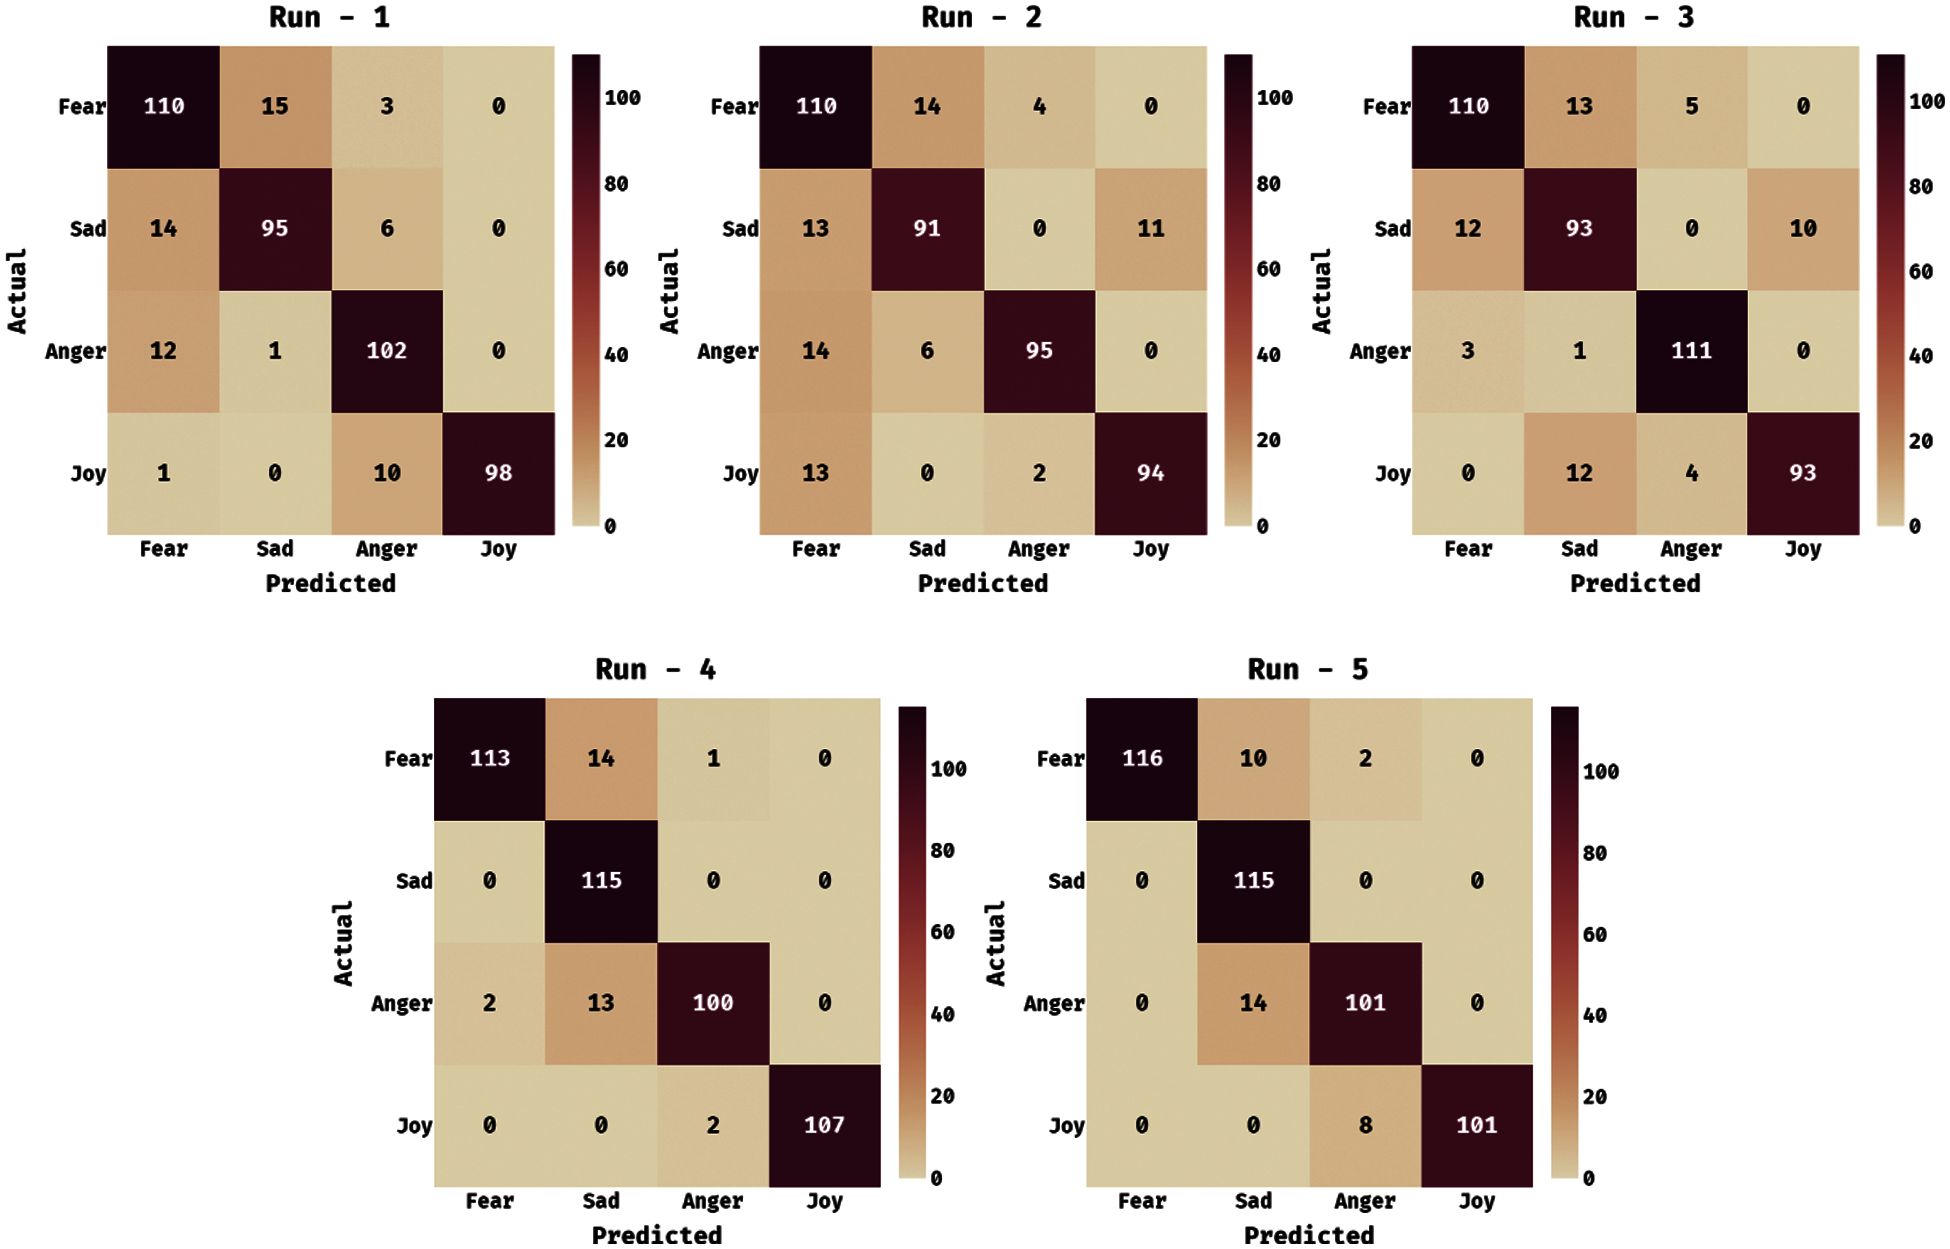
Figure 3: Confusion matrix analysis of AISA-HCM model
Fig. 4 and Tab. 2 investigate the average classification results analysis of the AISA-HCM technique under various runs. The figure depicted that the AISA-HCM technique has gained effectual outcomes under all the runs. For instance, under run-1, the AISA-HCM technique has resulted in a maximum average acc. of 0.934, prec. of 0.875, rec. of 0.868, and F-measure of 0.871. Next to that, under run-2, the AISA-HCM approach has resulted in a maximal average acc. of 0.918, prec. of 0.847, rec. of 0.835, and F-measure of 0.839. In line with, under run-3, the AISA-HCM manner has resulted in a higher average acc. of 0.936, prec. of 0.872, rec. of 0.872, and F-measure of 0.872. Simultaneously, under run-4, the AISA-HCM method has resulted in increased average acc. of 0.966, prec. of 0.941, rec. of 0.934, and F-measure of 0.933. Concurrently, under run-5, the AISA-HCM methodology has resulted in improved average acc. of 0.964, prec. of 0.934, rec. of 0.928, and F-measure of 0.964.

In order to ensure the improved classification results analysis of the AISA-HCM technique, a detailed comparison study is made in Tab. 3. From the obtained values, it is evident that the DT technique has attained lower performance with the prec. of 0.84, rec. of 0.83, F-measure of 0.83, and acc. of 0.83. Followed by, the XGBoost and SVC techniques have accomplished slightly improved and identical outcomes with the prec. of 0.85, rec. of 0.85, F-measure of 0.85, and acc. of 0.85. Likewise, the RF approach has showcased moderate outcomes with the prec. of 0.88, rec. of 0.85, F-measure of 0.86, and acc. of 0.86. Next to that, the Extra TC technique has reported competitive performance with the prec. of 0.89, rec. of 0.88, F-measure of 0.88, and acc. of 0.88. However, the proposed AISA-HCM technique has surpassed all the other techniques with the maximum prec. of 0.89, rec. of 0.88, F-measure of 0.89, and acc. of 0.94.
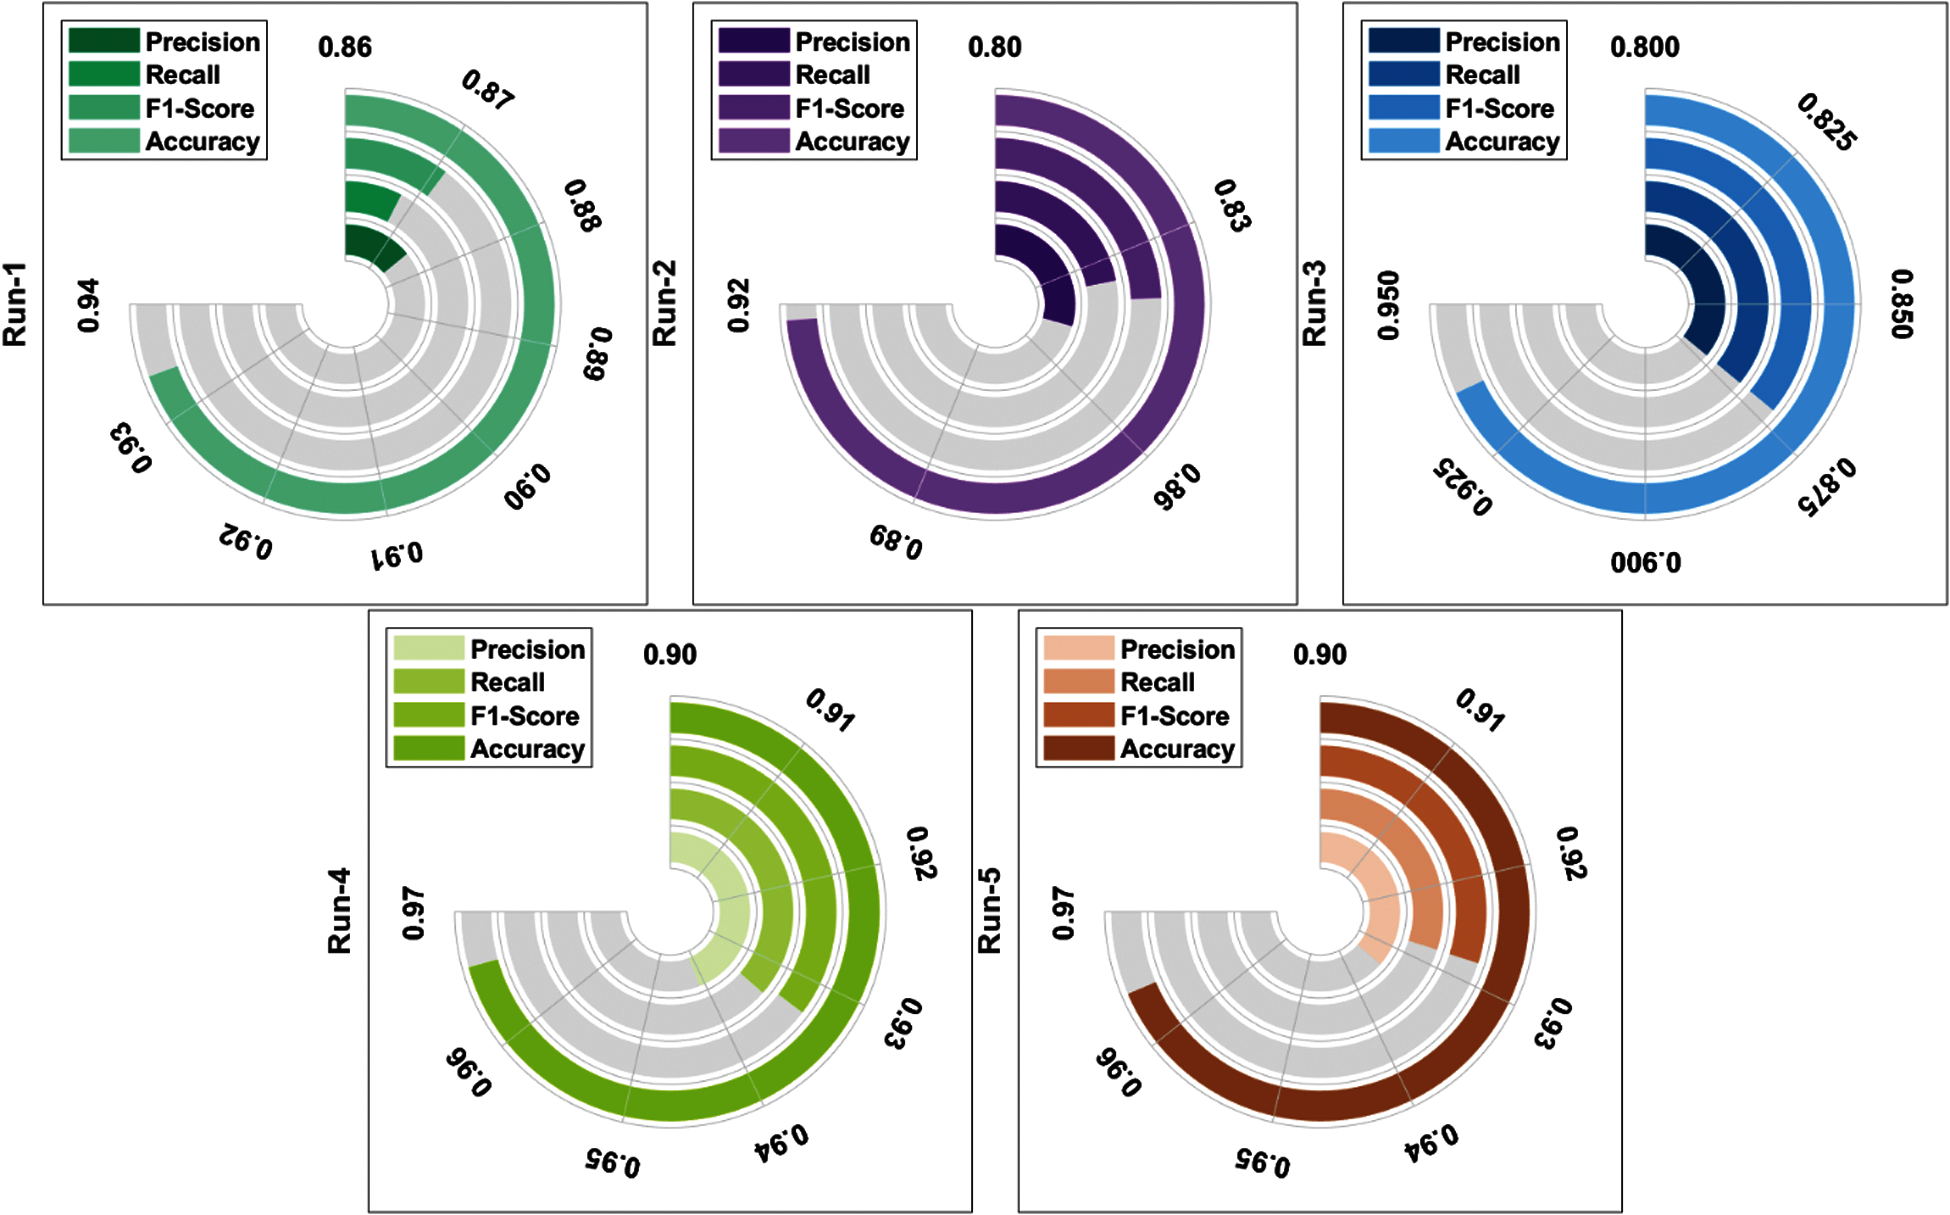
Figure 4: Result analysis of AISA-HCM model


This paper has developed a new AISA-HCM technique to determine the emotions of the people during the healthcare crisis time, such as COVID-19. The proposed AISA-HCM technique involves distinct operations such as pre-processing, BSO-DBN based feature extraction, and BAS-ELM based classification. Primarily, the Twitter data is pre-processed utilizing the following steps: noise elimination, tokenization, normalization, and stemming. When the input tweets are preprocessed, they are fed into the BSO-DBN model for feature extraction purposes. During the data classification process, the BAS-ELM model receives the feature vectors as input and determines the appropriate class labels of sentiments. The utilization of BSO and BAS algorithms helps to commendably modify the parameters involved in the DBN and ELM models respectively. The performance validation of the AISA-HCM technique takes place using Twitter data and the outcomes are examined with respect to different measures. The experimental outcomes highlighted the enhanced performance of AISA-HCM technique over the recent state of art SA approaches. In future, the presented model can be extended to the use of feature selection and outlier detection techniques.
Funding Statement: The authors extend their appreciation to the Deanship of Scientific Research at King Khalid University for funding this work under Grant Number (RGP 1/147/42), Received by Fahd N. Al-Wesabi. https://www.kku.edu.sa. This research was funded by the Deanship of Scientific Research at Princess Nourah bint Abdulrahman University through the Fast-Track Path of Research Funding Program.
Conflicts of Interest: The authors declare that they have no conflicts of interest to report regarding the present study.
1. N. Jain, S. Jhunthra, H. Garg, V. Gupta, S. Mohan et al., “Prediction modelling of COVID using machine learning methods from B-cell dataset,” Results in Physics, vol. 21, pp. 103813, 2021. [Google Scholar]
2. S. K. Lakshmanaprabu, K. Shankar, R. S. Sheeba, A. Enas, N. Arunkumar et al., “An effect of big data technology with ant colony optimization based routing in vehicular ad hoc networks: Towards smart cities,” Journal of Cleaner Production, vol. 217, pp. 584–593, 2019. [Google Scholar]
3. S. Chawla, M. Mittal, M. Chawla and L. Goyal, “Corona virus - sars-cov-2: An insight to another way of natural disaster,” EAI Endorsed Transactions on Pervasive Health and Technology, vol. 6, no. 22, pp. 164823, 2020. [Google Scholar]
4. K. Shankar, E. Perumal, P. Tiwari, M. Shorfuzzaman and D. Gupta, “Deep learning and evolutionary intelligence with fusion-based feature extraction for detection of COVID-19 from chest X-ray images,” Multimedia Systems, pp. 102258–102266, 2021. [Google Scholar]
5. G. Mertens, L. Gerritsen, S. Duijndam, E. Salemink and I. M. Engelhard, “Fear of the coronavirus (COVID-19Predictors in an online study conducted in march 2020,” Journal of Anxiety Disorders, vol. 74, pp. 102258, 2020. [Google Scholar]
6. V. Gupta, N. Jain, P. Katariya, A. Kumar, S. Mohan et al., “An emotion care model using multimodal textual analysis on covid-19,” Chaos, Solitons & Fractals, vol. 144, pp. 110708, 2021. [Google Scholar]
7. N. Donthu and A. Gustafsson, “Effects of COVID-19 on business and research,” Journal of Business Research, vol. 117, pp. 284–289, 2020. [Google Scholar]
8. P. Staszkiewicz, I. C. Orsa and I. Staszkiewicz, “Dynamics of the covid-19 contagion and mortality: Country factors, social media, and market response evidence from a global panel analysis,” IEEE Access, vol. 8, pp. 106009–106022, 2020. [Google Scholar]
9. D. A. Pustokhin, I. V. Pustokhina, P. N. Dinh, S. V. Phan, G. N. Nguyen et al., “An effective deep residual network based class attention layer with bidirectional LSTM for diagnosis and classification of COVID-19,” Journal of Applied Statistics, vol. 2020, pp. 1–18, 2020. [Google Scholar]
10. N. Jain, V. Gupta, S. Shubham, A. Madan, A. Chaudhary et al., “Understanding cartoon emotion using integrated deep neural network on large dataset,” Neural Computing and Applications, vol. 10, pp. 1–21, 2021. [Google Scholar]
11. K. Shankar and E. Perumal, “A novel hand-crafted with deep learning features based fusion model for COVID-19 diagnosis and classification using chest X-ray images,” Complex and Intelligent Systems, vol. 7, no. 3, pp. 1277–1293, 2021. [Google Scholar]
12. N. F. F. da Silva, L. F. S. Coletta, E. R. Hruschka and E. R. Hruschka, “Using unsupervised information to improve semi-supervised tweet sentiment classification,” Information Sciences, vol. 355–356, pp. 348–365, 2016. [Google Scholar]
13. K. Gulati, S. S. Kumar, R. S. K. Boddu, K. Sarvakar, D. K. Sharma et al., “Comparative analysis of machine learning-based classification models using sentiment classification of tweets related to COVID-19 pandemic,” Materials Today: Proceedings, vol. 364, pp. 1–4, 2021. [Google Scholar]
14. M. S. Satu, M. I. Khan, M. Mahmud, S. Uddin, M. A. Summers et al., “TClustVID: A novel machine learning classification model to investigate topics and sentiment in COVID-19 tweets,” Knowledge-Based Systems, vol. 226, pp. 107126, 2021. [Google Scholar]
15. K. Garcia and L. Berton, “Topic detection and sentiment analysis in twitter content related to COVID-19 from Brazil and the USA,” Applied Soft Computing, vol. 101, pp. 107057, 2021. [Google Scholar]
16. A. M. Shah, X. Yan, A. Qayyum, R. A. Naqvi and S. J. Shah, “Mining topic and sentiment dynamics in physician rating websites during the early wave of the COVID-19 pandemic: Machine learning approach,” International Journal of Medical Informatics, vol. 149, pp. 104434, 2021. [Google Scholar]
17. J. Yu and G. Liu, “Knowledge-based deep belief network for machining roughness prediction and knowledge discovery,” Computers in Industry, vol. 121, pp. 103262, 2020. [Google Scholar]
18. Y. Jia, J. Wu and M. Xu, “Traffic flow prediction with rainfall impact using a deep learning method,” Journal of Advanced Transportation, vol. 2017, pp. 1–10, 2017. [Google Scholar]
19. Z. Cao, X. Hei, L. Wang, Y. Shi and X. Rong, “An improved brain storm optimization with differential evolution strategy for applications of ANNs,” Mathematical Problems in Engineering, vol. 2015, pp. 1–18, 2015. [Google Scholar]
20. S. Chen, C. Gu, C. Lin, Y. Wang and M. A. H. Ardebili, “Prediction, monitoring, and interpretation of dam leakage flow via adaptative kernel extreme learning machine,” Measurement, vol. 166, pp. 108161, 2020. [Google Scholar]
 | This work is licensed under a Creative Commons Attribution 4.0 International License, which permits unrestricted use, distribution, and reproduction in any medium, provided the original work is properly cited. |