DOI:10.32604/cmc.2022.021756
| Computers, Materials & Continua DOI:10.32604/cmc.2022.021756 | |
| Article |
Clustering Indoor Location Data for Social Distancing and Human Mobility to Combat COVID-19
1School of Information Technology, Monash University Malaysia, Jalan Lagoon Selatan, Bandar Sunway, 47500, Selangor Darul Ehsan, Malaysia
2Faculty of Engineering, Multimedia University, Persiaran Multimedia, Cyberjaya, 63100, Selangor Darul Ehsan, Malaysia
*Corresponding Author: Chee Keong Tan. Email: tan.cheekeong@monash.edu
Received: 13 July 2021; Accepted: 27 August 2021
Abstract: The world is experiencing the unprecedented time of a pandemic caused by the coronavirus disease (i.e., COVID-19). As a countermeasure, contact tracing and social distancing are essential to prevent the transmission of the virus, which can be achieved using indoor location analytics. Based on the indoor location analytics, the human mobility on a site can be monitored and planned to minimize human’s contact and enforce social distancing to contain the transmission of COVID-19. Given the indoor location data, the clustering can be applied to cluster spatial data, spatio-temporal data and movement behavior features for proximity detection or contact tracing applications. More specifically, we propose the Coherent Moving Cluster (CMC) algorithm for contact tracing, the density-based clustering (DBScan) algorithm for identification of hotspots and the trajectory clustering (TRACLUS) algorithm for clustering indoor trajectories. The feature extraction mechanism is then developed to extract useful and valuable features that can assist the proposed system to construct the network of users based on the similarity of the movement behaviors of the users. The network of users is used to model an optimization problem to manage the human mobility on a site. The objective function is formulated to minimize the probability of contact between the users and the optimization problem is solved using the proposed effective scheduling solution based on OR-Tools. The simulation results show that the proposed indoor location analytics system outperforms the existing clustering methods by about 30% in terms of accuracy of clustering trajectories. By adopting this system for human mobility management, the count of close contacts among the users within a confined area can be reduced by 80% in the scenario where all users are allowed to access the site.
Keywords: Indoor location analytics; COVID-19; contact tracing; social distancing; spatial-temporal dimensions; human mobility
For over a year now, the severe acute respiratory syndrome coronavirus 2 (SARS-CoV-2) virus has been the main concern of humanity as an infectious agent for the notorious coronavirus disease (COVID-19). The disease was first identified and recorded in December 2019 and has since spread to all over the world mainly through person-to-person transmission. This unprecedented situation of the pandemic has forcefully changed the lifestyles of the human race, exemplified by activities such as sanitization, contact tracing, social distancing and wearing masks. It is possible that the disease can spread by airborne transmission, especially in enclosed spaces with poor ventilation [1]. Recognizing this and the fact that most people spend most of their time indoors, precautions in indoor spaces should be taken more seriously.
Over the past year, many researchers and indoor positioning service providers have the same interest in the application of indoor positioning to combat COVID-19. As a consequence of this rising concern, contact tracing applications [2,3] or exposure notification systems [4] have become a popular solution to, if not prevention, containment of the virus. However, one major issue is the accuracy and efficiency of contact tracing [5], which renders public indifference or distrust. The accuracy and efficiency issue has been the main research limitation in [5] in which numerous solutions have been proposed to overcome this issue.
Indoor location analytics has been adopted in various domains, and has had many beneficial uses, such as for navigation, location-based services and understanding of customer’s behaviors. These applications allow retailers, advertisers or service providers to target and engage customers more effectively. This paper aims to develop an indoor location analytical system by bridging the gap between contact tracing and indoor location analytics. Many works concentrate on techniques and system architectures of a contact tracing application without utilizing the indoor positioning data, while this paper studies and experiments the application of indoor location analytics to aid in contact tracing with respect to the pandemic. Further analytics are performed to generate suggestions so as to improve the practice of social distancing and effective sanitization.
In this paper, we propose an analytical system that clusters spatial data, spatio-temporal data and movement behavior features for the application of contact tracing to enforce effective social distancing and optimize human mobility, which have not been researched and studied before to combat the transmission of the COVID-19 virus. For contact tracing application, a proximity detection algorithm termed the Coherent Moving Cluster (CMC) algorithm [6] is utilized. Instead of implementing the CMC algorithm in an offline mode, the algorithm is modified to be an online proximity detection to improve the detection accuracy. The conventional CMC algorithm suffers from high inaccuracy due to the fluctuation and variation of wireless signals (in this work, the signals refer to Wi-Fi signal strengths) and limitations to freedom in movements in an indoor environment. The analytics of the indoor positioning data is conducted by using the clustering algorithms to identify the hotspots. In order to achieve accurate hotspot identification, the location points are clustered using the proposed modified density-based spatial clustering (DBScan) algorithm [7] in the spatial dimensions and the trajectories of the movement are clustered using the proposed amended trajectory clustering (TRACLUS) algorithm [8] algorithm in the spatio-temporal dimensions. Both the original DBScan and TRACLUS algorithms have the same limitations in proximity detection because they were not designed to function based on the Wi-Fi signals and both the algorithms cannot adapt well with the freedom of movement, leading to inaccurate detection. Therefore, in this work, the DBScan is modified to cluster the location data points with more stringent conditions to overcome the aforementioned issues. Besides, to model the analyze the location data in spatio-temporal dimensions, trajectories are extracted from raw location points so that successive location points to interpolate the trajectories of movement. With limited freedom of movement in an indoor environment, the original TRACLUS algorithm produces invalid partitioned trajectories. In this work, the TRACLUS algorithm is modified by introducing a new controlling parameters, named as the restriction of movement to increase the stringency of the condition to tackle the problem.
Once the clustering is done, the features of movement are extracted effectively and the features are converted into term frequency-inverse document frequency (TF-IDF) features. Based on the similarity between the movement behaviors resulted from the features, a network of users is created which can be used for better planning of subsets of users to be allowed on the site on different days. Based on the network, an optimization problem can be formulated by minimizing the probability of contact between the users and the minimization can be solved using the proposed scheduling algorithm. In short, the main contributions of this paper can be summarized as follows:
1. A novel indoor analytical system is proposed to analyze the collected location data points. The system is able to clusters spatial data, spatio-temporal data and movement behavior features for proximity detection or contact tracing application.
2. With the location data points, a new DBScan algorithm is proposed to cluster the data points in a spatial domain whereas another novel TRACLUS algorithm is proposed to cluster the trajectories of movement in a spatio-temporal domain, so as to produce accurate and precise hotspot identification.
3. The feature extraction mechanism is developed to extract useful and valuable features that can assist the system to construct the network of users based on the similarity of the movement behaviors of the users.
4. The network of users is used to formulate an optimization problem to manage the human mobility on a site. The objective function is proposed to minimize the probability of contact between the users and the optimization problem is solved using the proposed effective scheduling solution based on OR-Tools.
With the proposed system, an effective contact tracing method can be facilitated which can help to identify the hotspots and assist to optimize human mobility on a site to combat the COVID-19.
The remaining sections of the paper are organized as follows. The related works pertinent to the contact tracing, indoor location analytics, clustering, social distancing and human mobility are discussed in Section 2. The proposed indoor location analytics system is discussed in Section 3 where the novel method incorporating the CMC, DBScan and TRACLUS algorithm is developed. Next, Section 4 shows all the important simulation results together with in-depth analytical discussions. Last but not least, the paper ends with some insightful concluding remarks and navigate the readers to some possible future research direction related to this work in Section 5.
The nature of contact tracing is somewhat similar to that of proximity sensing, which is to identify devices that have come in contact with each other. Conventional methods for contact tracing that rely on human memory and manpower although produces incomplete lists of contacts, but has proven to be effective. As digital technology comes into picture, methods used for contact tracing are such as magnetic field [9], ultrasound [10], ultra-wideband (UWB) [11], Wi-Fi [12,13], with Bluetooth Low Energy (BLE) [14,15] more acclaimed than the others. Magnetic field, ultrasound and UWB used for contact tracing require to set up expensive systems, even though they can ensure high localization accuracy. Wi-Fi becomes a popular alternative as it is ubiquitous, which does not necessitate a separate infrastructure. Recently, BLE-based architecture was preferred due to its availability in smartphones, ubiquity of smartphones and privacy-preserving nature [16].
All contact tracing applications thus far summarized specifically for COVID-19 uses the decentralized architecture because of privacy and security concerns [1,2]. Decentralized implementation leads to several limitations such as low computational power, lack of comprehensive indoor data, susceptibility to noise and low robustness. This paper on the other hand, reports the methodology to analyze positions of individuals, which is based upon a centralized indoor positioning system. We see the promising variability in analytics and assessments that could be done other than contact tracing in such location-based systems. They also overcome the limitations in computing power of devices to conduct comprehensive analysis of data. These advantages could be more evident in a setting where a corporate or a building have an indoor positioning system in place.
The application of indoor location analytics is continuously expanding and becoming more pertinent, especially in large buildings like airports and shopping malls. In particular, businesses have found location aware systems (LAS) and location-based services (LBS) valuable in different spaces and contexts such as targeted advertising [17,18], navigation [19], object tracking [20], and less popularly for entertainment [21]. Moving into the current state of emergency, indoor location analytics can play an important role in contact tracing [22] and also for contact tracing and social distancing purposes to combat infectious diseases.
Central to location analytics is to address the modelling of geospatial data. A geographic information system (GIS) has been adopted by researchers in various domains, to deal with geospatial data and yield information out of these data. A non-exhaustive list of such domains includes site selection [23], traffic control [24] and medical field [25]. GIS was used extensively in macro-scale outdoor environments. In recent years, researchers have presented the application of GIS in micro-scale indoor environments [26,27] and even a conglomerate of indoor and outdoor spaces [28]. Recently, due to the advancement of indoor localization techniques, large volume of indoor location datasets is available for indoor analytics. In this paper, indoor location data is analyzed through clustering algorithms to predict the “hotspots” and trajectories of human movement to implement contact tracing.
Clustering in the spatial dimension is straightforward and is usually similar to standard clustering methods. Generally, DBScan [7] has been used for location data that contains regions with scarce data as it can handle noise well. The algorithm was adopted to find high dense regions using aggregated data, to reveal places which are more likely to be visited [29–31]. In contrast, clustering in the spatio-temporal dimension is more complex and data are typically expressed in different forms, such as geo-referenced variables, moving objects and trajectories [32]. This paper focuses on moving objects that provide snapshots of data at certain points of time, and trajectories that provide collections of locations that were visited by an identifiable object following a timeline.
Clustering moving objects provides the ability to effectively detect in real-time, users who are too close to each other. Although several algorithms have been proposed long since the emergence of Global Positioning System (GPS), they are still relevant in indoor location analytics as it is a smaller scale of outdoor location analytics. Many works proposed algorithms to split and merge clusters, taking into consideration attributes such as positions, velocities, directions of movement and movement patterns [6,33–35]. Because of the focus on proximity detection for contact tracing, it was expected that the CMC algorithm [6], which is largely based on DBScan, would be the most suitable option among all other algorithms studied. In the studies, it has been validated that the CMC and DBScan can provide a high accuracy for proximity detection with minimal false alarms.
Clustering trajectories are often used to monitor traffic and to understand movement behaviors. A central aspect of clustering trajectories is the definition of similarity measure, wherein most similarity measures for textual data appear to be well-suited, including Edit Distance on Real Sequence (EDR), Euclidean distance, Dynamic Time Warping (DTW), Longest Common Subsequences (LCSS), Hausdorff distance and HU distance [36–38]. The applications focused by prior surveys differ and thus, their evaluation results disagree with each other. For instance, Morris et al. [37] found that LCSS performed better on full un-sampled trajectories due to its ability to ignore outliers, yet Principal Components Analysis (PCA) combined with Euclidean distance performed better in outdoor surveillance scenes [36]. However, most of these measures require similar-length trajectories, while others are sensitive to the source and destination of trajectories. As far as these problems are concerned, the TRACLUS algorithm, which is based on a partition-and-group framework, is a good measure, as its main objective is to extract segments of full trajectories that match with other sub-trajectories. This paper explores the usage of EDR [39], LCSS and TRACLUS as similarity measures to cluster trajectories.
Another aspect in which the location data can be clustered is by extracting mobility features [40,41] and cluster users based on their mobility or movement behaviors. High-levels location features, such as the duration of visits, the number of locations or rooms visited, the number of floors visited, can be extracted from raw location coordinates data; low-levels location features, such as the probability of visiting a room, can be extracted to provide more detailed behavior. This kind of feature extraction techniques provide a more sensible movement behavior, not just purely looking at the trajectories of movements but also taking into account the rational human mobility behavior.
2.4 Social Distancing and Human Mobility Management
To combat the COVID-19 effectively, one of the mechanism is to enforce social distancing among human in an enclosed area. It is already proven that social distancing [42] is effective to combat the spread of the COVID-19 virus, particularly in an enclosed area. There are comprehensive research and study that have been conducted to ensure efficient social distance between humans. In [43], social distancing and self-isolation management has been implemented using the machine-to-machine technology. In this work, the authors propose a smart wristband incorporated with Bluetooth beacon technology to enable contact tracing. However, the main limitation of the proposed implementation is the accuracy of proximity detection. In [44], a deep-convolutional neural network (CNN) crowd counting model is developed to enforce social distancing and manage the crowd. This paper proposes a novel method for crowd counting in highly and lowly crowded places under various scene conditions without any prior knowledge. The method is developed based on CNN which can accept arbitrary image sizes and scales to produce accurate crowd counting results. With this, the density map can be generated and social distancing can be enforced. Nevertheless, the adoption of CNN requires a huge dataset for training phase in order to produce efficient contact tracing. The time-consuming training process not only incurs higher costs for data collection, but also has a high complexity during the detection phase. Unlike the prior work on contact tracing and social distancing which utilize the instantaneous indoor location data, this paper suggests an indoor location analytics which clusters the indoor location data to get insightful information about the movement behaviors of human. To the best of our knowledge, there is no prior research work on using indoor location analytics to enable contact tracing for social distancing application.
3 The Proposed Indoor Location Analytical System
In this section, a novel indoor location data analytics system is presented for effective contact tracing and social distancing within a building. Section 3.1 describes the implementation of an offline CMC algorithm, as well as the modification of the offline algorithm into an online proximity detection algorithm. Then in Section 3.2, the analytical process of the location data in the spatial and the spatio-temporal dimensions is presented, particularly by clustering. The clustering results lead to the identification of areas of interest (or “hotspots”). Subsequently, in Section 3.3, the techniques used for feature extraction and to distinguish the movement patterns between users are discussed. Our motivation for extracting movement behaviors of users is to schedule users’ access to the site for effective social distancing and manage human mobility within the site, by formulating a scheduling optimization problem, in Section 3.4.
The UjiIndoorLoc dataset [45] is especially chosen for the demonstration of the proposed analytical system because it contains movement data of 19 users in multi-floor buildings. Most other indoor location datasets are collected for fingerprinting purposes, including the UjiIndoorLoc dataset, but the users in the UjiIndoorLoc dataset moved in a way such that they form trajectories which is true to the building structure.
3.1 An Online Coherent Moving Cluster Algorithm for Proximity Detection
In 2009, Jeung et al. [6] proposed the CMC algorithm which is based on DBScan. The CMC algorithm takes a snapshot of the location of moving objects at certain points of time, then finds convoys, which are clusters of moving objects in proximity, by using the DBScan algorithm. Although the algorithm could be directly used for the contact tracing application, doing so would yield inaccurate results due to the volatility of wireless signals and limitations to freedom in movements in an indoor environment. Thus, some additional steps are proposed, and stricter conditions are used for the definition of a convoy in an indoor environment.
At each iteration of the CMC algorithm, along with the active convoys detected at the previous timestamp, V, a copy of the snapshot of locations of moving objects at the previous timestamp, Ot−1 is kept to retrieve the last detected location of lost moving objects, lost_users, allowing a time buffer for lost signals or unstable signal strengths. Apart from the distance threshold as proposed in the CMC algorithm, objects should also be in the same room or space to be clustered in the same convoy. Specifically, the geodesic distance is used as a similarity measure. In addition, the distance threshold e is added to the distance if two locations are located in different rooms so that they will not be clustered into the same group using the DBScan algorithm
where o1 and o2 are location points of two objects while r1 and r2 are the associated rooms of each location point.
Algorithm 1 presents the newly proposed online CMC algorithm, where the object count threshold m and the distance threshold e are parameters to be passed to the DBScan algorithm embedded in the CMC algorithm, while the minimum lifetime k is the minimum duration of the lifetime of a cluster to be considered a convoy. The minimum lifetime k is also the minimum amount of time for objects to be in proximity before they are being alerted in our implementation, but an extra parameter could be added to differentiate the two definitions. At initialization, Ot−1 and V are created as empty sets. Considering the application of the proximity detection algorithm for enforcing social distancing, the definition of close contact according to the Centers of Disease Control and Prevention (CDC) of the United States [46] is referred. They define close contact as “any individual within 6 feet of an infected person for a total of 15 min or more over a 24-h period”. Thus, the value of m is set to 2, k to 10 min and e to 1.5 m to achieve the aforementioned conditions of close contact.
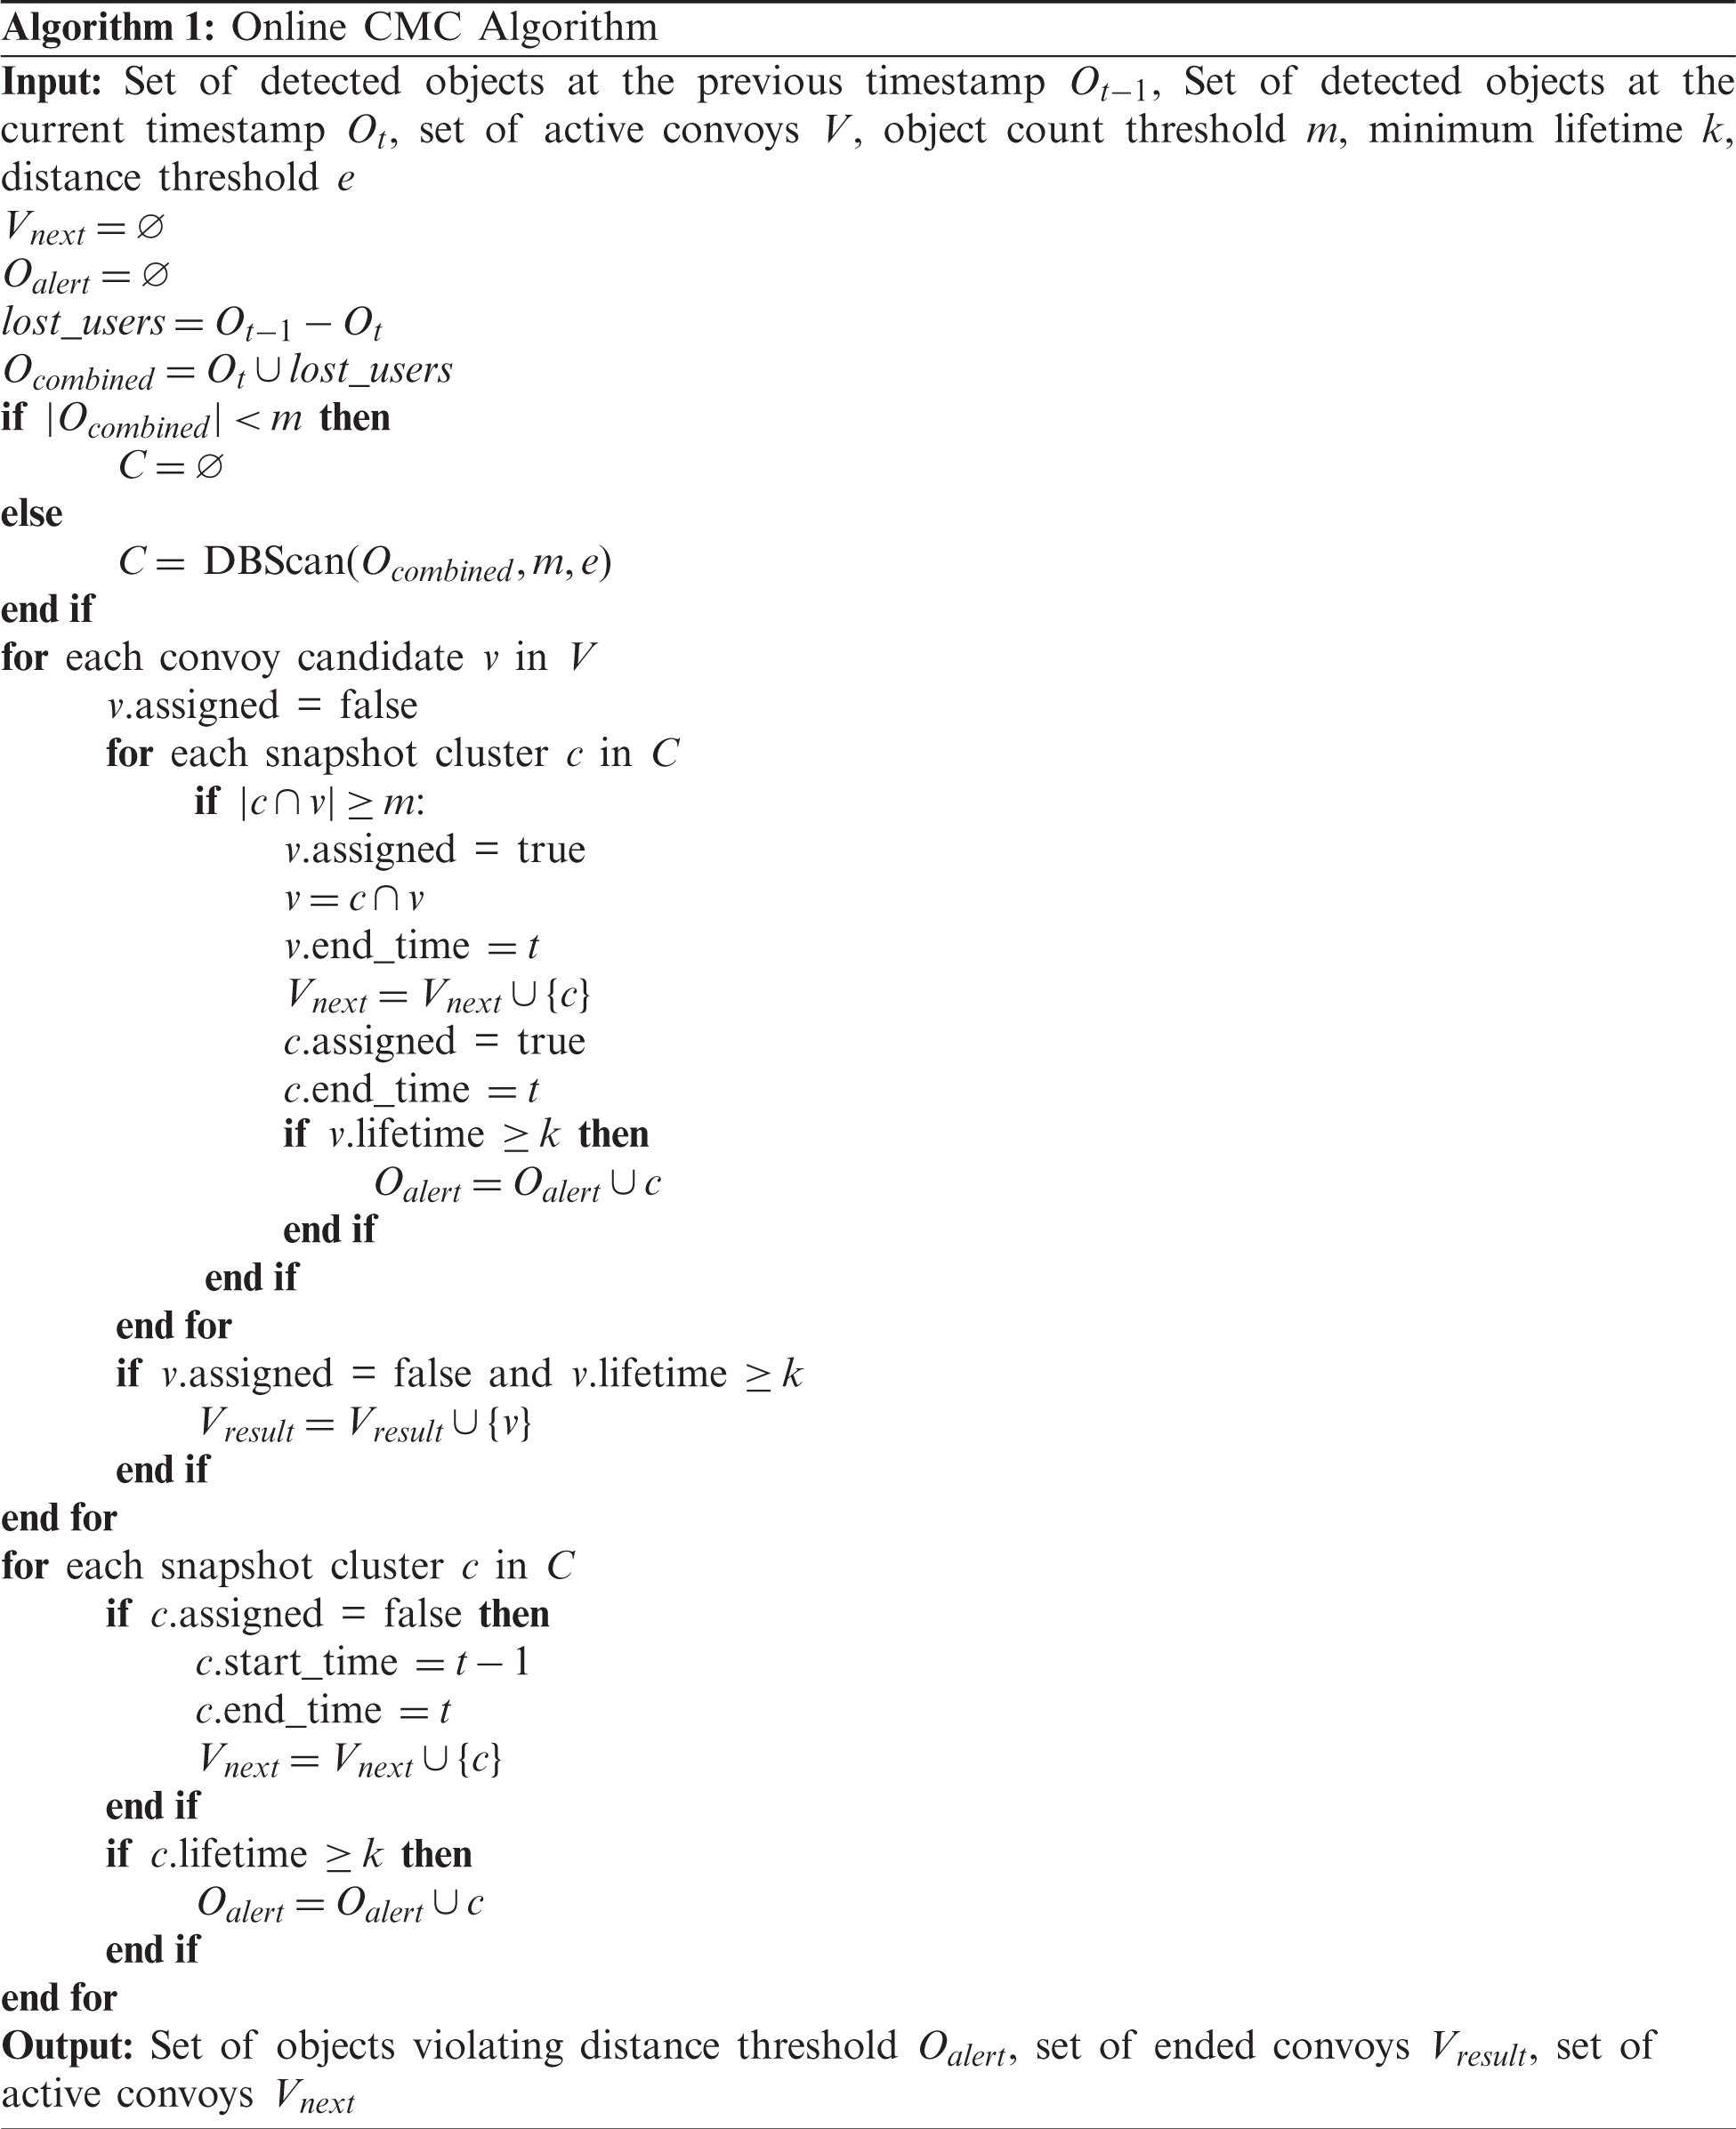
To use the online CMC algorithm, the snapshots of objects could be provided at every fixed time interval. Multiple locations of the same object may be recorded during the time interval, and one record is extracted by either using the last detected location, which requires less computation time, or using the (weighted) average of all detected locations within the interval, which would have a smoothing effect on fluctuating signal strength values. The outputs of the online CMC algorithm include the set of objects within the distance threshold to other objects, O_alert. As the name suggests, objects or users in this set could be alerted or warned in real-time. The set of ended convoys V_result could be stored for further analysis.
For the purpose of contact tracing, an undirected network consisting of users as nodes can be created, where two users are connected with an edge if they are found in a common convoy. The edges are weighted by the total duration of the two users being found in the same convoy. If a user is diagnosed with the disease, then this network is useful to identify the primary, secondary or even higher level of contacts of the user and notify them of such occasions. Further, Section 3.4 describes an example of an optimization problem that makes use of this network to attempt to prevent the transmission of virus between the detected convoys of users.
3.2 Clustering Location Data for Identification of Hotspots
Hotspots is defined as a location point or a stretch of location points with high traffic throughout a period of time. The identification of hotspots is through extracting clustering centers of location points and representative trajectories generated for clusters. In practice, this clustering process could be performed on a daily basis, weekly basis, or monthly basis, which could reveal different levels of temporal patterns. Some precautions that could be done more frequently in these identified hotspots are such as: 1) frequent sanitation; 2) placement of sanitation materials and signs to remind people to follow social distancing rules; 3) alerting users about locations of these crowded areas, so they can attempt to avoid these places if possible.
Clustering of location data finds hotspots by grouping location points and producing a representative location point for each cluster found. The similarity measure used for clustering location points is similar to Eq. (1), where location points in different rooms will not be in the same cluster. Furthermore, the associated users are also compared so that a cluster consists of location points belonging to different users:
where p1 and p2 are location points of users u1 and u2 respectively, and r1 and r2 are the associated rooms of each location point.
Before proposing the new DBScan algorithm for indoor data clustering to identify hotspots, let’s formulate the density definition. In this context,
Performing DBScan directly on all location points will produce clusters that are predominated by location points belonging to one user, which occurs when numerous location points of a user are recorded within a density-reachable area. This is extremely typical in real life situations as a person tends to stay immobile at the same location to perform some tasks. However, this clustering result does not represent meaningful clusters as it is not aligned with the initial aim of finding areas of interest, wherein there should be a number of distinct users detected. Therefore, to improve the clustering results, the location points of each user are first clustered separately. This process might disclose important behavior of each user, and more importantly, it filters out location points where users do not stay for long. Subsequently, the cluster centers from the first clustering process are used as input to a second clustering process. This whole process asserts that clusters from the second clustering process contain more than one object.
Fig. 1 illustrates the two-layer clustering process based on the DBScan algorithm. This process feeds the raw N-user indoor location data into different DBScan algorithm with
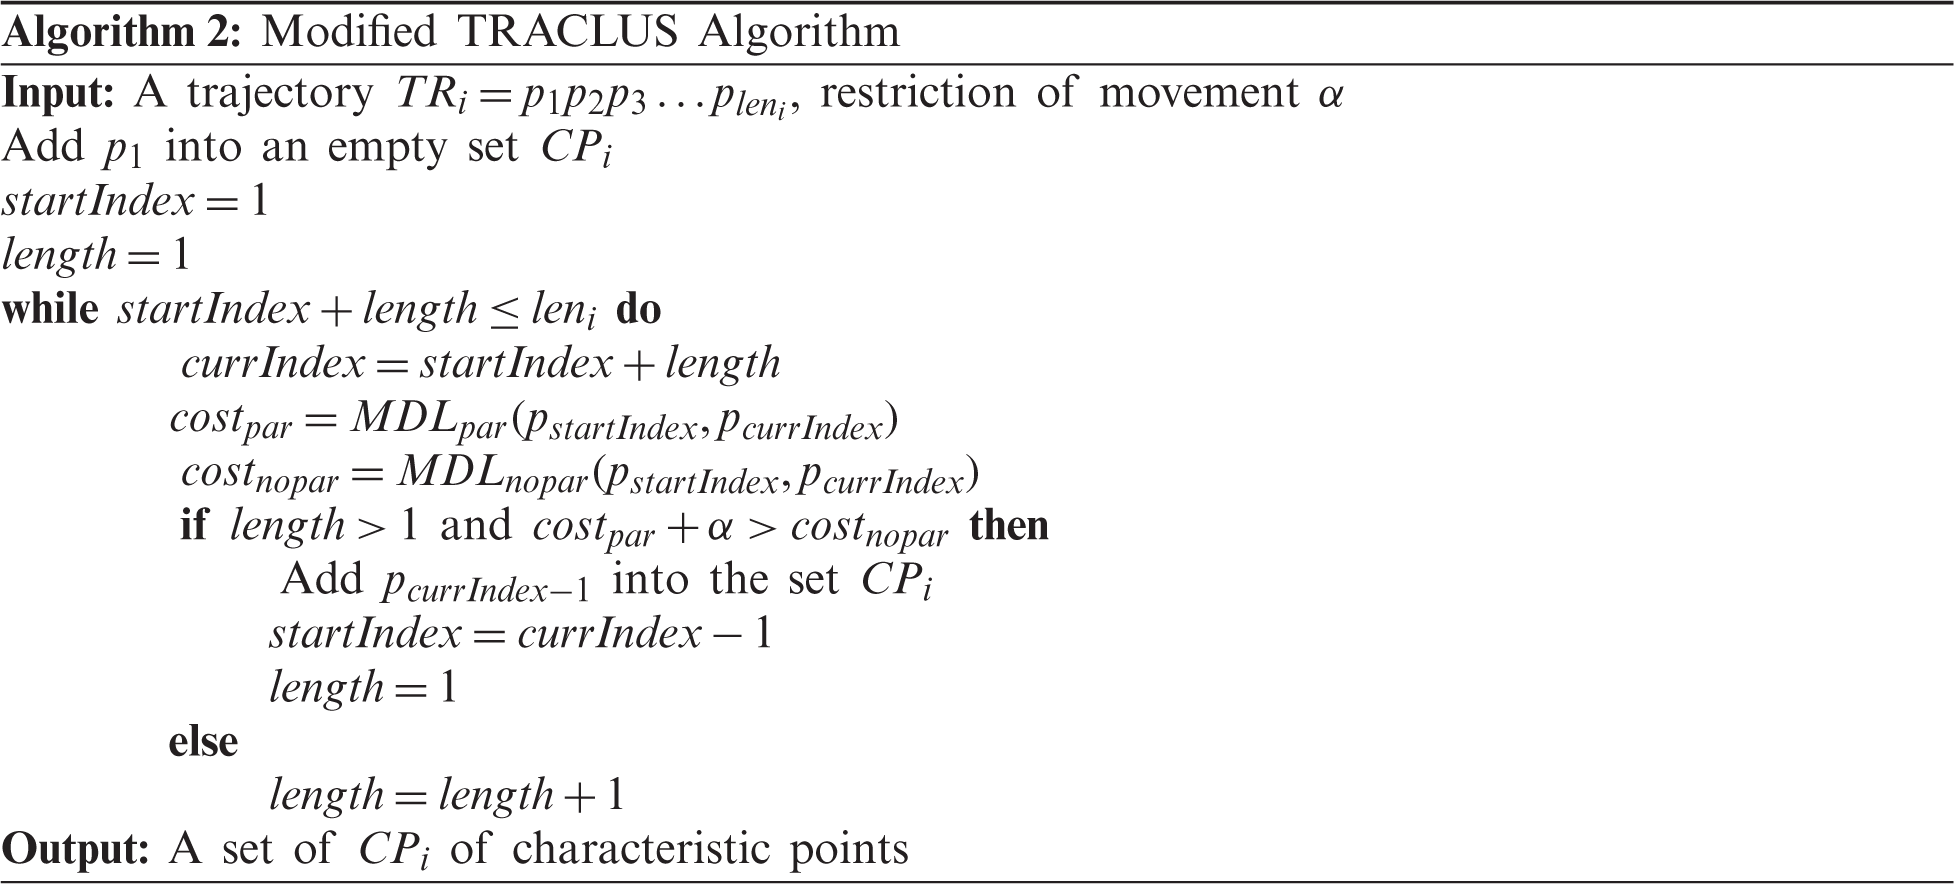
Other than the proposed DBScan algorithm which only cluster data in spatial dimension, the TRACLUS algorithm is also proposed and modified to cluster trajectories, which consist of time-ordered location points associated with one object. Trajectories were extracted from raw location points so that successive location points in a trajectory are at least 0.1 m away from each other but less than 30 s apart. This is to remove repeated location points in the trajectories while maintaining the shape of trajectories true to the real trajectories. The original TRACLUS proposed breaks trajectories by removing any intermediary points in a trajectory. While this is acceptable in an unrestricted outdoor environment, this may produce invalid partitioned trajectories in an indoor environment with limited freedom of movement. In this work, a new parameter that is called the restriction of movement, α, is introduced to increase the stringency of the condition under which intermediary points are removed. The modified TRACLUS algorithm is laid below:
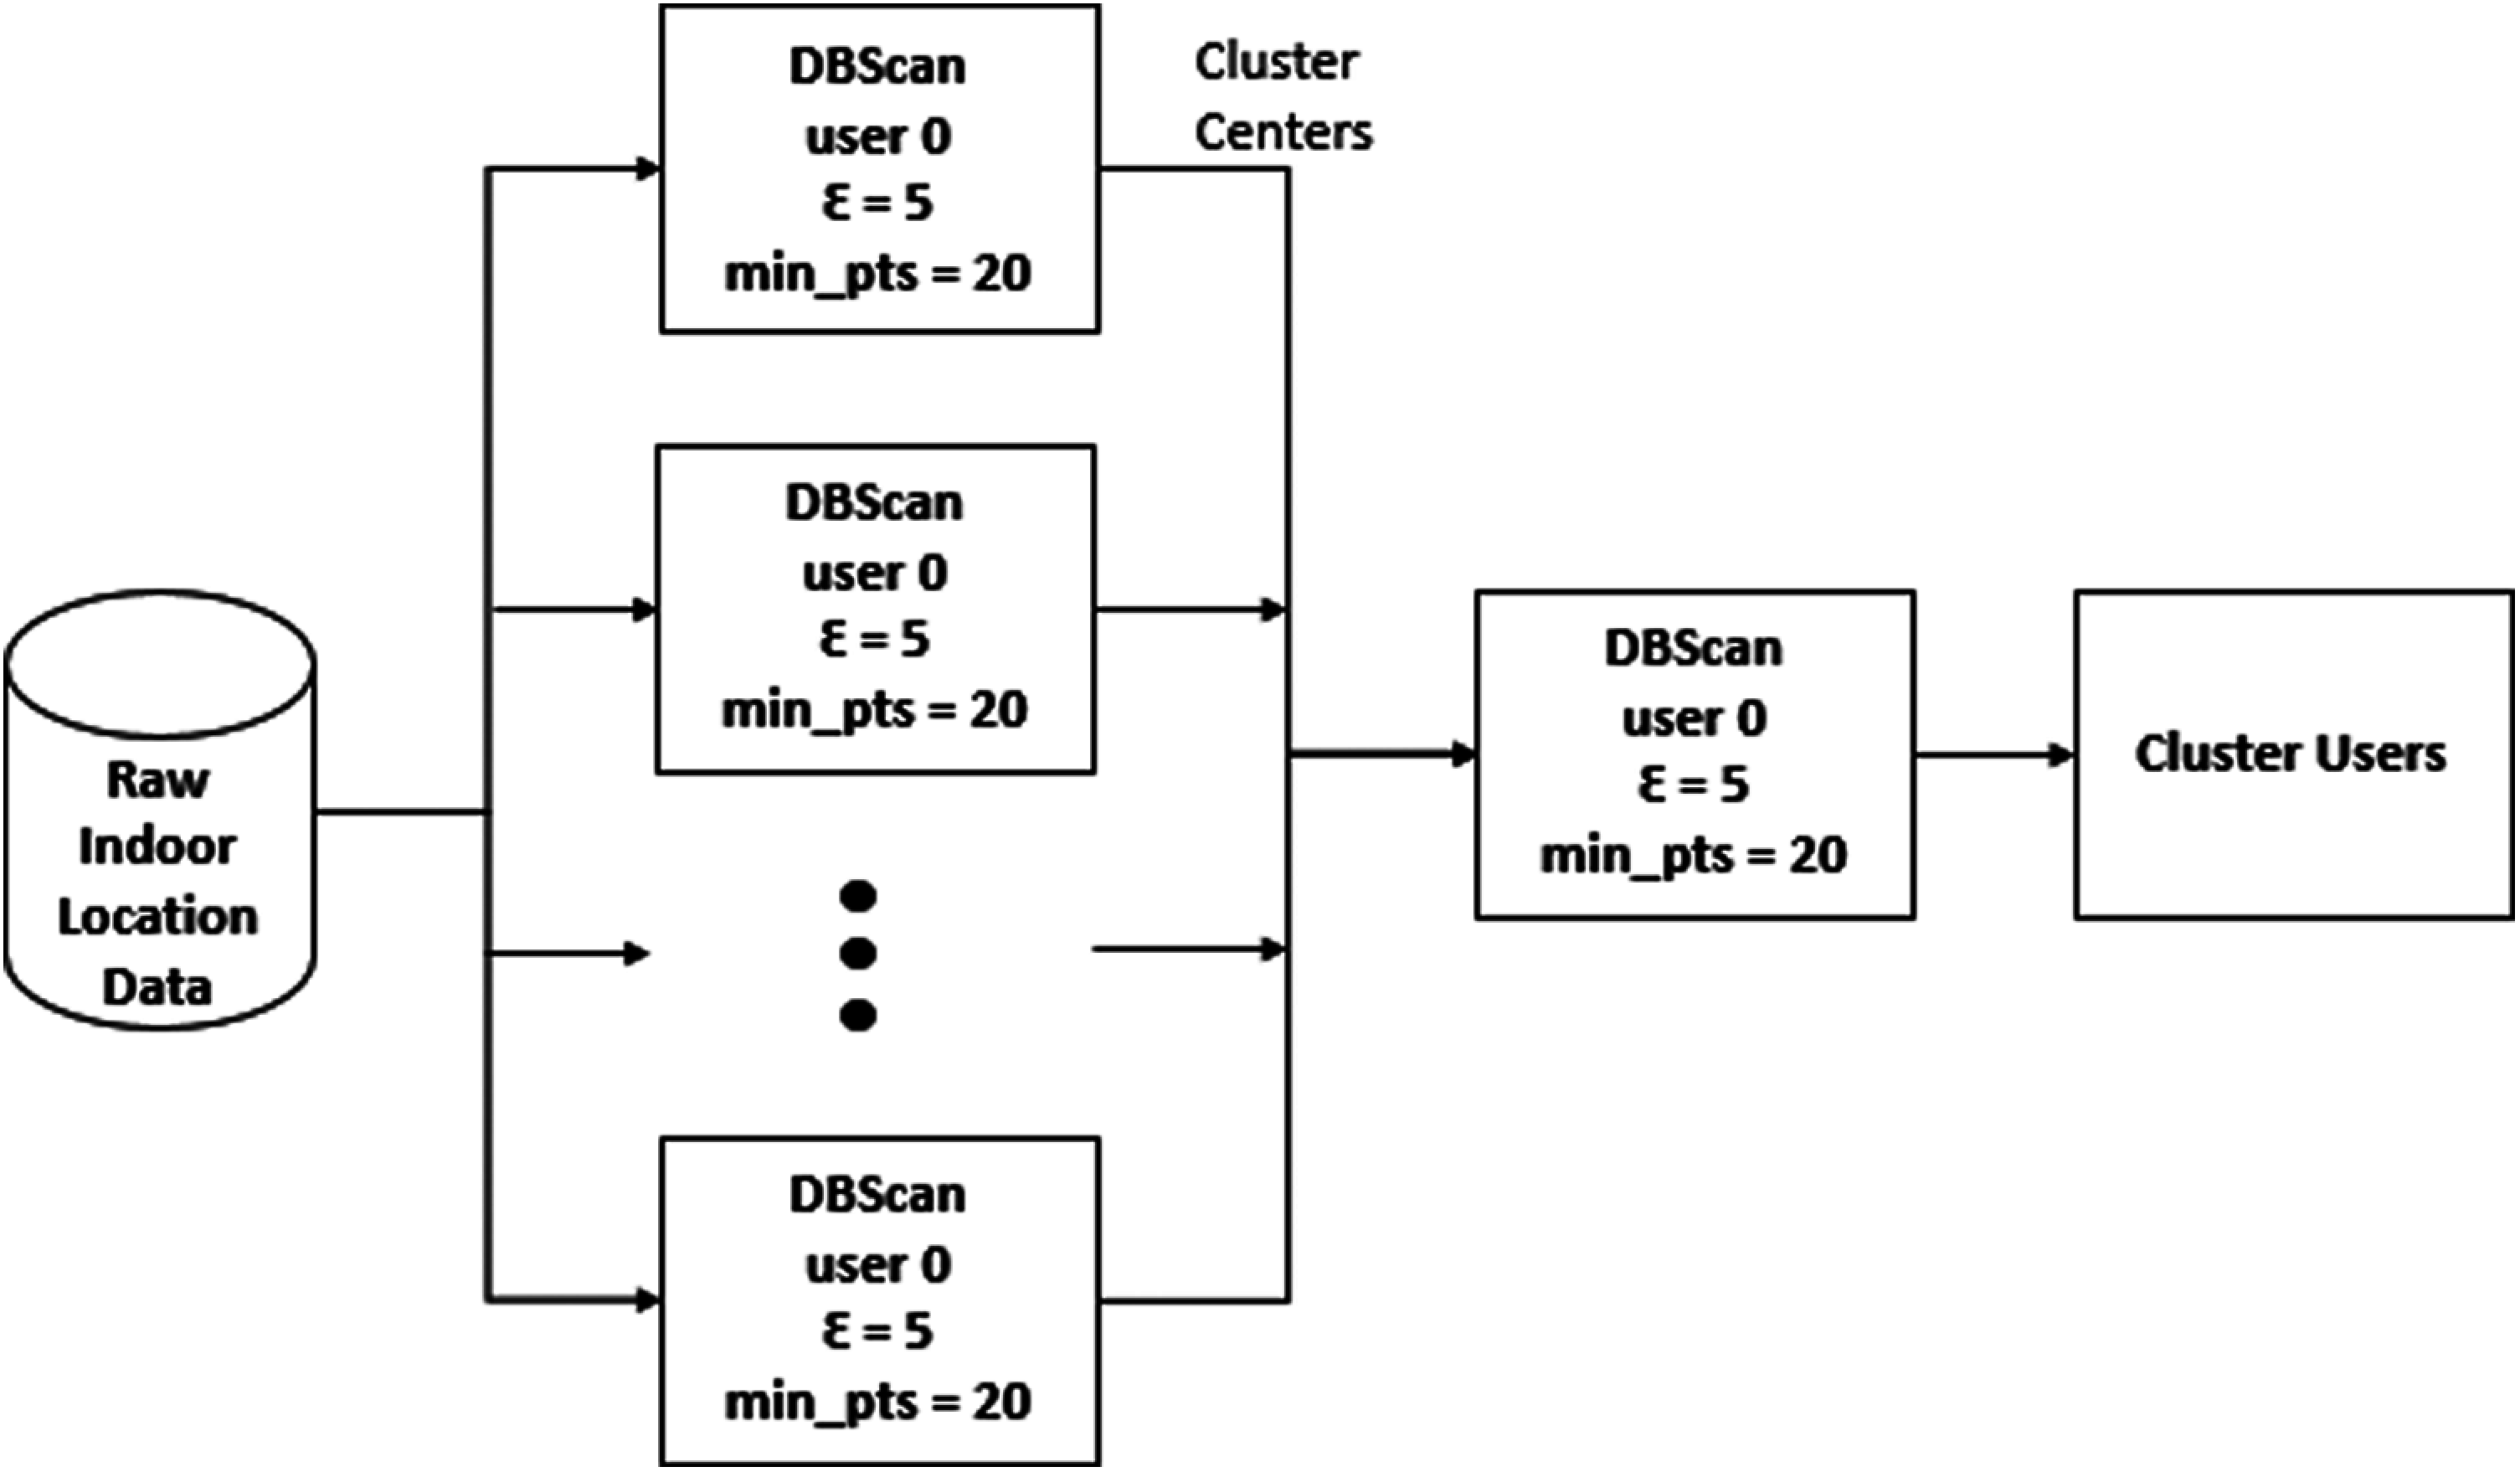
Figure 1: Flow chart of the two-layer clustering process of location points using DBScan
Due to the limited size of the dataset, another parameter, MinPTR, was introduced for use while clustering the sub-trajectories. It defines the minimum number of participating (original) trajectories in a cluster. Note the difference of MinPTR with MinLns that defines the minimum number of partitioned sub-trajectories in a cluster.
3.3 Feature Extraction Based on Movement Behaviors of Users
To be able to distinguish between movement behaviors, some properties of their behaviors or movement patterns were extracted, to be used as inputs for the optimization problem in Section 3.4. Features that have been extracted using the UjiIndoorLoc dataset are as follows:
1. The number of unique days of visit to the site.
2. The average duration of visit to the site.
3. The average duration spent in a building on different days.
4. The median time of day when a user visits the site.
5. The number of times a user visits the site on each day of the week (Monday to Sunday). There are 7 features extracted, one for each day of the week.
6. The cluster centers and the hotspots found in Section 3.2.
Since there are various types of features extracted, it is very important to define the similarity measure of these features. Features 1–5 can be considered as continuous numerical data; therefore, their similarities are suitable to be found using the Euclidean distance. For feature 6, the cluster centers are first translated into text. For each cluster center, one term in the form of building ID, floor number and space ID appended together is created. Then, these terms are perceived as words and the cosine similarity can be used as the similarity measure. In our implementation, the terms belonging to different users are converted to a matrix of term frequency-inverse document frequency (TF-IDF) features, where one user owns a document with the terms created as words. The output is then normalized, and Euclidean distance is used to measure the similarity between vectors.
The values of features are normalized for training, to prevent excessive effect of features with smaller variance to the clustering results. Normalization is used instead of standardization as normalization does not make any assumptions about the distribution of the features to estimate the mean and standard deviation of the population. After extracting the features, the similarity between the movement behaviors were used to create a network of users. First, one node is created for each user. Each pair of nodes is connected with an edge and the weights of the edges encode the values of similarity between the movement behaviors of the corresponding pairs of users.
The networks found in Section 3.1 and Section 3.3 can be used to assist better planning of subsets of users to be allowed to be on the site on different days. Since the network from Section 3.1 informs about the close contact of users, we can minimize the probability of contact between those who have yet to be in close contact with each other. This is to minimize the transmission of the virus to other users in the network, and to keep the size of connected components in the contact network to be small. On the other hand, we should divide those with similar movement behaviors to have access to the site on different days. This is to lessen the traffic and to even out the distribution of users across all locations.
This problem can be formalized into a scheduling optimization problem. The objective function of the problem can be expressed as follows:
1. Maximize the number of pairs of users who already have close contact with each other to have access to the site on the same days. The award added to the objective function is the normalized value of the duration of time the pair of users are in close contact, provided that these users are allocated on the same day (edge weight of network from Section 3.1).
2. Minimize the number of pairs of users who have the same movement behavior to have access to the site on the same days. The penalty imposed on the objective function is the normalized value of the similarity between the movement behaviors of the pair of users (edge weight of network from Section 3.3).
Along with other conditions such as the maximum allowed users on the site and the number of days a user is allowed to enter the site, we could solve this optimization problem using integer programming. OR-Tools by Google was used to solver the optimization problem formalized above.
4 Numerical Results and Discussions
In this section, we will demonstrate the clustering quality of proposed indoor location data analytics system in terms of varying values of MinLns and
where
In Fig. 2, the Q-Measure is plotted against
Next, trajectories extracted from the UjiIndoorLoc dataset is fed into the proposed TRACLUS scheme where the weightages for each of perpendicular distance, parallel distance and angle distance are set to 1, as suggested in [8]. The Q-Measure of proposed TRACLUS algorithm is compared with those of DBScan with LCSS and DBScan with EDR to demonstrate the superior performance in terms of clustering indoor location data for different MinLns and
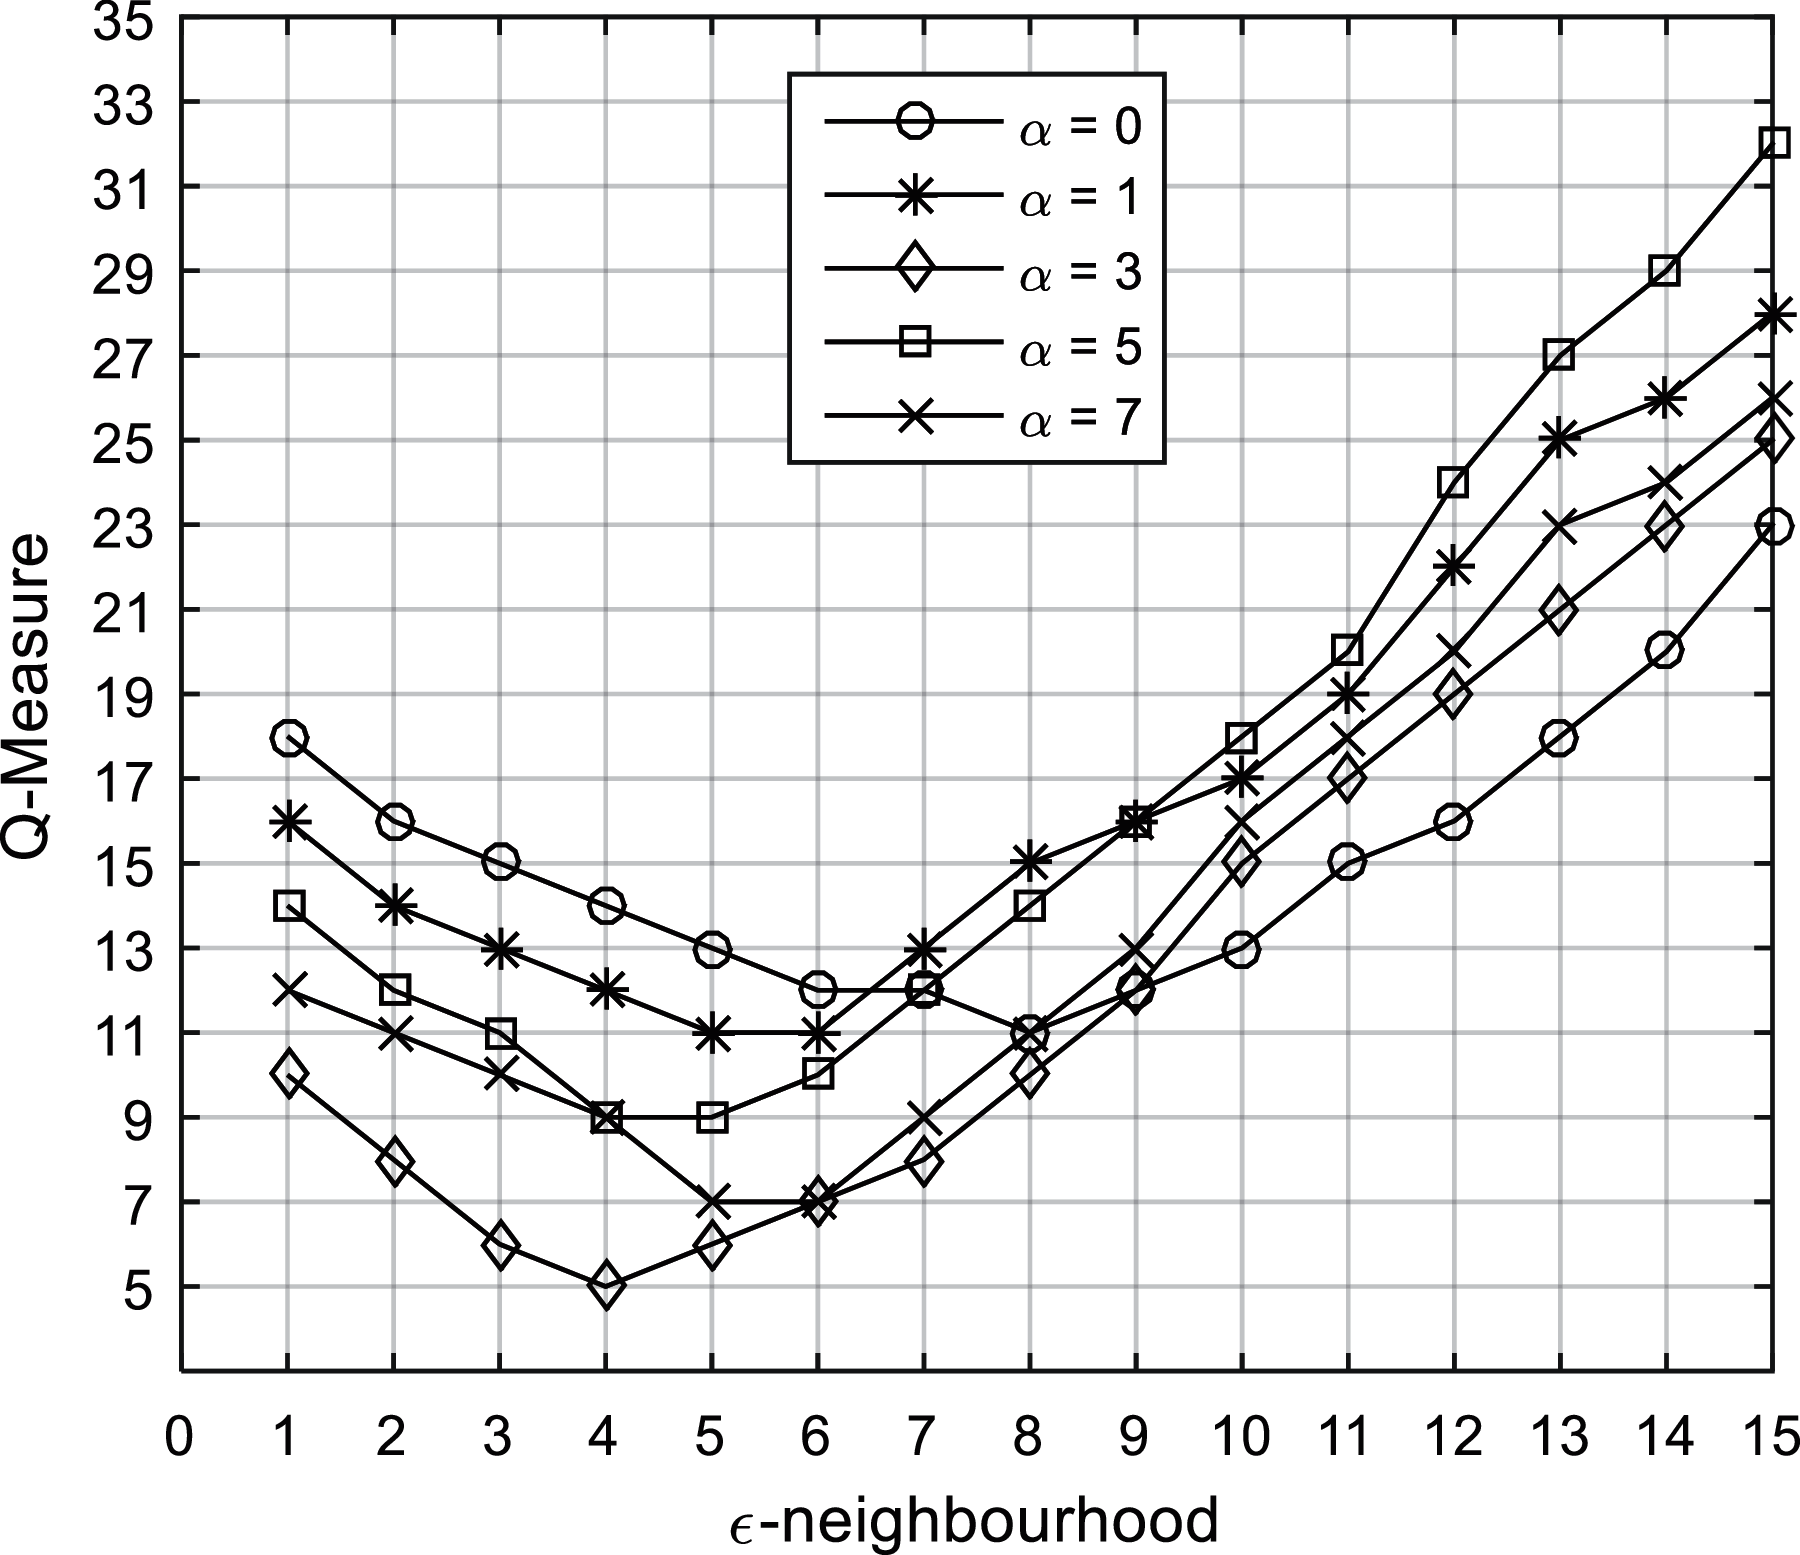
Figure 2: The Q-measure performance for the TRACLUS algorithm for different values of
The performance of the proposed indoor location data analytics system is evaluated in Fig. 4. The number of close contacts is counted when two users encounter each other on the enclosed site. The percentage of the population is ranged from 10% to 100% for 19 users (rounded to integers). First, the upper-bound performance (the worst-case scenario) is shown in Fig. 4 where the number of close contacts is the highest when there is no scheduling and no feature extraction at all. This is an anticipated result displayed in an exponential curve as the more congested area certainly increases close contacts tremendously as the space of the area is limited. The scheduling of users to the site using the OR-Tools is investigated first with features 1–5 listed in Section 3.3, excluding feature 6 on hotspot identification. Using the OR-Tools scheduling with some important features, it is observed that features 1–5 are essential factors as this scheduling can reduce the number of close contacts by approximately 40–60%. The important information extracted from indoor data can assist the system to understand the behaviors of the users visiting the site and the scheduling can be effectively done by minimizing the probability of close contacts among the users. To further improve the social distancing among the users, the clustering using DBScan provides the spatial analytics which identify the hotspots where the users may have high chance to come into close contact in some fixed locations (hotspots). Using this extra hotspot feature, the scheduling optimization can take this into account by separating this group of users into different access channels to the site. It is evident in Fig. 4 that the implementation of the DBScan algorithm can further decrease the average number of close contacts by 25% as compared to the Or-Tool scheduling without hotspot feature. Furthermore, the trajectories of movement of the users on the site are also captured using the TRACLUS algorithm. This spatio-temporal feature is identified and included and the average number of close contacts can be further reduced by another 37% as compared to that of the DBScan. This result is expected as the TRACLUS algorithm has provided extra temporal analytics to the optimization other than the spatial analytics. The temporal information is critical as the number of close contact is highly dependent on the movement of the users because it is not optimal to just plan the scheduling based on the fixed positions of the users. In short, other than the features 1--5 that provides the users’ access information, the spatial and spatio-temporal information is also essential for user access planning. It is also proven that the proposed DBScan and TRACLUS algorithms are efficient to reduce the close contacts among users within an enclosed site.
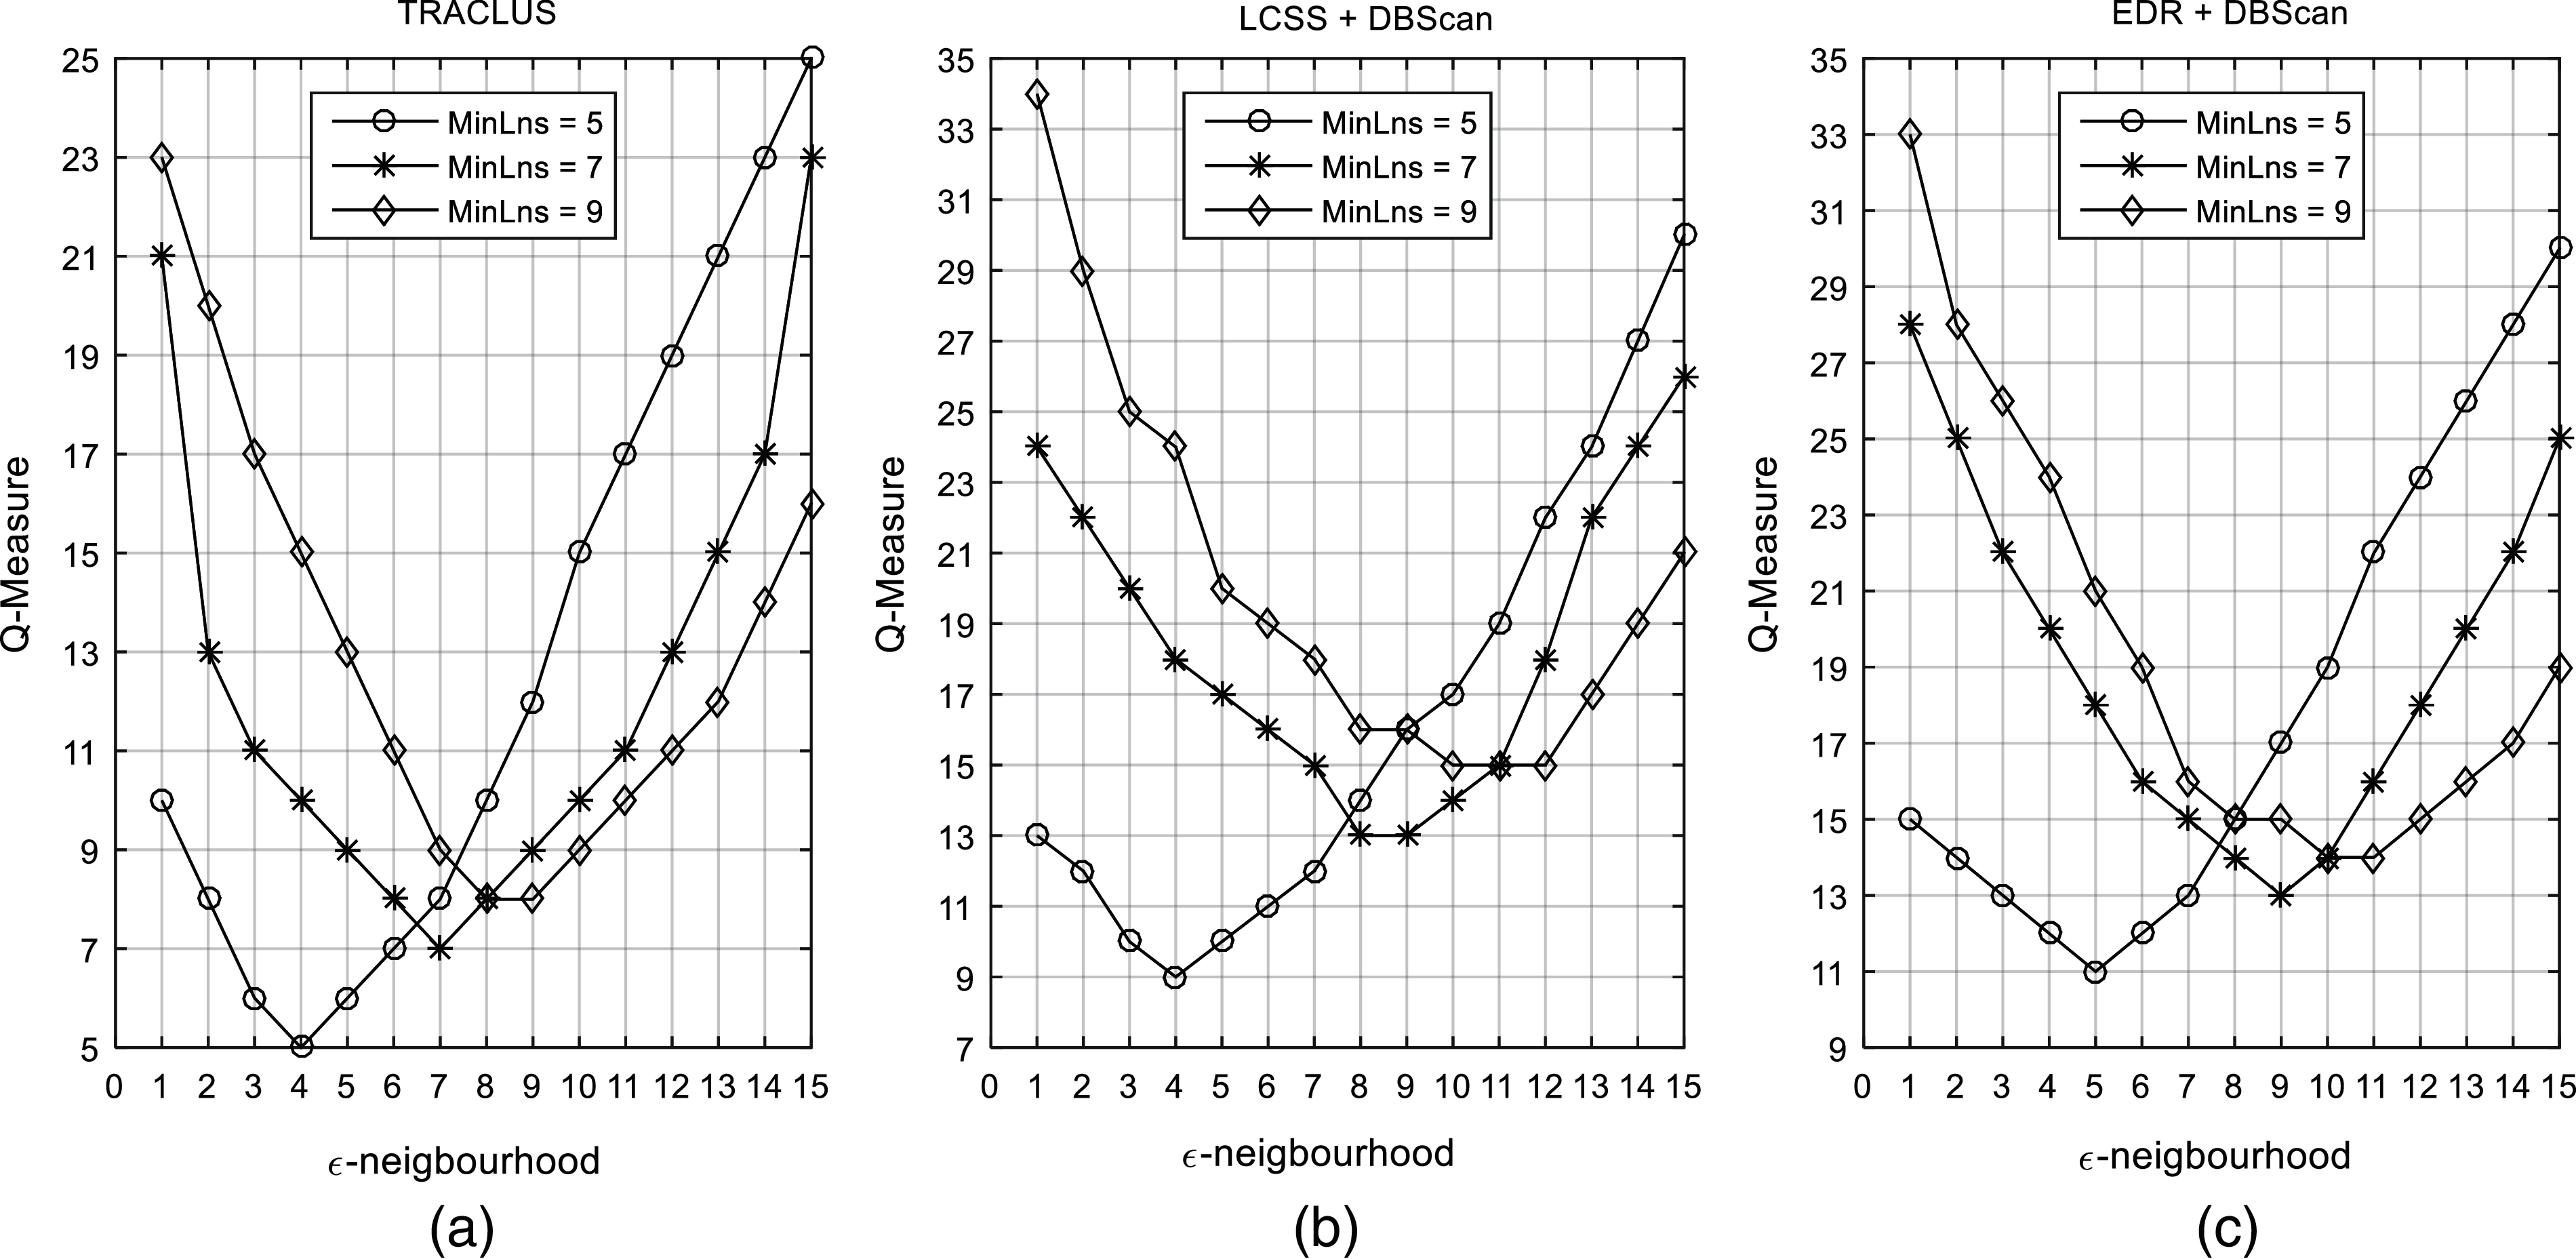
Figure 3: The comparison of Q-measure performance among the (a) TRACLUS, (b) LCSS + DBScan and (c) EDR + DBScan for different MinLns and
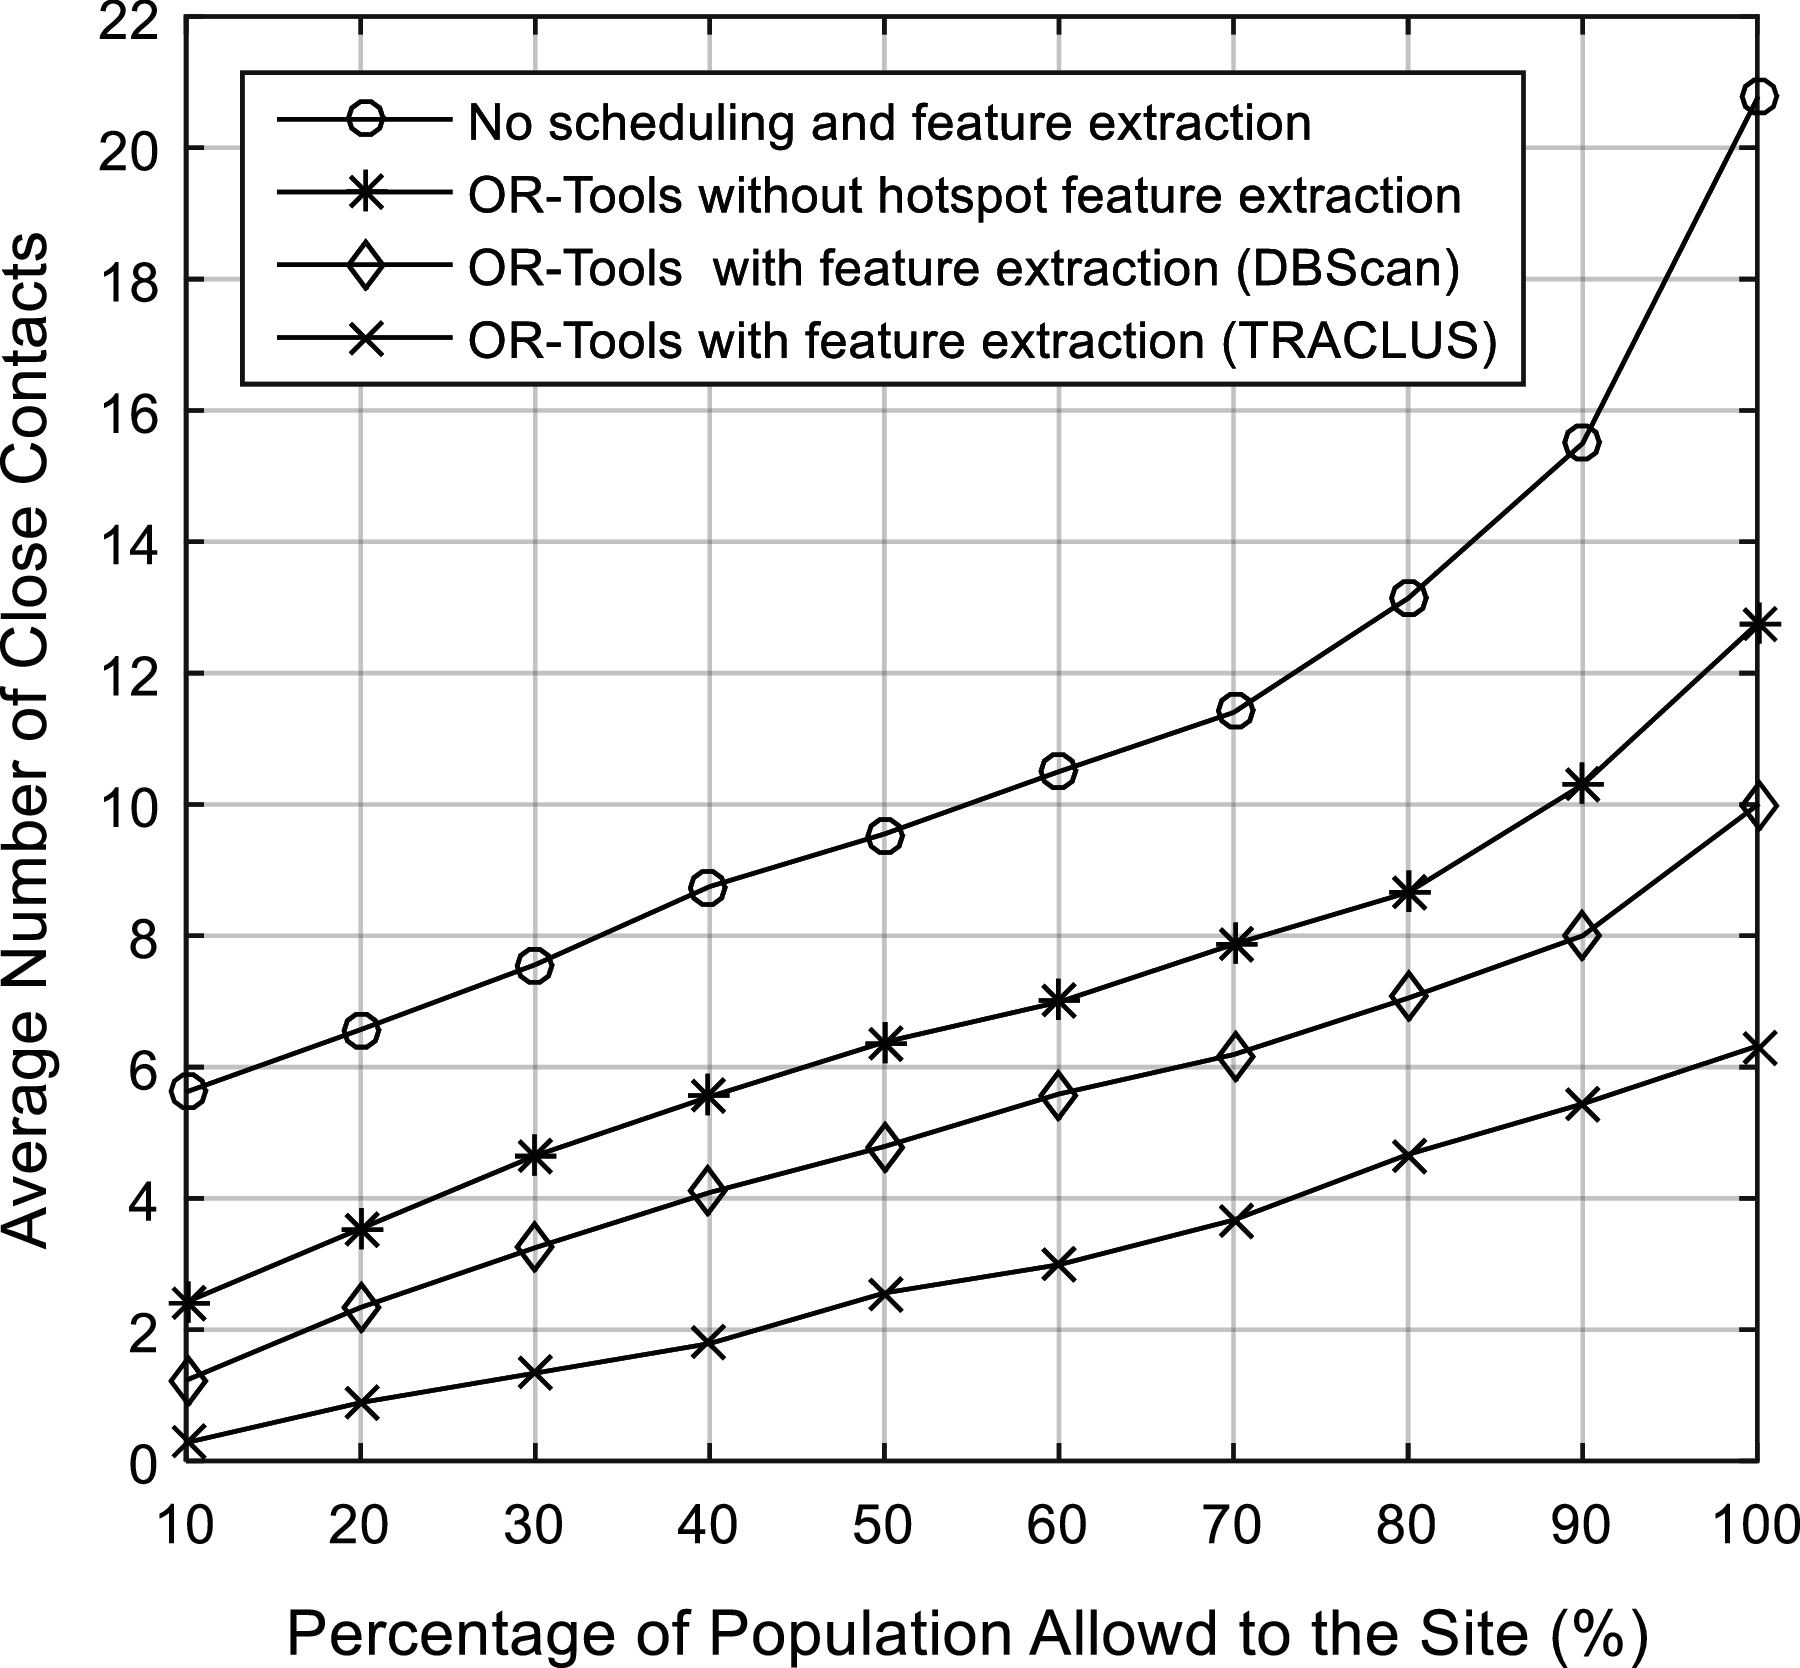
Figure 4: The average number of close contacts counted per allowed population to the site
The proposed indoor data analytics system based on the modified DBScan and TRACLUS algorithms has manifested the feasibility and viability for the application of contact tracing to enforce social distancing and optimize human mobility in the event of preventing transmission of the COVID-19 virus. The proposed two-layer DBScan algorithm clusters the location points solely based on spatial analytics and it has been proven more accurate compared to the conventional DBScan algorithm. Besides, the proposal to include a parameter to restrict the movement of users in TRACLUS algorithm makes TRACLUS feasible to function indoor. Apparently, TRACLUS is more superior than DBScan as the former explores the data in spatio-temporal dimension, which shows that the user movement behaviors can be captured more accurately if the behaviors are observed for some time. By optimally selecting the parameters for DBScan and TRACLUS algorithms, both schemes can outperform the existing clustering techniques in identifying the hotspots within an enclosed area. The hotspot feature is then used to assist in scheduling the users’ access to a particular enclosed site. The scheduling is optimized based on different features to understand the users’ site access characteristic together with their movement behaviors on the site. It is empirically proven that the proposed human mobility management based on the features extracted can potentially minimize the close contacts among users by 70% if all users are allowed to access the site at the same period of time. Due to the limitation of space, some of the potential enhancement or extension of the current work such as proposing parameter-less algorithms, incorporation of self-regularization algorithms and clustering indoor data based on features extracted, can be pursued in future.
Funding Statement: This research was funded by Ministry of Education Malaysia, Grant Number FRGS/1/2019/ICT02/MMU/02/1 and in part by Monash Malaysia, School of Information Technology (SIT) Collaborative Research Seed Grants 2020.
Conflicts of Interest: The authors declare that they have no conflicts of interest to report regarding the present study.
1. World Health Organization Newsroom Commentaries, “Transmission of SARS-CoV-2: Implications for infection prevention precautions,” 2020. [Online]. Available: https://www.who.int/news-room/commentaries/detail/transmission-of-sars-cov-2-implications-for-infection-prevention-precautions. [Google Scholar]
2. N. Ahmed, R. A. Michelin, W. Xue, S. Ruj, R. Malaney et al., “A survey of COVID-19 contact tracing applications,” IEEE Access, vol. 2020, no. 8, pp. 134577–134601, 2020. [Google Scholar]
3. S. Viktoriia, H. Sylvia, G. Michael and L. E. Simona, “Survey of decentralized solutions with mobile devices for user location tracking, proximity detection, and contact tracing in the COVID-19 era,” Data (Basel), vol. 5, no. 87, pp. 1–40, 2020. [Google Scholar]
4. Google COVID-19 Information & Resources., “Exposure notifications: Using technology to help public health authorities fight COVID-19,” 2020. [Online]. Available: https://www.google.com/covid19/exposurenotifications. [Google Scholar]
5. D. J. Leith and S. Farrell, “Measurement-based evaluation of google/apple exposure notification API for proximity detection in a light-rail tram,” PlOS ONE, vol. 15, no. 9, pp. 1–16, 2020. [Google Scholar]
6. H. Jeung, M. L. Yiu, X. Zhou, C. S. Jensen and H. T. Shen, “Discovery of convoys in trajectory databases,” in 34th Int. Conf. on Very Large Data Bases, VLDB 2008. Proc.: VLDB Endowment 2008, Auckland, New Zealand, pp. 1068–1080, 2008. [Google Scholar]
7. S. Louhichi, M. Gzara and H. B. Abdallah, “A density-based algorithm for discovering clusters with varied density,” in World Congress on Computer Applications and Information Systems, WCCAIS 2014. Proc.: IEEE WCCAIS 2014, Hammamet, Tunisia, pp. 1–6, 2014. [Google Scholar]
8. J.-G. Lee, J. Han and K.-Y. Whang, “Trajectory clustering: A partition-and-group system,” in Int. Conf. on Management of Data, SIGMOD 2007. Proc.: ACM SIGMOD 2007, New York, NY, USA, pp. 593–604, 2007. [Google Scholar]
9. S. Bian, B. Zhou and P. Lukowicz, “Social distance monitor with a wearable magnetic field proximity sensor,” Sensors (Basels), vol. 20, no. 18, pp. 5101–5126, 2020. [Google Scholar]
10. J. Meklenburg, M. Specter, M. Wentz, H. Balakrishnan, A. Chandrakasan et al., “SonicPACT: An ultrasonic ranging method for the private automated contact tracing (PACT) protocol,” arXiv Preprint: arXiv:2012.04770, 2020. [Google Scholar]
11. A. Jaggi, “Ultra-wideband technology for contact tracing and social distancing solutions for COVID-19,” The IoT Magazine, 2020. [Online]. Available: https://theiotmagazine.com/ultra-wideband-tech-nology-f9ba3d7e04c8. [Google Scholar]
12. A. Trivedi, “Computer scientists offer WiFi-based contact tracing software for national campus use,” UMASS Research Article, 2020. [Online]. Available: https://www.umass.edu/news/article/umass-amh-erst-computer-scientists-offer. [Google Scholar]
13. A. Trivedi, C. Zakaria, R. Balan and P. Shenoy, “WiFiTrace: Network-based contact tracing for infectious diseases using passive WiFi sensing,” in ACM Int. Joint Conf. on Pervasive and Ubiquitous Computing. Proc: Proceedings of the ACM on Interactive, Mobile, Wearable and Ubiquitous Technologies 2021, Virtual Conference, pp. 1–26, 2021. [Google Scholar]
14. A. Hekmati, G. Ramachandran and B. Krishnamachari, “CONTAIN: Privacy-oriented contact tracing protocols for epidemics,” in IFIP/IEEE Int. Symp. on Integrated Network Management (IM) 2021, Bordeaux, France, pp. 872–877, 2021. [Google Scholar]
15. P. C. Ng, J. She and R. A. Ran, “Compressive sensing approach to detect the proximity between smartphones and BLE beacons,” IEEE Internet of Things Journal, vol. 6, no. 4, pp. 7162–7174, 2019. [Google Scholar]
16. Q. Zhao, H. Wen, Z. Lin, D. Xuan and N. Shroff, “On the accuracy of measured proximity of bluetooth-based contact tracing apps,” in EAI Int. Conf. on Security and Privacy in Communication Networks, EAI SecureComm 2020. Proc.: Lecture Notes of the Institute for Computer Sciences, Social Informatics and Telecommunications Engineering (LNICST 335Washington, WA, USA, pp. 49–60, 2020. [Google Scholar]
17. R. Thakur, K. Peshwani, J. Sheikh, R. Khanke, S. Pal et al., “Enhance advertisement for offline shopping by using BLED one touch information,” International Journal of Future Generation Communication and Networking, vol. 13, no. 2s, pp. 1004–1008, 2019. [Google Scholar]
18. A. G. Pateli, G. M. Giaglis and D. D. Spinellis, “Trial evaluation of wireless info-communication and indoor location-based services in exhibition shows,” in Panhellenic Conf. on Informatics, PCI 2005. Proc.: Lecture Notes in Computer Science (LNCS 3746Volas, Greece, pp. 199–210, 2005. [Google Scholar]
19. J. Kunhoth, A. Karkar, S. Al-Maadeed and A. Al-Ali, “Indoor positioning and wayfinding systems: A survey,” Human-centric Computing and Information Sciences, vol. 10, no. 18, pp. 1–41, 2020. [Google Scholar]
20. A. A. Panchpor, S. Shue and J. M. Conrad, “A survey of methods for mobile robot localization and mapping in dynamic indoor environments,” in Conf. on Signal Processing And Communication Engineering Systems, SPACES 2018. Proc.: IEEE SPACES’18, Vijayawada, India, pp. 138–144, 2018. [Google Scholar]
21. E. Y. Finch, “TaleBlazer: Using iBeacons for Indoor Location-based Augmented Reality Games,” M.Eng Thesis, Department of Electrical Engineering and Computer Science, Cambridge, MA, USA: Massachusetts Institute of Technology, 2015. [Google Scholar]
22. H. Schmidtke, “Location-aware systems or location-based services: A survey with applications to CoViD-19 contact tracking,” Journal of Reliable Intelligent Environments, vol. 6, no. 4, pp. 191–214, 2020. [Google Scholar]
23. A. Stefanakou and N. Nikitakos, “A decision support model for site selection of offshore wind farms,” in Int. Scientific Conf. on Energy and Climate Change, SCEC,16. Proc.: 9th SCEC 2016, Athens, Greece, pp. 12–14, 2016. [Google Scholar]
24. Y.-T. Li, B. Huang and D.-H. Lee, “Multimodal, multicriteria dynamic route choice: A GIS-microscopic traffic simulation approach,” Annals of GIS, vol. 17, no. 3, pp. 173–187, 2011. [Google Scholar]
25. T. Nagata, Y. Kimura and M. Ishii, “Use of a geographic information system (GIS) in the medical response to the Fukushima nuclear disaster in Japan,” Prehosp Disaster Med., vol. 27, no. 2, pp. 213–215, 2012. [Google Scholar]
26. C. Fernández-Caramés, F. J. Serrano, V. Moreno, B. Curto, J. F. Rodríguez-Aragón et al., “A real-time indoor localization approach integrated with a geographic information system (GIS),” Robotics and Autonomous Systems, vol. 75, no. PB, pp. 475–489, 2016. [Google Scholar]
27. M. Xu, I. Hijazi, A. Mebarki, R. E. Meouche and M. Abune'meh, “Indoor guided evacuation: TIN for graph generation and crowd evacuation,” Geomatics Natural Hazards and Risk, vol. 7, no. sup1, pp. 47–56, 2016. [Google Scholar]
28. J. Yan, A. A. Diakité and S. Zlatanova, “A generic space definition framework to support seamless indoor/outdoor navigation systems,” Transactions in GIS, vol. 23, no. 6, pp. 1273–1295, 2019. [Google Scholar]
29. K. Oku, F. Hattori and K. Kawagoe, “Tweet-mapping method for tourist spots based on now-tweets and spot-photos,” Procedia of Computer Science, vol. 60, no. 3, pp. 1318–1327, 2015. [Google Scholar]
30. M. Schultz, J. Rosenow and X. Olive, “A-CDM lite: Situation awareness and decision making for small airports based on ADS-B data,” in 9th SESAR Innovation Days. Proc.: 9th SESAR 2019, Athens, Greece, pp. 12–15, 2019. [Google Scholar]
31. E. Konstantinidis, A. S. Billis, R. Dupre, J. M. F. Montenegro, G. Conti et al., “IoT of active and healthy ageing: Cases from indoor location analytics in the wild,” Health and Technology, vol. 2017, no. 7, pp. 41–49, 2017. [Google Scholar]
32. S. Kisilevich, F. Mansmann, M. Nanni and S. Rinzivillo, Spatio-Temporal Clustering: In the Data Mining and Knowledge Discovery Handbook, 2nd ed., New York, NV, USA: Springer, pp. 855–874, 2009. [Google Scholar]
33. Y. Li, J. Han and J. Yang, “Clustering moving objects,” in Int. Conf. on Knowledge Discovery and Data Mining, KDD,04. Proc.: 10th ACM SIGKDD 2004, Seattle, WA, USA, pp. 617–622, 2004. [Google Scholar]
34. C. Jensen, D. Lin and B. Ooi, “Continuous clustering of moving objects. knowledge and data engineering,” IEEE Transactions on Knowledge and Data Engineering, vol. 19, no. 9, pp. 1161–1174, 2007. [Google Scholar]
35. P. Laube, M. V. Kreveld, S. Imfeld and REMO. Finding, “Detecting relative motion patterns in geospatial lifelines,” in Int. Symp. on Spatial Data Handling 2005. Proc.: Developlment in Spatial Data Handling, Berlin, Heidelberg, pp. 201–215, 2005. [Google Scholar]
36. Z. Zhang, H. Kaiqi and T. Tieniu, “Comparison of similarity measures for trajectory clustering in outdoor surveillance scenes,” in Int. Conf. on Pattern Recognition, ICPR'06. Proc.: IEEE ICPR 2006, Hong Kong, China, pp. 1135–1138, 2006. [Google Scholar]
37. B. Morris and M. Trivedi, “Learning trajectory patterns by clustering: Experimental studies and comparative evaluation,” in IEEE Conf. on Computer Vision and Pattern Recognition, CVPR’09. Proc.: IEEE CVPR 2009, Miami, FL, USA, pp. 312–319, 2009. [Google Scholar]
38. R. S. D. Sousa, A. Boukerche and A. A. F. Loureiro, “Vehicle trajectory similarity: Models, methods, and applications,” ACM Computing Survey, vol. 53, no. 5, pp. 1–32, 2020. [Google Scholar]
39. L. Chen, M. Özsu and V. Oria, “Robust and fast similarity search for moving object trajectories,” in Int. Conf. on Management of Data, SIGMOD 2005. Proc.: ACM SIGMOD 2005, Baltimore Maryland, USA, pp. pp 491–502, 2005. [Google Scholar]
40. Y. Lu, D. Cheng, T. Pei, H. Shu, X. Ge et al., “Inferring gender and age of customers in shopping malls via indoor positioning data,” Environment and Planning. B, Urban Analytics and City Science, vol. 47, no. 9, pp. 1672–1689, 2019. [Google Scholar]
41. A. Grünerbl, “Leveraging motion and location tracking for supporting cognitive state and behavior analysis,” Ph.D. dissertation, Department of Computer Science. Technische Universität Kaiserslautern, Erwin-Schrödinger-Straße, Kaiserslautern, Germany, 2020. [Google Scholar]
42. A. S. Cheema, T. Kifayat, A. R. Rahmam, U. Khan, A. Zaib et al., “Is social distancing, and quarantine effective in restricting COVID-19 outbreak? Statistical evidences from Wuhan, China,” Computers, Materials & Continua, vol. 66, no. 2, pp. 1977–1985, 2021. [Google Scholar]
43. M. Saad, M. B. Ahmad, M. Asif, K. Masood and M. A. Al-Ghamdi, “Social distancing and isolation management using machine-to-machine technologies to prevent pandemics,” Computers, Materials & Continua, vol. 67, no. 3, pp. 3545–3562, 2021. [Google Scholar]
44. S. K. Jarraya, M. H. Alotibi and M. S. Ali, “A deep-CNN crowd counting model for enforcing social distancing during COVID19 pandemic: Application to Saudi Arabia’s public places,” Computers, Materials & Continua, vol. 66, no. 2, pp. 1315–1328, 2021. [Google Scholar]
45. J. Torres-Sospedra, D. Rambla, R. Montoliu, O. Belmonte and J. Huerta, “UJIIndoorLoc-Mag: A new database for magnetic field-based localization problems,” in Int. Conf. on Indoor Positioning and Indoor Navigation, IPIN’15. Proc.: IEEE IPIN 2015, Banff, AB, Canada, pp. 1–10, 2015. [Google Scholar]
46. Centers for Disease Control and Prevention (CDC“Contact tracing–appendices,” 2020. [Online]. Available: https://www.cdc.gov/coronavirus/2019-ncov/php/contact-tracing/contact-tracing-plan/appendix.html#contact. [Google Scholar]
 | This work is licensed under a Creative Commons Attribution 4.0 International License, which permits unrestricted use, distribution, and reproduction in any medium, provided the original work is properly cited. |