DOI:10.32604/cmc.2022.021930
| Computers, Materials & Continua DOI:10.32604/cmc.2022.021930 | |
| Research Article |
A Transfer Learning-Based Approach to Detect Cerebral Microbleeds
Mixed Reality and Interaction Lab, Department of Software, Sejong University, Seoul, 143-747, Korea
*Corresponding Author: Jong Weon Lee. Email: jwlee@sejong.ac.kr
Received: 20 July 2021; Accepted: 01 September 2021
Abstract: Cerebral microbleeds are small chronic vascular diseases that occur because of irregularities in the cerebrum vessels. Individuals and elderly people with brain injury and dementia can have small microbleeds in their brains. A recent study has shown that cerebral microbleeds could be remarkably risky in terms of life and can be riskier for patients with dementia. In this study, we proposed an efficient approach to automatically identify microbleeds by reducing the false positives in openly available susceptibility-weighted imaging (SWI) data samples. The proposed structure comprises two different pre-trained convolutional models with four stages. These stages include (i) skull removal and augmentation, (ii) making clusters of data samples using the k-mean classifier, (iii) reduction of false positives for efficient performance, and (iv) transfer-learning classification. The proposed technique was assessed using the SWI dataset available for 20 subjects. For our findings, we attained an accuracy of 97.26% with a 1.8% false-positive rate using data augmentation on the AlexNet transfer learning model and a 1.1% false-positive rate with 97.89% accuracy for the ResNet 50 model with data augmentation approaches. The results show that our models outperformed the existing approach for the detection of microbleeds.
Keywords: Microbleeds; deep convolutional neural network; ResNet50; AlexNet; computer-vision
Cerebral microbleeds (CMBs) are small chronic vascular diseases. The possibility of cerebral microbleeding increases with age. The occurrence of these tiny chronic particles in the brain is sometimes due to stroke [1–3], neurodegenerative disease [4], brain trauma [5], and sometimes amyloid angiography [6]. Significantly, these CMBs are a sign of potential blood loss for brain lesions, with higher numbers illustrating the future danger of intracranial loss, hemorrhagic stroke [7], and cognitive impairment [8]. For instance, a large number of CMB distributions may show the possibility of brain amyloid angiopathy [9], whereas the deep hemisphere CMB may show the occurrence of hypertensive vascular ailment [10]. Hence, there is a need for a robust and efficient model to detect CMBs. With the advancement in magnetic resonance imaging (MRI) technology, the performance of CMB detection has been enhanced. In paramagnetically sensitive blood MR sequences, such as susceptibility-weighted imaging (SWI) [11,12] and T2 Gre [13], the blood products are very complex to screen. The CMBs are low-signal hemorrhage point with 2–10 mm diameter [14].
Several imitators have the same characteristics of SWI, which are caused by basal-neural cross-section and iron clarification [15]. According to a statistical report, approximately 100+ impersonators in every individual’s image and the markers will take probably 10–15 min to identify CMBs and false positives [16]. The automatic detection of these CMBs is important in terms of reducing the radiologist’s burden. To address this issue, many specialists have applied deep computer vision algorithms [17].
SWI images are extensively used for the detection of CMBs as compared to MRIs. In susceptibility-weighted images, the weighted masks of this susceptibility are first generated from the high-filtered images and multiplied by the magnitude to produce complex samples. In SWI images, cerebral microbleeds are of very low intensity and oval in size. CMBs have many types, such as deposition of iron, blood, veins in the brain, and void signals due to low flow competition [8]. Therefore, manually detecting CMBs is not an efficient approach, as it produces false positives because of the similar structure and size of both CMBs and non-CMBs. It can be efficiently handled by automatic detection, in which the candidate is initially selected according to the classification stage to reduce the number of false positives. Numerous methods have been utilized for the detection of CMBs, including an end-to-end deep-learning approach and hand-crafted feature selection. In the end-to-end deep learning approach, a large number of labeled samples are required, and this approach is also expensive in terms of time complexity.
In this study, an automatic classification approach is proposed to identify microbleeds from SWI data samples. Our primary aim is to build a model that can attain high sensitivity with fewer false positives. In our proposed approach, we reduce the presence of false positives in SWI to attain higher sensitivity compared with other existing manual feature extracted and one-directional frameworks. As in state-of-the-art approaches, several methods have been utilized, including hand-crafted feature selection and end-to-end deep learning approaches, without handling the imbalance data. To overcome the limitations of state-of-the-art approaches and class imbalance issues, we utilized two different pre-trained deep learning models, AlexNet and ResNet50, for automatic classification with a data augmentation approach. The class-imbalance issue can also be solved in this way, as we have transferred the initial layers of these models to our dataset. The CMBs and non-CMBs images extracted from the SWI samples were then augmented to balance the number of each class. These samples were then tested using the proposed pre-trained transfer learning models. The proposed framework for the automatic classification of CMBs has the following key contributions:
• We designed a transfer learning approach by utilizing the AlexNet and ResNet50 models for accurate classification of cerebral microbleeds.
• To overcome the inadequate data samples, we utilized an augmentation approach with different parameters.
• To reduce the number of false-positives in MRI, an efficient approach is proposed to enhance the performance of CMB detection.
The remainder of this paper is organized as follows. Section 2 explains the literature review, Section 3 summarizes our proposed methodology, and Section 4 presents our results, followed by the conclusion.Several researchers have proposed different automated approaches that can detect CMBs by utilizing machine and deep learning methods. In all existing approaches, most of the techniques are segmentation-based or feature extraction from the images. Lu et al. [18] proposed an optimization approach for the detection of microbleeds from magnetic resonance images. For their findings, they extracted the features from the data samples using a pre-trained VGG network. These extracted features were trained using GBA for actual detection and achieved a 90% performance accuracy. Hong et al. [19] utilized a hybrid approach to first extract the features from the data sample and then applied the principal component analysis technique to reduce the size of the extracted feature set. They then used a shallow deep learning network by backpropagation with only a single layer to predict the CMB and non-CMBs. Based on their findings, they attained 88.43% performance accuracy. Bian et al. [20] applied a 2D fast radial symmetry transform to low-intensity SWI images. Their examination included geometric feature extraction from 3D growing regions on the CMB.
Their method included 15 individuals suffering from brain tumors, and for their findings, they attained 86.5% sensitivity. A genetic algorithm with a combination of backpropagation of neural networks was proposed by Tao et al. [21], who collected data samples from a total of 20 individuals and extracted the features from them. Initially, they utilized a backpropagation neural network with a genetic algorithm optimization approach to classify CMBs and non-CMBs and attained 86% sensitivity for their research findings.
Zhang et al. [22] proposed an approach to detect CMBs from SWI by extracting features from the CMB and non-CMB data samples. For classification, they utilized a seven-layer deep neural network. and attained 93.05% performance accuracy for their findings. Standvoss et al. [23] utilized the RF model for the detection of CMBs from MRI and achieved a sensitivity of 92.0%. Another group of researchers [24] also utilized the random forest model for traumatic brain injury diagnosis and achieved 89.1% performance accuracy. Heuvel et al. [25] proposed a machine algorithm that focused on the shape and intensity of features and manually extracted false positives from the images. For classification, they utilized a random forest classifier with a total of 100 trees. They attained an average sensitivity of 93% for their findings.
Ke et al. [26] worked on a versatile autonomous strategy for the identification of real mental imbalance disorders. They proposed an adaptive independent subspace analysis to explore useful information of microbleeds in MRI data samples. They extracted statistical features using a stochastic embedded approach and attained a 94.7% accuracy for their findings. Khan et al. [27] proposed a computerized multi-modular strategy for brain tumor classification by utilizing a deep learning approach. Recently, advancements in deep networks have significantly affected advanced image processing and its usage in medicinal image investigation, such as location [28–32]. In the field of object detection, normal two-phase algorithms incorporate FR-CNN [33], MR-CNN [34], and normal one-phase algorithms include YOLO [35] and SSD [36]. Seghier et al. [37] enrolled T2 images as a regular structure and subsequently utilized a Gaussian combination framework to recognize microbleeds from additional cerebrum structures. Dou et al. [38] prepared a deep learning framework to recognize microbleeds in SWI, fundamentally enhancing the accuracy of identification of microbleeds and attained a sensitivity of 93.2%. Liu et al. [39] utilized a 3-D spiral model of 154 datasets to choose candidate points. The best model of the 25validation datasets gives a 95.8% sensitivity. Gidaris et al. [40] utilized R-CNN with ground-truth to upgrade the high-level features and semantic information of the features. For their research finding, they utilized challenge dataset by encoding semantic segmentation, their highest performance accuracy for one dataset was 78.2%. Going through related work, several approaches exist for classifying and identifying the microbleeds, but these methods are limited in that they do not handle the false-positives and class imbalance, which need to be overcome in the detection of cerebral microbleeds. To address these limitations, we proposed a transfer-learning framework by handling false positives in SWI data samples.
The majority of approaches that have been utilized to detect CMBs automatically utilize pre-process approaches that determine the size, shape, and intensity features. These pre-processed features are not sufficient to distinguish between the CMB and non-CMB complex nature. If we compare the proposed method with other state-of-the-art approaches, our proposed method investigates a large feature set to achieve better performance. There are mainly three different phases of our proposed framework: (i) removal of the skull part, (ii) selection of the initial candidate to make clusters, (iii) post-processed images to reduce the false positives of images, and finally, we applied two pre-trained transfer learning models for the classification of microbleeds. Fig. 1 shows the overall general flow of the proposed methodology. Algorithm 1 shows the entire algorithm of the proposed methodology.

Figure 1: General flow diagram of proposed methodology

During the pre-processing step, we removed the external skull part of the brain. As in the detection of CMB, if we do not remove this skull part from the SWI data samples.
It will be difficult to reduce the number of false positives because the classification phase becomes confused with the presence of this skull part and microbleeds. Therefore, we removed the skull area using BrainSuite tools from the T2*-weighted medical images. After removing the skull, we applied the k-means clustering approach.
The k-means algorithm can separate the region of interest from the surrounding background. Using the k-mean algorithm, we separated out microbleeds from the surrounding false positives. This algorithm considers every feature of an image as a unique place in space; it arbitrarily creates clusters of different classes. Each pixel of the image was then assigned to the nearest cluster. Other post-processing methods are used to distinguish the actual microbleeds from false positives. Fig. 2 shows a graphical illustration of skull removal. It is clear from the figure that the skull contains many false positives.

Figure 2: Graphical representation of skull-part removal from the cerebrum
An enormous number of images lead to the efficient utilization of various CNN models. Overfitting is a typical concern that might occur when preparing the framework because of the small number of samples. As the framework tunes the cases alongside the training data, the model faces difficulty in predicting unseen samples. Alongside the inadequate amount of data, the unequal division of the samples having a place with various classes also possesses issues in efficient classification. To improve accuracy and performance and to stop the overfitting issue, more data should have been included in the training set. In this study, the classification issue handled additionally comes up with adequate samples to be put into a deep learning framework.
By looking into the imbalanced and small amount of training data samples, we increase the SWI data samples by utilizing image-augmentation methods in our proposed model. The samples with class names CMB and non-CMB are expanded by utilizing different augmentation methods, including left-to-right and top-to-bottom flipping of images. Another step is rotating the MRI image at −30°, 30° and Gaussian blur with a range of 0 and 3.0. Fig. 3 shows the new data sample attained by the augmentation, in which each sample is extended to six new samples.

Figure 3: Data samples generated by augmented approach
After removal of the skull, pre-processed images comprise connected components in terms of microbleeds and non-microbleeds. Therefore, the k-means clustering method is utilized to reduce the false positives from the data samples. For this, the common approach of selecting the center point was chosen for k-means clustering. The k-means algorithm uses Euclidean distance, Eq. (1) describes the Euclidean distance formula, which means that while making clusters, the similarity and dissimilarity of pixels are measured. Initially, the center point is randomly selected, and then the distance between the other connected pixels is calculated. Thus, the pixels having a minimum distance with connected pixels will be clustered together, and the loop begins until a new center point is found, which then becomes the centroid. This loop continues until there is no change in the mean of the value, and all pixels are clustered in their respective connected groups. Eq. (2) describes the center-point approach of the proposed method.
In the above equations, K represents the number of clusters made, m shows the maximum possible approximation of pixels, and the value of k changes between 1 and K. This k-means clustering approach is efficient in terms of clustering, as it guarantees the extensive difference in making distinct clusters based on the center point and mean value.
False positives are a positive outcome of negative results. This means that any non-microbleed part was classified as microbleeds. This is an issue, particularly with regard to medicinal images. The k-means from the previous stage provides a basic division of microbleeds. There is a need for further processing to reduce false-positives, as the microbleeds are so tiny that they can easily be mixed with other tissues during classification. In our proposed approach, we carried out a false-positive reduction step after augmentation and before the classification stage. By removing unwanted connected components depending on the shape and size of the microbleeds, we reduced the false positives in MRI.
3.5 Convolutional Neural Network (CNN) Using Transfer Learning Model
3.5.1 Model 1: Transfer-Learning (AlexNet)
We applied a pre-trained deep learning framework to manage the complex classification tasks. Our first model is AlexNet, which is a pre-trained convolutional framework trained on ImageNet data samples. It comprises a total of eight layers, including convolutional and fully connected layers. Along with these layers, there are two max-pooling layers and recurrent linear unit (ReLu) layers in the framework. The ReLu layer speeds up the training method and stops the overfitting issue in the classification. In the AlexNet framework, the principal layer is the input layer, where we provide augmented SWI images.
The required size of the input images in this framework is 224 × 224 × 3. The size of the first convo layer was 11 × 11 × 3 with a kernel number of 96. The output of this layer is the input of the first max-pooling layer, which is standardized and then directed to the second convolutional layer of the framework as input. This second convo layer has a size of 5 × 5 × 48 with 256 kernels. In addition, the outcome from the first max-pool layer was reduced. The size of the third convo layer was 3 × 3 × 256 with 384 kernels. There are no pooling layers between the last three convolutional layers. The size of the second last and last convo layers is 3 × 3 × 192 with 384 and 256 kernels, respectively. After these convolutional layers in the framework, there is a fully connected layer that contains 4096 kernels. Fig. 4 shows the proposed AlexNet framework. In this framework, low-level features are found in the initial layers, whereas the last layers contain highly advanced features. Thus, to train the SWI data samples, the class-specific layers were transferred with the new last layers and then the entire network was fine-tuned. This means that we removed the initial layers of the AlexNet model and replaced them with the last high-class layers.

Figure 4: The proposed transfer learning model of AlexNet for the classification of CMB
In this pre-trained model, the first five layers are the transfer-learning layers, whereas the last three layers are new layers. For efficient classification, new layers were trained on the SWI samples. To fine-tune the AlexNet network, we fine-tuned the hyperparameters of this network on our 80% of the training data. These parameters mainly include epochs, cluster size, approval recurrence, and learning rate. A maximum of 11 epochs were used. To evaluate the performance of our trained model, the remainder of the data samples were passed as testing data samples to the framework. In light of the performance measure, we evaluated the accuracy of the trained network. On the testing data, we can determine how fine a network is prepared to classify CMB and non-CMB.
3.5.2 Model 2: Transfer Learning Using ResNet 50
The proposed approach intends to improve the performance accuracy of SWI images while utilizing the CNN model. Keeping in mind the robust performance of the model, we chose the Residual Network (ResNet50). ResNet is a short type of residual network with 50 layers. At the point when analysts began to follow the expression “the deeper the better” with deep learning models, they experienced a few issues. “The deeper the network is, the better the performance of the network ought to be better”. This hypothesis was rejected when a deep network with 52 layers gave low output when contrasted with the networks with 20–30 layers [32]. Numerous predictions account for this decrease in the performance of the model, and the most appropriate justification for this is because of the vanishing gradient. At the point when the network is too deep, the value of the gradient goes to 0, which causes the weights not to load, and thus no learning is performed.
Deep networks face numerous complexities including network optimization, degradation, and, in particular, vanishing gradients. As indicated in the literature, fine-tuning a pre-trained CNN network can build classification more accurately in a particular area. Fig. 5 shows the framework of ResNet utilized in the proposed method to classify microbleeds.

Figure 5: The framework of ResNet utilized in the proposed method to classify the microbleeds
In the ResNet50 design, there are various groups of indistinguishable layers, and each layer is recognized by a distinct separate layer. The epoch number referred to as cycles used to train a fine-tuned network is less when compared with training the model without any training, that is, training from the scratch. It is recommended to utilize the model created and prepared for a task as the beginning stage of the tasks that are similar to the trained one. Fig. 3 shows that the principal layer is a convolution layer with a size of 7 × 7 and 64 parts, followed by a 3 × 3 max-pooling layer. Next, there is a square of indistinguishable layers isolated by various tones. The general boundaries of ResNet50 are 23.521M. Multi-dimensional information issues are taken care of by presenting two alternate routes.
Thus, to train the SWI data samples, the class-specific layers were transferred with the new last layers and then the entire network was fine-tuned. In this pre-trained model, the first five layers are the transfer-learning layers, whereas the last three layers are new layers. For efficient classification, new layers were trained on the SWI samples. To fine-tune the AlexNet network, we fine-tuned the hyperparameters of this network on our 80% of the training data. These parameters mainly include epochs, cluster size, approval recurrence, and learning rate. A maximum of 11 epochs were used. To evaluate the performance of our trained model, the remainder of the data samples were passed as testing data samples to the framework. In light of the performance measure, we evaluated the accuracy of the trained network.
To assess our proposed framework for the detection of CMB, we utilized SWI data samples from 20 individuals. In SWI, several images have more than one microbleed. In Fig. 6, the green boxes show the healthy, normal cells in the brain, whereas the red boxes highlight the microbleeds. We utilized a Philips medical scheme of 3.0T to produce these samples by setting 17 ms reiteration time of 24 ms reverberation time with a 2-mm cut thickness. The cut separating was 1 mm in 0.45 × 0.45 mm goals. By following a micro-drain functional rating scale, two experienced raters marked the entire data sample. For our findings, we utilized the axial perspective on 3D images. For training and testing purposes, the data were divided into 80:20 ratios, that is, 80% training and 20% testing. Fig. 6 representing the samples in which a single MRI contained more than one microbleed.

Figure 6: Sample images from the dataset
To assess the performance of our proposed framework, we used the accuracy, sensitivity, specificity, and precision. Accuracy is described as the ability to distinguish between CMBs and non-CMBs correctly. Sensitivity describes the ability to correctly predict CMB cases, whereas specificity is the correct classification of non-CMBs. Precision describes the accuracy of all measurements. These measures can be mathematically defined as:
where Tpositive denotes the true positive values that are correctly predicted in the output. Tnegative is the predicted value, which is negative but predicted as positive in the outcome. Similarly, Fpositive means the false negative values that are not correctly predicted in the output and predict as a positive value instead of a negative value. Fnegative means a negative value but is predicted as negative in the outcome, but in reality it is a negative value.
In our proposed experimentation, we divided the data into an 80:20 proportion, where the training data were 80% and the testing data were 20%. The reason why Fpositive is much higher in the recognition of microbleeds is the presence of the “skull” area. Therefore, we eliminated the external pieces of the skull. As stated previously, microbleeds are small constituents with a small size. It is difficult to distinguish these CMBs due to the occurrence of normal healthy tissues. The hard clustering approach, that is, k-means clustering, is efficient and quick.
The data are intended to gather the pixels in the most ideal manner such that all the pixels are clustered in their particular cluster in terms of their connected components. Fig. 7 shows some sample clusters generated by the k-means algorithm. We generated four unique clusters and selected the optimum cluster with a lower Fpositive. As shown in Fig. 6, we selected the K2 cluster as it has fewer Fpositives with a clear ROI. We have made some changes to the conventional methodology in order to reduce the Fpositive without relying on many pre-processing steps. To achieve efficient detection of microbleeds, if any non-microbleeds are recognized as microbleeds, it will affect the classification. Figs. 8 and 9 show samples of the microbleeds and non-microbleeds part of the brain, respectively.

Figure 7: K-mean cluster samples for the selection of best ROI candidate

Figure 8: The red squares shows the true samples of CMB in brain MRI

Figure 9: These images shows the non-CMB samples in brain MRI
Most importantly, the tests were completed by 20 people with microbleeds. After the false-positive reduction, we utilized two pre-trained models separately. Both models were trained on the ImageNet dataset with 1.2B label images. All these 1.2 billion images cover approximately one thousand different classes, and the human experts labeled these images. The process of familiarizing the pre-trained CNN to train the SWI dataset is referred to as fine-tuning.
It is an automatic process for extracting and transferring features in both models. Both models provided the required optimum output. We fine-tuned our models by updating the learn-rate factor, bias factor, and weight-learn factor. We fine-tuned the model. To obtain optimum outcomes, we changed the training parameters. Tab. 1 shows the performance in terms of the accuracy of our proposed approach using two different models with augmentation.
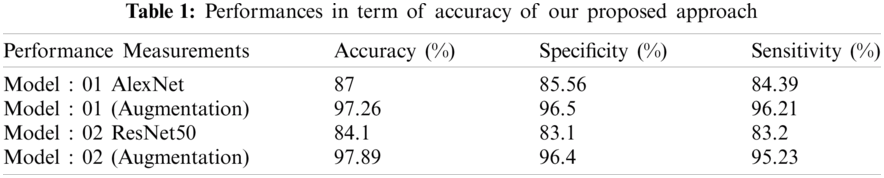
Fig. 10 shows the training procedure of the AlexNet model for epoch size 11 with augmentation of data. In the figure, the blue line illustrates the training procedure in terms of the accuracy of the data. However, the black line in this figure illustrates the validation accuracy of the model. We attained a performance accuracy of 97.26% %by utilizing image augmentation. The graph on the right in Fig. 10 illustrates the loss during the training procedure of the framework. We also performed an experiment using SWI data samples without using the augmentation approach to compare the performance and classification outcomes.

Figure 10: Training process of AlexNet framework with augmentation approach to identifies microbleeds at epoch 11
Fig. 11 shows the training procedure of AlexNet model on epoch size 11 without augmentation of data on SWI images. In the figure, the line in blue color illustrates the training procedure in terms of the accuracy of the data. However, the black line in this figure illustrates the validation accuracy of the model. We have attained 87% performance accuracy without the image augmentation. The right-side graph in Fig. 11 illustrates the loss during the training procedure of the framework. These training graphs show that with extensive data augmentation approaches, the performance of the classification becomes more accurate and optimal. The proposed approach intends to improve the performance accuracy of the image while utilizing the CNN model. Keeping in mind the robust performance of the model, we choose Residual Network (ResNet50) for the evaluation. ResNet is the short type of Residual organization with 50 layers. Similarly, AlexNet model, we also utilized ResNet50 as our second model for the detection of microbleeds. This model typically used fully connected layers.

Figure 11: Training Process of AlexNet framework without the augmentation approach to identifies microbleeds at epoch 11
Fig. 12 shows the training procedure of ResNet50 on epoch size 10 with the utilization of augmentation of data. In the figure, the line in blue color illustrates the training procedure in terms of the accuracy of the data. However, the black line in this figure illustrates the validation accuracy of the model. We have attained 97.89% performance accuracy by utilizing image augmentation. The right-side of the graph in Fig. 12 illustrates the loss during the training procedure of the framework. We also performed experiments using SWI data samples without the utilization of the augmentation approach to compare the performance and classification outcomes. Fig. 13 shows the training procedure of ResNet50 on epoch size 11 without augmentation of data. In the figure, the line in blue color illustrates the training procedure in terms of the accuracy of the data. However, the black line in this figure illustrates the validation accuracy of the model.

Figure 12: Training Process of ResNet50 framework with augmentation approach to identifies microbleeds at epoch 10

Figure 13: Training process of ResNet50 framework without the augmentation approach to identifies microbleeds at epoch size 10
We attained 84.1% performance accuracy without image augmentation approaches. The right side of the graph in Fig. 13 illustrates the loss during the training procedure of the framework. These training graphs show that with extensive data augmentation approaches, the performance of the classification becomes more accurate. In this examination, we achieved a maximum accuracy of 97.89% with one false positive for microbleeds.
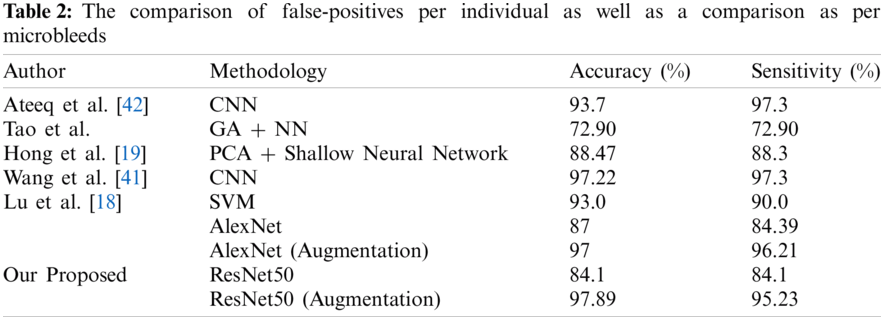
To assess the performance of our proposed model, we analyzed its performance results with state-of-the-art approaches in terms of accuracy and sensitivity. To clarify the comparison approach, we utilized accuracy and sensitivity. Different research groups, Lu et al. [18], Hong et al. [19], Tao et al. [21], Wang et al. [41], and Ateeq et al. [42] used the best in class AI methods to analyze cerebral microbleeds from cerebrum MRI.
The comparison must be made by considering that our proposed framework requires no post-processing system from false-positive reduction. Fig. 14 shows the performance comparison graph of our proposed techniques in terms of accuracy, which shows the results with and without the utilization of augmentation approaches. Tab. 2 shows the comparison of false-positives per individual as well as a comparison as per microbleeds.

Figure 14: Comparison between proposed models
To detect microbleeds, advanced image processing and computer vision approaches provide optimum results. The diagnosis of cerebral microbleeds is the most challenging and active domain in medicinal image processing. It can easily be noticed that manual segmentation yields false positives due to the same size and structure of CMBs and healthy tissues. Hence, the detection of microbleeds and their classification from SWI data samples remains challenging. The key objective of this proposed study was to design a methodology that is completely automated in reducing false-positives and diagnosing CMB from SWI images with no manual work. Another objective of this investigation was to improve the performance accuracy of the proposed framework. The proposed work utilized two pre-trained CNN models and a k-means clustering approach to reduce false positives. The proposed system can accurately identify CMBs from non-CMBs, which provides a diagnostic reference to medicinal specialists. The proposed framework addresses a two-class binary classification. The performance accuracies of ResNet50 and AlexNet with augmentation were 97% and 97%, respectively. In future work, we will focus on visualizing the microbleeds in MRI. Furthermore, the proposed structure can be improved by creating a deep feature extraction model from a neural network.
Acknowledgement: This research was financially supported by the MOTIE (Ministry of Trade, Industry and Energy) and the KIAT (Korea Institute for Advancement of Technology) through the International Cooperative R&D program (Project No.P0016038) and This research was supported by the MSIT (Ministry of Science and ICT), Korea, under the ITRC (Information Technology Research Center) support program (IITP-2021-2016-0-00312)supervised by the IITP (Institute for Information & Communications Technology Planning & Evaluation).
Funding Statement: This research was supported by the MSIT (Ministry of Science and ICT), Korea, under the ITRC (Information Technology Research Center) support program (IITP-2021–2016–0–00312) supervised by the IITP (Institute for Information & Communications Technology Planning & Evaluation).
Conflicts of Interest: The authors declare that they have no conflicts of interest to report regarding the present study.
1. Z. Chen, Y. Ding, X. Ji, X. Yin and R. Meng, “Advance of antithrombotic treatment in patients with cerebral microbleed,” Journal of Thrombosis and Thrombolysis, vol. 51, pp. 530–535, 2021. [Google Scholar]
2. S. A. Mayer, N. C. Brun, J. Broderick, S. Davis, M. N. Diringer et al., “Safety and feasibility of recombinant factor VIIa for acute intracerebral hemorrhage,” Stroke, vol. 36, pp. 74–79, 2005. [Google Scholar]
3. A. Charidimou, G. Turc, C. Oppenheim, S. Yan, J. F. Scheitz et al., “Microbleeds, cerebral hemorrhage, and functional outcome after stroke thrombolysis: Individual patient data meta-analysis,” Stroke, vol. 48, pp. 2084–2090, 2017. [Google Scholar]
4. T. Polyakova and O. Levin, “Cerebral microbleeds in cerebrovascular and neurodegenerative diseases with cognitive impairments,” Neuroscience and Behavioral Physiology, vol. 47, pp. 1078–1085, 2017. [Google Scholar]
5. A. Irimia, A. Dharani, D. R. Van Ngo and K. Rostowsky, “Age, Sex and cerebral microbleed effects on white matter degradation after traumatic brain injury,” Innovation in Aging, vol. 4, pp. 886, 2020. [Google Scholar]
6. R. J. Cannistraro and J. F. Meschia, “The clinical dilemma of anticoagulation use in patients with cerebral amyloid angiopathy and atrial fibrillation,” Current Cardiology Reports, vol. 20, p. 106, 2018. [Google Scholar]
7. Y. H. Fan, L. Zhang, W. W. Lam, V. C. Mok and K. S. Wong, “Cerebral microbleeds as a risk factor for subsequent intracerebral hemorrhages among patients with acute ischemic stroke,” Stroke, vol. 34, pp. 2459–2462, 2003. [Google Scholar]
8. M. M. Poels, M. A. Ikram, A. van der Lugt, A. Hofman, W. J. Niessen et al., “Cerebral microbleeds are associated with worse cognitive function: The rotterdam scan study,” Neurology, vol. 78, pp. 326–333, 2012. [Google Scholar]
9. A. Charidimou and D. J. Werring, “Cerebral microbleeds: Detection, mechanisms and clinical challenges,” Future Neurology, vol. 6, pp. 587–611, 2011. [Google Scholar]
10. P. B. Gorelick, A. Scuteri, S. E. Black, C. DeCarli, S. M. Greenberg et al., “Vascular contributions to cognitive impairment and dementia: A statement for healthcare professionals from the American heart association/American stroke association,” Stroke, vol. 42, pp. 2672–2713, 2011. [Google Scholar]
11. J. R. Reichenbach, R. Venkatesan, D. J. Schillinger, D. K. Kido and E. M. Haacke, “Small vessels in the human brain: MR venography with deoxyhemoglobin as an intrinsic contrast agent,” Radiology, vol. 204, pp. 272–277, 1997. [Google Scholar]
12. E. M. Haacke, “Susceptibility weighted imaging (SWI),” Zeitschrift Fur Medizinische Physik, vol. 16, pp. 237–237, 2006. [Google Scholar]
13. D. G. Healy, M. Falchi, S. S. O'Sullivan, V. Bonifati, A. Durr et al., “Phenotype, genotype, and worldwide genetic penetrance of LRRK2-associated Parkinson's disease: A case-control study,” The Lancet Neurology, vol. 7, pp. 583–590, 2008. [Google Scholar]
14. S. M. Greenberg, M. W. Vernooij, C. Cordonnier, A. Viswanathan, R. A. S. Salman et al., “Cerebral microbleeds: A guide to detection and interpretation,” The Lancet Neurology, vol. 8, pp. 165–174, 2009. [Google Scholar]
15. C. Cordonnier, R. Al-Shahi Salman and J. Wardlaw, “Spontaneous brain microbleeds: Systematic review, subgroup analyses and standards for study design and reporting,” Brain, vol. 130, pp. 1988–2003, 2007. [Google Scholar]
16. N. J. Vickers, “Animal communication: When i'm calling you, will you answer too?” Current Biology, vol. 27, pp. R713–R715, 2017. [Google Scholar]
17. T. Liu, W. Fan and C. Wu, “A hybrid machine learning approach to cerebral stroke prediction based on imbalanced medical dataset,” Artificial Intelligence in Medicine, vol. 101, pp. 101–723, 2019. [Google Scholar]
18. S. Lu, K. Xia and S.-H. Wang, “Diagnosis of cerebral microbleed via VGG and extreme learning machine trained by Gaussian map bat algorithm,” Journal of Ambient Intelligence and Humanized Computing, vol. 1, pp. 1–12, 2020. [Google Scholar]
19. J. Hong and Z. Lu, “Cerebral microbleeds detection via discrete wavelet transform and back propagation neural network,” in 2nd Int. Conf. on Social Science, Public Health and Education (SSPHE 2018Sanyan, China, pp. 228–232, 2019. [Google Scholar]
20. W. Bian, C. P. Hess, S. M. Chang, S. J. Nelson and J. M. Lupo, “Computer-aided detection of radiation-induced cerebral microbleeds on susceptibility-weighted MR images,” NeuroImage: Clinical, vol. 2, pp. 282–290, 2013. [Google Scholar]
21. Y. Tao and R. S. Cloutie, “Voxelwise detection of cerebral microbleed in CADASIL patients by genetic algorithm and back propagation neural network,” in 2018 3rd Int. Conf. on Communications, Information Management and Network Security (CIMNS 2018Wuhan, China, pp. 101–105, 2018. [Google Scholar]
22. Y. D. Zhang, Y. Zhang, X.-X. Hou, H. Chen and S.-H. Wang, “Seven-layer deep neural network based on sparse autoencoder for voxelwise detection of cerebral microbleed,” Multimedia Tools and Applications, vol. 77, pp. 10521–10538, 2018. [Google Scholar]
23. K. Standvoss, T. Crijns, L. Goerke, D. Janssen, S. Kern et al., “Cerebral microbleed detection in traumatic brain injury patients using 3D convolutional neural networks,” in SPIE, Medical Imaging 2018, Texas, United States: Computer-Aided Diagnosis, vol. 1, pp. 105751D, 2018. [Google Scholar]
24. T. V. Heuvel, A. V. D. Eerden, R. Manniesing, M. Ghafoorian, T. Tan et al., “Automated detection of cerebral microbleeds in patients with traumatic brain injury,” NeuroImage: Clinical, vol. 12, pp. 241–251, 2016. [Google Scholar]
25. S. R. Barnes, E. M. Haacke, M. Ayaz, A. S. Boikov, W. Kirsch et al., “Semiautomated detection of cerebral microbleeds in magnetic resonance images,” Magnetic Resonance Imaging, vol. 29, pp. 844–852, 2011. [Google Scholar]
26. J. Zhang, W. Wei, D. Robertas and W. Marcin, “Adaptive independent subspace analysis (AISA) of brain magnetic resonance imaging (MRI) data,” IEEE Access, vol. 7, pp. 12252–12261, 2019. [Google Scholar]
27. M. A. Khan, I. Ashraf, M. Alhaisoni, R. Damaševičius, R. Scherer et al., “Multimodal brain tumor classification using deep learning and robust feature selection: A machine learning application for radiologists,” Diagnostics, vol. 10, pp. 5–65, 2020. [Google Scholar]
28. J. M. Wolterink, T. Leiner, B. D. Vos, R. W. V. Hamersvelt, M. A. Viergever et al., “Automatic coronary artery calcium scoring in cardiac CT angiography using paired convolutional neural networks,” Medical Image Analysis, vol. 34, pp. 123–136, 2016. [Google Scholar]
29. K. Kuan, M. Ravaut, G. Manek, H. Chen, J. Lin et al., “Deep learning for lung cancer detection: Tackling the kaggle data science bowl 2017 challenge,” arXiv preprint arXiv: vol. 1, pp. 1705.09435, 2017. [Google Scholar]
30. J. J. Näppi, T. Hironaka, D. Regge and H. Yoshida, “Deep transfer learning of virtual endoluminal views for the detection of polyps in CT colonography,” in Proc. of the 5th Int. Conf. on Medical Imaging: Computer-Aided Diagnosis, Orlando, Forida, United States, vol. 1, pp. 97852B, 2016. [Google Scholar]
31. H.-C. Shin, H. R. Roth, M. Gao, L. Lu, Z. Xu et al., “Deep convolutional neural networks for computer-aided detection: CNN architectures, dataset characteristics and transfer learning,” IEEE Transactions on Medical Imaging, vol. 35, pp. 1285–1298, 2016. [Google Scholar]
32. T. Kooi, G. Litjens, B. Van Ginneken, A. Gubern-Mérida, C. I. Sánchez et al., “Large scale deep learning for computer aided detection of mammographic lesions,” Medical Image Analysis, vol. 35, pp. 303–312, 2017. [Google Scholar]
33. S. Ren, K. He, R. Girshick and J. Sun, “Faster r-cnn: Towards real-time object detection with region proposal networks,” in Proc. of the 28th Int. Conf. on Neural Information Processing Systems, New York City, Ny, USA, pp. 91–99, 2015. [Google Scholar]
34. T. F. Ursuleanu, A. R. Luca, L. Gheorghe, R. Grigorovici, S. Lancu et al., “Mask r-cnn,” in 2017 IEEE Int. Conf. on Computer Vision, Venice, Italy, pp. 2980–2988, 2017. [Google Scholar]
35. J. Redmon and A. Farhadi, “Yolov3: An incremental improvement,” arXiv preprint arXiv: vol. 1, pp.1804.02767, 2018. [Google Scholar]
36. L. Hendricks, Z. Akata, M. Rohrbach, J. Donahue, B. Schiele et al., “Generating visual explanations,” in Computer Vision–ECCV 2016, ECCV 2016,” Lecture Notes in Computer Science, vol. 9908, pp. 1, 2016. [Google Scholar]
37. L. Karthik, G. Kumar, T. Keswani, A. Bhattacharyya, S. S. Chandar et al., “Protease inhibitors from marine actinobacteria as a potential source for antimalarial compound,” PloS One, vol. 9, pp. e90972, 2014. [Google Scholar]
38. Q. Dou, H. Chen, L. Yu, L. Zhao, J. Qin et al., “Automatic detection of cerebral microbleeds from MR images via 3D convolutional neural networks,” IEEE Transactions on Medical Imaging, vol. 35, pp. 1182–1195, 2016. [Google Scholar]
39. S. Liu, D. Utriainen, C. Chai, Y. Chen, L. Wang et al., “Cerebral microbleed detection using susceptibility weighted imaging and deep learning,” NeuroImage, vol. 198, pp. 271–282, 2019. [Google Scholar]
40. S. Gidaris and N. Komodakis, “Object detection via a multi-region and semantic segmentation-aware cnn model,” in Proc. of the IEEE Int. Conf. on Computer Vision, new York City, Ny, USA, vol. 1, pp. 1134–1142, 2015. [Google Scholar]
41. S. Wang, J. Sun, I. Mehmood, C. Pan, Y. Chen et al., “Cerebral micro-bleeding identification based on a nine-layer convolutional neural network with stochastic pooling,” Concurrency and Computation: Practice and Experience, vol. 32, pp. e5130, 2020. [Google Scholar]
42. T. Ateeq, M. N. Majeed, S. M. Anwar, M. Maqsood, Z.-U. Rehman et al., “Ensemble-classifiers-assisted detection of cerebral microbleeds in brain MRI,” Computers & Electrical Engineering, vol. 69, pp. 768–781, 2018. [Google Scholar]
 | This work is licensed under a Creative Commons Attribution 4.0 International License, which permits unrestricted use, distribution, and reproduction in any medium, provided the original work is properly cited. |