DOI:10.32604/cmc.2022.022553
| Computers, Materials & Continua DOI:10.32604/cmc.2022.022553 | |
| Article |
Hypo-Driver: A Multiview Driver Fatigue and Distraction Level Detection System
1College of Computer and Information Sciences, Imam Mohammad Ibn Saud Islamic University (IMSIU), Riyadh, 11432, Saudi Arabia
2Department of Electrical Engineering, Benha Faculty of Engineering, Benha University, Qalubia, Benha, 13518, Egypt
*Corresponding Author: Qaisar Abbas. Email: qaabbas@imamu.edu.sa
Received: 11 August 2021; Accepted: 22 September 2021
Abstract: Traffic accidents are caused by driver fatigue or distraction in many cases. To prevent accidents, several low-cost hypovigilance (hypo-V) systems were developed in the past based on a multimodal-hybrid (physiological and behavioral) feature set. Similarly in this paper, real-time driver inattention and fatigue (Hypo-Driver) detection system is proposed through multi-view cameras and biosignal sensors to extract hybrid features. The considered features are derived from non-intrusive sensors that are related to the changes in driving behavior and visual facial expressions. To get enhanced visual facial features in uncontrolled environment, three cameras are deployed on multiview points (0°, 45°, and 90°) of the drivers. To develop a Hypo-Driver system, the physiological signals (electroencephalography (EEG), electrocardiography (ECG), electro-myography (sEMG), and electrooculography (EOG)) and behavioral information (PERCLOS70-80-90%, mouth aspect ratio (MAR), eye aspect ratio (EAR), blinking frequency (BF), head-titled ratio (HT-R)) are collected and pre-processed, then followed by feature selection and fusion techniques. The driver behaviors are classified into five stages such as normal, fatigue, visual inattention, cognitive inattention, and drowsy. This improved hypo-Driver system utilized trained behavioral features by a convolutional neural network (CNNs), recurrent neural network and long short-term memory (RNN-LSTM) model is used to extract physiological features. After fusion of these features, the Hypo-Driver system is classified hypo-V into five stages based on trained layers and dropout-layer in the deep-residual neural network (DRNN) model. To test the performance of a hypo-Driver system, data from 20 drivers are acquired. The results of Hypo-Driver compared to state-of-the-art methods are presented. Compared to the state-of-the-art Hypo-V system, on average, the Hypo-Driver system achieved a detection accuracy (AC) of 96.5%. The obtained results indicate that the Hypo-Driver system based on multimodal and multiview features outperforms other state-of-the-art driver Hypo-V systems by handling many anomalies.
Keywords: Internet of things (IoT); intelligent transportation; sensors; multiview points; transfer learning; convolutional neural network; recurrent neural network; residual neural network; multimodal features
Internet of things (IoT) [1] is a rapidly growing research area in which huge data gathering and processing are performed through cloud-based applications. These IoT-cloud-based applications are developed by integrating smartphones, sensors, and machines. To achieve the concept of smart cities, the authors are developing innovative applications based on IoT systems. Therefore, IoT-based systems are utilizing sensors-based smartphones [2] and cloud-based architecture for developing smart cities [3]. In practice, the IoT-based [4,5] applications have provided novel solutions to decrease traffic accidents due to driver hypo-vigilance (Hypo-V) and distraction behavior. Due to an increase in population, driving on highways [6] is becoming more complex and challenging tasks even for expert drivers. To increase the driver’s Hypo-V level [7], it is required that some applications should be designed to determine their behaviors and physiological conditions. Due to the increasing number of accidents and population, cloud-based computing and driver behavior prediction tools are used nowadays to prevent road accidents. As a result, there is a dire need to improve the quality of safe driving and make a critical decision to respond accurately in emergencies. Predicting a driver’s behavior [8] is a crucial part and shows a key role in the design of intelligent transport systems. Those systems helped to increase the efficiency and safety of drivers [9]. It has been noticed that the driver behavior and phycological conditions are the main causes of road accidents due to the loss of Hypo-V on the roads. Improper driving behavior is the leading cause of accidents and thus, detection of driver behavior is an evolving area of research interest. In the past studies, there are several driver fatigue detection systems (FDS) and distraction techniques known as Hypo-V detection have been developed and successfully implemented by the leading manufacturer companies. Driver behavior analysis [10] plays an important role in gathering the huge data of driving. Several algorithms are using cloud-computing platforms [11] for predicting behavior and to do data gathering in real-time. In those studies, they use different hardware components such as a mobile camera and sensors such as gyroscope, accelerometer, and Global Positioning System (GPS) information to gather critical patterns. Afterward, the researchers utilize machine-learning algorithms to classify the data and predict the driver level of hypo-V conditions.
Driver Hypo-vigilance (Hypo-V) [12] is an important factor to verify the level of attention. This Hypo-V state of the drivers is classified into five states namely: normal, visual inattention, cognitive inattention, fatigue, and drowsy. Several researchers have used these states to predict drivers’ conditions by using various measures such as 1) Physiological 2) Subjective 3) Behavioural 4) Vehicle-based and 5) Hybrid measure [13]. Currently, researchers are using a single or combination of these measures to provide better prediction results. Compared to single measures, the combination of features as multimodal features to develop a Hypo-vigilance system is getting more successful. To real-time implement the Hypo-vigilance system, it is required to use high computational power such as provided by the cloud-computing infrastructure. Several driver fatigue detection systems have been developed in the past, which is briefly explained in Section 2. Many researchers identified driver drowsiness through multimodal features and few of them utilized cloud-based architecture. In the past, Hypo-V detection systems are easily affected by the utilization of un-effective behavior and physiological features. As a result, it is better to mount sensors or cameras on the vehicles, but those devices are expensive. Moreover, the researchers are using cloud-based computational architecture to detect and predict multiple states of Hypo-V conditions. Hence, in this paper, the same approach is followed by using the fusion of effective multimodal features in a new deep-learning architecture for predicting and recognizing the hypo-V level of drivers.
Hypo-Driver is developed through training of the visual and non-visual features from 2-D images and 1-D sensor signals, respectively. To build a Hypo-Driver system, the new pre-trained convolutional layers and dropout layers are added to recognize driver distraction and fatigue into five-stages. The paper’s primary work is to develop a system to detect real-time hypovigilance-level of drivers by using multimodal features and recognized by deep learning architecture. A real-time driver distraction and fatigue (Hypo-Driver) detection system is developed in this paper through multi-view cameras and biosignal sensors to classify five states of hypovigilance. To develop Hypo-Driver system, the physiological signals (electroencephalography (EEG), electrocardiography (ECG), electro-myography (sEMG), and electrooculography (EOG)) and behavioural information (PERCLOS70-80-90%, mouth aspect ratio (MAR), eye aspect ratio (EAR), blinking frequency (BF), head-titled ratio (HT-R)) are collected and pre-processed, then followed by feature selection/reduction and fusion techniques. After fusion these features, the Hypo-Driver system is classified Hypo-V into five stages based on trained layers and dropout-layer in the deep residual neural network (DRNN) model. These steps are explained in the Section 3.
Multimodal-based features used to define the various level of hypovigilance (Hypo-V) have received a lot of interest in recent research due to their capacity to leverage deep models to recognize different activities of drivers. Many authors currently use a variety of data sources [14] to fuse as multimodal features, such as the physiological condition (electroencephalography (EEG), electrocardiography (ECG), electro-myography (sEMG), and electrooculography (EOG)) of the driver, behavioral aspects, vehicle, and environment information. Compared to other features, the physiological and behavioral features have primarily been employed in the past to develop real-time detection of Hypo-V systems. To implement Hypo-V system, many authors advise incorporating sensor data into the vision-based models to enhance the system’s generalization capabilities. Hence, the multimodal features are defined by combining the behavioral and physiological features into a single vector. These multimodal features are derived based on early and late fusion approaches. Those Hypo-V systems by using multimodal features are briefly explained in the upcoming paragraphs.
Authors in reference [15] use EEG, Gyroscope, and vision-based features to make hybrid neural network architecture for the detection of driver drowsiness. Similarly, in reference [16], the authors use multimodal features to detect hypovigilance states. They also use a multimodal alertness dataset that comprises of physiological, environmental, and vehicular features. In another study, the authors attempt to create intelligent vehicles [17]. Whereas in reference [18], the authors use the driver’s pulse rate using a wrist tracker, extract facial expressions with an RGB camera to detect multimodal features. A single RGB-D camera is utilized to fix these challenges and only detect three fatigue characteristics (pulse rate, degree of eye-opening, and level of mouth-opening). Data from the brain and eyes are collected using the EEG and EOG sensors, respectively. Those multimodal features are given as input to the fusion technique to automatically detect hypo-vigilance [19]. Their technique uses a single EEG channel to eliminate false detection. The methodology presented in [20] combines both the EEG (diagnostic techniques and fuzzy logic), and two EOG (blinking detection and drowsiness characterization)-based techniques. It reduces the false alarm rate to 5% while increasing the correct classification rate of drowsiness (awake, drowsy, and very drowsy) levels to 80.6%. The methodology reported in [21] uses the EEG and cervical EMG signals for driver fatigue assessment, with a model based on feature fusion and transfer learning. It results in a recognition rate higher than that offered by the traditional support vector machine method, thus improving robustness. The technique presented in [22] uses features extracted from the ECG and from the multi-channel EEG alpha and beta features. The driver’s mental fatigue is detected based on significant differences (p < 0.5) measured before and after the driving task. The state of driver drowsiness is best classified when physiological (EEG, ECG) signals, behavioral measures (camera), and driving performance (seat pressure, DS parameter) are combined. The system provides 81.4% and 92.9% classification accuracy, respectively, for the alert vs. slightly drowsy and alert vs. moderately drowsy states using the random forest method [23]. This work focuses on a hybrid measure (physiological and behavioral) to detect driver hypovigilance using feature reduction and fusion techniques.
In reference [24], the authors determine distracted driving through the vehicle’s driver image and multisensor to define multimodal features. The convolutional neural network (CNN) models are created by transfer learning and then use the recurrent neural network and long short-term memory (RNN-LSTM) model for predicting the Hypo-V stage. Whereas in reference [25], the authors use multimodal features to recognize driver’s three actions based on a combination of CNN and RNN and achieved 87% of detection accuracy. In the study of reference [26], the author used multimodality-based physiological and behavioral features. They show that the EEG signals can be easily mixed with forehead EOG signals to identify an effective driver hypovigilance state. The authors use the stack-based autoencoders (SAEs) deep learning (DL) model by applying a multimodal fusion approach. In reference [27], the authors develop a multimodal features-based dataset based on the identification of eye blinks and the measurement of attention levels known as mEBAL. The authors deploy two cameras near-infrared (NIR) and RGB to capture vision features and EEG sensors. In another reference [28], the authors define multimodal features based on surface electromyography (sEMG), electroencephalography (EEG), interface pressure of the seat, blood pressure, heart rate, and level of oxygen saturation. Whereas in reference [29], they utilize time, spectral and wavelet-based techniques to define multimodal features through ECG signals, galvanic skin response, and respiration signals. In that study, the authors develop sparse Bayesian learning (SBL) to detect fatigue-level and the principal component analysis (PCA) technique is used to get optimal features. They report 89% of detection accuracy. Compared to this approach, the authors in reference [30] utilize EEG, EOG, and ECG signals to define features and the support vector machine (SVM) classifier is used to detect fatigue. Likewise in reference [31], the authors use EEG, EOG, and ECG signals to define multimodal features and obtained significant results. The PERCLOS (percentage of eyelid closure) index, EEG, and EOG multimodal features are also deployed in reference [32] to define the hypo-V state of the drivers. A deep LSTM model is utilized in reference [33] to classify driver fatigue after extraction features through EEG and EOG signals. An LSTM model is also utilized in [34] to recognize driver drowsiness using behavioral and physiological signals. Also, in reference [35–39], the authors use multimodal features using behavioral and physiological features to detect hypovigilance. To improve the Hypo-V system’s accuracy, those multimodal features are merged and optimized into a single feature vector.
Several other multimodal approaches have been investigated in the past. In reference [40], the author’s multimodal features identify the hypo-V driving condition. They use the video data and multisensor signals as two modalities. A methodology is suggested in reference [41] to establish a system based on people’s eye patterns, which is observed by a video stream. The authors of reference [42] created the Face2Multi-modal dataset to define multimodal features by heart rate, skin conductance, and vehicle speed. A DenseNet deep learning model is used in reference [43] to extract the multimodal features. Whereas in reference [44], a deep unsupervised multi-modal fusion network is developed to detect driver distraction. The author of reference [45] uses a unique multimodal architecture to estimate in-vehicle alertness using EEG and EOG signals. They suggest an architecture consisting of a capsule attention mechanism after a deep LSTM network to allow the system to focus on the most important elements of the acquired multimodal representations. In another reference [46], the authors proposed a system for detecting driver stress utilizing multimodal fusion and attention-based deep learning algorithms. The attention-based LSTM and CNN models are integrated together to classify driver fatigue using eye, vehicle, and environmental data. The suggested technique beats state-of-the-art models on driver stress detection, with an average accuracy of 95.5%. Whereas in reference [47], the authors develop a multimodal CNN by using hand/foot galvanic skin response, and heart rate (HR) short-term input signals. The suggested technique achieved 92.33% of classification accuracy. Also, in reference [48], the authors used certain visual and physiological feature to detect driver distraction.
We are attempting to solve two distinct issues in this study. First, the driver distraction, and second the level of distraction. In this paper, we evaluate multimodality by using late fusion approach. The pre-processing and feature extraction processes for each of the modeling approaches are discussed in the following paragraphs. To develop this Hypo-Driver system, the behavioral and psychological features are extracted from each driver to detect multistage of Hypo-V. For behavioral features, three cameras are deployed on different angles (0°, 45°, and 90°) of the drivers to get Multiview features. To develop this hypo-Driver system, the physiological signals (EEG, ECG, sEMG, and EOG) and behavioral information (PERCLOS70-80-90%, mouth aspect ratio (MAR), eye aspect ratio (EAR), blinking frequency (BF), head-titled ratio (HT-R)) are collected and pre-processed, then followed by feature selection/reduction and fusion techniques. The driver behaviors are classified into five stages, namely, normal, fatigue, visual inattention, cognitive inattention, and drowsy. The Hypo-V consists of four major modules called vision module, sensors module, fusion module, and prediction module, which are explained in the upcoming subsections. A systematic flow diagram is displayed in Fig. 1.
In this paper, we use statistical features extracted from four sensors such as physiological signals (EEG, ECG, sEMG, and EOG). In total, we use 80 features that are extracted from these physiological sensors, including 20 features from EEG, 10 features from ECG, 20 features from sEMG, and 30 features from EOG signals. These features are concatenated into a single feature vector. Compared to other sensors, the EEG signals are having special properties to define different levels of hypovigilance. For example, the TGAM sensors kit is directly connected to brain signals, and it is easy to evaluate the distraction level of each driver. Information regarding brain activity is included in brain signals. The alpha, delta, and theta signals are the most employed to evaluate the level of tiredness and distractions. When the driver’s level of awareness drops, the three signals alter to various degrees. The delta and theta signals increase rapidly, and the alpha signal increases somewhat but not as much as the first two signals. In addition, we have collected attention levels in the range of (60 to 75), mediation levels in the range of (50 to 60), and blink strength in the range of (40 to 55).
Physiological signals (EEG, ECG, sEMG, and EOG) captured from diverse sensors contain noise and some signals are not important for the classification task of five stages of Hypo-V states. As a result, it is required to reduce noise signals and use only distinct information signals. For solving these problems, the shearlet wavelet transform (SWT) [49] is utilized. To apply SWT transform, the 1-D signals are converted into 2-D representation and then extract directional information of different scales and deliver highly sparse approximations. In practice, the SWT technique divides the 2-D signals into low-pass and high-pass sub-band 2-D in different levels. To perform this transformation, the 4 or 8 2-D signals are acquired with different shearing filter size selections. Therefore, it is easy to extract statistical features from this 2D SWT transformation. The paragraphs below describe the way to apply SWT transformation on ECG, EEG, EOG, and sEMG signals. On 0.6–45 Hz, the high-pass filter is applied to the SWT transform of ECG signals. This process is used to reduce noise from ECG signals. The high-pass filter is applied to reduce noise from sEMG signals with a cutoff frequency at 25 to 35 Hz. Moreover, the EOG signals also contain noises. Therefore, the low-pass bandpass filter is utilized with cutoff levels at 0.2 to 28 Hz. In the case of EEG signals, the low-pass filter is applied at a cutoff frequency of 0.4 to 50 Hz. The filtered signal is separated into theta (4–8 Hz), alpha (8–13 Hz), beta (13–30 Hz), and gamma (30–49 Hz) sub-bands.
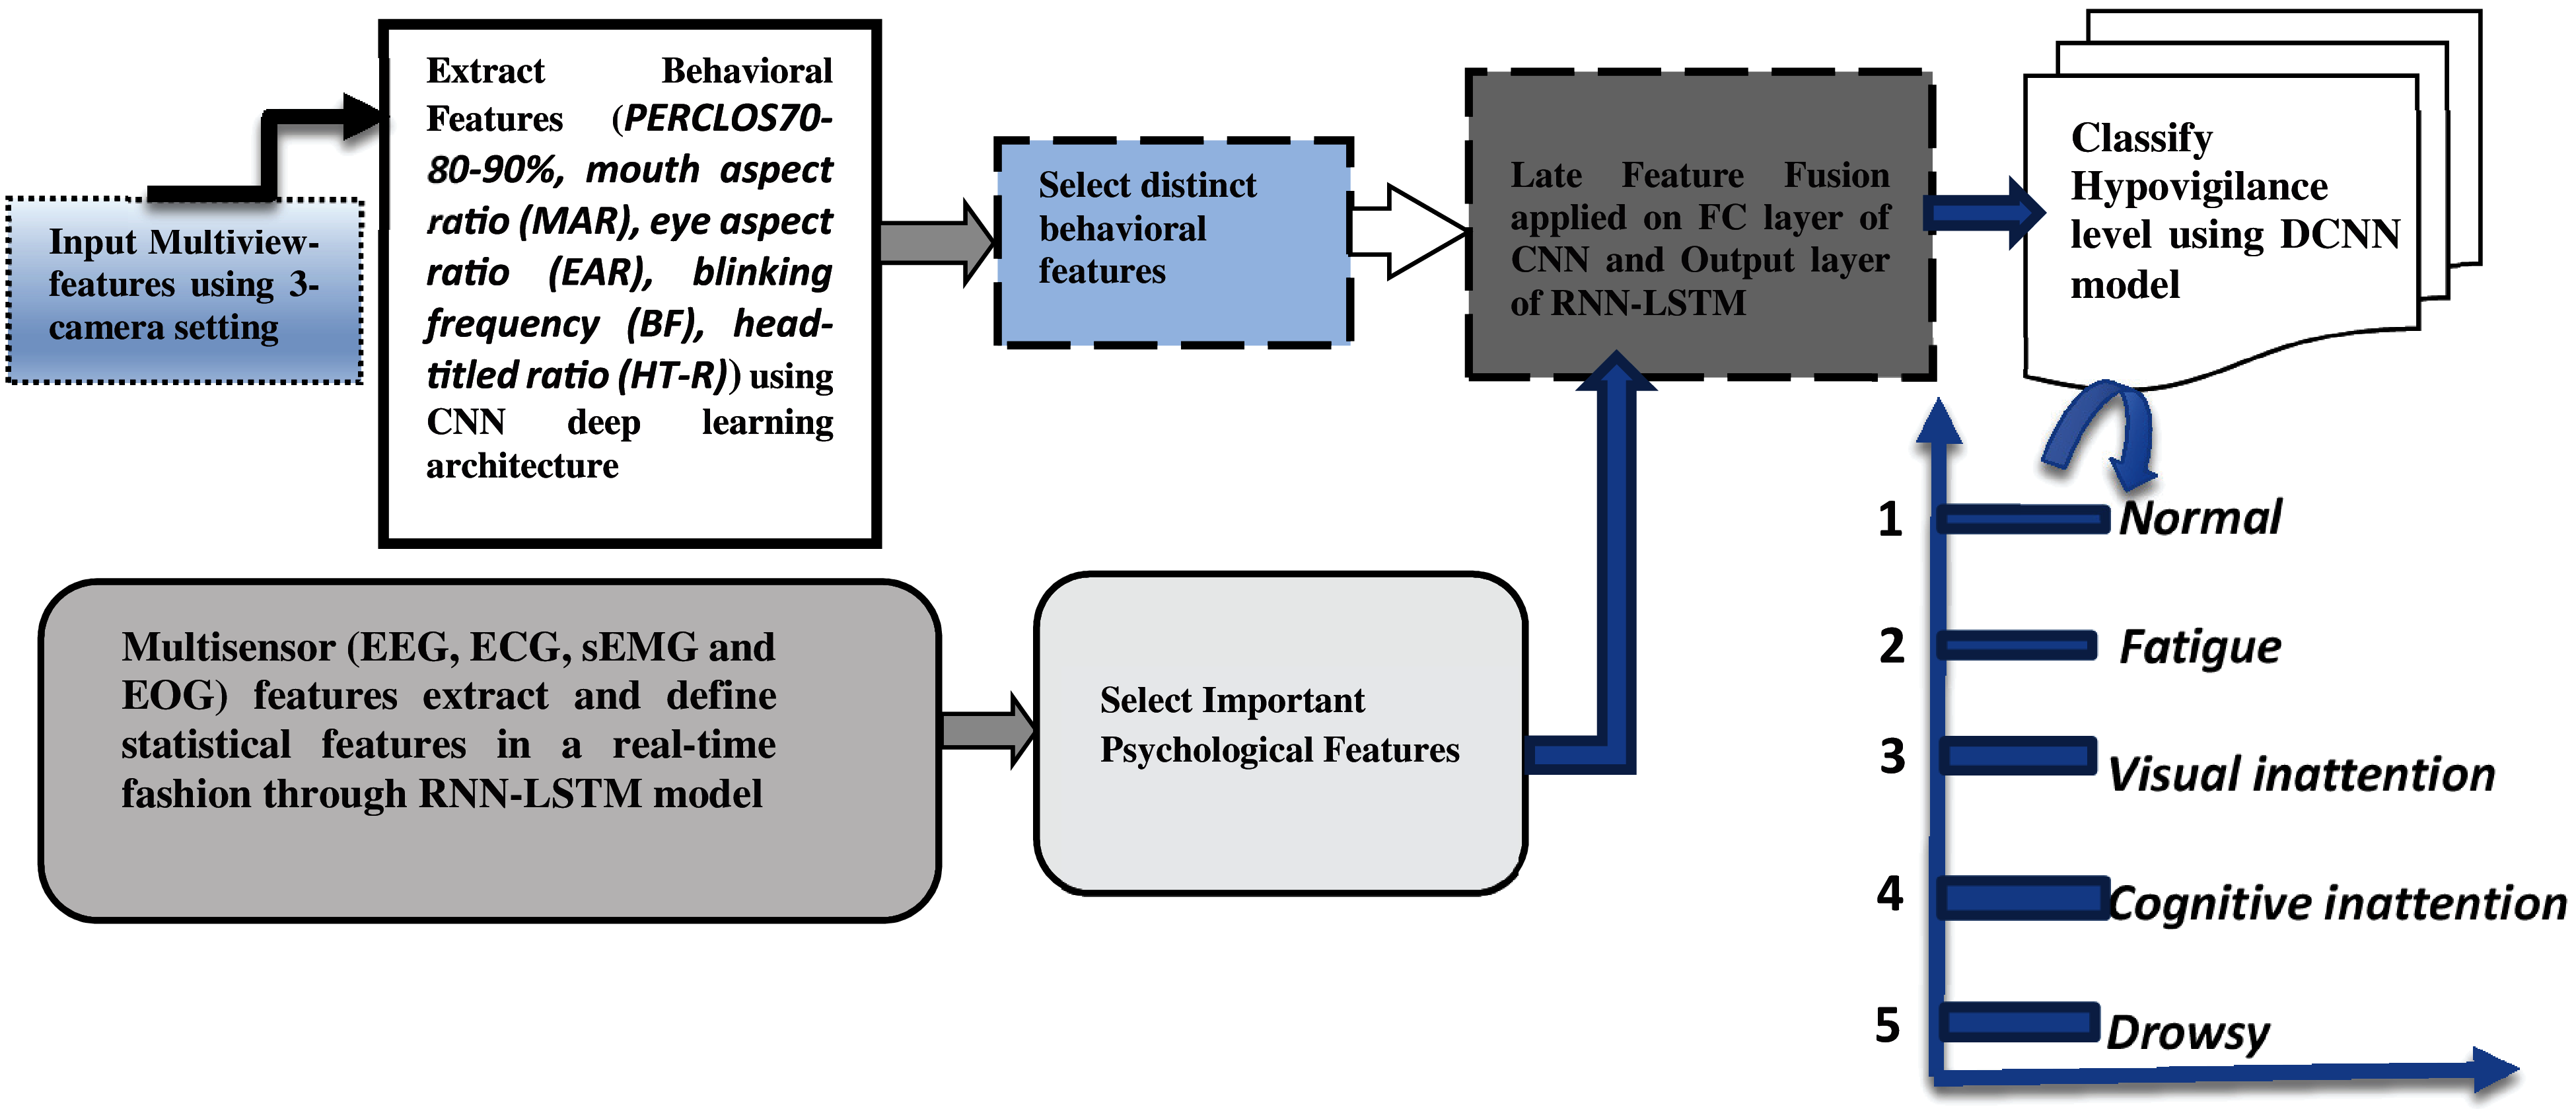
Figure 1: A systematic flow diagram of the proposed Driver-Hypo vigilance detection using psychological and behavioural features
3.2 Behavioral Features Extraction and Selection Module
The behavioral information (PERCLOS70-80-90%, mouth aspect ratio (MAR), eye aspect ratio (EAR), blinking frequency (BF), head-titled ratio (HT-R)) are collected from three cameras, which are deployed on different angles (0°, 45°, and 90°) of the drivers to get Multiview features. These cameras are used in both real-time vehicles and simulators to get the performance of the proposed Hypo-Driver system. Since the driver’s face is moving in different directions during driving, so we deployed a multiview camera [50], instead of a single-view camera, to implement the five-stage hypovigilance detection system. A visual example of 3-D cameras is shown in Fig. 2. To recognize facial features, it is important to get visual features based on an unconstrained environment. This viewpoint is not addressed in the past techniques to develop driver fatigue and distraction detection system.
3-D cameras are used to detect facial features such as MAR, EAR, BF, and HT-R through computer vision applications. These visual features include the percentage of closed eye time, closed eye time, blink frequency, yawn frequency, and nodding frequency from the most viewed 3-D face image. Several researchers are using PERCLOS measures to indicate the level of driver drowsiness. The mouth state, eyes, and yawing conditions are widely used criteria for extracting facial features. Based on each viewpoint camera, we compute 25 features from every frame in the video recording dataset at 30 fps. To extract visual features, we utilize 6 windows of size (25 × 25) on each to extract statistical features with 50% of overlap. To define statistical features one each window, we extract minimum and maximum values, average, variance, skewness, and kurtosis. At the end of this process, each window is summarized to a 25 × 6 = 150 feature vector. In addition, the convolutional neural network (CNN) classifier [51] is utilized to extract distinguish features.
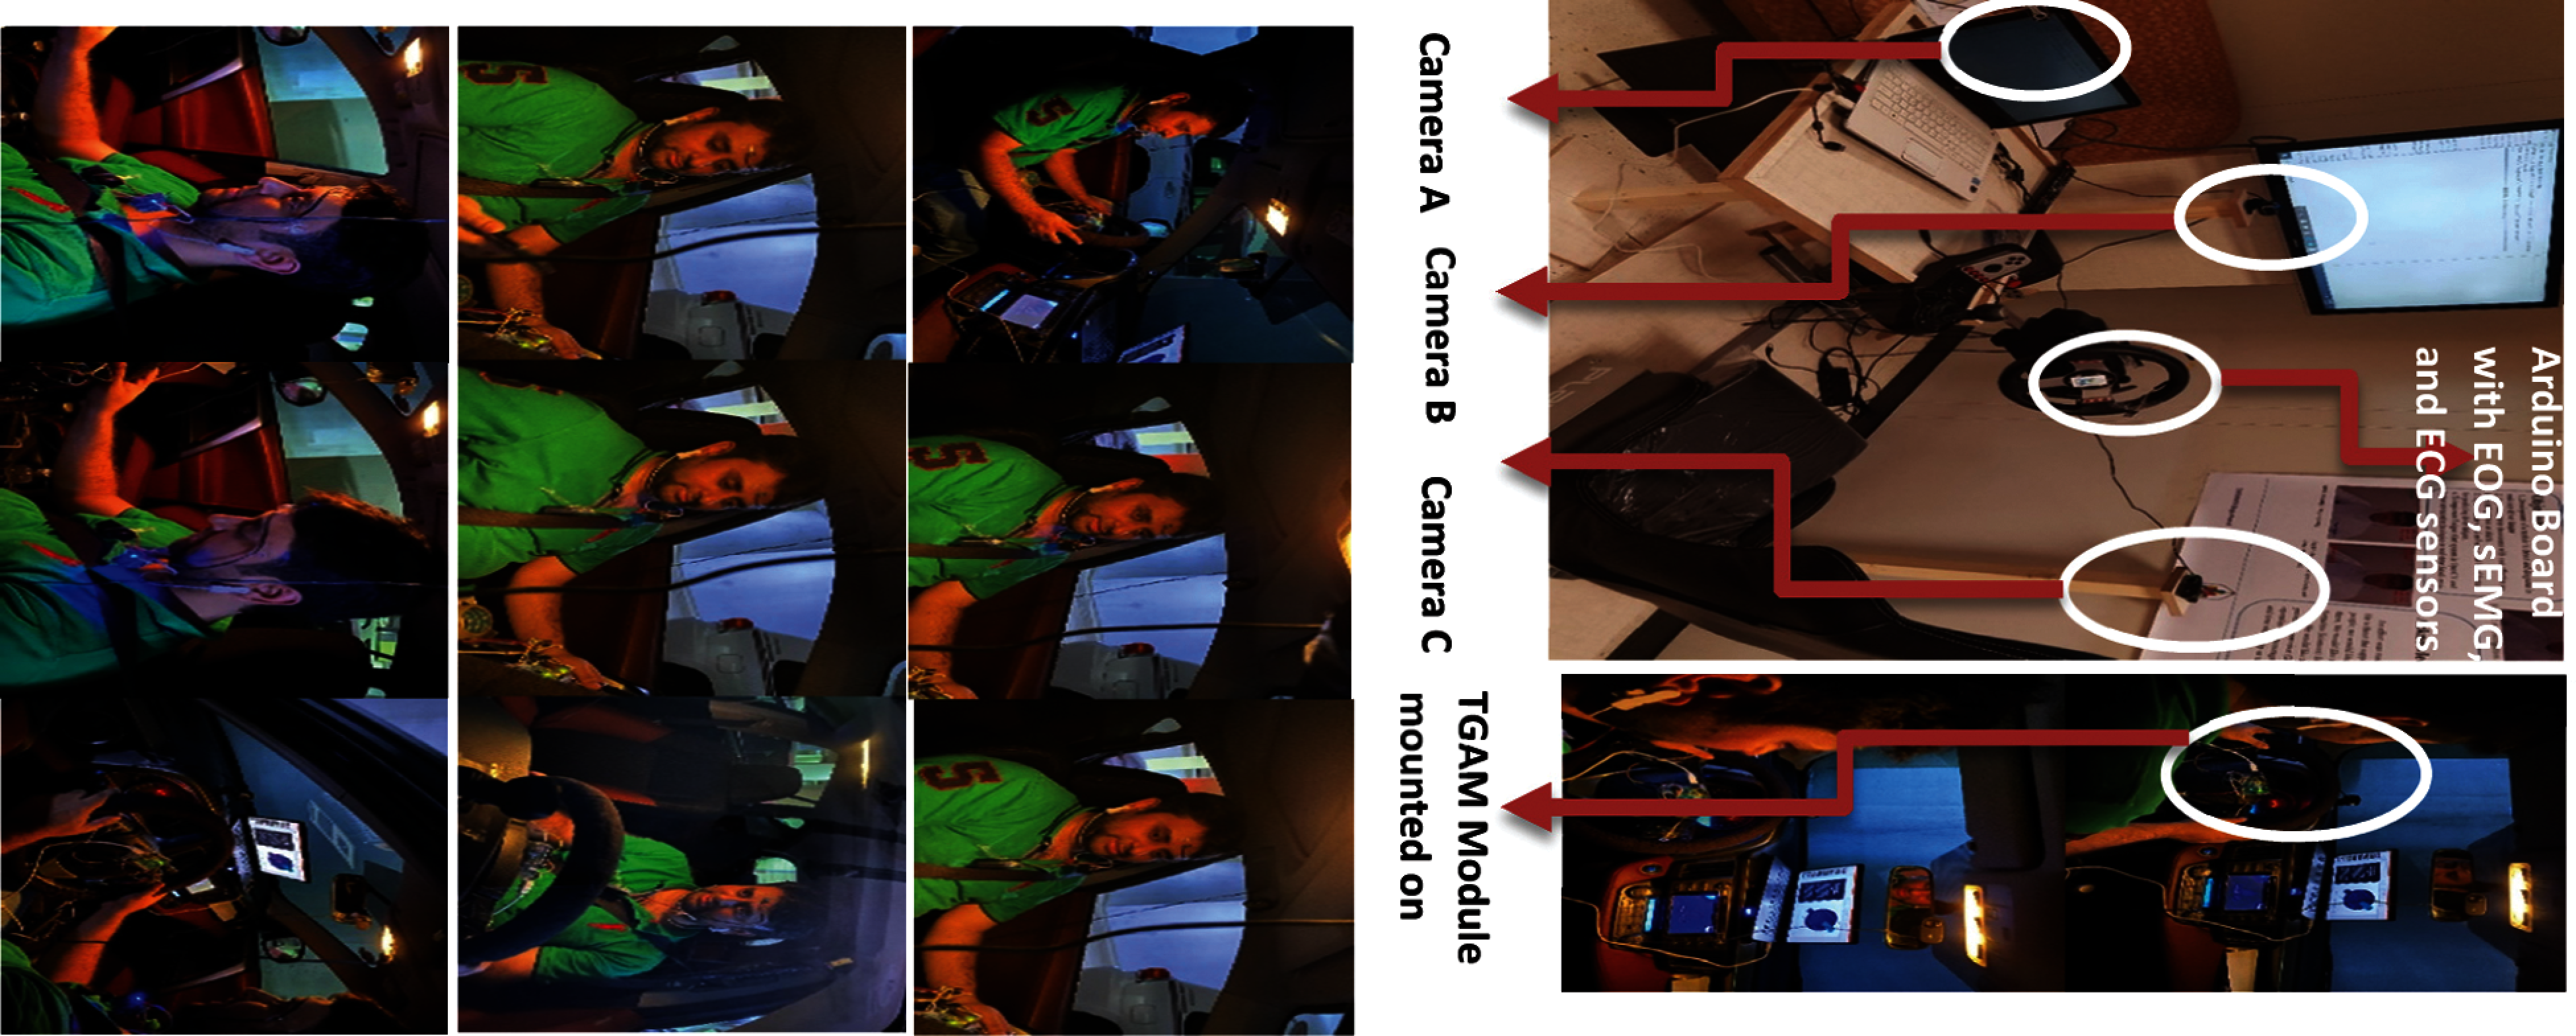
Figure 2: A simulator and real-time multimodal features learning for testing and evaluation
The CNN network is a type of DNN used mainly for analyzing visual imagery. The model consists of two essential portions: feature extractor and classifier. Every layer collects the output from the preceding layer as input and sends its output to the next layer’s input in the feature extractor module. Each layer extracts different features from the image by applying the convolution operation on input. As the network got deeper and deeper, it extracts more higher-level features from the image. The classifier part of the network consists of a fully connected layer that calculates each class’s score from extracted features and classifies the images according to its calculated score. In addition, CNN’s typically have fully connected layers at the end, which computes the final outputs. To extract behavioral features, we utilize CNN architecture based on the convolutional layer, pool layer, rectified linear unit (ReLU) layer, and fully connected layers. The features are computed from every 6 windows on each frame. Similarly, the convolutional layer is used to extract statistical visual features as mentioned-above such as we have extracted minimum and maximum values, average, variance, skewness, and kurtosis.
where
3.3 Physiological Features Extraction and Selection Module
Physiological signals (EEG, ECG, sEMG, and EOG) are captured from diverse sensors and contain noise. Also, some signals are not important for classification task of five-stages of Hypo-V states. As a result, it is desirable to reduce noise signals, and use only distinct information signals. For solving these problems, the shearlet wavelet transform (SWT) is used. The pre-processing step is already explained in the Section 3.2. The features selection step for physiological features is performed using recurrent neural network and long short-term memory (RNN-LSTM) model [52]. A visual representation of these steps is presented in Fig. 3. The brief explanation of RNN-LSTM model is explained in the subsequent paragraphs.
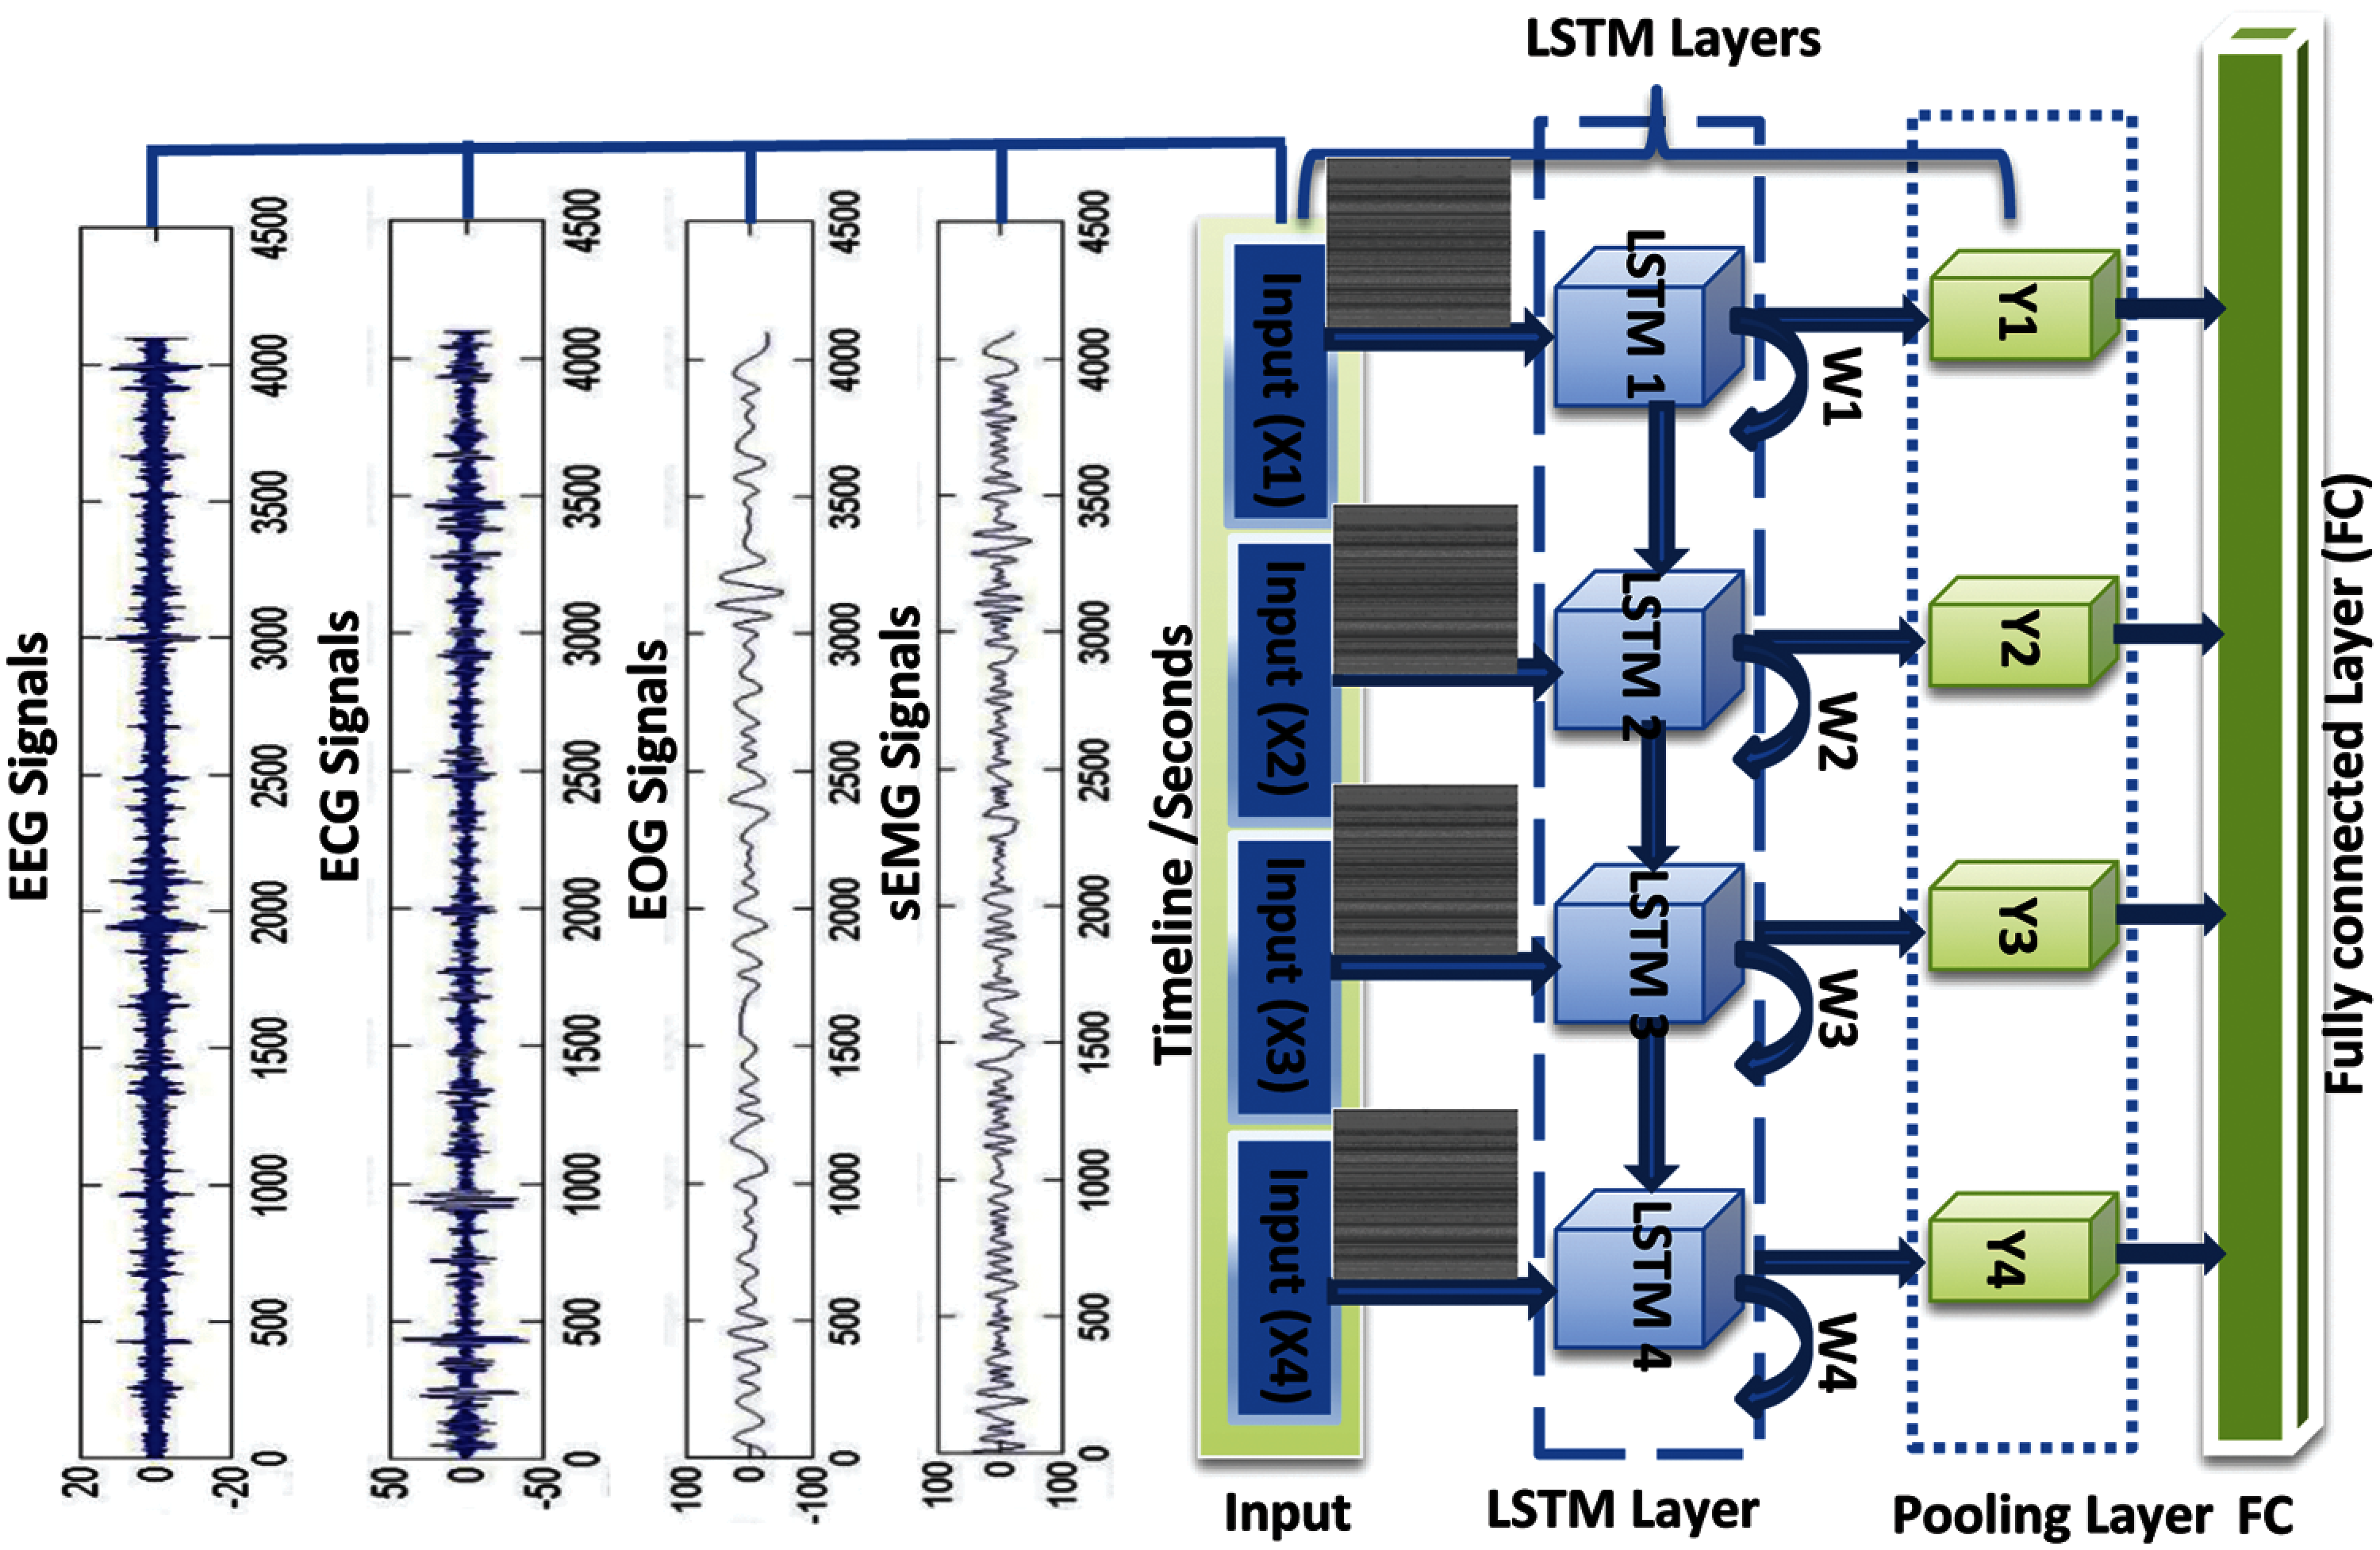
Figure 3: Sensors features extraction using recurrent neural network and long short-term memory (RNN-LSTM) model and output fully connected layer (FC)
The RNN-LSTM model has been used in many studies to extract physiological signals. Therefore, we have used this deep learning model to train the network and extract effective features. In practice, the RNN-LSTM is the type of network that utilizes time-series data or serial data to solve temporal problems. They are of many types, like one-to-one, one-to-many, many-to-one, and many-to-many. The variant of RNN architectures include birecurrent neural networks (BRNN) drawn from preceding inputs to make forecasts about the present state. They pull in future data to progress the correctness of it. The Long short-term memory (LSTM) works to cover the problem of long-term needs. If the initial state that is persuading the existing prediction is not in the recent past, and the model cannot predict the present state. The recurrent neural network (RNN) is a deep learning method that is used to create long short-term memory (LSTM). RNNs are made up of recurrent structures that feed the firing strength locally, eliminating the need for external registers or memory to store past outputs. Due to the usage of recurrent structures in RNN, LSTM has a low computational complexity. The LSTM is integrated in this paper with pooling and fully-connected layers to use physiological features.
As shown in Fig. 4, the weights are calculated from training the RNN-LSTM model on the Hypo-DB dataset. After passing through the LSTM layer in the used recurrent neural network, a pooling and fully-connected layers are created to avoid overfitting of the network. Its main concept is to drop units from the neural network at random during training to avoid units from over adapting. Afterwards, for further categorization, a completely linked layer is utilized. The parameter setting values used in the RNN-LSTM architecture consists of (Optimizer: Adam, Learning Rate: 0.001, dropout rate: 0.2, Loss Function: Categorical cross entropy, Batch size: 10, Epochs: 100) to train the physiological features.

Figure 4: A visual representation of deep residual neural network (DRNN) architecture for classification of multistage of hypovigilance detection system (Hypo-Driver)
The multimodal features fusion approach is utilized in this paper for the development of multistage driver fatigue and distraction level. There are two types of fusion approaches used in the past, called late and early fusion. Compared to early fusion, the late fusion approach provides the best classification performance. There are two fully connected layers (FC) that contain statistical behavioral and physiological features. These two different modalities FC layers are directly considered every three seconds over five seconds. From physiological and behavioral modalities, we use two features vector. In this paper, we categorize each modality separately in the late fusion method, then combine the probability of the two models to provide the final prediction through dense architecture described in Section 3.6.
To perform late fusion, we aggregate the predicted class probabilities supplied by each modality model and then average the class probabilities produced by the visual classifier for every three consecutive samples. The label with the highest final value is allocated. After that, the representation is standardized with a conventional normalization and fed into the classification algorithm. In this study, we investigate late fusion approach collected from two modalities, in the hope of improving the detection approach of driver hypovigilance state using fused data. Multimodal fusion in the late stages is investigated by the following techniques by combining the SoftMax scores provided by each FC layer that is the product and weighted sum. Since the fusion is done on the categorization scores, these techniques are referred to as late fusion. We calculate the SoftMax scores (
The parameter
3.5 Classification of Features
In this paper, deep residual neural network (DRNN) models are utilized. In practice, the DRNN model is very easy to optimize compared to other deep-learning architectures. To achieve high accuracy, it is very effective to get optimized results sometimes needed for real-time processing. Compared to convolutional neural network (CNN), the DRNN models are better in case of optimization. In [52], the authors develop an improved CNN model known as deep residual network (DRN) for image classification tasks. In that model, the number of network layers is always required. In the past systems, if someone developed a classification system based on DRNN architecture then the training become more difficult.
Many authors claim that the DRNN model is different in terms of network architectures compared to convolutional neural network (CNN) model when used in case of features selection and classification tasks. In case of a typical CNN model, it consists of different layers such as convolutional, features map, pooling, and output layers. However, in case of DRNN model, the input layer is directly connected with the output layer to get direct classification results. As a result, it has a shortcut pathway directly connecting the input and the output in a building block. Accordingly, the DRNN model has been selected in this paper to extract and classify visual and non-visual features without using complex image processing techniques. A visual example of DRNN architecture is shown in Fig. 4. The DRNN architecture consists of different layers such as convolutional, batch normalization, rectified linear units (ReLU), pooling, dropout, and fully connected output layers. In DRNN model, information passes through unchanged from the previous layers. The simplest architecture of DRNN model is contained minimum two-layers. Let us define all these set of layers of DRNN model if they learned a specific function, h(x) then it can be represented as:
This can be recovered from the original input through learning and represented as:
In practice, this DRNN network has the capability, compared to other deep-learning models, to learn residual sub-network to define discriminative features for recognition tasks. In most of the studies, the authors have utilized 8 × 8, 16 × 16, 32 × 32 or 64 × 64 convolutional filters of variable sizes such as (7 × 7, 8 × 8, and 9 × 9) to convolve input image and then generate different features maps for the following layers. Subsequently the convolutional layer, there are a ReLU activation layer, a maximum pooling layer, a batch normalization layer, a dropout layer, and fully connected output layer. As a result, all layers in the network have the capability to capture spatial relationship among pixels while having noise pixels. The main purpose of all these layers is to extract statistical properties among different objects in an image. Therefore, this DRNN model is used in this paper to classify five stages of hypo-vigilance state of drivers. These layers are briefly explained in the subsequent paragraphs. To construct DRNN model, the first and important step is to create a main branch of the network by constructing a convolutional layer. A main branch of the network is constructed through different sections. In this paper, three different sizes of convolutional filters are used (32 × 32, 16 × 16, and 8 × 8). The pre-trained features map is calculated by:
where, the
After ReLU-layer, many authors utilize a pooling down-sampling layer (PO-layer) to find out more prominent features compare to other pixels. Many authors use max-pooling function with a filter and stride of usually size of 2 × 2 pixels. However, there are also many different techniques such as average pooling and L2-norm pooling can also be utilized to construct this PO-layer. The instinctive thinking behind this layer is that once a particular feature in the input data window is realized (the filter convolution yields high value), the relative location to other features is the most important. Overfitting alludes to when a deep learning model is heavily tuned to the training sets that it can’t sum up well for the validation and test sets. The issue of overfitting is resolved using dropout (DRP-layer) layer. The ReLU is used to achieve nonlinear transformations by forcing the negative features to be zero. It is expressed by:
where f(i, j) and R(i, j) are the input and output feature maps of the ReLU, respectively. The derivative of the ReLU is expressed by Eq. (10) and the derivative is either 1 or 0 was used in this paper to avoid gradient vanishing problems.
To make it easy in the training process, these components of DRNN model provide comfort compared to conventional convolutional neural network (CNN) architecture. The problem is that the gradient of error regarding weights and biases requires to be back-propagated layer by layer. Each layer is depended on the previous layer. Moreover, this is related to optimization problem due to selection of many features. However, in case of DRNN model, some layers can go deeper so that the gradients can be back-propagated very easily. Moreover, the batch normalization is also added to the model for increasing the process of training and lessen the burden on the initial weight’s values. In this model, the training phase provides the initial weights. However, to increase the learning process, this normalization layer is added to the network to force the negative values to zero. The final fully connected output layer, is expressed by:
where
where
The Hypo-Driver system has been implemented and tested on Intel ® Core i7-8600U processor, 16 GB RAM, and NVidia 2 GB of graphical-processing unit (GPU). An open-source environment (Python 3.6) has been used to develop deep learning (DL) models. In this paper, we integrate the DL models such as CNN, RNN-LSTM, and residual neural network (DRNN). The multimodal features are extracted by using behavioral and physiological features through 3-D cameras and various sensors mounted on Arduino board. All cameras and sensors wires are directly connected to Arduino board and then the Arduino serial port is connected to the system. To get EEG signals, we use NeuroSky ThinkGear ASIC module (TGAM) that is connected through Bluetooth. To analyze heart rate variability (HRV), the python serial (PySerial) library is imported to Python for communicating with the Arduino board. All deep learning (DL) models have built-in TensorFlow and Keres platforms. Those models are imported to the Jupiter environment to make good documentation of the code. Moreover, the training process is performed by using Hypo-DB as mentioned in sub-section 3.1. To perform comparisons with the other state-of-the-art hypovigilance detection systems, four studies are selected such as Du-RNN [18], Li-CNN [20], Chen-SBL [29], and Choi-LSTM [34]. To evaluate these multimodal based systems using machine-learning or deep learning algorithms, we have used the same techniques as implemented in the corresponding research papers. These four systems are selected because they are most relevant to define multistage driver drowsiness, and easily implemented.
The parameter setup used for comparisons with other methods is explained in the subsequent paragraphs. In Du-RNN [18], the driver’s pulse rate using a wrist tracker, extracted facial expressions with an RGB camera are utilized to detect multimodal features. A single RGB-D camera is utilized to fix these challenges and only detect three fatigue characteristics (pulse rate, degree of eye-opening, and level of mouth-opening). In addition, a Fuzzy logic with RNN-LSTM is integrated to extract the temporal information of the heart rate. Whereas in reference to Li-CNN [20], the CNN model with fusion strategy is used to detect. In reference Chen-SBL [29], we use time, spectral and wavelet-based techniques to define multimodal features through ECG signals, galvanic skin response, and respiration signals. We use sparse Bayesian learning (SBL) to detect fatigue-level and the PCA technique is also used to get optimal features. The LSTM model is utilized in Choi-LSTM [34] to make comparisons with the proposed Hypo-Driver system using behavioral and physiological signals.
Comparison is performed based on twenty drivers’ preprocessed physiological and behavioral features as mentioned in Section 3.2. This driver’s dataset is divided into 30% of the testing set and the rest as the training set. Also, we have split again the training set into 30% and assigned it to the validation set, and the rest is used for training purposes. On a total of 20 driver’s datasets, 55% is working as the training set, 15% as the validation set, and 30% as the test set. There are 100 epochs performed based on the 10-fold cross-validation set. Fig. 5 shows the proposed model training and testing loss vs. accuracy diagram. From this figure, it is noticed that this plot is displayed without performing any fine-tune of the proposed model. In addition, this figure shows that the change between the predicted stage of hypovigilance by our model and the true value in the form of the loss function, which is measured by cross-entropy.

Figure 5: The proposed model loss vs. accuracy based on 10-fold cross validation set
In other papers, the authors including Hypo-Driver use a CNN model. A convolutional neural network (CNN) model is having a multilayer architecture that consists of convolution, nonlinear, pooling, and finally SoftMax-connected layers. This CNN model with multilayer architecture is used to detect driver drowsiness and distraction levels. The CNN model has been used in many drivers’ fatigue detection to detect and predict features extracted from drivers. Those features are broadly classified in terms of visual and non-visual features. For comparisons, we have set up the following parameters to design the CNN model. For example, the input layer has features extracted from the PERCLOS measure. These features are defined from the driver image of size (256 × 256) pixels. This input layer also contains data, which is taken from EEG sensors. We have converted the original signal from sensors into feature space by convolution neural network (CNN). The sensors’ values are transformed into a 3 × 128 features matrix. Afterward, the convolutional layer is added and developed through window size per image and size of each neuron is used to determine the area. We used three convolution kernels (C1, C2, C3) filters by defining the filter sizes as 5 × 5, 5 × 5, and 3 × 3, respectively. Also, we use another pooling layer to map features by using average and maximum features values. To avoid features overfitting, we reduce the dimensionality of the convolution layer by doing experiments. The sizes of pooling layers are set to 2 × 2, 2 × 2, and 3 × 3 layers in this CNN model. The parameter setting values used in the RNN-LSTM and DRNN architectures consists of (Optimizer:Adam, Learning Rate: 0.001, dropout rate 0.2, Loss Function: Categorical cross entropy, Batch size: 10, Epochs: 100).
Compared to deep-learning algorithms, the machine-learning algorithms have also been developed in the past to detect multimodal-based hypo-vigilance detection such as in Chen-SBL [29]. Those machine-learning approaches use various state-of-the-art learning approaches to characterize the driver’s behaviors to make a clear difference between health and fatigue parameters in different conditions. To investigate the experimental data on driver activity during driving several open-source machine learning networks are analyzed, tested, and then applied such as artificial neural network (ANN) and deep learning analysis. Those studies train the deep learning network on the set of the physical exercise data and predict the type of activity during normal and fatigue driving conditions. The training results are obtained by application of various machine learning methods by CNN deep learning neural networks [15,24] for the data obtained by multimodal channels (acceleration and heart activity).

Figure 6: Classification results of Driver-Hypo are represented in figures (a, b). Figure (a) shows the results obtained from 20 drivers in various time slots, and (b) presents comparison to other state-of-the-art systems in terms of accuracy
Despite the tendency to learn from the training data, the loss is very high for most combinations of parameters, and the abrupt decrease of the loss for two of these combinations is just an illustration of over-training, but not the mark of the very reliable model. The more reliable results by CNN can be obtained for a bigger number of parameters. Fig. 6 demonstrates the detection accuracy of involved 20 drivers including males and females. In this figure, we have also displayed the statistical comparisons among different state-of-the-art hypovigilance detection system by using 5-stage level. Compared to other approaches, the proposed Hypo-Driver system outperforms and achieves 96.5% of detection accuracy to determine multistage driver fatigue and distraction level. Driver fatigue detection through ANN or sparse Bayesian learning (SBL) are used by some authors [12,18,30] compared to the convolutional neural network (CNN) Li-CNN [20] model. To compare sparse Bayesian learning (SBL) and CNN models, the feature extraction step is used same as discussed in the previous section. To fine-tune the ANN model, trial and error techniques are used. A multi-layer of the ANN model is utilized by using two hidden layers, one input layer, and one output layer. For comparisons, the input neurons are defined as visual and non-visual features in the input layer. The ANN model is trained by MLP architecture of networks. A gradient descent algorithm is applied to ANN for network output and the backpropagation (BP) method is performed to typical adjust the weights and biases for the hidden layer. This adjustment by using the BP method provides minimum mean square error for the network. Since, the use of ANN or SBL algorithms are suffered from huge training, and it is very much difficult to control overfitting problem. Therefore, it is better to use CNN model instead of other standard machine learning algorithms. Figs. 6 and 7 display the detect accuracy obtained using five stages of hypovigilance and distraction level such as normal, fatigue, visual inattention, cognitive inattention, and drowsy when used 120 min to record videos and multisensor signals data. As a result, the proposed Hypo-Driver system is outperformed compared to state-of-the-art systems based on multiview 3-D cameras and multi-sensors modules in a CNN-RNN and DRNN architectures. Compared to the state-of-the-art Hypo-V system, on average, the Hypo-Driver system achieved a detection accuracy (AC) of 96.5%. The obtained results indicate that the Hypo-Driver system based on multimodal and multiview features outperforms other state-of-the-art driver Hypo-V systems by handling many anomalies.

Figure 7: Classification results of proposed Hypo-Driver are represented in figure (a). They show the detection accuracy of five-stages of Hypovigilance in terms of 120 min recording
Several different sensors have been utilized in the past for predicting of level of drowsiness and distractions. However, those systems are more focused on extracting physiological, and behavioral features. In addition to these features, the authors are also using environmental and vehicular parameters to detect drivers’ activity. However, it is easy to fuse physiological, and behavioral features than other type of parameters. Accordingly, we have used physiological, and behavioral features to develop driver drowsiness and distraction level. Compared to other systems, due to several variables such as nighttime driving, head not being centered-aligned, and occlusion of faces, especially in female drivers, extracting visual-features for defining PERCLOS measure is challenging. Due to these reasons, it is difficult to define behavioural features. To address these issues, we use multiview cameras and integrate different sensors to define behavioural features by using CNN, RNN-LSTM and DRNN deep learning models in a real-time and simulator environment. The classification of five-stages is carried out through DRNN model in this paper. In DRNN model, we have added pre-trained layers and dropout-layer. The obtained results indicate that the Hypo-Driver system outperforms other state-of-the-art systems. Fig. 7 shows the obtained results of driver behaviors that are classified into five stages, namely, normal, fatigue, visual inattention, cognitive inattention, and drowsy when used 120 min to record videos and signals data. It can be noticed from this figure that the proposed Hypo-Driver system in five stages has significantly better performance. The Hypo-Driver system is outperformed because the system is developed through multiview 3-D cameras and multi-sensors modules in a CNN-RNN and DRNN architectures. Nowadays, some other authors are trying to develop driver fatigue detection systems by using a smartphone camera, sensors, and microprocessors. For low-cost loving countries, the authors have suggested the design of smartphone-based applications that can save much human life instead of using expensive instrument devices. However, to design a smartphone detection system, we must be careful about performance, acquisition rate, storage capacity, and privacy to save personal data from the cloud. Those computational parameters will be addressed in the future application of Hypo-Driver system.
In future studies, we intend to integrate different technologies such as cloud computing and GPU-based processing to enhance the computational power of the Hypo-Driver system. Nowadays, IoT-based applications, also called ubiquitous sensing, are taking the center stage over the traditional paradigm. The evolution of IoT necessitates the expansion of the cloud horizon to deal with emerging challenges. In future research, we will review all those cloud-based emerging services, useful in the IoT paradigm, that support effective data analytics for the detection of driver fatigue and distraction level.
Multiview driver fatigue, inattention, and distraction level detection system known as Hypo-Driver using Multimodal Deep Features is developed in this paper. Three cameras are deployed on multiview points of the drivers to get uncontrolled behavioral features. The physiological signals (EEG, ECG, sEMG, and EOG) and behavioral information (PERCLOS70-80-90%, mouth aspect ratio (MAR), eye aspect ratio (EAR), blinking frequency (BF), head-titled ratio (HT-R)) are collected and pre-processed to develop the Hypo-Driver system. This improved Hypo-Driver system utilizes trained behavioral features by a convolutional neural network (CNNs) and the RNN-LSTM model is used to extract physiological features. After fusion of these features, the Hypo-Driver system is classified Hypo-V into five stages based on trained layers and dropout-layer in the deep-residual neural network (DRNN) model. To test the performance of a Hypo-Driver system, data from 20 drivers are collected. The results of Hypo-Driver are presented and compared with state-of-the-art methods. Compared to the state-of-the-art Hypo-V system, on average, the Hypo-Driver system achieves an ACC of 96.5%. The obtained results indicate that the Hypo-Driver system outperforms other state-of-the-art driver Hypo-V systems on multimodal features.
Acknowledgement: The authors extend their appreciation to the Deanship of Scientific Research at Imam Mohammad Ibn Saud Islamic University for funding this work through Research Group no. RG-21-07-01.
Funding Statement: The authors extend their appreciation to the Deanship of Scientific Research at Imam Mohammad Ibn Saud Islamic University for funding this work through Research Group no. RG-21-07-01.
Conflicts of Interest: The authors declare that there is no conflict of interest regarding the present study.
1. S. Uma and R. Eswari, “Accident prevention and safety assistance using IOT and machine learning,” Journal of Reliable Intelligent Environments, pp. 1–25, 2021. [Google Scholar]
2. X. Liu, K. H. Lam, K. Zhu, C. Zheng, X. Li et al., “Overview of spintronic sensors with internet of things for smart living,” IEEE Transactions on Magnetics, vol. 55, no. 11, pp. 1–22, 2019. [Google Scholar]
3. K. M. Kumaran and M. Chinnadurai, “Cloud-based robotic system for crowd control in smart cities using hybrid intelligent generic algorithm,” Journal of Ambient Intelligence and Humanized Computing, vol. 11, no. 12, pp. 6293–6306, 2020. [Google Scholar]
4. I. Lee and K. Lee, “The internet of things (IoTApplications, investments, and challenges for enterprises,” Business Horizons, vol. 58, no. 4, pp. 431–440, 2015. [Google Scholar]
5. S. Sharma and S. Sebastian, “IoT based car accident detection and notification algorithm for general road accidents,” International Journal of Electrical & Computer Engineering, vol. 9, no. 5, pp. 2088–8708, 2019. [Google Scholar]
6. A. Koesdwiady, R. Soua, F. Karray and M. S. Kamel, “Recent trends in driver safety monitoring systems: State of the art and challenges,” IEEE Transactions on Vehicular Technology, vol. 66, no. 6, pp. 4550–4563, 2017. [Google Scholar]
7. S. Kaplan, M. A. Guvensan, A. G. Yavuz and Y. Karalurt, “Driver behavior analysis for safe driving: A survey,” IEEE Transactions on Intelligent Transportation Systems, vol. 16, no. 6, pp. 3017–3032, 2015. [Google Scholar]
8. Y. Lian, G. Zhang, J. Lee and H. Huang, “Review on big data applications in safety research of intelligent transportation systems and connected/automated vehicles,” Accident Analysis & Prevention, vol. 146, no. 105711, pp. 1–13, 2020. [Google Scholar]
9. S. G. Pratt and J. L. Bell, “Analytical observational study of nonfatal motor vehicle collisions and incidents in a light-vehicle sales and service fleet,” Accident Analysis & Prevention, vol. 129, no. 3, pp. 126–135, 2019. [Google Scholar]
10. C. Tran, A. Doshi and M. M. Trivedi, “Modeling and prediction of driver behavior by foot gesture analysis,” Computer Vision and Image Understanding, vol. 116, no. 3, pp. 435–445, 2012. [Google Scholar]
11. E. I. Vlahogianni and E. N. Barmpounakis, “Driving analytics using smartphones: Algorithms, comparisons and challenges,” Transportation Research Part C: Emerging Technologies, vol. 79, no. May, pp. 196–206, 2017. [Google Scholar]
12. Q. Abbas and A. Alsheddy, “Driver fatigue detection systems using multi-sensors, smartphone, and cloud-based computing platforms: A comparative analysis,” Sensors, vol. 21, no. 56, pp. 1–36, 2021. [Google Scholar]
13. Q. Abbas and A. Alsheddy, “A Methodological review on prediction of multi-stage hypovigilance detection systems using multimodal features,” IEEE Access, vol. 9, pp. 47530–47564, 2021. [Google Scholar]
14. Z. Ahmad and N. Khan, “Human action recognition using deep multilevel multimodal (M2) fusion of depth and inertial sensors,” IEEE Sensors Journal, vol. 20, no. 3, pp. 1445–1455, 2019. [Google Scholar]
15. N. S. Karuppusamy and B. Y. Kang, “Multimodal system to detect driver fatigue using EEG, gyroscope, and image processing,” IEEE Access, vol. 8, pp. 129645–129667, 2020. [Google Scholar]
16. M. Abouelenien, M. Burzo and R. Mihalcea, “Cascaded multimodal analysis of alertness related features for drivers safety applications,” in Proc. of the 8th ACM Int. Conf. on Pervasive Technologies Related to Assistive Environments, Corfu, Greece, pp. 1–8, 2015. [Google Scholar]
17. J. L. Yin, B. H. Chen, K. H. R. Lai and Y. Li, “Automatic dangerous driving intensity analysis for advanced driver assistance systems from multimodal driving signals,” IEEE Sensors Journal, vol. 18, no. 12, pp. 4785–4794, 2017. [Google Scholar]
18. G. Du, T. Li, C. Li, P. X. Liu and D. Li, “Vision-based fatigue driving recognition method integrating heart rate and facial features,” IEEE Transactions on Intelligent Transportation Systems, vol. 22, no. 5, pp. 3089–3100, 2020. [Google Scholar]
19. F. Zhou, A. Alsaid, M. Blommer, R. Curry, R. Swaminathan et al., “Driver fatigue transition prediction in highly automated driving using physiological features,” Expert Systems with Applications, vol. 147, no. 113204, pp. 1–9, 2020. [Google Scholar]
20. K. Li, Y. Gong and Z. Ren, “A fatigue driving detection algorithm based on facial multi-feature fusion,” IEEE Access, vol. 8, pp. 101244–101259, 2020. [Google Scholar]
21. M. Ramzan, H. U. Khan, S. M. Awan, A. Ismail, M. Ilyas et al., “A survey on state-of-the-art drowsiness detection techniques,” IEEE Access, vol. 7, pp. 61904–61919, 2019. [Google Scholar]
22. M. Q. Khan and S. Lee, “A comprehensive survey of driving monitoring and assistance systems,” Sensors, vol. 19, no. 11, pp. 1–32, 2019. [Google Scholar]
23. V. Parekh, D. Shah and M. Shah, “Fatigue detection using artificial intelligence framework,” Augmented Human Research, vol. 5, no. 1, pp. 1–17, 2020. [Google Scholar]
24. F. Omerustaoglu, C. O. Sakar and G. Kar, “Distracted driver detection by combining in-vehicle and image data using deep learning,” Applied Soft Computing, vol. 96, no. 106657, pp. 1–16, 2020. [Google Scholar]
25. C. Streiffer, R. Raghavendra, T. Benson and M. Srivatsa, “Darnet: A deep learning solution for distracted driving detection,” in Proc. of the 18th ACM/IFIP/USENIX Middleware Conf.: Industrial Track, Las Vegas, Nevada, pp. 22–28, 2017. [Google Scholar]
26. L. H. Du, W. Liu, W. L. Zheng and B. L. Lu, “Detecting driving fatigue with multimodal deep learning,” in Proc. of the 2017 8th Int. IEEE/EMBS Conf. on Neural Engineering (NERShanghai, China, pp. 74–77, 2017. [Google Scholar]
27. R. Daza, A. Morales, J. Fierrez and R. Tolosana, “MEBAL: A multimodal database for eye blink detection and attention level estimation,” in Proc. of the Int. Conf. on Multimodal Interaction, Netherlands, pp. 32–36, 2020. [Google Scholar]
28. M. Jagannath and V. Balasubramanian, “Assessment of early onset of driver fatigue using multimodal fatigue measures in a static simulator,” Applied Ergonomics, vol. 45, no. 4, pp. 1140–1147, 2014. [Google Scholar]
29. L. L. Chen, Y. Zhao, P. F. Ye, J. Zhang and J. Z. Zou, “Detecting driving stress in physiological signals based on multimodal feature analysis and kernel classifiers,” Expert Systems with Applications, vol. 85, no. 4, pp. 279–291, 2017. [Google Scholar]
30. F. Laurent, M. Valderrama, M. Besserve, M. Guillard, J. P. Lachaux et al., “Multimodal information improves the rapid detection of mental fatigue,” Biomedical Signal Processing and Control, vol. 8, no. 4, pp. 400–408, 2013. [Google Scholar]
31. S. Ahn, T. Nguyen, H. Jang, J. G. Kim and S. C. Jun, “Exploring neuro-physiological correlates of drivers’ mental fatigue caused by sleep deprivation using simultaneous EEG, ECG, and FNIRS data,” Frontiers in Human Neuroscience, vol. 10, no. 848, pp. 1–14, 2016. [Google Scholar]
32. W. L. Zheng and B. L. Lu, “A multimodal approach to estimating vigilance using EEG and forehead EOG,” Journal of Neural Engineering, vol. 14, no. 2, pp. 1–10, 2017. [Google Scholar]
33. G. Zhang and A. Etemad, “Capsule attention for multimodal EEG-EOG spatiotemporal representation learning with application to driver vigilance estimation,” IEEE Transactions on Neural Systems and Rehabilitation Engineering, vol. 29, pp. 1138–1149, 2021. [Google Scholar]
34. H. T. Choi, M. K. Back and K. C. Lee, “Driver drowsiness detection based on multimodal using fusion of visual-feature and bio-signal,” in Proc. of the 2018 Int. Conf. on Information and Communication Technology Convergence (ICTCJeju, South Korea, pp. 1249–1251, 2018. [Google Scholar]
35. H. Li, W. L. Zheng and B. L. Lu, “Multimodal vigilance estimation with adversarial domain adaptation networks,” in Proc. of the 2018 Int. Joint Conf. on Neural Networks (IJCNNJeju, South Korea, pp. 1–6, 2018. [Google Scholar]
36. M. Sunagawa, S. I. Shikii, W. Nakai, M. Mochizuki, K. Kusukame et al., “Comprehensive drowsiness level detection model combining multimodal information,” IEEE Sensors Journal, vol. 20, no. 7, pp. 3709–3717, 2019. [Google Scholar]
37. A. Sengupta, A. Dasgupta, A. Chaudhuri, A. George, A. Routray et al., “A multimodal system for assessing alertness levels due to cognitive loading,” IEEE Transactions on Neural Systems and Rehabilitation Engineering, vol. 25, no. 7, pp. 1037–1046, 2017. [Google Scholar]
38. H. Zeng, C. Yang, G. Dai, F. Qin, J. Zhang et al., “EEG classification of driver mental states by deep learning,” Cognitive Neurodynamics, vol. 12, no. 6, pp. 597–606, 2018. [Google Scholar]
39. O. Dehzangi, V. Sahu, M. Taherisadr and S. Galster, “Multi-modal system to detect on-the-road driver distraction,” in Proc. of the 21st Int. Conf. on Intelligent Transportation Systems (ITSCMaui, HI, USA, pp. 2191–2196, 2018. [Google Scholar]
40. C. Anitha, Detection and analysis of drowsiness in human beings using multimodal signals. In: Digital Business. Lecture Notes on Data Engineering and Communications Technologies. Vol. 21. Cham: Springer, pp. 157–174, 2019. [Google Scholar]
41. C. B. S. Maior, M. J. das Chagas Moura, J. M. M. Santana and I. D. Lins, “Real-time classification for autonomous drowsiness detection using eye aspect ratio,” Expert Systems with Applications, vol. 158, pp. 1–12, 2020. [Google Scholar]
42. Z. Huang, R. Li, W. Jin, Z. Song, Y. Zhang et al., “Face2Multi-modal: In-vehicle multi-modal predictors via facial expressions,” in Proc. of the 12th Int. Conf. on Automotive User Interfaces and Interactive Vehicular Applications, Leeds, United Kingdom, pp. 30–33, 2020. [Google Scholar]
43. X. Peng, Z. Huang and X. Sun, “Building BROOK: A multi-modal and facial video database for Human-Vehicle Interaction research,” in The 1st Workshop of Speculative Designs for Emergent Personal Data Trails: Signs, Signals and Signifiers, co-located with the 2020 CHI Conference on Human Factors in Computing Systems, Honolulu, HI, USA, arXiv, pp. 1–9, 2020. [Google Scholar]
44. Y. Zhang, Y. Chen and C. Gao, “Deep unsupervised multi-modal fusion network for detecting driver distraction,” Neurocomputing, vol. 421, pp. 26–38, 2021. [Google Scholar]
45. G. Zhang and A. Etemad, “Capsule attention for multimodal EEG-EOG representation learning with application to driver vigilance estimation,” IEEE Transactions on Neural Systems and Rehabilitation Engineering, vol. 29, pp. 1138–1149, 2021. [Google Scholar]
46. L. Mou, C. Zhou, P. Zhao, B. Nakisa, M. N. Rastgoo et al., “Driver stress detection via multimodal fusion using attention-based CNN-LSTM,” Expert Systems with Applications, vol. 173, pp. 1–11, 2021. [Google Scholar]
47. J. Lee, H. Lee and M. Shin, “Driving stress detection using multimodal convolutional neural networks with nonlinear representation of short-term physiological signals,” Sensors, vol. 21, no. 7, pp. 1–16, 2021. [Google Scholar]
48. M. Papakostas, K. Riani, A. B. Gasiorowski, Y. Sun, M. Abouelenien et al., “Understanding driving distractions: A multimodal analysis on distraction characterization,” in Proc. of the 26th Int. Conf. on Intelligent User Interfaces, New York, United States, pp. 377–386, 2021. [Google Scholar]
49. Z. Lyu, C. Zhang and M. Han, “DSTnet: A new discrete shearlet transform-based CNN model for image denoising,” Multimedia Systems, pp. 1–13, 2021. [Google Scholar]
50. D. Kim, B. Comandur, H. Medeiros, N. M. Elfiky and A. C. Kak, “Multi-view face recognition from single RGBD models of the faces,” Computer Vision and Image Understanding, vol. 160, no. 14, pp. 114–132, 2017. [Google Scholar]
51. Q. Abbas, M. E. Ibrahim and M. A. Jaffar, “Video scene analysis: An overview and challenges on deep learning algorithms,” Multimedia Tools and Applications, vol. 77, no. 16, pp. 20415–20453, 2018. [Google Scholar]
52. Q. Abbas and M. E. Ibrahim, “DenseHyper: An automatic recognition system for detection of hypertensive retinopathy using dense features transform and deep-residual learning,” Multimedia Tools and Applications, vol. 79, no. 41, pp. 31595–31623, 2020. [Google Scholar]
 | This work is licensed under a Creative Commons Attribution 4.0 International License, which permits unrestricted use, distribution, and reproduction in any medium, provided the original work is properly cited. |