DOI:10.32604/cmc.2022.022554
| Computers, Materials & Continua DOI:10.32604/cmc.2022.022554 | |
| Article |
A Study on Classification and Detection of Small Moths Using CNN Model
Department of Computer Engineering, Honam University, Gwangsangu, Gwangju, 62399, South Korea
*Corresponding Author: Sang-Hyun Lee. Email: leesang64@honam.ac.kr
Received: 11 August 2021; Accepted: 16 September 2021
Abstract: Currently, there are many limitations to classify images of small objects. In addition, there are limitations such as error detection due to external factors, and there is also a disadvantage that it is difficult to accurately distinguish between various objects. This paper uses a convolutional neural network (CNN) algorithm to recognize and classify object images of very small moths and obtain precise data images. A convolution neural network algorithm is used for image data classification, and the classified image is transformed into image data to learn the topological structure of the image. To improve the accuracy of the image classification and reduce the loss rate, a parameter for finding a fast-optimal point of image classification is set by a convolutional neural network and a pixel image as a preprocessor. As a result of this study, we applied a convolution neural network algorithm to classify the images of very small moths by capturing precise images of the moths. Experimental results showed that the accuracy of classification of very small moths was more than 90%.
Keywords: Convolution neural network; rectified linear unit; activation function; pooling; feature map
Recently, with the amount of image data collected from smartphones, CCTV, BLACK BOXS, etc., there is an increasing demand for analyzing and utilizing the contents visually for the meaningful extraction of information by recognizing people, objects, and so on [1]. However, the problem is how accurate the image quality is. In particular, very small object images are often difficult to distinguish by photographs or eyes. To increase the accuracy of the object, high image quality image data is collected and necessary object data is extracted. The extracted object image can be learned by applying the deep learning algorithm, and then the object's type of the object can be selected [2–4].
The fully connected layer (FC layer) used as input data in artificial neural networks (ANN) is a layer in which all nodes of from the previous layer are connected to all nodes of from the next layer. The input data of an ANN composed only of a FC layer is limited to a one-dimensional (array) form [5].
One color picture used in the ANN is 3D data, and several pictures used in the batch mode are 4D data. When it is necessary to train a FC layer with photo data, 3D photo data should be flattened into 1D; but however, spatial information is lost in the process of flattening photo data. As a result, because of the lack of information due to the loss of image spatial information, the ANN is inefficient in extracting and learning features and has limitations in improving accuracy. A CNN is a model that can be trained while maintaining the spatial information of the image to compensate for this problem [6–9].
The CNN [10,11] used in this paper is a technique that mimics the human optic nerve structure. It automatically learns the features necessary for recognition from image processing to recognition, image recognition, and object recognition. It is an algorithm that can be applied effectively [12–17]. A CNN is used to classify image data in this paper.
Classified image data is extended to image data to learn the topological structure of the image. To improve the accuracy of image classification and to reduce the loss rate, a parameter for finding the fastest optimal point of image classification is set using a CNN and minimum preprocessor of pixel image [18,19]. The final result of this paper is to compare the accuracy and loss rate of data in classification through image classification using CNN, and study parameter setting and model instantiation for the improvement of image data classification [20–23].
The purpose of the study in this paper is to use a collection net made of a grid and sticky material to acquire an object of rice pests with a size of 1 mm or less. It is intended to increase the accuracy of artificial intelligence learning by expanding the objects of rice pests acquired from the gathering network.
In addition, the CNN model is used to help the object search and management of rice pests, and to be used very usefully, such as preventing the early spread of rice pests and preventing disasters.
This paper is organized as follows: Section 2 describes the image classification method using the CNN algorithm; Section 3 describes the configuration of the whole system to be studied; Section 4 describes the experimental results; and finally, Section 5 discusses the conclusion of this paper.
2.1 Image Classification Using CNN
The input data of ANN consisting of only FC layers is limited to a one-dimensional (array) form as shown in Fig. 1.
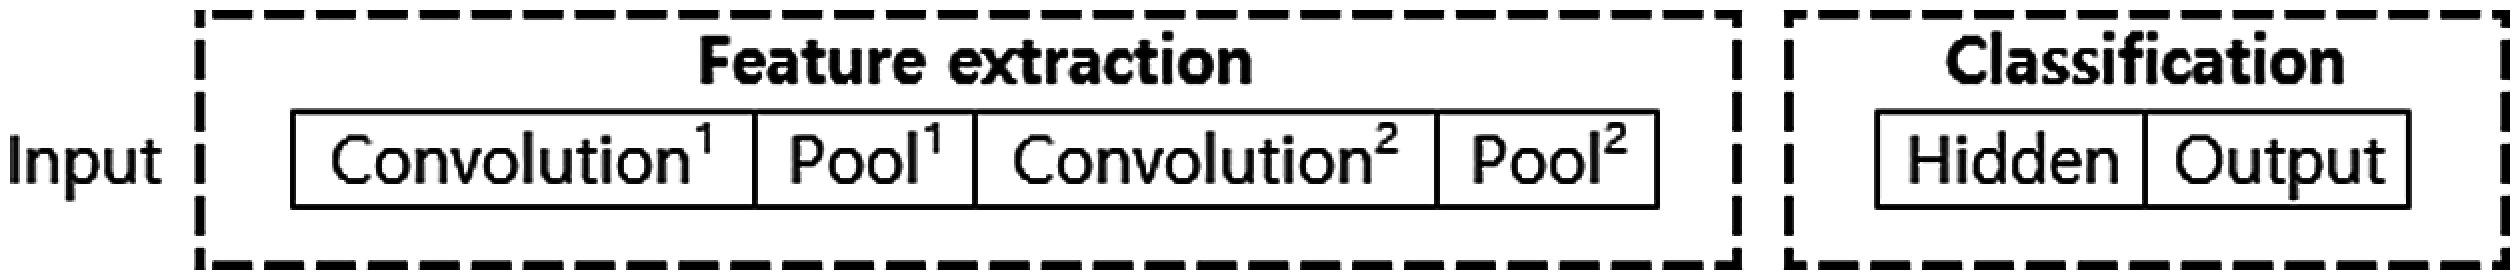
Figure 1: 1-Dimensional structure of CNN
A one-color photograph becomes three-dimensional data, and a plurality of photographs used in the arrangement mode is four-dimensional data. When the FC layers need to be learned by photographic data, the three-dimensional photographic data must be flattened into one dimension.
However, spatial information is lost in the process of flattening photographic data. As a result, lack of information due to loss of image space information limits the ANN to extract the feature points and becomes inefficient and increases the accuracy [24,25]. However, a CNN is a model that can learn while maintaining spatial information of images. CNNs can take full advantage of two-dimensional topological data as input data and show a good performance in phase and voice domain compared to other deep learning neural network structures.
The core of the CNN is to automatically extract features through CNN and classify objects using them. The convolution layer of the CNN has several convolution filters per layer, and the filters are determined automatically by learning. Convolution filters are determined through the learning function as feature extractors that automatically extract the characteristics of the input data. A rectified linear unit (ReLU) is used as the activation function used in CNN learning [26]. The Sigmoid function, which is a commonly used activation function, can create error because of slope of both ends (the rate of change of the cost converges to ‘0’ so that learning does not proceed any further as the layer becomes deeper); however, if you use ReLU, you will not have this error. In the system proposed in this paper, the supervised learning method is used for determining whether an object is an object, and many input object images are used for object learning.
2.2 Design of CNN Model to Search for Rice Pests
Each object's information is required to perform extraction and training. After collecting large quantities of images with the shape of objects and constructing them into learning data sets, passing the CNN will adjust the values of the neural network as learning progresses [27–29].
The proposed system is shown in Fig. 2: Object detection and learning. After sorting by object type in the object's dataset, the sorted object types are incremented and classified. By using this increased data, we learn about the characteristics of accurate objects by learning through a testing and training process. Here, the target of the learning data is less than 1 mm, and since it is collected outdoors, many unnecessary data are included, so a data booster is used for quick classification.
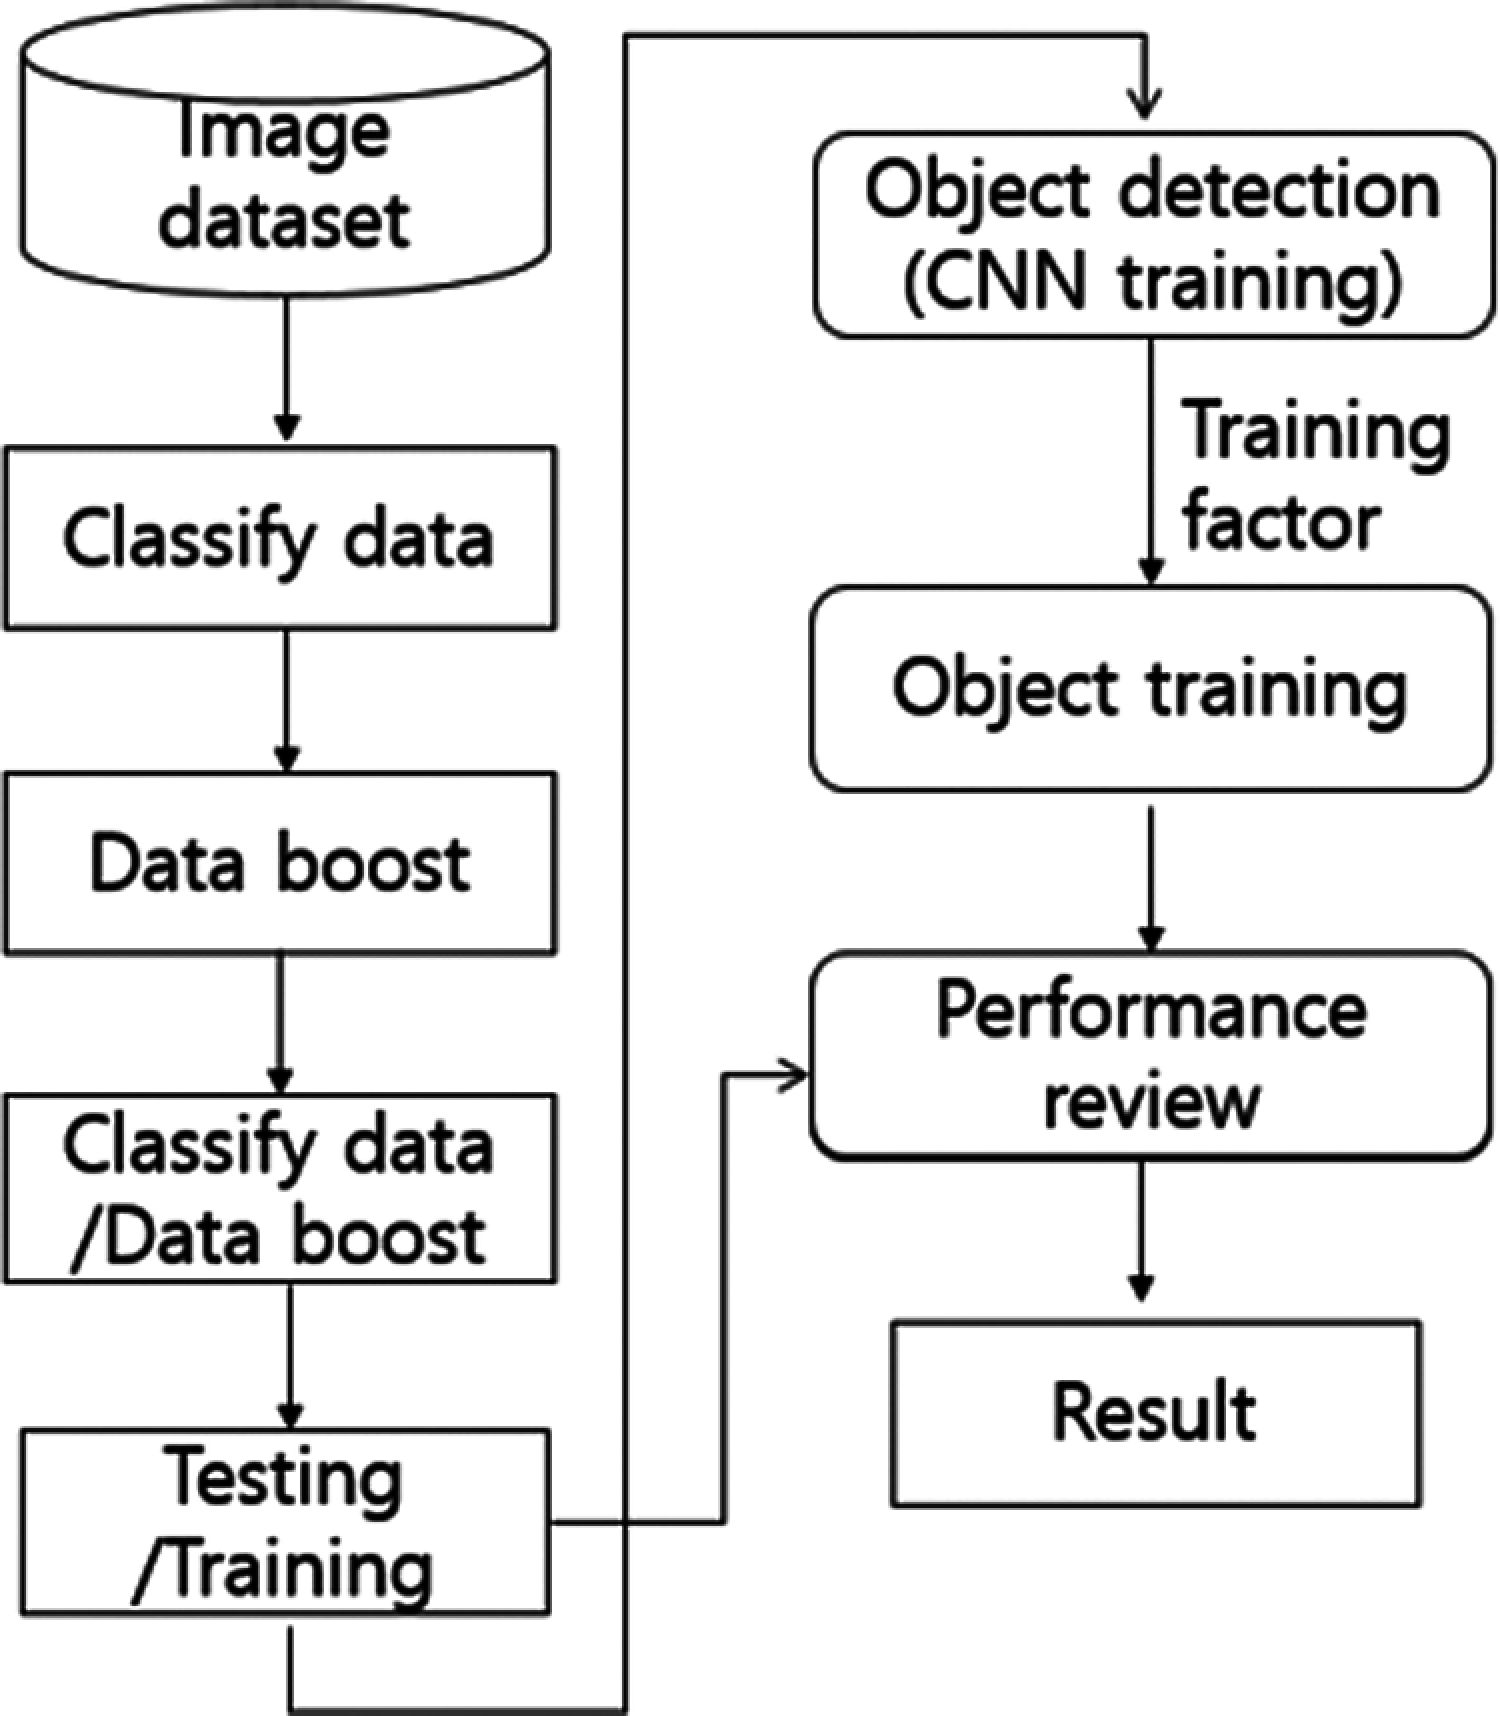
Figure 2: Configuration of the overall system
The configuration of the CNN of the proposed system is shown in Fig. 3. When the data used for training is input, it passes through the furthest convolution filter, passes through the convolution C layer to extract object features, and subsamples the dimension through maximum pooling (P layer) iterations. The two-dimensional feature map generated through this process is transformed into a one-dimensional vector for the classification of object detection and is transmitted to a multi-layer perceptron.

Figure 3: The architecture of the CNN object classifier
In the object recognition step, an object candidate region estimated based on an object type input in real-time is detected, and an object corresponding to an object candidate region is passed through a previously learned CNN to determine an object type. Fig 4 shows a detailed flowchart of each step [30,31].
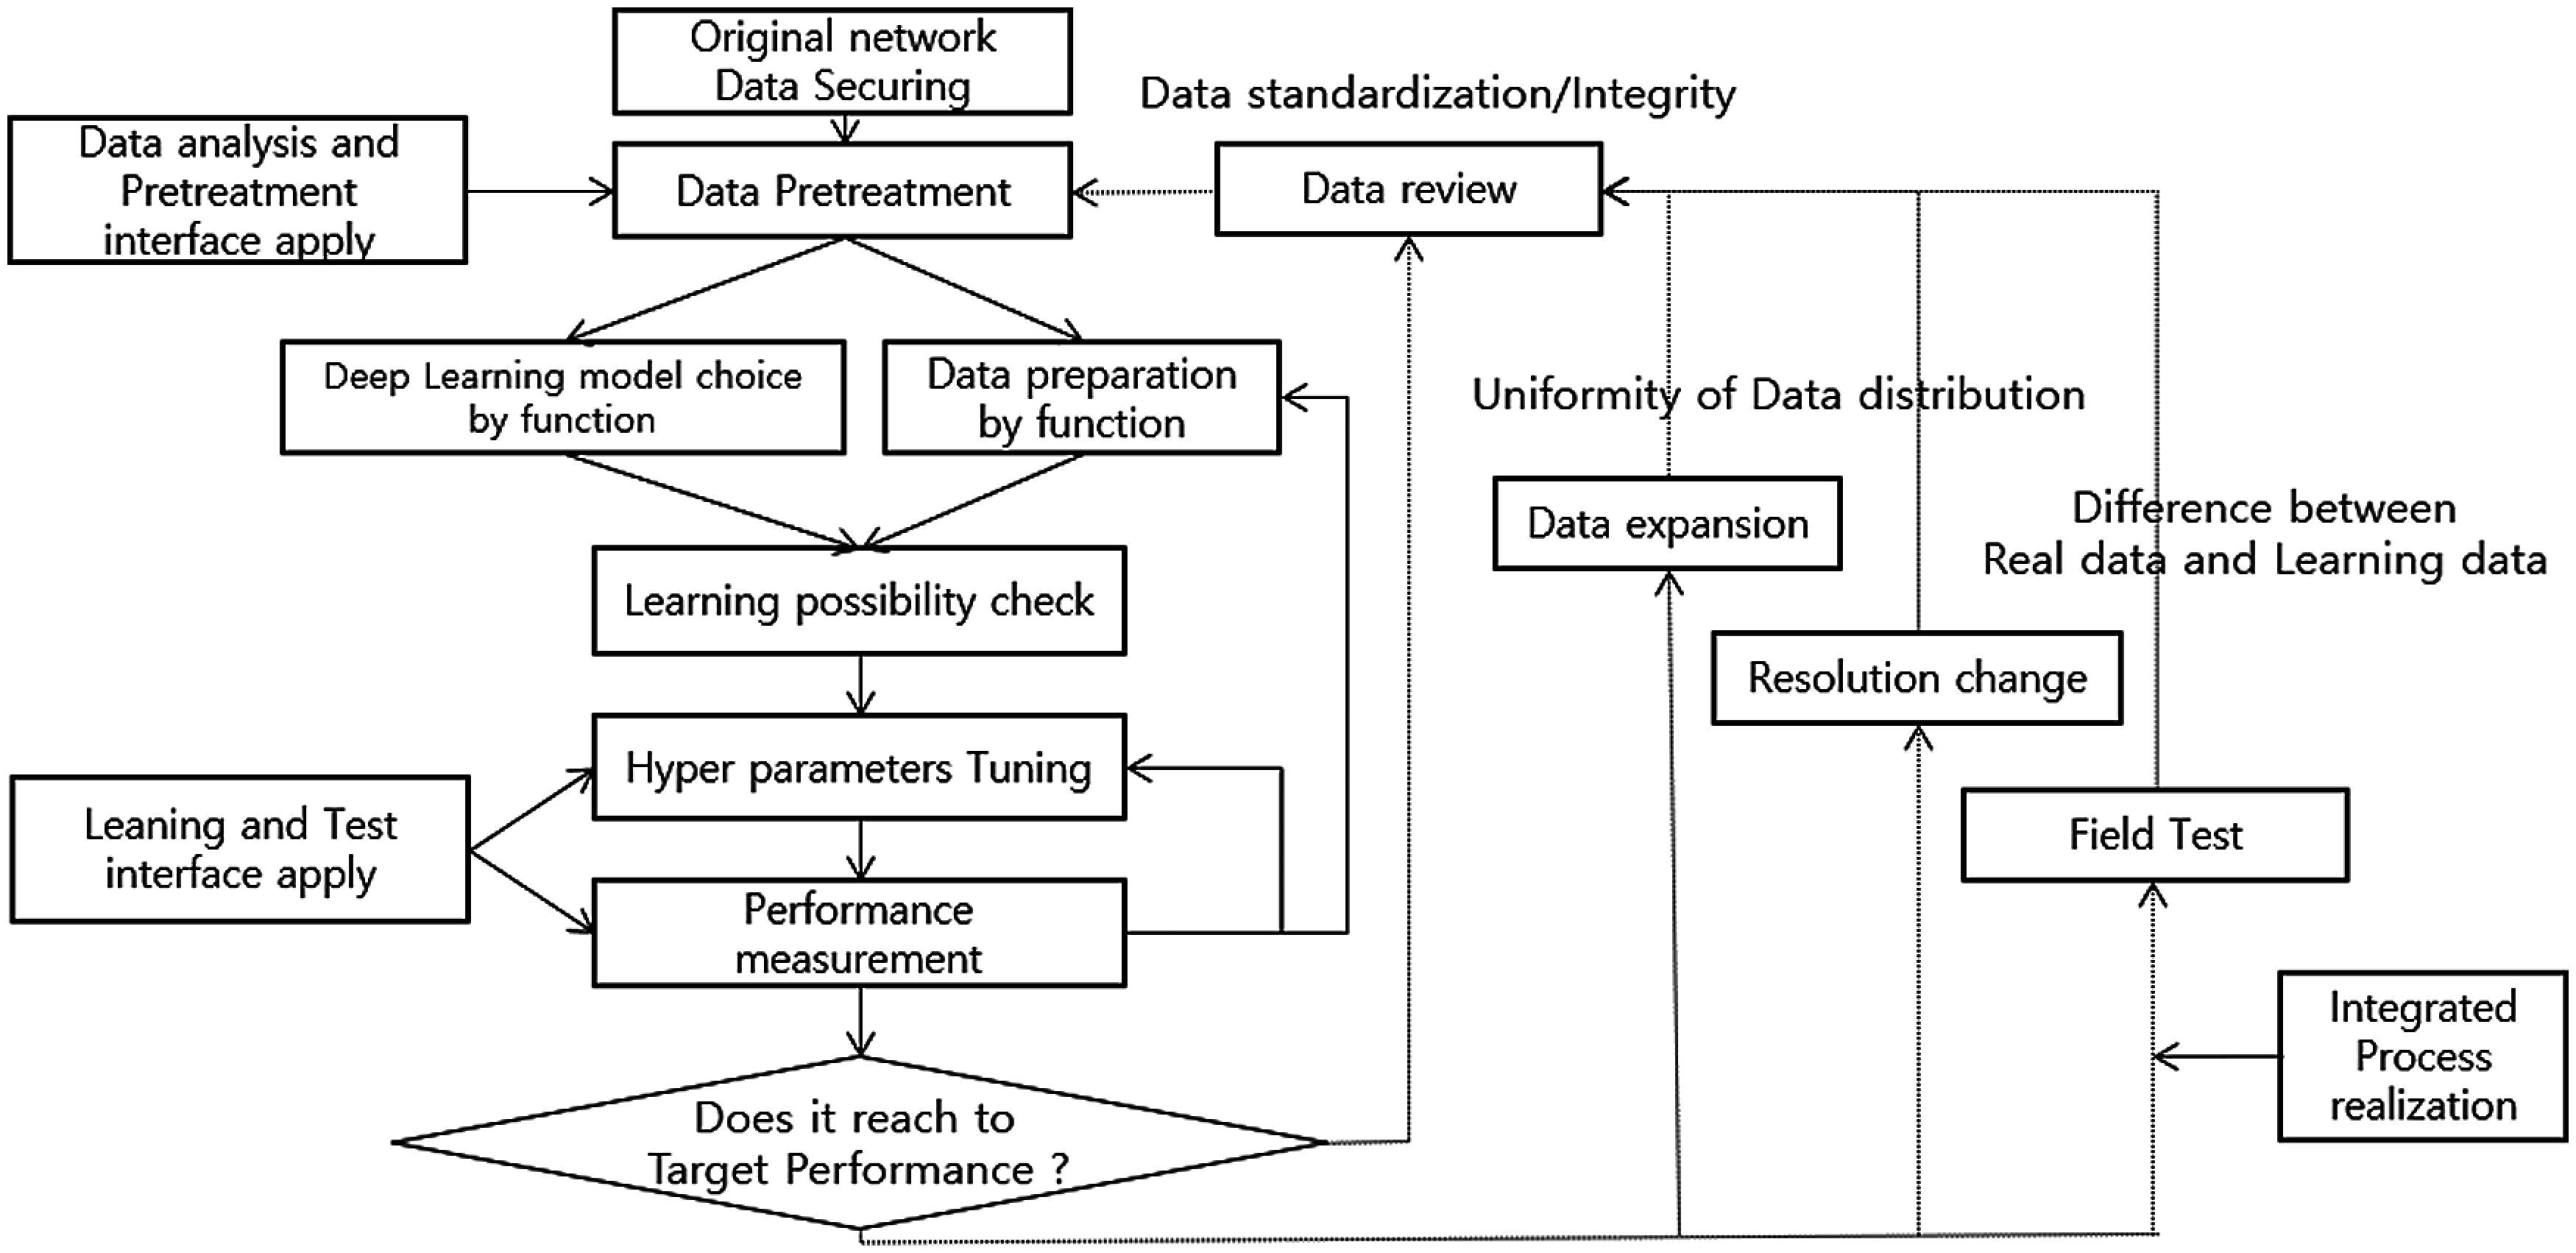
Figure 4: Concrete neural network concrete processing flowchart
The sequence of Fig. 4 is as follows. In the first step, after securing the data of rice pests obtained from the collecting network, pre-processing is performed to select a model for each function and prepare the data. The second step checks the learnability of these two functions. The third stage measures hyperparameter tuning and performance for training and testing. If the data preparation for each function and hyperparameter tuning are performed again according to the performance result. Finally, when the target performance is reached, the data is enlarged, and the difference between real field data and training data is checked for high resolution and process implementation.
One or more filters are applied to the input data coming into the convolution layer and become the channels of the feature map. If n filters are applied to the convolution layer, the output data will have n channels. To classify an image, input data for the size of the input image (width * height * RGB). At this time, the values of width = 32, height = 32, and RGB = 3 can be confirmed. The input image passes through the layers in the order of convolution layers-ReLU-Pooling-Fully Connected. At this point, you can see that the image becomes dim. The fully connected network at the final stage is a key step in CNN's decision to determine what a label means because it is a model that selects one of several labels as a process of doing softmax. This softmax changes the result of classifying the label to a value between 0 and 1 where the total is 1. It is said to be a probability because 1 is added to the whole. Eq. (1) is used as follows, where S (pre-diction: P) is the value predicted by softmax, L(Y) is the actual Y value, and L is the label. In this case, since the cost is a function to calculate the distance of actual value, V, it finds the lowest point in the direction of decreasing this value.
In this way, only the features of the object remain in the fully connected phase, and the convolution layers and ReLU are made up of a pair, with a pool in between, which means pooling (sampling, resizing).
The following are common parameters for finding the characteristics of an image with a filter. A filter is also called a kernel. In CNN, filter and kernel have the same meaning. A filter is generally defined by a square matrix such as (4, 4) or (3, 3), and consequently, the object of learning in CNN is a filter parameter. The input data is traversed at specified intervals, and the resultant product is multiplied by the channel, and then sum of the products of all the channels (3 in the case of color) is made into the feature map. The filter is synthesized by multiplying the total input data by moving at a specified interval, thereby creating a feature map. Fig. 5 illustrates the process of multiplying input data with one channel by the (3, 3) size filter and the feature map process.
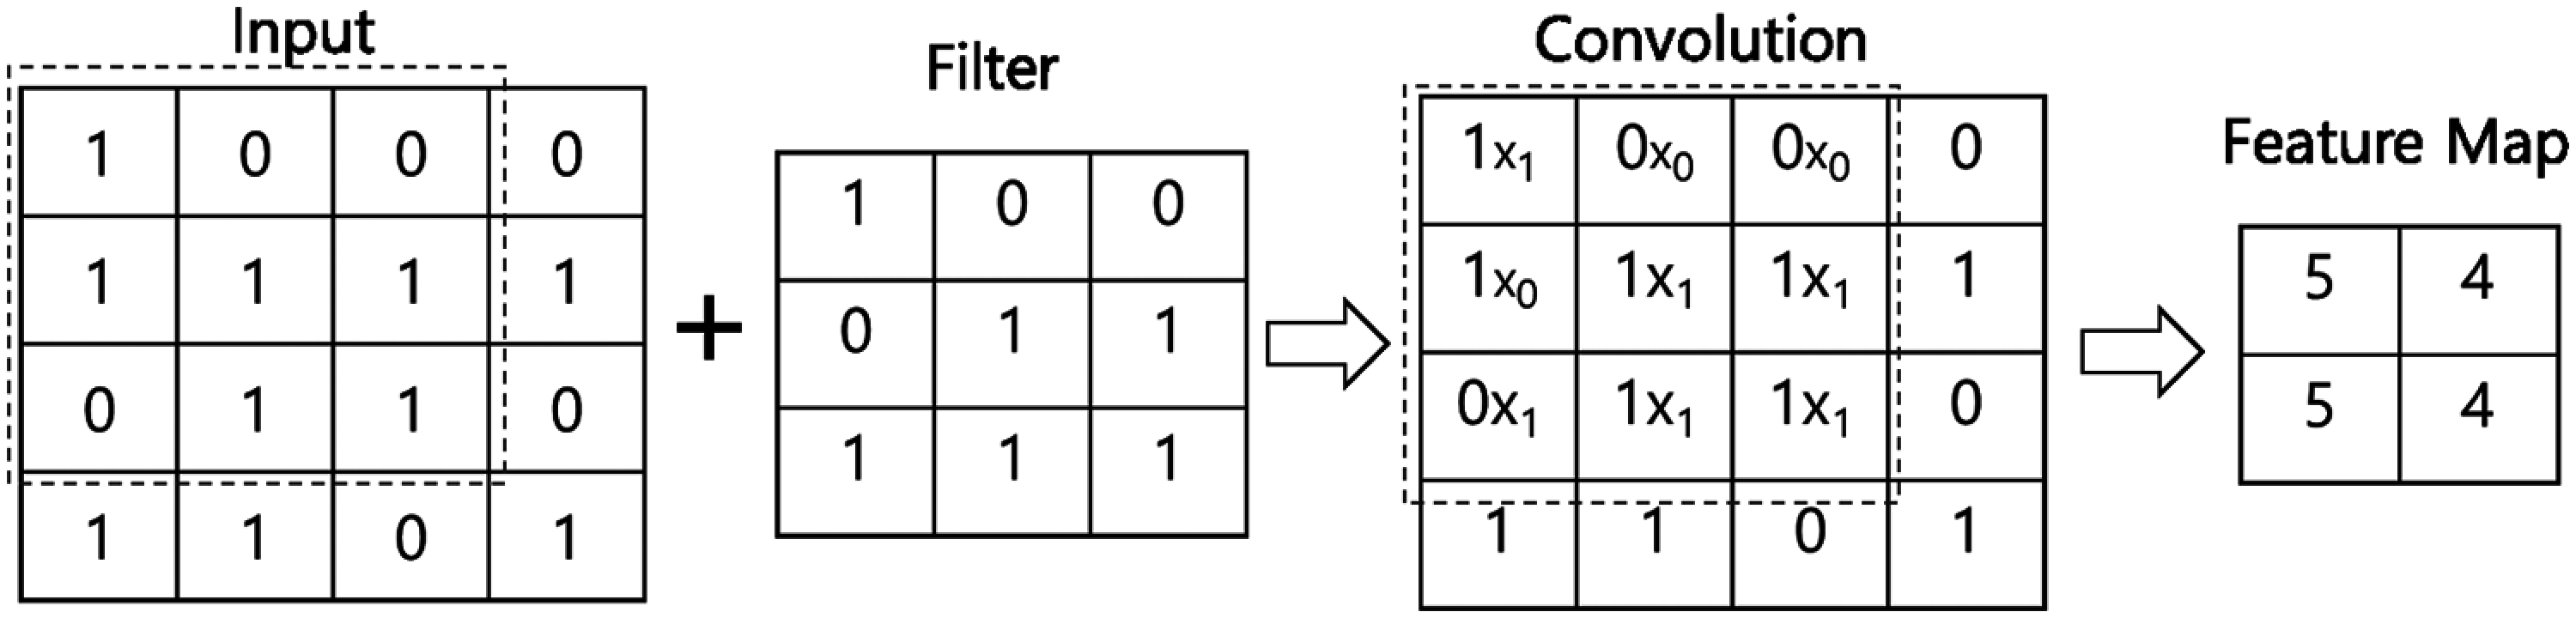
Figure 5: Composite product calculation and feature map
The filter calculates the resultant product by traversing the input data at a specified interval. The interval at which the filter is traversed at a specified interval is referred to as a stride. When the stride is 1, the filter is traversed to the input data, and when the stride is set to 2, the filter calculates the composite product by moving 2 spaces. If the input data has multiple channels, the filter traverses each channel, calculates the composite product, and creates a per-channel feature map. Then, the feature maps of the respective channels are summed and returned to the final feature map. As shown in Fig. 6, one feature map is created for each piece of input data regardless of the number of channels.
Multiple filters of the same size can be applied to one convolution layer. In this case, there are as many channels as the number of filters in the feature map. Therefore, the number of filters applied to the input data is the same as the number of channels in the feature map which is the output data. The input data of the convolution layer is circulated by the filters, and the output created through convolution is called a feature map or activation map. A feature map is a matrix created by the convolution calculation, and an activation map is the result of applying the active function to the feature map matrix. In other words, the final output of the convolution layer is the activation map.
The pooling layer is used to reduce the size of the output data (activation map) or to emphasize specific data by receiving the output data of the convolution layer as input. There are three kinds of pooling: max pooling, average pooling, and min pooling. Pooling operates by collecting the maximum value of a value in a specific area of a square matrix or by aver-aging a specific area. Fig. 7 illustrates how max pooling and average pooling work. Generally, you set the pooling size and the stride to be the same size so that all the elements are processed once.
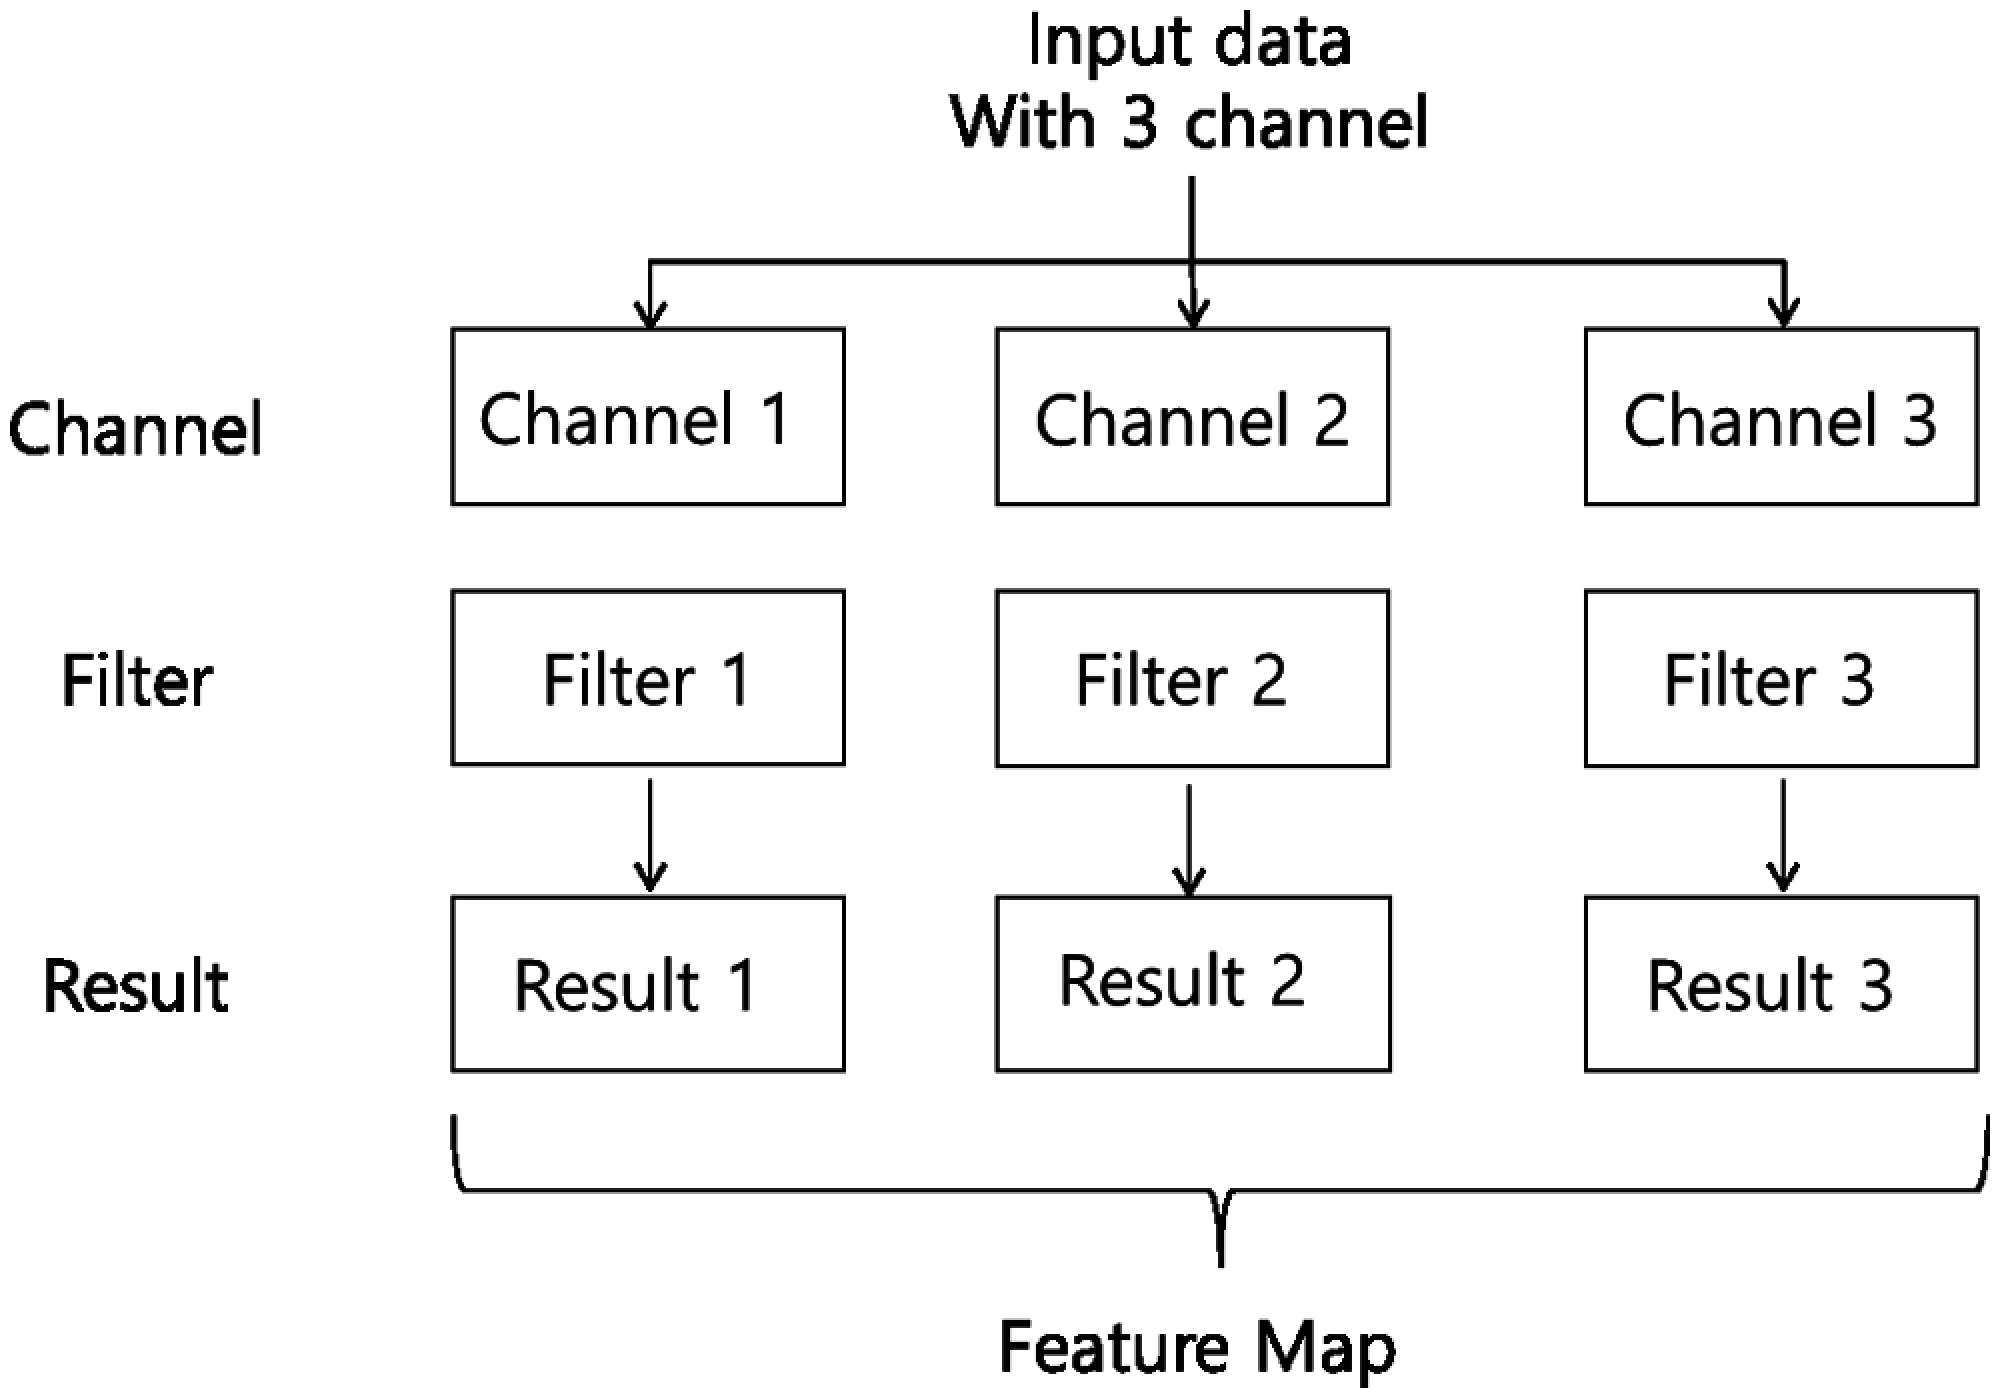
Figure 6: Multi-channel input data with filters applied
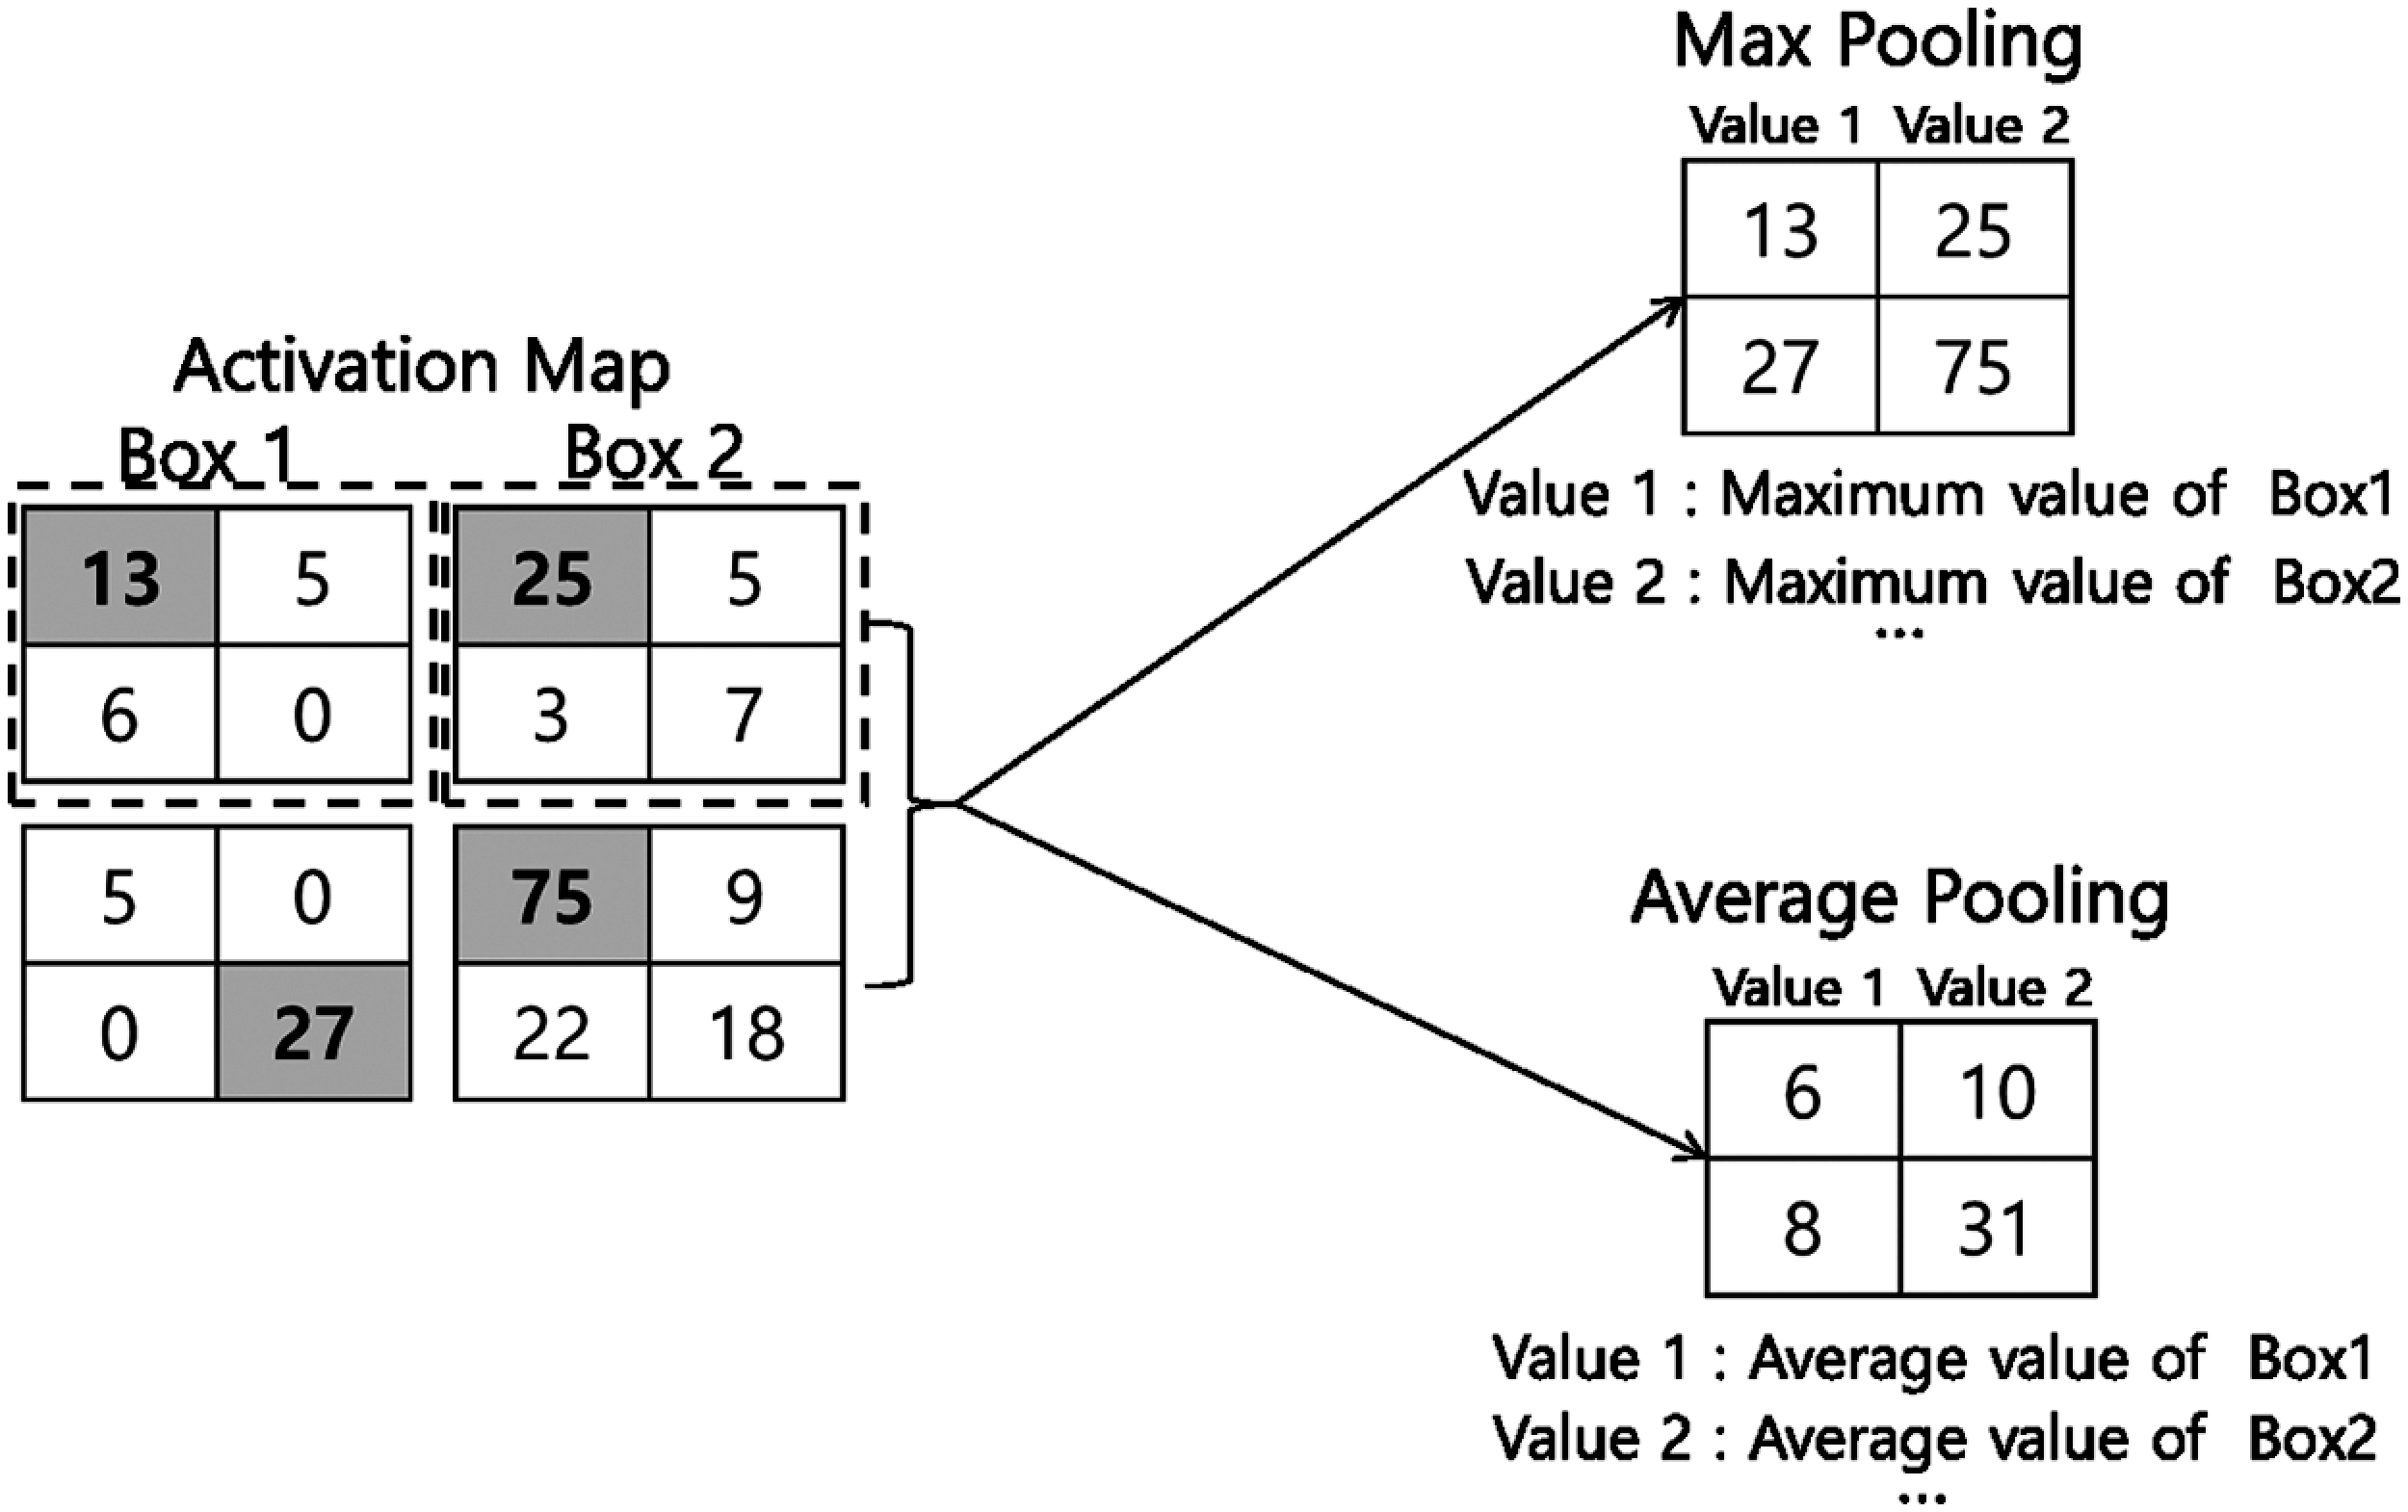
Figure 7: Max pooling, average pooling
The pooling layer has the following four characteristics compared to the convolution layer: First, there is no learning target parameter. Second, the size of the matrix is reduced if it passes through the pooling layer. Third, there is no change of the channel number through the pooling layer. Fourth, max pooling is used mainly in CNN.
The data of the moths used for the learning were learned using 9,700 original images collected during 12 months from 2019 to 2020.
When the data used for learning is input, first, the convolution layer that extracts the features of the object is extracted from the convolution filter, and the process of subsampling the dimension through the max-pooling layer is repeated twice. The two-dimensional object feature map generated through the above process is transformed into a one-dimensional vector for classification and is transmitted to the multi-layer perceptron.
In the first convolution layer, pooling is performed after 16 convolutions of 3 × 3 filters with different arbitrary Gaussian distributions which are pooled, and in the second convolution layer, pooling is performed after 64 convolutions of 3 × 3 filters which are converged in the same manner. When three input images pass through the first layer, the input data is passed through the convolution layer and max pooling, and a 16 × 16 × 16 feature map is generated. When passing through the second convolution layer and the max-pooling layer, X 16 × 64 feature maps are generated. Convolution is performed by adding all the boundaries of the input image to a value of 1 to avoid the loss of the original image size. In the case of max pooling, down sampling is performed to reduce the total number of all pixels by half.
Sixteen filters in the first layer and 64 filters in the second layer are learned as a combination of numbers that can classify individuals as learning progresses. When performing single learning, drop-out is used to arbitrarily select only 50% of the feature maps in a probabilistic manner and participate in the learning so that over-sum does not occur.
The image used for learning is cut into 32 × 32 and input into the neural network. In the case of small individuals, the shape is not clear, there is no fixed locational feature, and there are many forms of transformation. This makes it difficult for neural network learning to find the feature that is the rule, and as a result, the detection accuracy becomes low. To solve such a problem, when collecting learning data, it is not necessary to learn data having a large object size, and a portion having a small moth object in the image is cut to a size of 32 × 32. The forms were collected and studied.
In the detection of mollusks, all of the RGB data is used because the color has a significant meaning. Therefore, the size of the final input data is 32 × 32 × 3 dimensions, and the system distinguishes the types of the target object and the other two objects, which are replaced with logs with a probability value between 0 and 1. The resultant value is a value used to classify which class is suitable. The input data is classified into the class having the highest value. If the difference between the two result probability values calculated by the target entity and the other entity is small, it is regarded as not.
In the object recognition step, a candidate region estimated as an object is input by receiving the current frame image and the previous frame image of an image to be recognized, and then the corresponding image is passed through the previously learned CNN to determine a target object.
The process of detecting the candidate station is shown in Fig. 8. Here, Fig. 8 proceeds as follows: After inputting the current frame and the previous frame, filtering is performed using a Gaussian. In CNN, filter and kernel are used interchangeably, and these filters are common parameters for finding features of an image. Convolution is calculated by traversing input data at specified intervals. After checking the difference in which the image of the two frames is generated, the moving area is extracted. In order to detect an object candidate region, the current frame and the previous frame of the image are passed through a 7 × 7 Gaussian filter to remove the noise of the image. The high-frequency component included in the image is removed while passing through the Gaussian filter.
Fig. 9 shows the location of the object between images when microscopic pests and pests are gathered in a collection tool made of a square mesh. The object is then extracted from the edge of the collection network to align the images. As shown in Fig. 9 an image of the difference between two frames having temporal difference is calculated and a moving region is extracted. First, a selection object is extracted as a candidate region. Next, the candidate region is separated into RGB channels, and the R channel image is extracted as a suspicious region as a target object when the intensity of the object is greater than the threshold value.
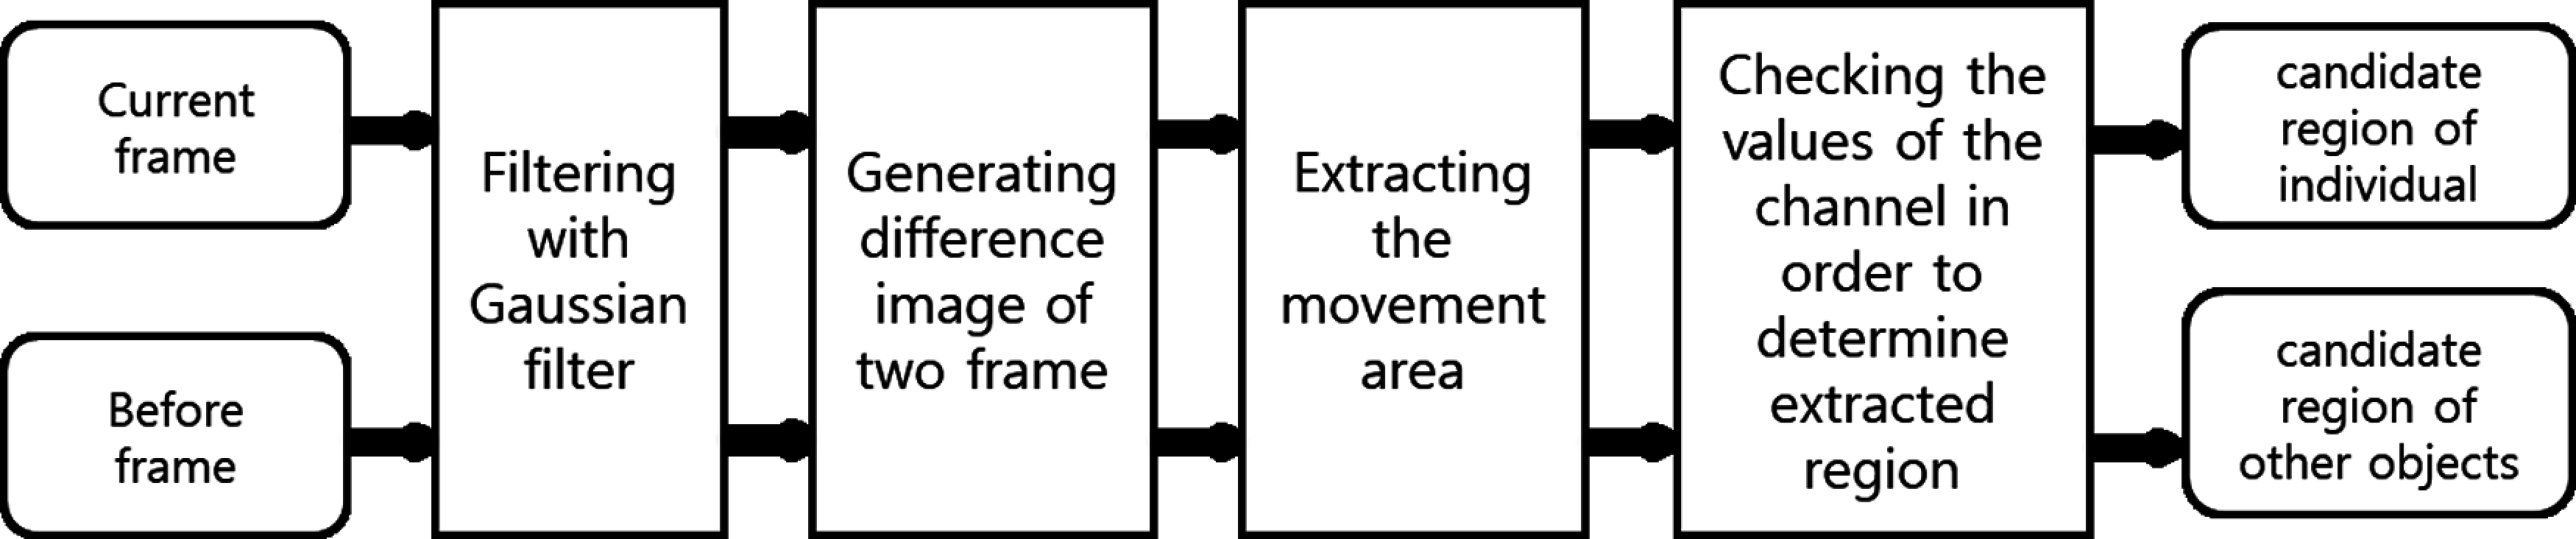
Figure 8: Process for detecting the candidate station
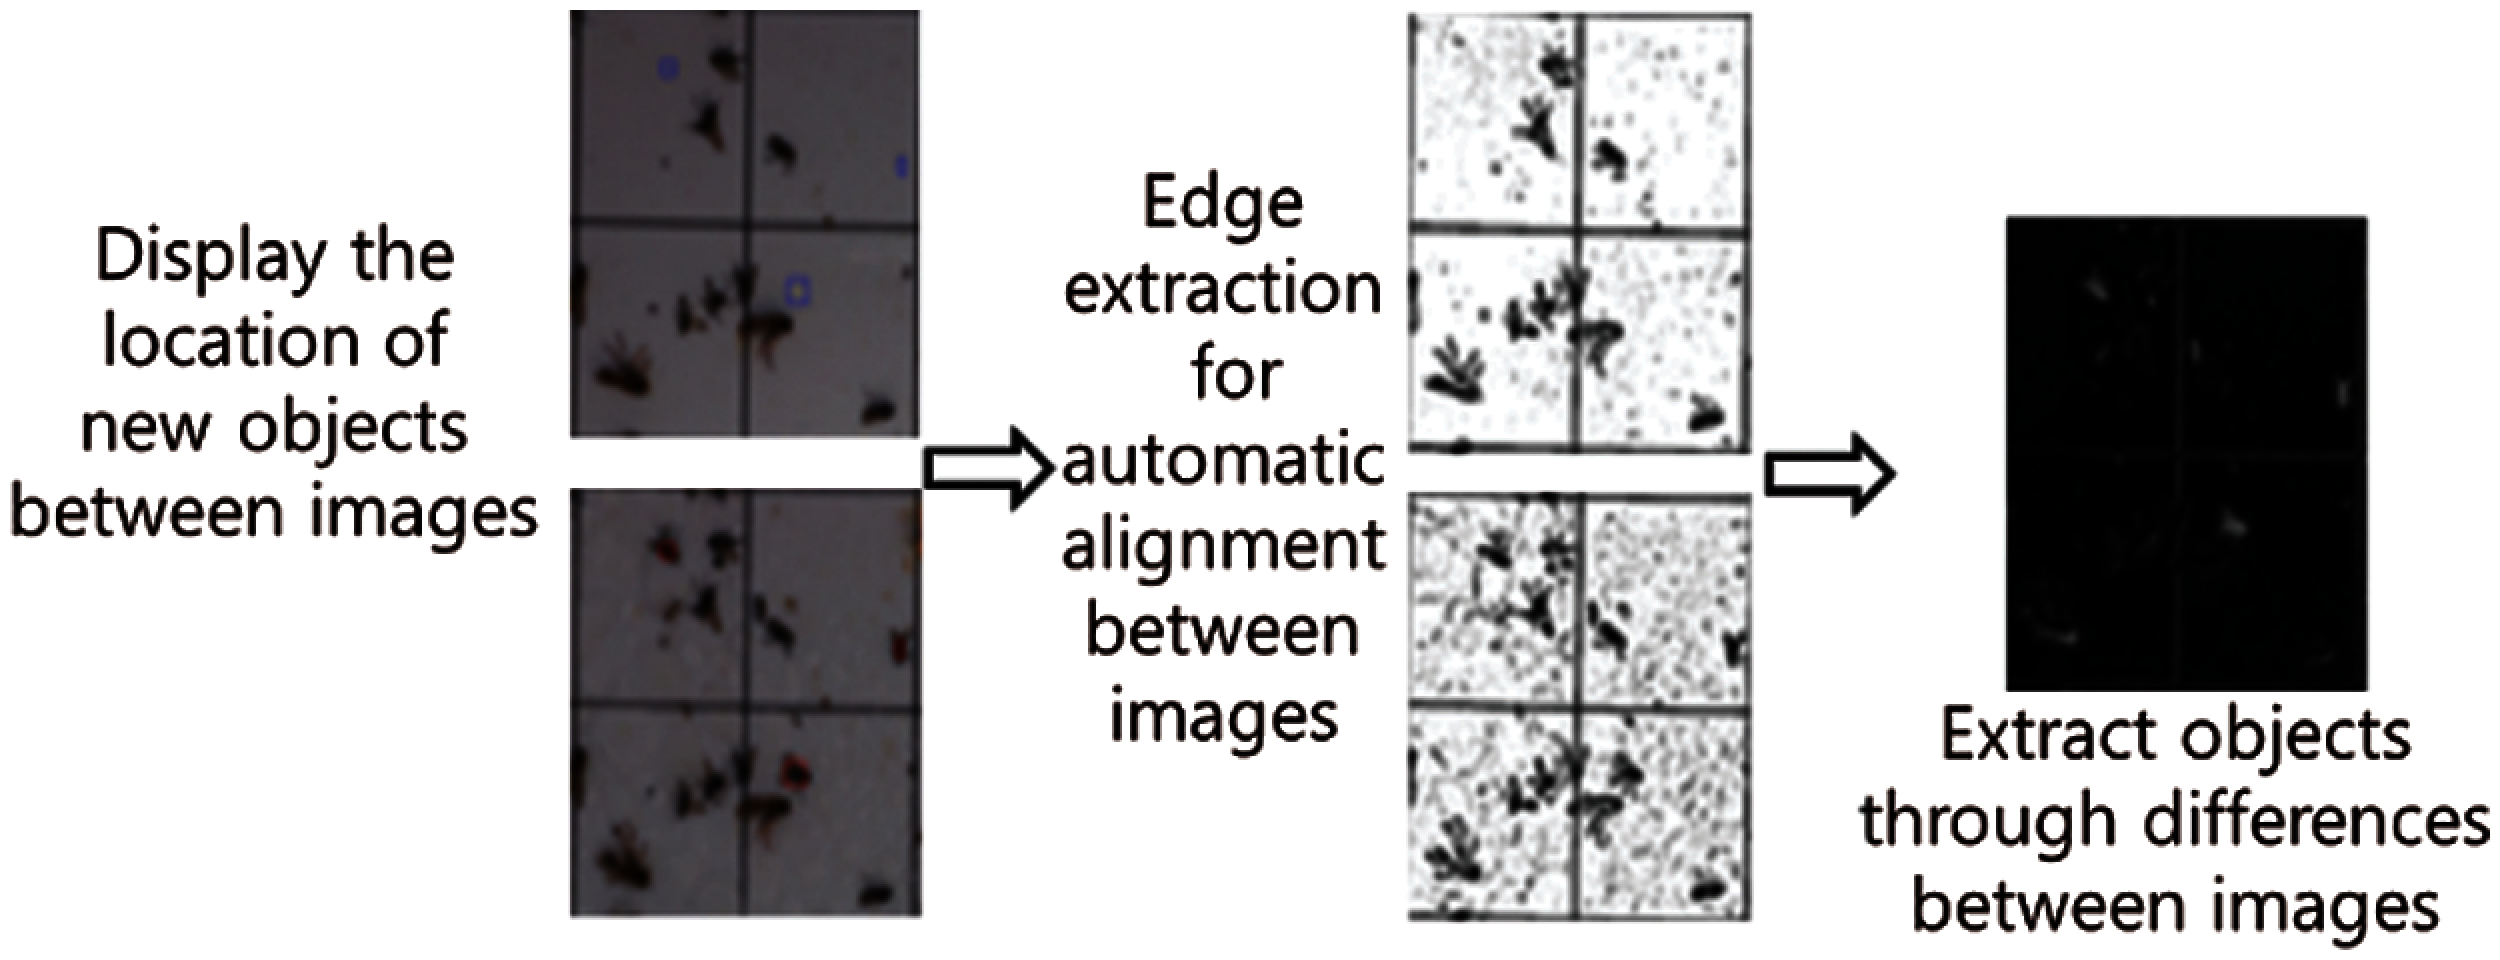
Figure 9: Compute image for the difference between two frames
In the R channel, both the other objects and target objects retain high numbers, while the G channels show differences. Although the G channel threshold value is also high in the case of other objects, the G channel value of the target object is relatively lower than that of the R channel although there is a slight change according to the data shooting method, weather conditions, and other conditions. The extracted object candidates are divided into 32 × 32 blocks and passed through the pre-learned CNN, and the target objects and other objects are recognized according to the result values.
Fig. 10 is the result of tracking the location of the image of the original object of the collection network (in other words, extracting the target object). After extracting the edge of the collection network of the tracked object, it is converted into a binarized object, and the target object is extracted as a final result.
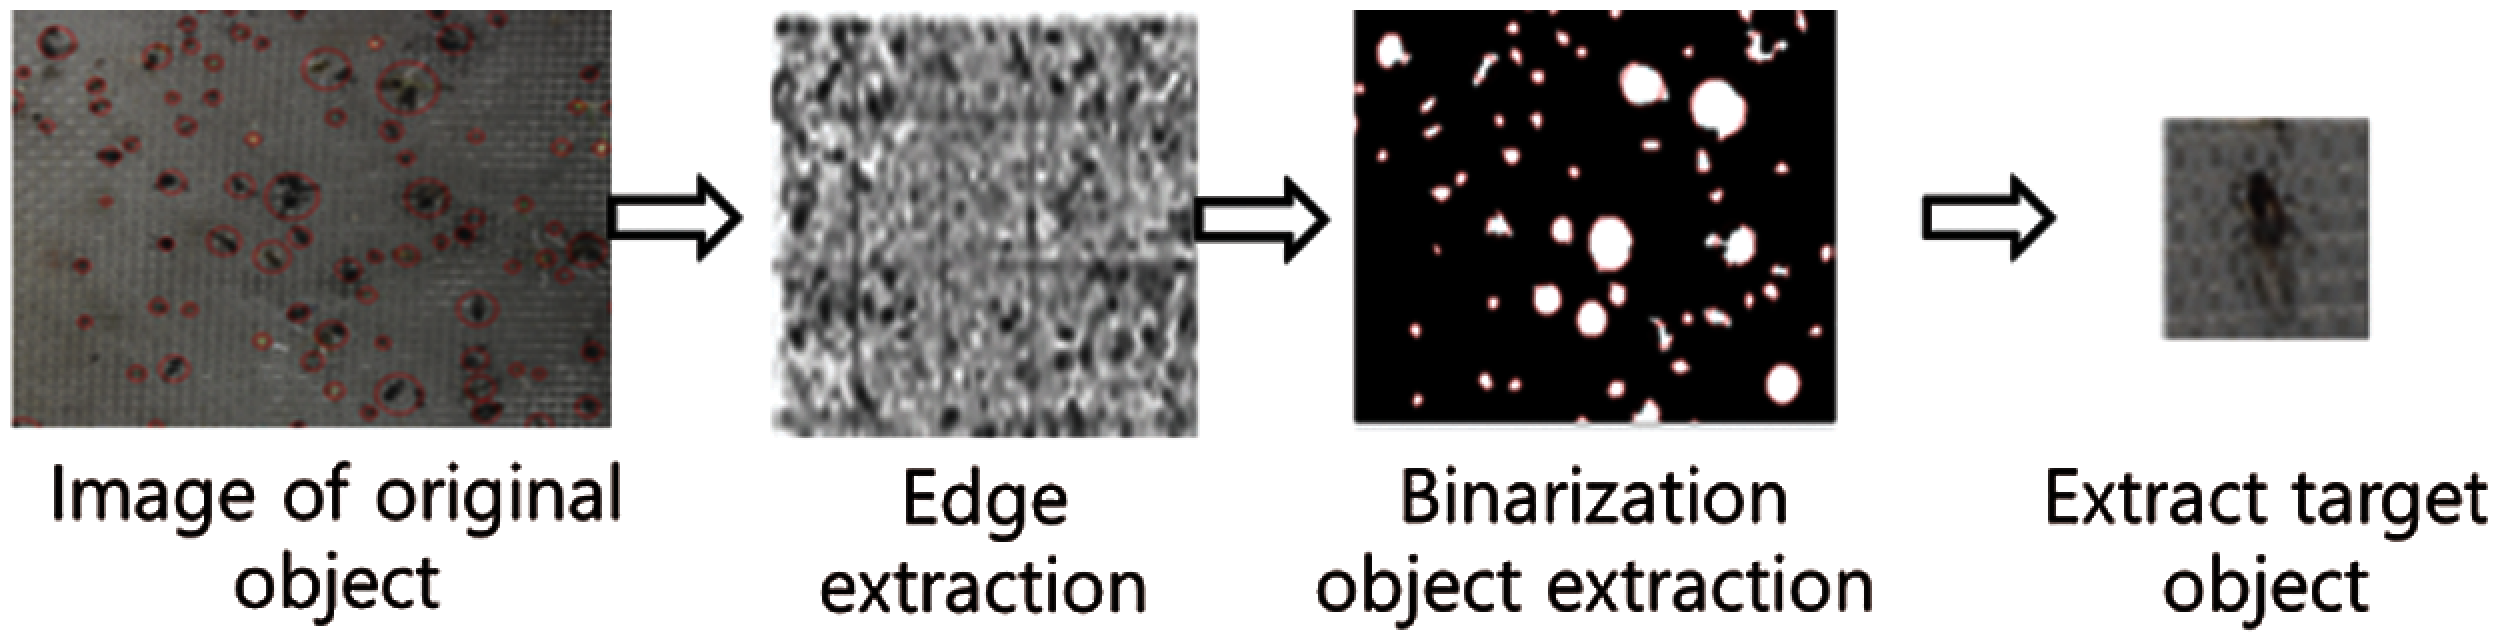
Figure 10: Candidate in the extraction process
The collected image set consists of a training set, a review set, and a test set as shown in Tab. 1 through random segmentation. Each set statistic after splitting should be approximately equal to the entire dataset.
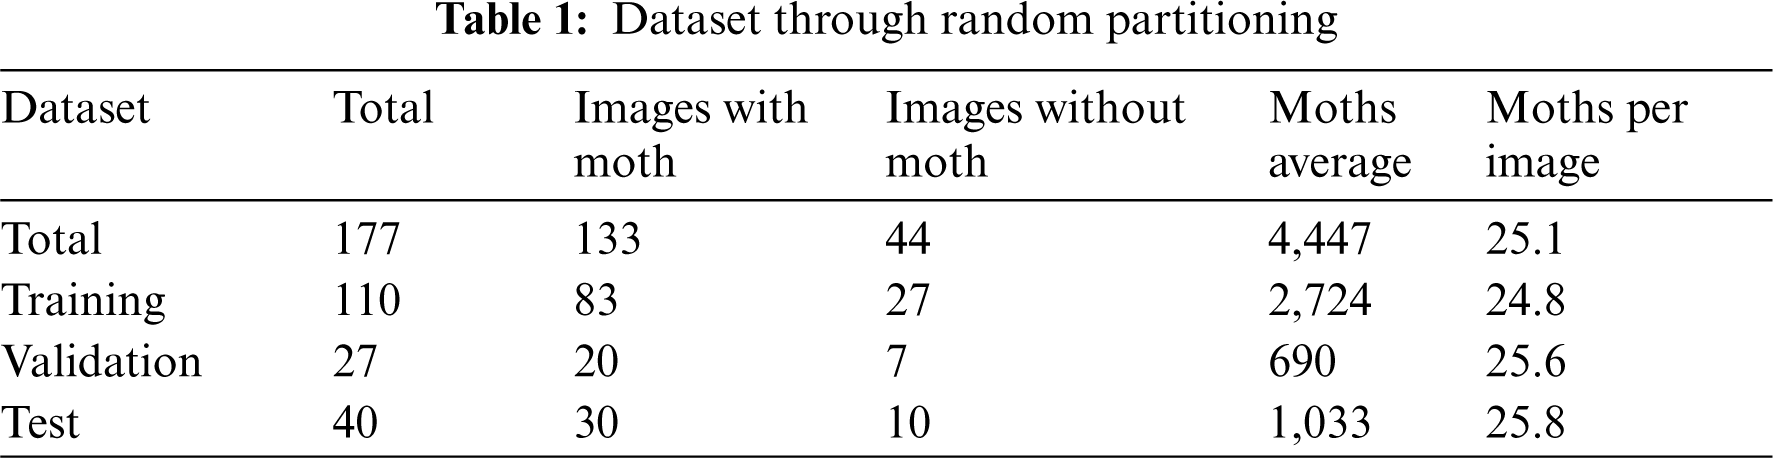
Fig. 11 shows the process for object detection of rice pests, the object recognition process of moths in the CNN model.
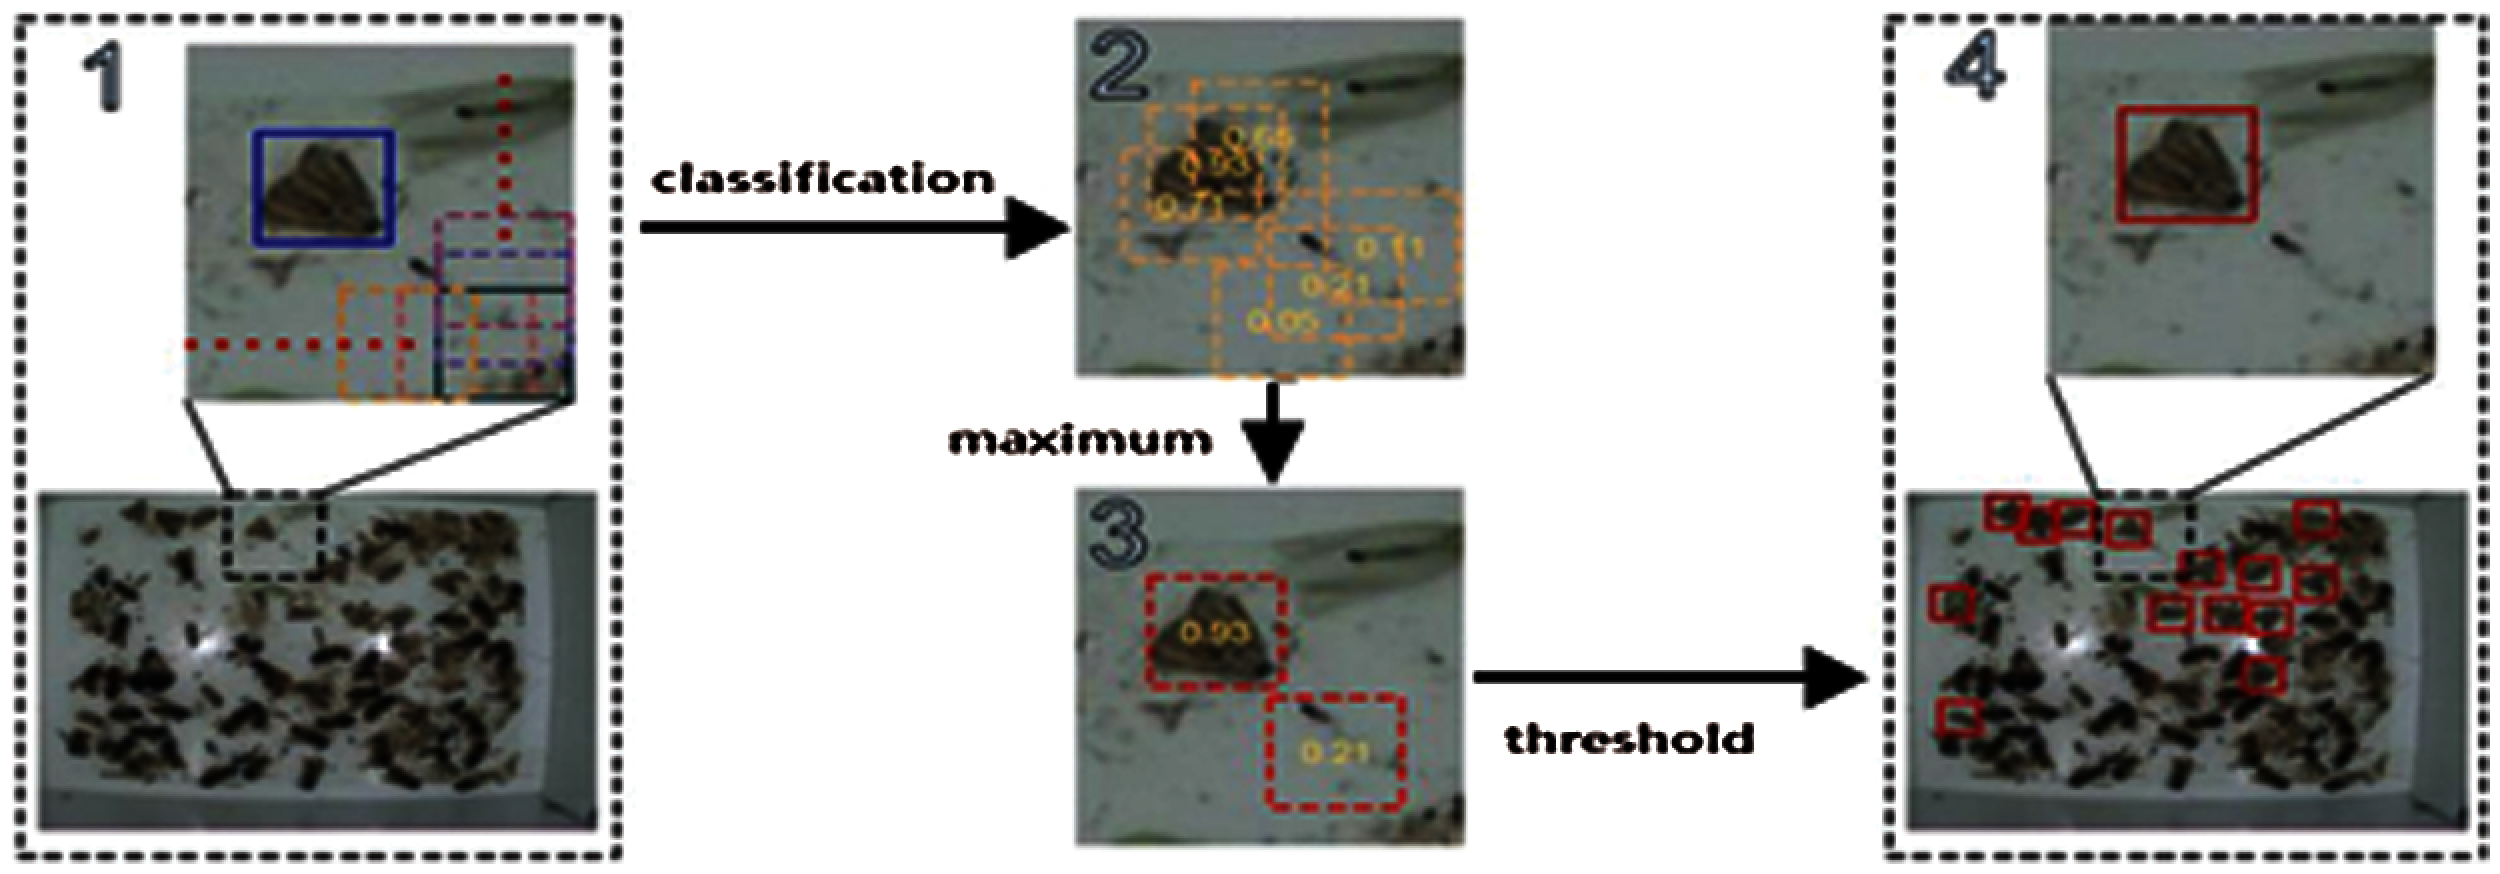
Figure 11: Object recognition process in moths
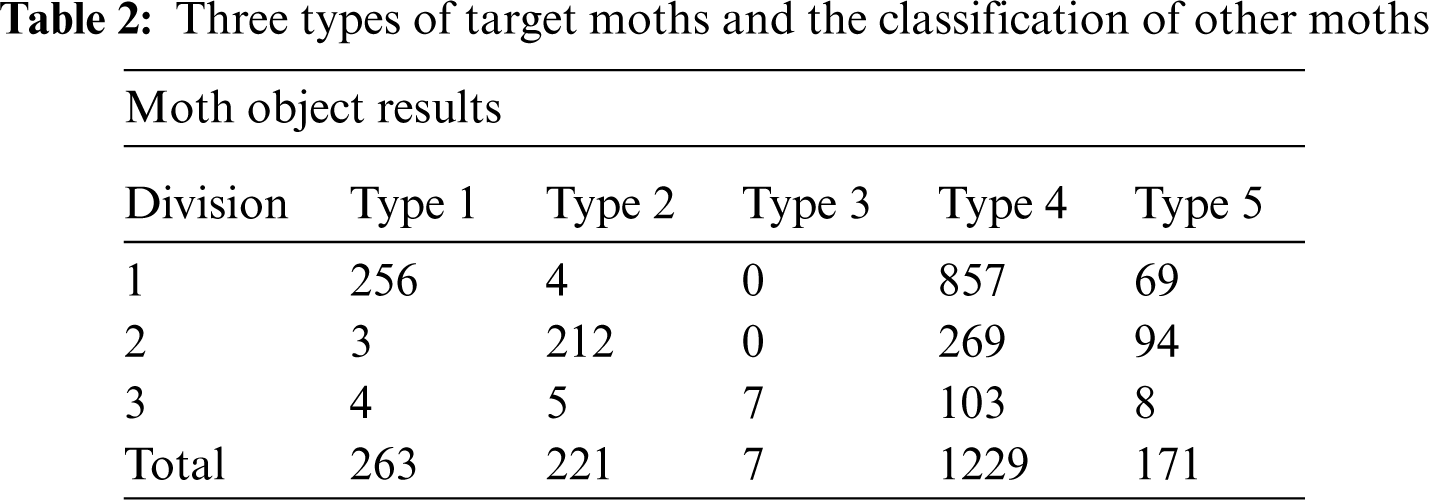
Finally, as shown in Tab. 2 the three types of moths of the target value to be searched are types 1 to 3, whereas the types 4 to 5 are classified as totally different kinds of moths among the collected moths.
In this paper, after learning a target object and other objects using a CNN, we proposed a method of detecting object candidates using image data input by the target object. As can be seen from the experimental results, the proposed system detects the candidate region with only motion and color, and then detects the CNN with simple convolution using two convolutional layers. The trained neural network has shown a particularly good effect in detecting targets and other objects in the target segment candidate area.
The results of this study are as follows: First, we improved the structure of the CNN to increase the number of convolutional layers and proposed a method to find several optimized functions by combining functions. These results demonstrate the effectiveness of training complex neural networks for detecting very small objects that are unclear in shape and color and can easily change in their surroundings. Therefore, it can be seen that it is a good approach not only for object discrimination but also for problems in complex environments.
Second, in this study, a method for selecting microscopic objects was proposed, which is intended to present a model for protecting crops from pests. It will be helpful for rural areas for analyzing risks by observing and predicting pests in the constant monitoring of crops.
Funding Statement: This research was supported by from Honam University, 2020.
Conflicts of Interest: The authors declare that they have no conflicts of interest to report regarding the present study.
1. Y. Wang, Z. Liu and J. C. Huang, “Multimedia content analysis-using both audio and visual clues,” IEEE Signal Processing Magazine, vol. 17, no. 6, pp. 12–36, 2000. [Google Scholar]
2. D. Zheng, Z. Ran, Z. Liu, L. Li and L. Tian, “An efficient Bar code image recognition algorithm for sorting system,” Computers, Materials & Continua, vol. 64, no. 3, pp. 1885–1895, 2020. [Google Scholar]
3. R. Chen, L. Pan, C. Li, Y. Zhou, A. Chen et al., “An improved deep fusion CNN for image recognition,” Computers, Materials & Continua, vol. 65, no. 2, pp. 1691–1706, 2020. [Google Scholar]
4. F. Jia, Y. Lei, N. Lu and S. Xing, “Deep normalized convolutional neural network for imbalanced fault classification of machinery and its understanding via visualization,” Mechanical Systems and Signal Processing, vol. 110, pp. 349–367, 2018. [Google Scholar]
5. B. Gu, W. Xiong and Z. Bai, “Human action recognition based on supervised class-specific dictionary learning with deep convolutional neural network features,” Computers, Materials & Continua, vol. 63, no. 1, pp. 243–262, 2020. [Google Scholar]
6. O. B. Sezer and A. M. Ozbayoglu, “Financial trading model with stock Bar chart image time series with deep convolutional neural networks,” 2019. [Online]. Available: https://arxiv.org/abs/1903.04610. [Google Scholar]
7. R. Samikannu, R. Ravi, S. Murugan and B. Diarra, “An efficient image analysis framework for the classification of glioma brain images using CNN approach,” Computers, Materials and Continua, vol. 63, no. 3, pp. 1133–1142, 2020. [Google Scholar]
8. L. Feng, B. Bhanu and J. Heraty, “A software system for automated identification and retrieval of moth images based on wing attributes,” Pattern Recognition, vol. 51, pp. 225–241, 2016. [Google Scholar]
9. Y. Ye, F. Liu, S. Zhao, W. Hu and Z. Liang, “Ensemble learning based on GBDT and CNN for adoptability prediction,” Computers, Materials & Continua, vol. 65, no. 2, pp. 1361–1372, 2020. [Google Scholar]
10. H. Li, W. Zeng, G. Xiao and H. Wang, “The instance-aware automatic image colorization based on deep convolutional neural network,” Intelligent Automation and Soft Computing, vol. 26, no. 4, pp. 841–846, 2020. [Google Scholar]
11. Y. Lecun, L. Bottou, Y. Bengio and P. Haffner, “Gradient-based learning applied to document recognition,” in Proc. of the IEEE, vol. 86, no. 11, pp. 2278–2324, 1998. [Google Scholar]
12. J. Wang, T. Zheng, P. Lei and X. Bai, “A hierarchical convolution neural network (CNN)-based ship target detection method in spaceborne SAR imagery,” Remote Sensing, vol. 11, no. 6, pp. 620, 2019. [Google Scholar]
13. Y. N. Chen, C. C. Han, C. T. Wang, B. S. Jeng and K. C. Fan, “The application of a convolution neural network on face and license plate detection,” in Proc. 18th Int. Conf. on Pattern Recognition ICPR'06, Hong Kong, China, vol. 3, pp. 552–555, 2006. [Google Scholar]
14. P. Duygulu, K. Barnard, J. F. de Freitas and D. A. Forsyth, “Object recognition as machine translation: Learning a lexicon for a fixed image vocabulary,” in Proc. 7th European Conf. on Computer Vision ECCV2002, Copenhagen, Denmark, pp. 97–112, 2002. [Google Scholar]
15. B. S. Jang and S. H. Lee, “CNN based sound event detection method using NMF preprocessing in background noise environment,” International Journal of Advanced Smart Convergence, vol. 9, no. 2, pp. 20–27, 2020. [Google Scholar]
16. Y. M. Kwon, J. J. An, M. J. Lim, S. S. Cho and W. M. Gal, “Malware classification using simhash encoding and PCA (MCSP),” Symmetry, vol. 12, no. 5, pp. 830, 2020. [Google Scholar]
17. N. Tasfi, “Image scaling using deep convolutional neural networks,” Flipboard Engineering, vol. 6, no. 27, 2015. [Google Scholar]
18. S. Cho, B. Shrestha, W. Jang and C. Seo, “Trajectory tracking optimization of mobile robot using artificial immune system,” Multimedia Tools and Applications, vol. 78, no. 3, pp. 3203–3220, 2019. [Google Scholar]
19. G. I. Lee, B. C. Ko and J. Y. Nam, “Fire-smoke detection based on video using dynamic Bayesian networks,” the Journal of Korean Institute of Communications and Information Sciences, vol. 34, no. 4C, pp. 388–396, 2009. [Google Scholar]
20. B. B. Traore, B. Kamsu-Foguem and F. Tangara, “Deep convolution neural network for image recognition,” Ecological Informatics, vol. 48, pp. 257–268, 2018. [Google Scholar]
21. M. Jogin, M. S. Madhulika, G. D. Divya, R. K. Meghana and S. Apoorva, “Feature extraction using convolution neural networks (CNN) and deep learning,” in Proc. 2018 3rd IEEE Int. Conf. on Recent Trends in Electronics, Information & Communication Technology, Bangalore, India, pp. 2319–2323, 2018. [Google Scholar]
22. U. Raghavendra, H. Fujita, S. V. Bhandary, A. Gudigar, J. H. Tan et al., “Deep convolution neural network for accurate diagnosis of glaucoma using digital fundus images,” Information Sciences, vol. 441, pp. 41–49, 2018. [Google Scholar]
23. A. F. Agarap, An Architecture combining convolutional neural network (CNN) and support vector machine (SVM) for image classification, [Online]. Available: https://arxiv.org/abs/1712.03541. [Google Scholar]
24. A. A. M. Al-Saffar, H. Tao and M. A. Talab, “Review of deep convolution neural network in image classification,” in Proc. IEEE 2016ICRAMET, Jakarta, Indonesia, pp. 26–31, 2017. [Google Scholar]
25. R. Battiti, “Using mutual information for selecting features in supervised neural net learning,” IEEE Transactions on Neural Networks, vol. 5, no. 4, pp. 537–550, 1994. [Google Scholar]
26. H. Ide and T. Kurita, “Improvement of learning for CNN with ReLU activation by sparse regularization,” in 2017 Int. Joint Conf. on Neural Networks (IJCNNAnchorage, AK, USA, pp. 2684–2691, 2017. [Google Scholar]
27. Z. Lin and L. S. Davis, “A pose-invariant descriptor for human detection and segmentation,” in European Conf. on Computer Vision, Marseille, France, pp. 423–436, 2008. [Google Scholar]
28. C. K. Ch'ng and C. S. Chan, “Total-text: A comprehensive dataset for scene text detection and recognition,” in 2017 14th IAPR Int. Conf. on Document Analysis and Recognition, Kyoto, Japan, pp. 935–942, 2017. [Google Scholar]
29. H. -S. Fang, C. Wang, M. Gou and C. Lu, “Graspnet-1Billion: A large-scale benchmark for general object grasping,” in Proc. IEEE/CVF Conf. on Computer Vision and Pattern Recognition, Seattle, WA, USA, pp. 11441–11450, 2020. [Google Scholar]
30. S. Gupta, R. Girshick, P. Arbeláez and J. Malik, “Learning rich features from RGB-d images for object detection and segmentation,” [Online]. Available: https://arxiv.org/abs/1407.5736. [Google Scholar]
31. G. Cheng, J. Han, P. Zhou and D. Xu, “Learning rotation-invariant and fisher discriminative convolutional neural networks for object detection,” IEEE Transactions on Image Processing, vol. 28, no. 1, pp. 265–278, 2019. [Google Scholar]
 | This work is licensed under a Creative Commons Attribution 4.0 International License, which permits unrestricted use, distribution, and reproduction in any medium, provided the original work is properly cited. |