DOI:10.32604/cmc.2022.022556
| Computers, Materials & Continua DOI:10.32604/cmc.2022.022556 | |
| Article |
Switched-Beam Optimization for an Indoor Visible Light Communication Using Genetic Algorithm
School of Telecommunication Engineering, Institute of Engineering, Suranaree University of Technology, Nakhon Ratchasima, 30000, Thailand
*Corresponding Author: Monthippa Uthansakul. Email: mtp@sut.ac.th
Received: 11 August 2021; Accepted: 15 September 2021
Abstract: Nowadays, Visible Light Communication (VLC) is an attractive alternative technology for wireless communication because it can use some simple Light Emitting Diodes (LEDs) instead of antennas. Typically, indoor VLC is designed to transmit only one dataset through multiple LED beams at a time. As a result, the number of users per unit of time (throughput) is relatively low. Therefore, this paper proposes the design of an indoor VLC system using switched-beam technique through computer simulation. The LED lamps are designed to be arranged in a circular array and the signal can be transmitted through the beam of each LED lamp with the method of separating the dataset to increase the number of simultaneous users for enhancing the indoor VLC. The coverage area is determined from the area where the communication can be performed at a location on the receiving plane with a Bit Error Rate less than or equal to the specified value based on coverage illuminance according to International Commission on Illumination (CIE) standards. In this paper, Genetic Algorithm is used to find the suitable solution for designing parameters to achieve maximum coverage area. The results show that a Genetic Algorithm can be used to find a suitable solution and reduce the computational time approximately 382 min in proposed scenarios.
Keywords: Visible light communication; genetic algorithm; optimization; light emitting diode
Visible Light Communication (VLC) is an interesting alternative technology because the current radio frequency communication system has limitations in data rate, insufficient bandwidth to increase the number of users, and interference among electromagnetic wave sources. So far, VLC technology demonstrates the next level of potential wireless communication in the near future because light can be easily used instead of using radio frequencies [1].
The VLC is one type of communication in which the data is transmitted by the modulation of light waves from the visible light spectrum with the wavelengths in the range of 380 nm–780 nm using LEDs. The reason for using LED to transmit data is because the LED is an electronic device that provides brightness, saves energy, and has a lifespan longer than traditional bulbs. This plays a significant role in smart lighting being able to provide both illuminations and also communication at the same time [2]. Not only VLC has increased capacity and low latency but also has the key property of LEDs that allows the VLC to be modulated at high frequencies enough to achieve higher data rates. It's a great opportunity to enhance the current wireless infrastructure, which can be applied in a wide range of applications such as scientific, industrial, commercial, and communication fields. These applications include indoor positioning, underwater communication and intelligent transportation system [3,4].
The structure of VLC consists of 3 main parts: transmitter, channel, and receiver, as shown in Fig. 1 [5]. On the transmitting side, the data is conveyed to the system and then modulated to the LED, which is the transmitting device to convert the electrical signal into a light signal. The data is transmitted by the flashing of light through the channel. While transmitting, the transmitter and receiver must be in the Line Of Sight (LOS). In fact, there is a loss of signal quality due to the interference caused by other ambient lights during transmission. This can be corrected by an optical bandpass filter to reduce the interference. On the receiving side, the device used to receive signal is a photodiode which detects light signal and converts to electrical signal. Afterward, the signal is demodulated back to be data [6].
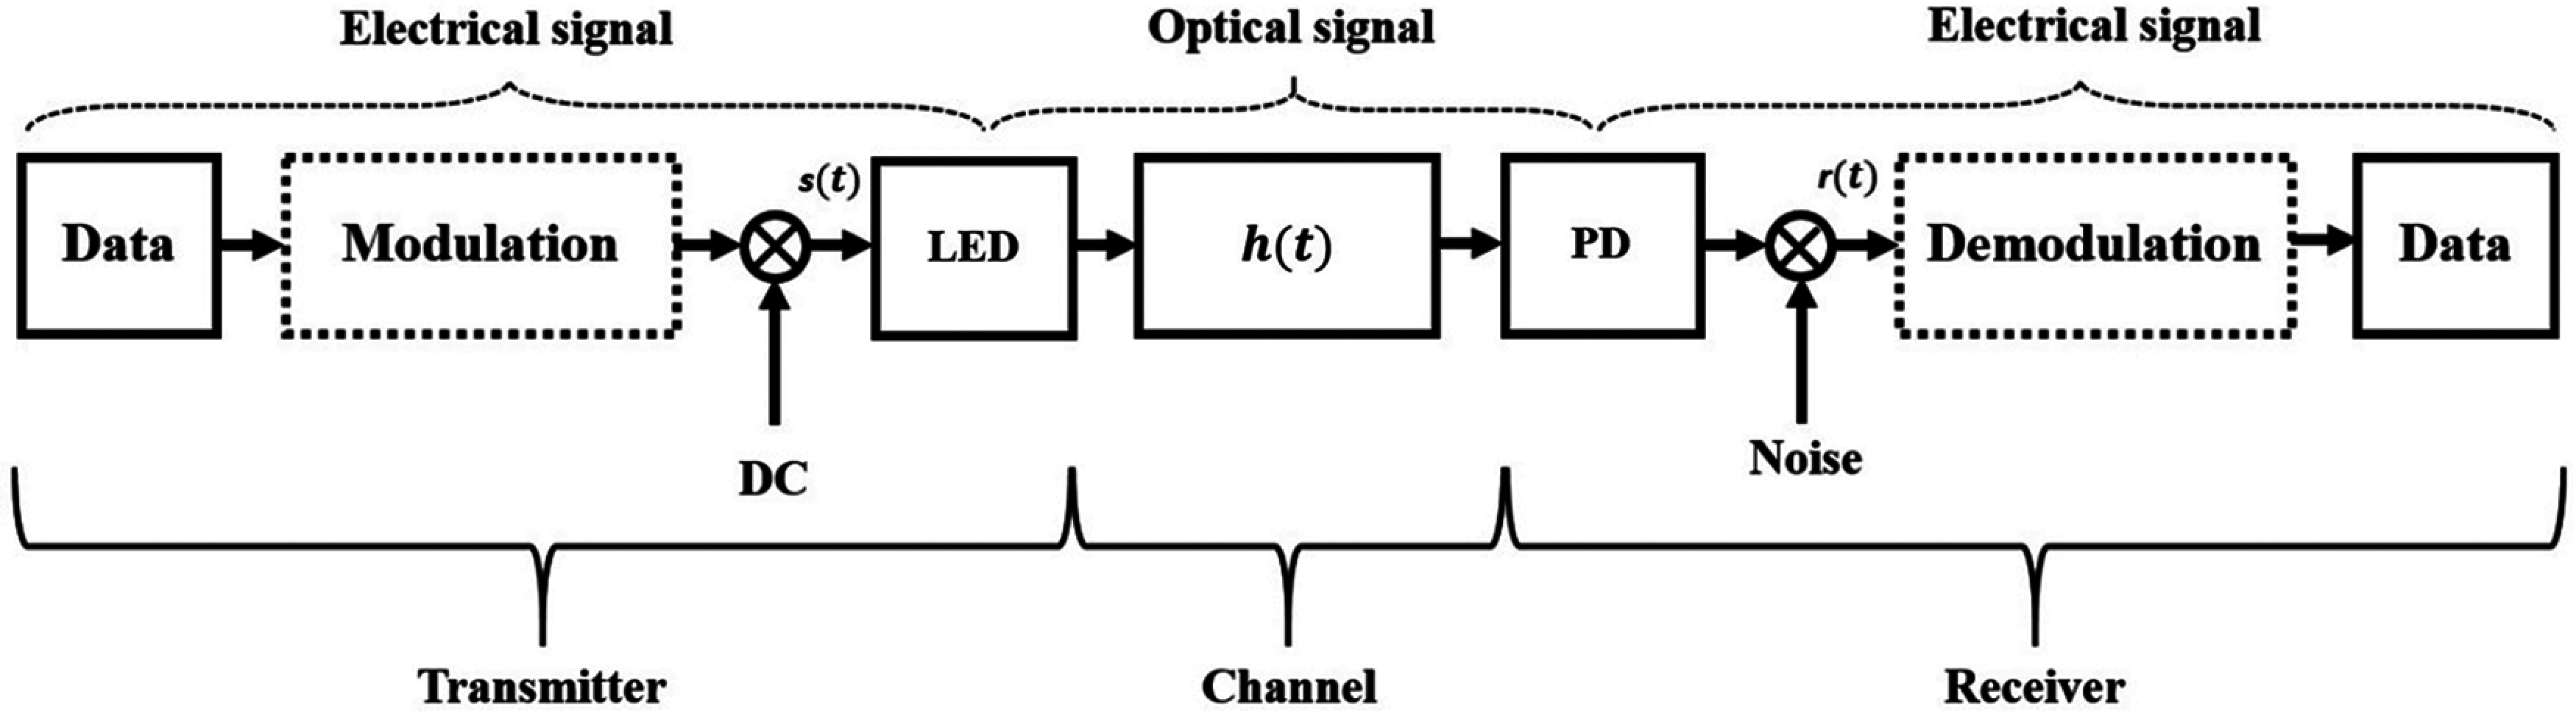
Figure 1: VLC structure
Light has been used for communication from the past to the present. For example, a photophone was invented in the late 19th century by Alexander Graham Bell. The photophone has been considered as the beginning era of optical communication. The work started from sunlight reflection on the glass surface of the transmission sector, in which the light waves vibrate according to the user's voice. After that, light is sent to the lens which is a reflective curved glass installed in the receiver [7]. A novel method of establishing a secure and reliable communication link using optical wireless communication is achieved by separating signal transmission with two optical transmitters [8]. In 2000, LEDs gained a lot of attention in which they can be utilized in VLC with the use of white LED for indoor communication [9]. Moreover, in 2011, the introduction of Light Fidelity (Li-Fi) was introduced as technology similar to Wi-Fi. However, it transmits a signal with light by changing the brightness or amplitude of LEDs. This can transmit only one dataset through the LED beam per user at a time. Li-Fi has been considered the first application of VLC [10].
The VLC can be categorized as indoor VLC, such as communication in the office room, on the plane, or even in the hospital, etc., and outdoor VLC such as Vehicle-to-Vehicle communications (V2V) or Vehicle-to-Infrastructure communication (V2I) [1]. Nowadays, many kinds of researches have been designed to arrange LED arrays in various forms for performance enhancement, usually arranged in a square and circular shapes. The performance of square and circular arrangements was analyzed, and it was found that circular-array LED arrangement provides better uniformity of illumination in terms of light distribution [11].
The optimal circular-array LED arrangement was presented to improve the uniformity of Illumination for the VLC system [12]. The design has 16 white LEDs used in a room size of 5 × 5 × 3 m3, with 4 LEDs in the corner and 1 LED in the middle of the room, surrounded by 11 LEDs arranged in a circular form. In the simulation, the radius of the circular array was changed from 1.5 to 2.3 m in increments of 0.2 m. The results have shown that at a radius of 2.1 m, the VLC system has the highest uniformity of illumination but still transmits only one dataset through the LED beam per user at a time.
In addition, the optical beamforming technique can be used for enhancing the VLC system. The Spatial Light Modulator (SLM) uses optical beamforming to control the LED beam to be directly focused on the desired target device at the receiver [13]. This prevents energy-wasting in unnecessary directions and can enhance the quality of the received signal. The SLM is an amplitude or phase-modulated device in which liquid crystal molecules are arranged inside [14]. It can be controlled by a computer to adjust the voltage. When the voltage increases, the liquid crystal molecules change, causing the phase to change. As a result, the direction of the beam can be focused on the desired target device at the receiver. In the experiment, the communication signal was generated using a function generator and modulated from input data to LED. Then, the LED light was passed through a beam expander to control the beam size in the experiment and entered into the SLM. The SLM is controlled by a computer for giving the direction of the beam to focus on the desired target device at the receiver. The results have shown that before using optical beamforming, the received signal cannot be normally demodulated because the signal strength is too weak. However, the signal strength as the same as Signal to Noise Ratio (SNR) increases compared to the original ones after using optical beamforming.
The optical beamforming can be applied to multiple access techniques such as Space Division Multiple Access (SDMA) or Time Division Multiple Access (TDMA) to support multiple users in real situations [15]. The SDMA optical beamforming is the division of beams into different areas. It uses the SLM for controlling the LED beam to be focused on the target device. The use of the SDMA optical beamforming technique can support a larger number of users in which multiple users can communicate with each other at the same time. However, the received signal strength decreases with the number of users. Moreover, for the TDMA optical beamforming, the beam is focused on each target device at different times. This technique allows transmission signal at full potential, but the data rate decreases with the number of users.
Apparently, the use of optical beamforming techniques using SLM can significantly enhance communication performance. This can improve the quality of the received signal, but SLM devices are quite expensive, which is a limitation in terms of cost.
From the literatures, most of the traditional indoor VLC system transmit only one dataset through the LED beam per user at a time. As a result, the number of users per unit of time (throughput) is low. Therefore, this paper proposes the design of an indoor VLC system using switched-beam technique through MATLAB programing. The LED lamps are designed to be arranged in a circular array. The signal can be transmitted through the beam of each LED lamp with the method of separating the dataset to increase the number of simultaneous users enhancing the indoor VLC as shown in Fig 2. Fig. 2a shows a traditional indoor VLC system and Fig. 2b shows the proposed design. The coverage area is determined from the area where communication can be performed at a location on the receiving plane with a Bit Error Rate less than or equal to 10−3 based on coverage illuminance that must cover greater than or equal to 300 lux according to International Commission on Illumination (CIE) standards.
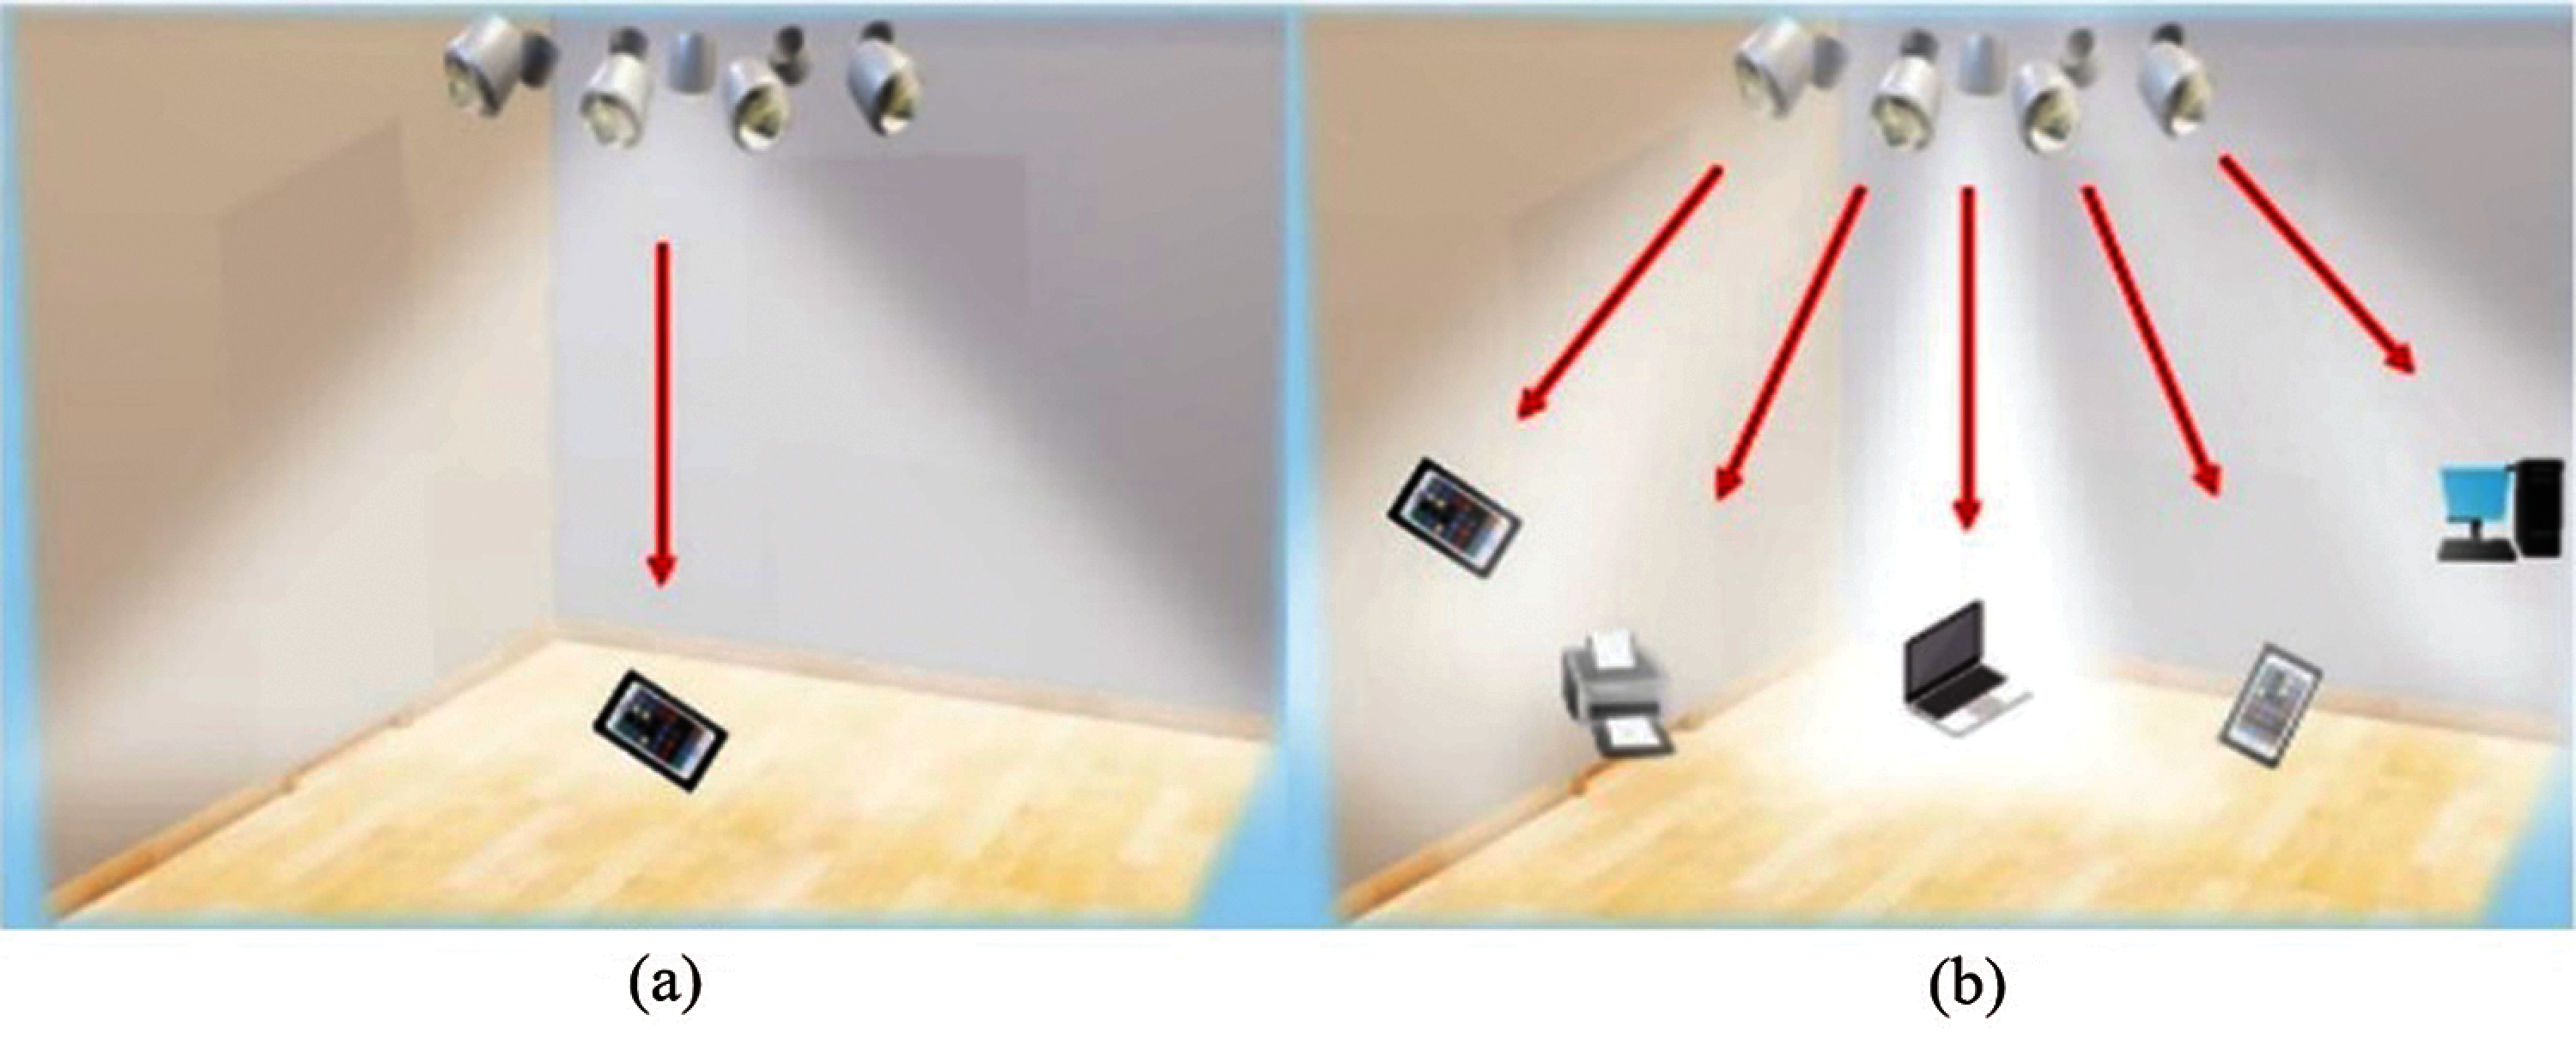
Figure 2: The proposed design of an indoor VLC system using switched-beams. (a) The traditional indoor VLC system transmits only one dataset; (b) The proposed design separates dataset to increase the number of simultaneous users
The most popular method to optimize the uniform illuminance distribution in VLC system is based on specific location orientation of LED or the power allocation [16,17]. In these conventional optimizations, some parameter values are selected for calculation. It can be inferred that optimization will have better performance when all parameter values in the possible data range are selected. In order to find the optimal values in the large search space, intelligent optimization algorithms, such as convex optimization algorithm, evolutionary algorithm and fish swarm algorithm are preferred to reduce the computational process [18–20].
The calculation in this paper is considerably complex because the system has multiobjective optimization adjusting the designing parameters depending on both coverage area and condition of coverage illuminance. Therefore, heuristic optimization technique is applied to reduce complex calculation for finding the optimal path. Two types of optimization techniques are proposed; exhaustive search method and heuristic method. The exhaustive search examines every search point within the search space in order to get accurate optimal results but it takes a long time to calculate. So far, Genetic Algorithm is the most popular heuristic method. It is adopted to find the suitable solution for designing parameters to achieve maximum coverage area as it can effectively solve problems in large and complex data sets. Also, it can be used in VLC optimization problem [21–24]. The performance of Genetic Algorithm is analyzed comparing to the results obtained from an exhaustive search.
The remainder of this paper is as follows. Firstly, the section of materials and methods discusses an array LED design, a proposed algorithm, and the simulation setup. The following section is results and discussion. Finally, the conclusion is given.
In this subsection, the calculation of the horizontal illuminance, the received optical power of directed light, Signal to Interference plus Noise Ratio (SINR), Bit Error Rate (BER), and the proposed LED-array design are discussed.
The horizontal illuminance: The illuminance expresses the distribution of an illuminated surface. A horizontal illuminance
where
where
where
The received optical power: In this paper, the only effect of directed light is considered, excluding the reflective light by walls. The received optical power
where
where A is the physical area of photodiode, m is the order of Lambertian,
where n is the refractive index.
Signal to Interference Plus Noise Ratio: We design an array of LEDs to transmit different data for increasing the number of simultaneous users who can access the system at the same time. It results in interference among LED beams. The SINR can be calculated as [26,27]:
where R is the photodiode responsivity,
where
where
where
Finally, The Bit Error Rate: BER can be calculated as [27]:
where
The function
The accurate BER performance for wireless optical communication and indoor VLC system requires a BER of 10−3 [28]. In this paper, we consider the coverage area by determining from the area where communication can be performed at BER less than or equal to 10−3.
LED-Array design: In the design of the LED installation, it is necessary to consider for the sufficient illumination, which must have the illuminance at least 300--2000 lux according to CIE [29]. Typically, single LED installation is not popular because of insufficient illumination according to the CIE standard. Therefore, multiple LEDs must be installed in an array arrangement. This paper proposes the design of an indoor VLC system using switched-beam technique through MATLAB programing by designing the circular array LED arrangements with white LEDs. One LED in the center of the room is surrounded by remaining LEDs that tilt out from the center. The signal can be transmitted through the beam of each LED lamp with the method of separating the dataset to increase the number of users who can simultaneously access the system for enhancing the indoor VLC.
The center LED: One LED is designed to be placed in the center of the area, as shown in Fig. 3a. The angle of irradiance can be calculated as:
where
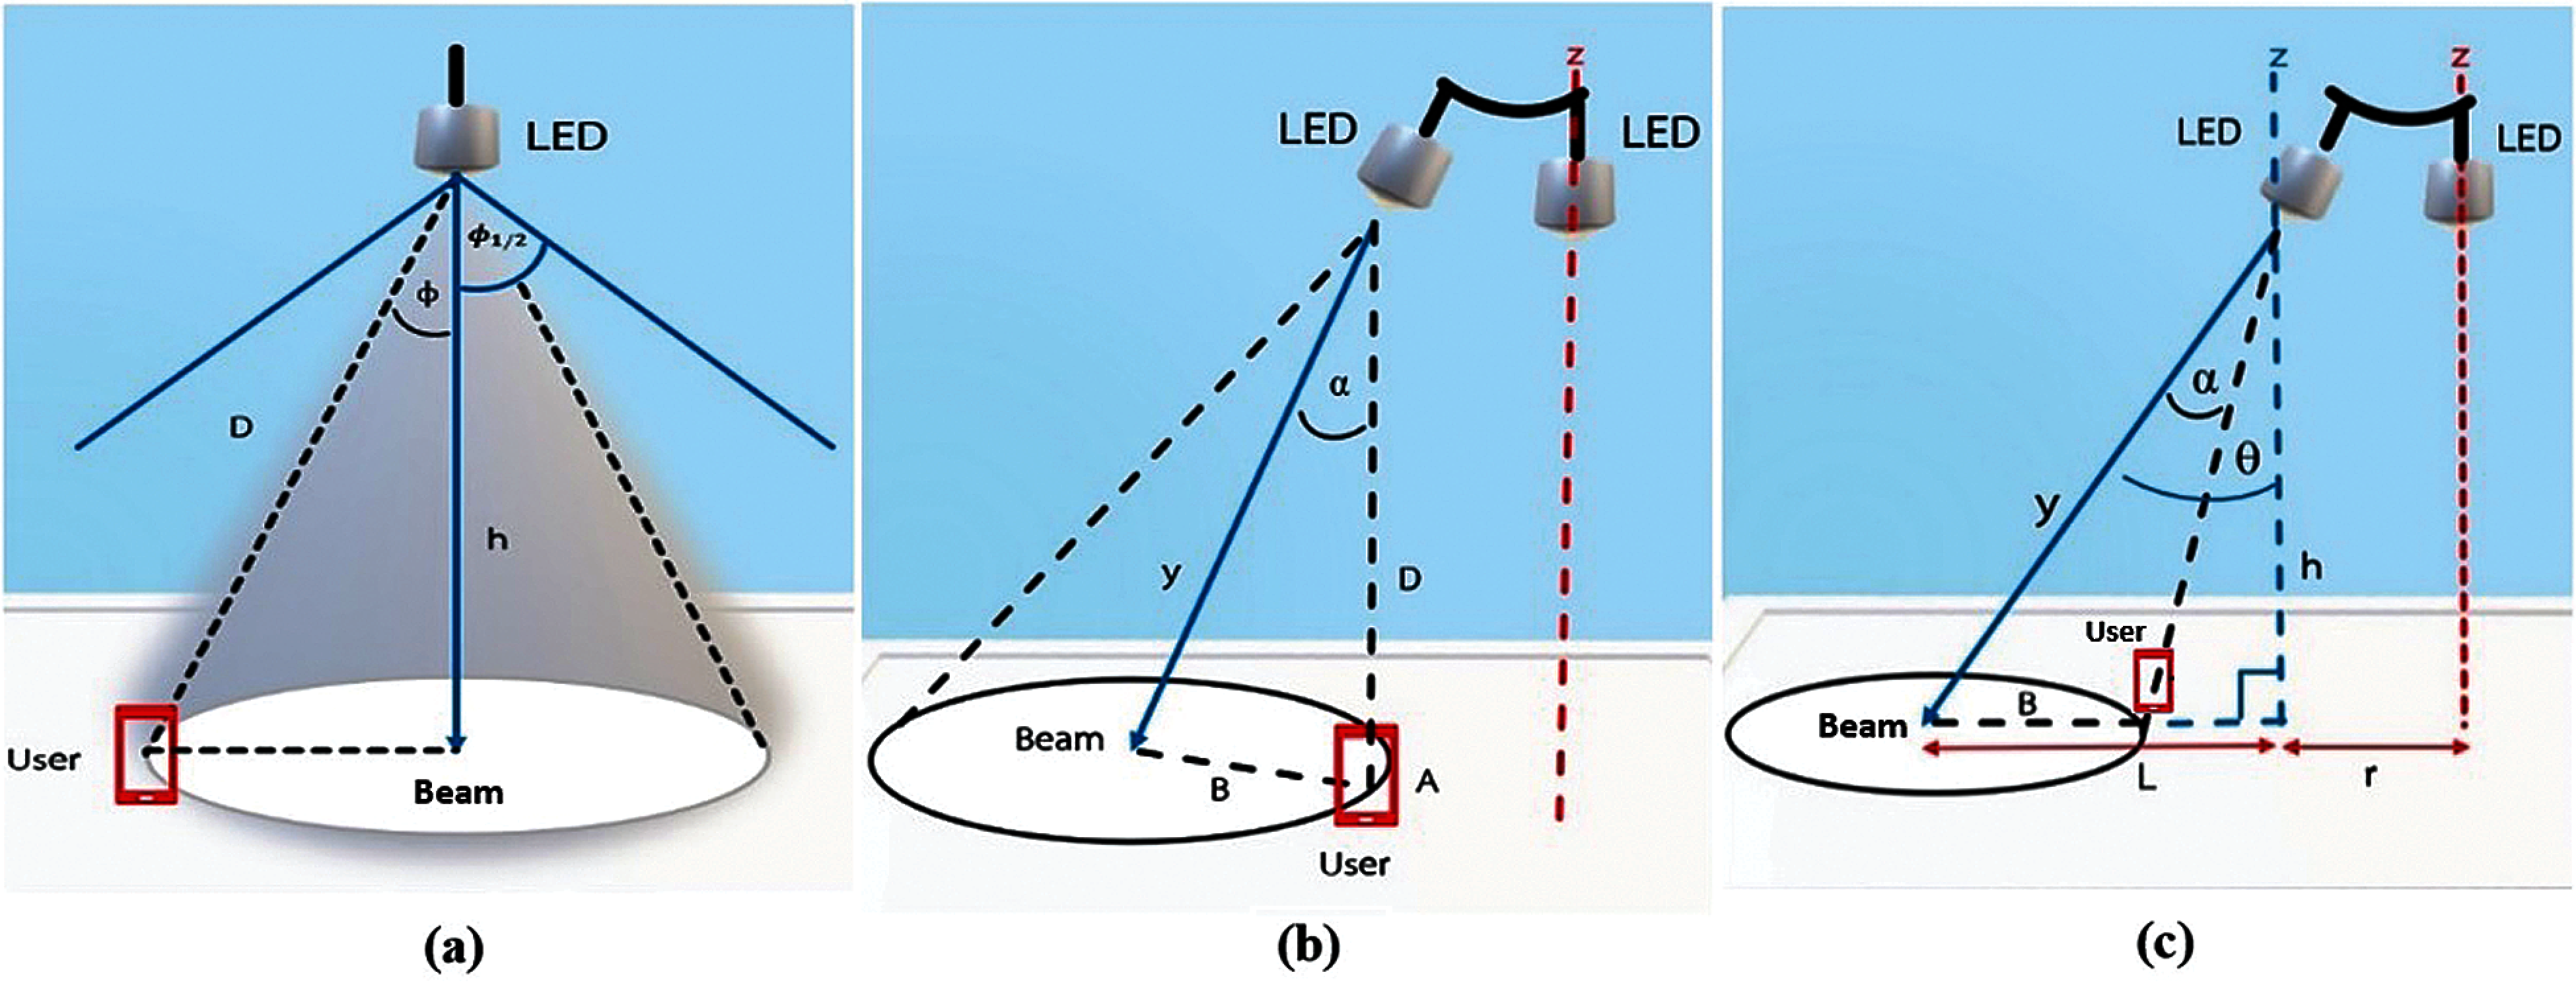
Figure 3: An LED-array design. (a) The design of center LED; (b) The design of surrounding LED I; (c) The design of surrounding LED II
The surrounding LED: The remaining LEDs are designed to be tilted out from the center LED and arranged in a circular LED array. As a result, the angle of irradiance is changed as shown in Fig. 3b. The new angle of irradiance can be calculated as:
where
The beam coordinate is the coordinate in which the center beam of the LED falls on the receiving plane, as shown in Fig. 3c. This can be calculated as:
where r is the radius of circular array LED, and L is the distance between the beam coordinate and the coordinate on the receiving plane, which is perpendicular to the LED. This can be calculated as:
where
Fig. 3a shows a design of center LED, Fig. 3b shows a design of surrounding LED I, and Fig. 3c shows a design of surrounding LED II.
After designing the LED array, it is necessary to find the solution of designing parameters to achieve maximum possible communication area, also known as maximum coverage area. This paper adopts Genetic Algorithm to find the suitable solution for designing parameters with various simulation scenarios.
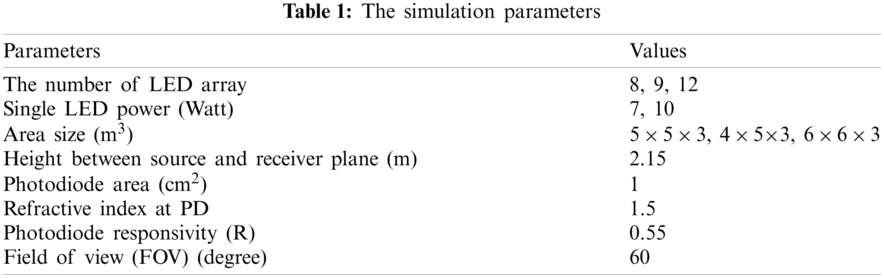
The simulation parameters in MATLAB programming are shown in Tab. 1. The height between source and receiver plane is approximately 2.15 m [12]. The area sizes are the commonly used standard size. A single LED is generally power used at 7 and 10 watts. As a result, the number of LEDs array should be used at 8, 9 and 12 LEDs for the sufficient illumination. Moreover, the designed parameters for the Genetic Algorithm to find the suitable solution are as follows: 1. z-angle is the inclination angle in which the surrounding LED are inclined from the center LED, 2. Semi-angle at half power is the angle of a diffusing lens covering an LED, and 3. Radius of LED array.
This paper adopts a Genetic Algorithm to find the suitable solution for designing parameters mentioned above of each simulation scenario to achieve maximum coverage area. This is determined from the area where communication can be performed at BER less than or equal to 10−3 based on coverage illuminance that must cover greater than or equal 300 lux according to CIE standards. Moreover, Genetic Algorithm performance is analyzed by comparing the results with an exhaustive search.
The exhaustive search is an algorithm that examines every search point inside the search region. However, a large amount of computation is required. As a result, the algorithm has low efficiency because of a very large search space [30]. Therefore, several fast algorithms have been proposed to save computation and enhance performance.
A Genetic Algorithm (GA) is a method for solving optimization problems based on a natural selection process that mimics biological evolution. GA was developed by John Holland and his assistant in 1975 [31]. The advantage of this algorithm is the tolerance of errors in finding answers from complex sources which is difficult to be modelled using mathematical equations. For this reason, GA has become one of the most widely used optimization algorithms [32,33].
2.2.3 Genetic Algorithm Design
The GA can be divided into five processes as follows: 1. Initiation 2. Fitness Function 3. Selection 4. Crossover and 5. Mutation. Fig. 4 starts from:
1. Initiation: The process begins with determining search space for the solution of designed parameters, which consists of
1. z-angle is the inclination angle in which the surrounding LEDs are inclined from the center LED. It is in the range of 1–70 degrees in the increments of 1 degree.
2. semi-angle at half power is the angle of a diffusing lens covering an LED. It is in the range of 10–90 degrees in the increments of 5 degrees.
3. radius of LED array. It is in the range of 0.1–1 meters in the increments of 0.1 meters.
The range of z-angle and radius of LED array are determined to be appropriate for the size of the room. It is considered that the LED beam can cover the entire area of the room. For semi-angle at half power range, the possible value of this angle is described in many scenarios [34–36]. Moreover, this angle can reach up to 90 degrees due to the limitation of LED.
Then, GA performs an individual element randomization which is called a population from the search space. Each individual element (chromosome) contains the solution of designed parameters (genes) as shown in Fig. 5.
2. Fitness Function: This process begins with determining the ability of an individual element to compete with other individual elements. Each individual element (chromosome) is randomized by GA which is substituted in the Fitness Function to find the coverage area based on coverage illuminance according to CIE standards.
3. Selection: This process begins with selecting the fittest individual elements and passing their genes to the next generation. Individual elements with high fitness have more chances to be selected for reproduction. This step selects the individual element with the maximum coverage area to match, and prepare for crossover by determining the heavy weight for an individual element with a large coverage area to increase the chances of finding a better coverage area. Then, two pairs of individual elements (parents) are randomized based on weight for crossover to find the next generation.
4. Crossover: When each pair of parents is matched, a crossover point is randomized within the Genes by determining the crossover point in point 1 or 2. For example, at crossover point 1, two offspring appeared by the exchange of their parent genes becomes the next generation. The population has a fixed size. When the new generations are formed, individual elements with the least fitness are eliminated, providing space for a new generation.
5. Mutation: Some of genes can be subjected to a mutation with a low random probability in certain new offspring. This increases the chances of finding new and better values by randomizing the chance of mutation at every gene. If any gene has a chance of mutation, the values in that range of parameters will be randomized again. Moreover, each new generation is better than the previous generation, as shown in Fig. 6.
The final process of GA brings a new generation back to Fitness Function for calculating the coverage area. Then, it checks if the maximum of duplicated coverage area is greater than or equal to five times. Also, if the accuracy is greater than or equal to 30%, the algorithm will terminate. The result is the suitable solution of designed parameters.
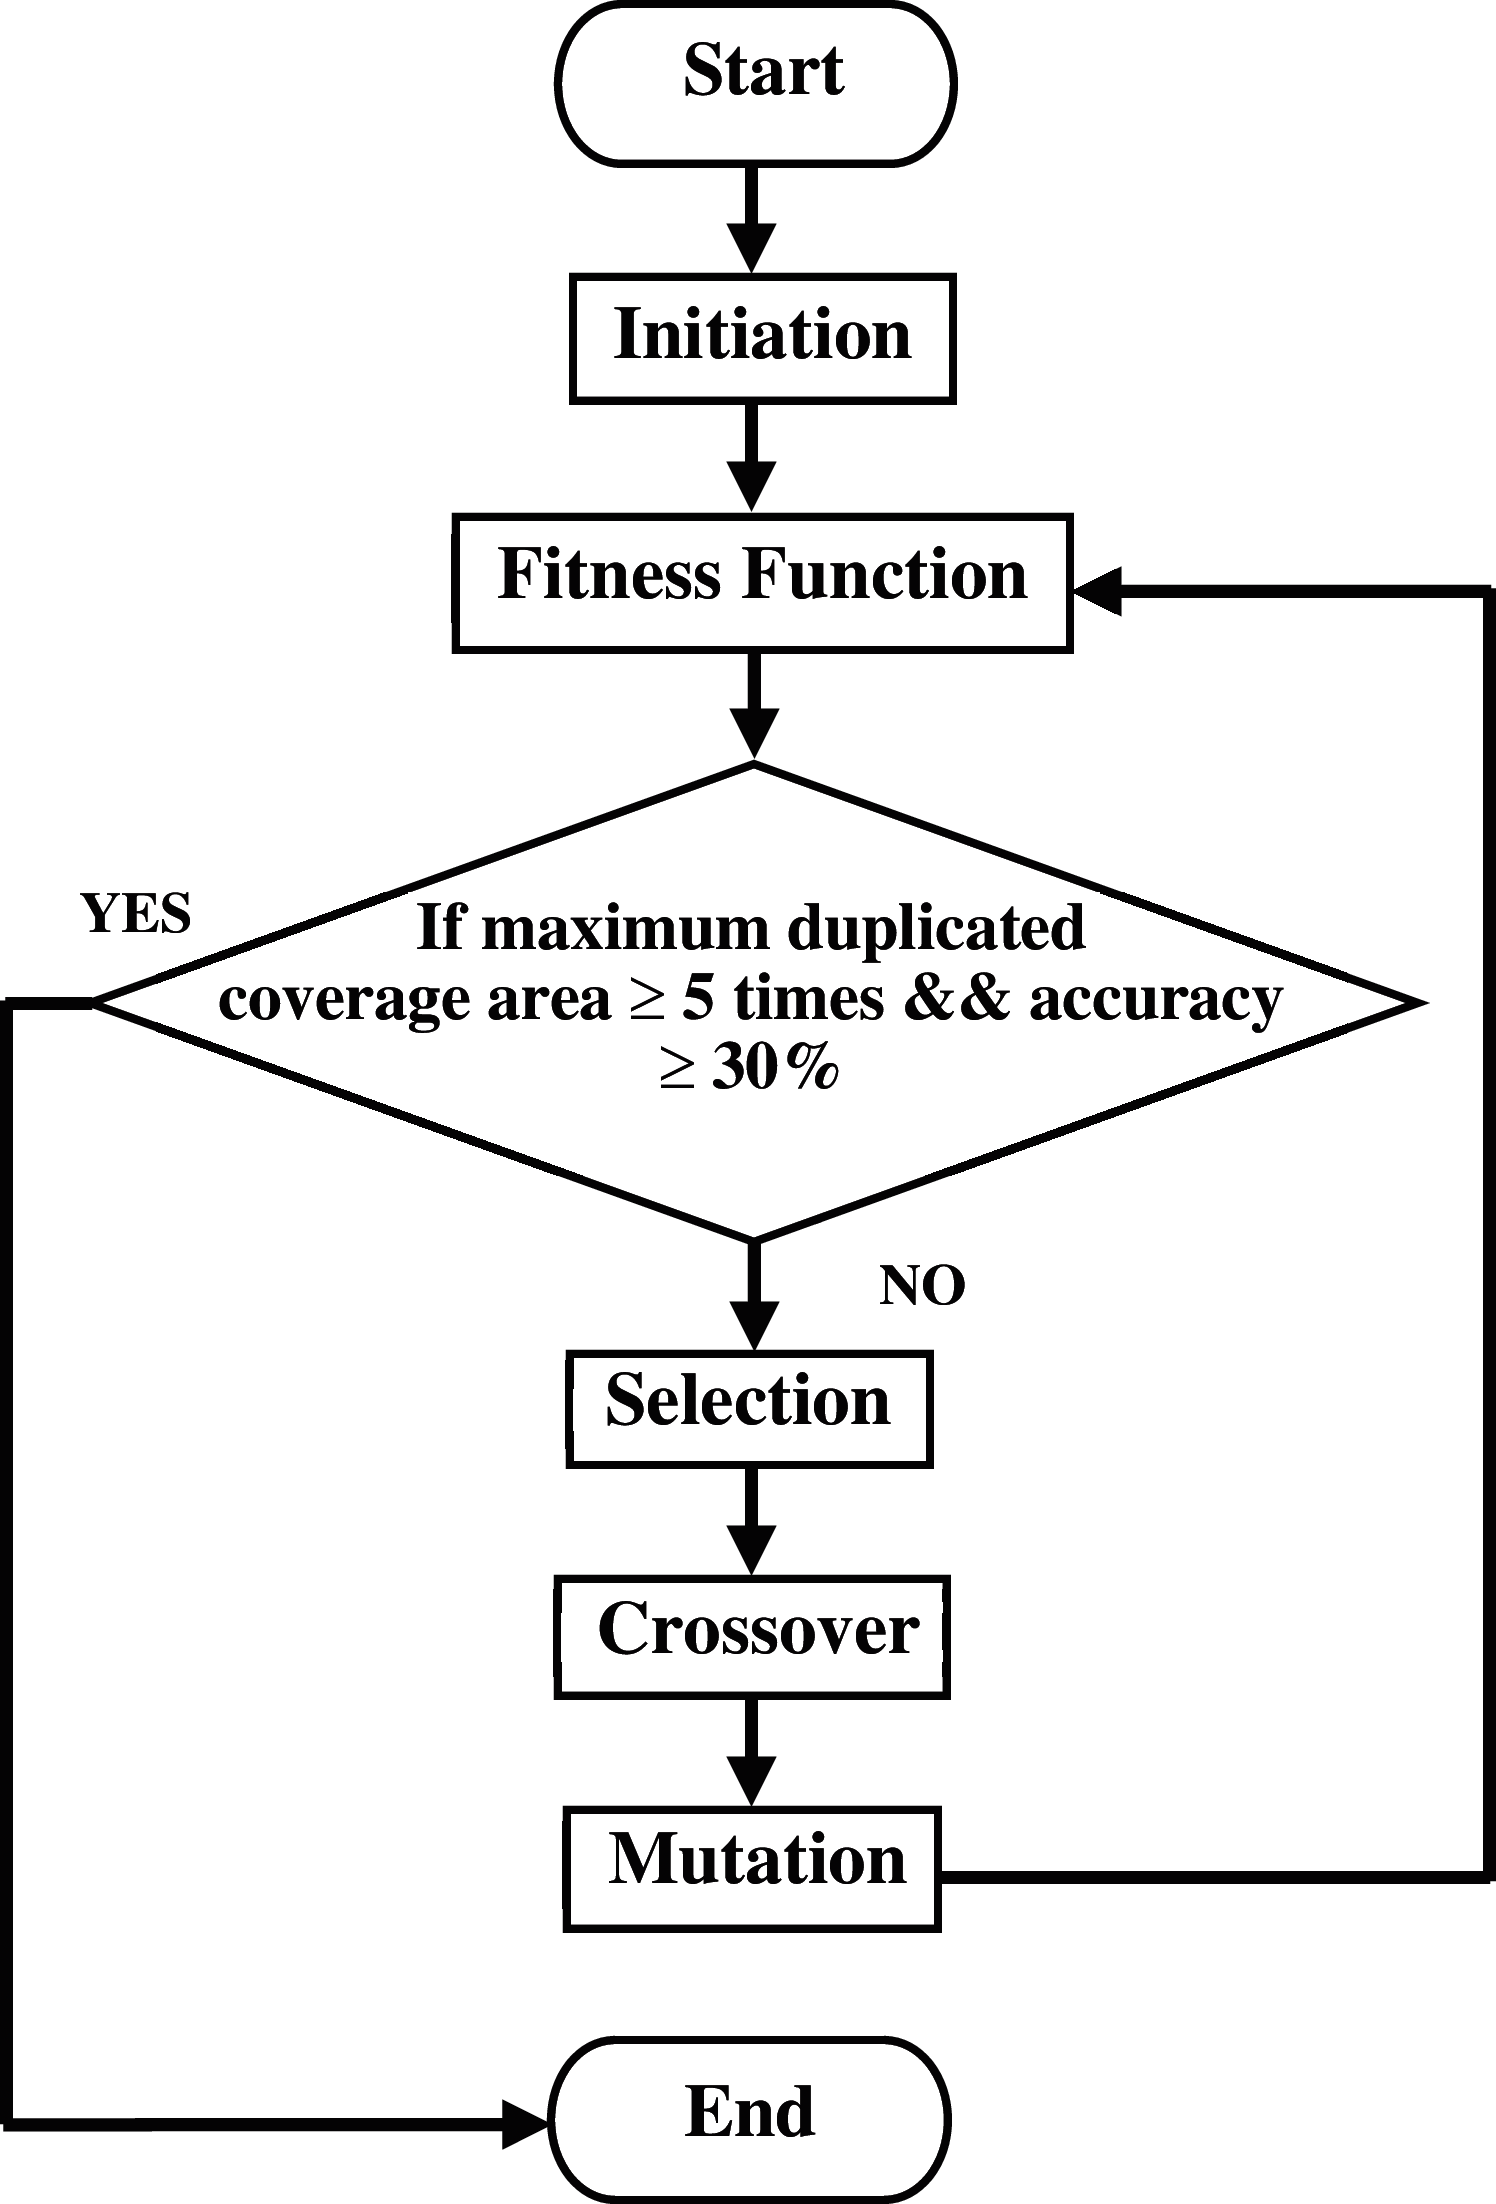
Figure 4: The flow chart of genetic algorithm processes
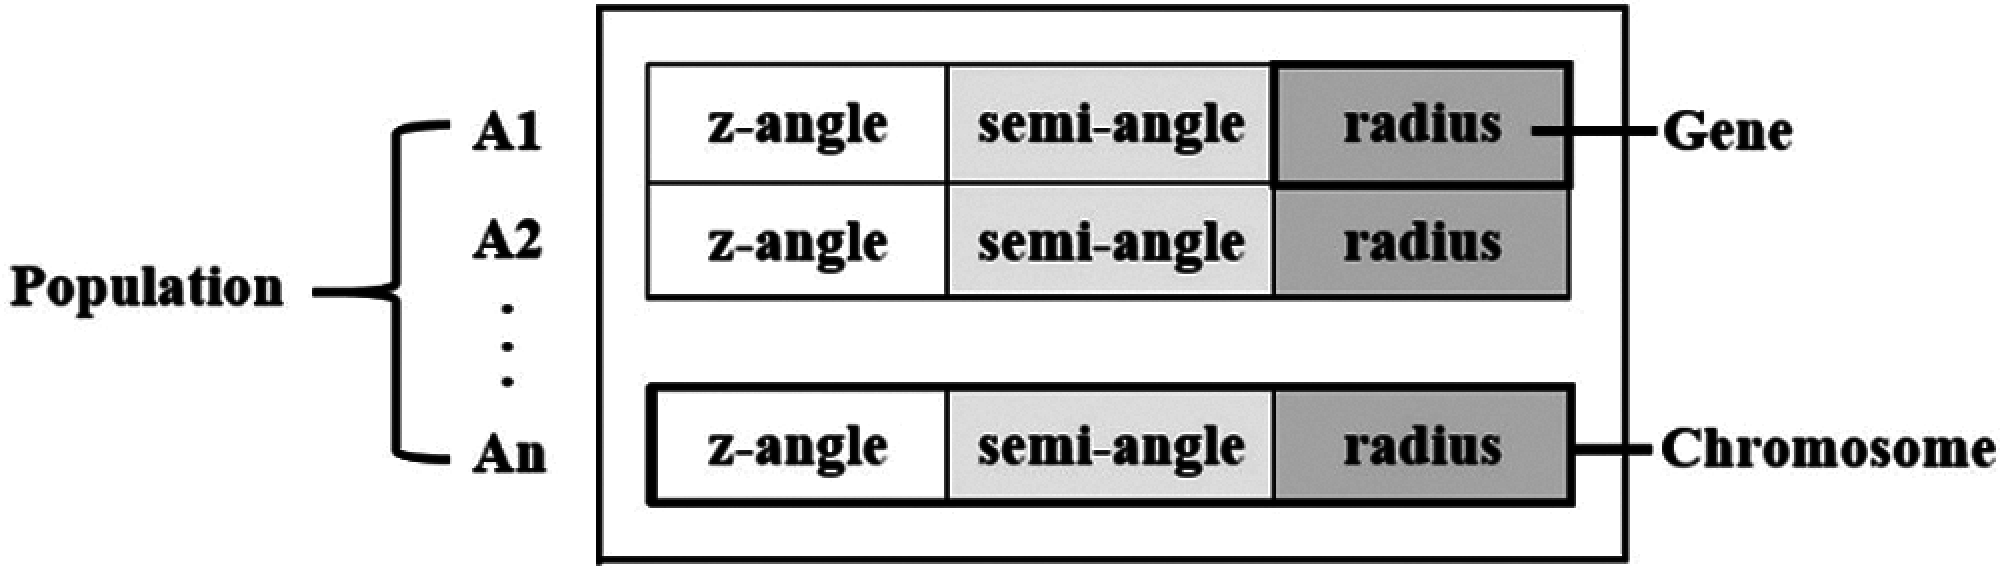
Figure 5: The initiation process of genetic algorithm design
The simulation is designed for four scenarios as shown in Tab. 2, where the commonly used standard area sizes, the number and power of the LEDs are different. The results are divided into two cases:
1. The results from the adopted Genetic Algorithm which is used to find the solution for designing parameters mentioned above to achieve maximum coverage area. This is determined from the area where communication can be performed with a BER less than or equal to 10−3 based on coverage illuminance which must cover greater than or equal to 300 lux according to CIE standards.
2. Comparison of the results between the Genetic Algorithm and an exhaustive search, which are used to find every search point inside the search space.
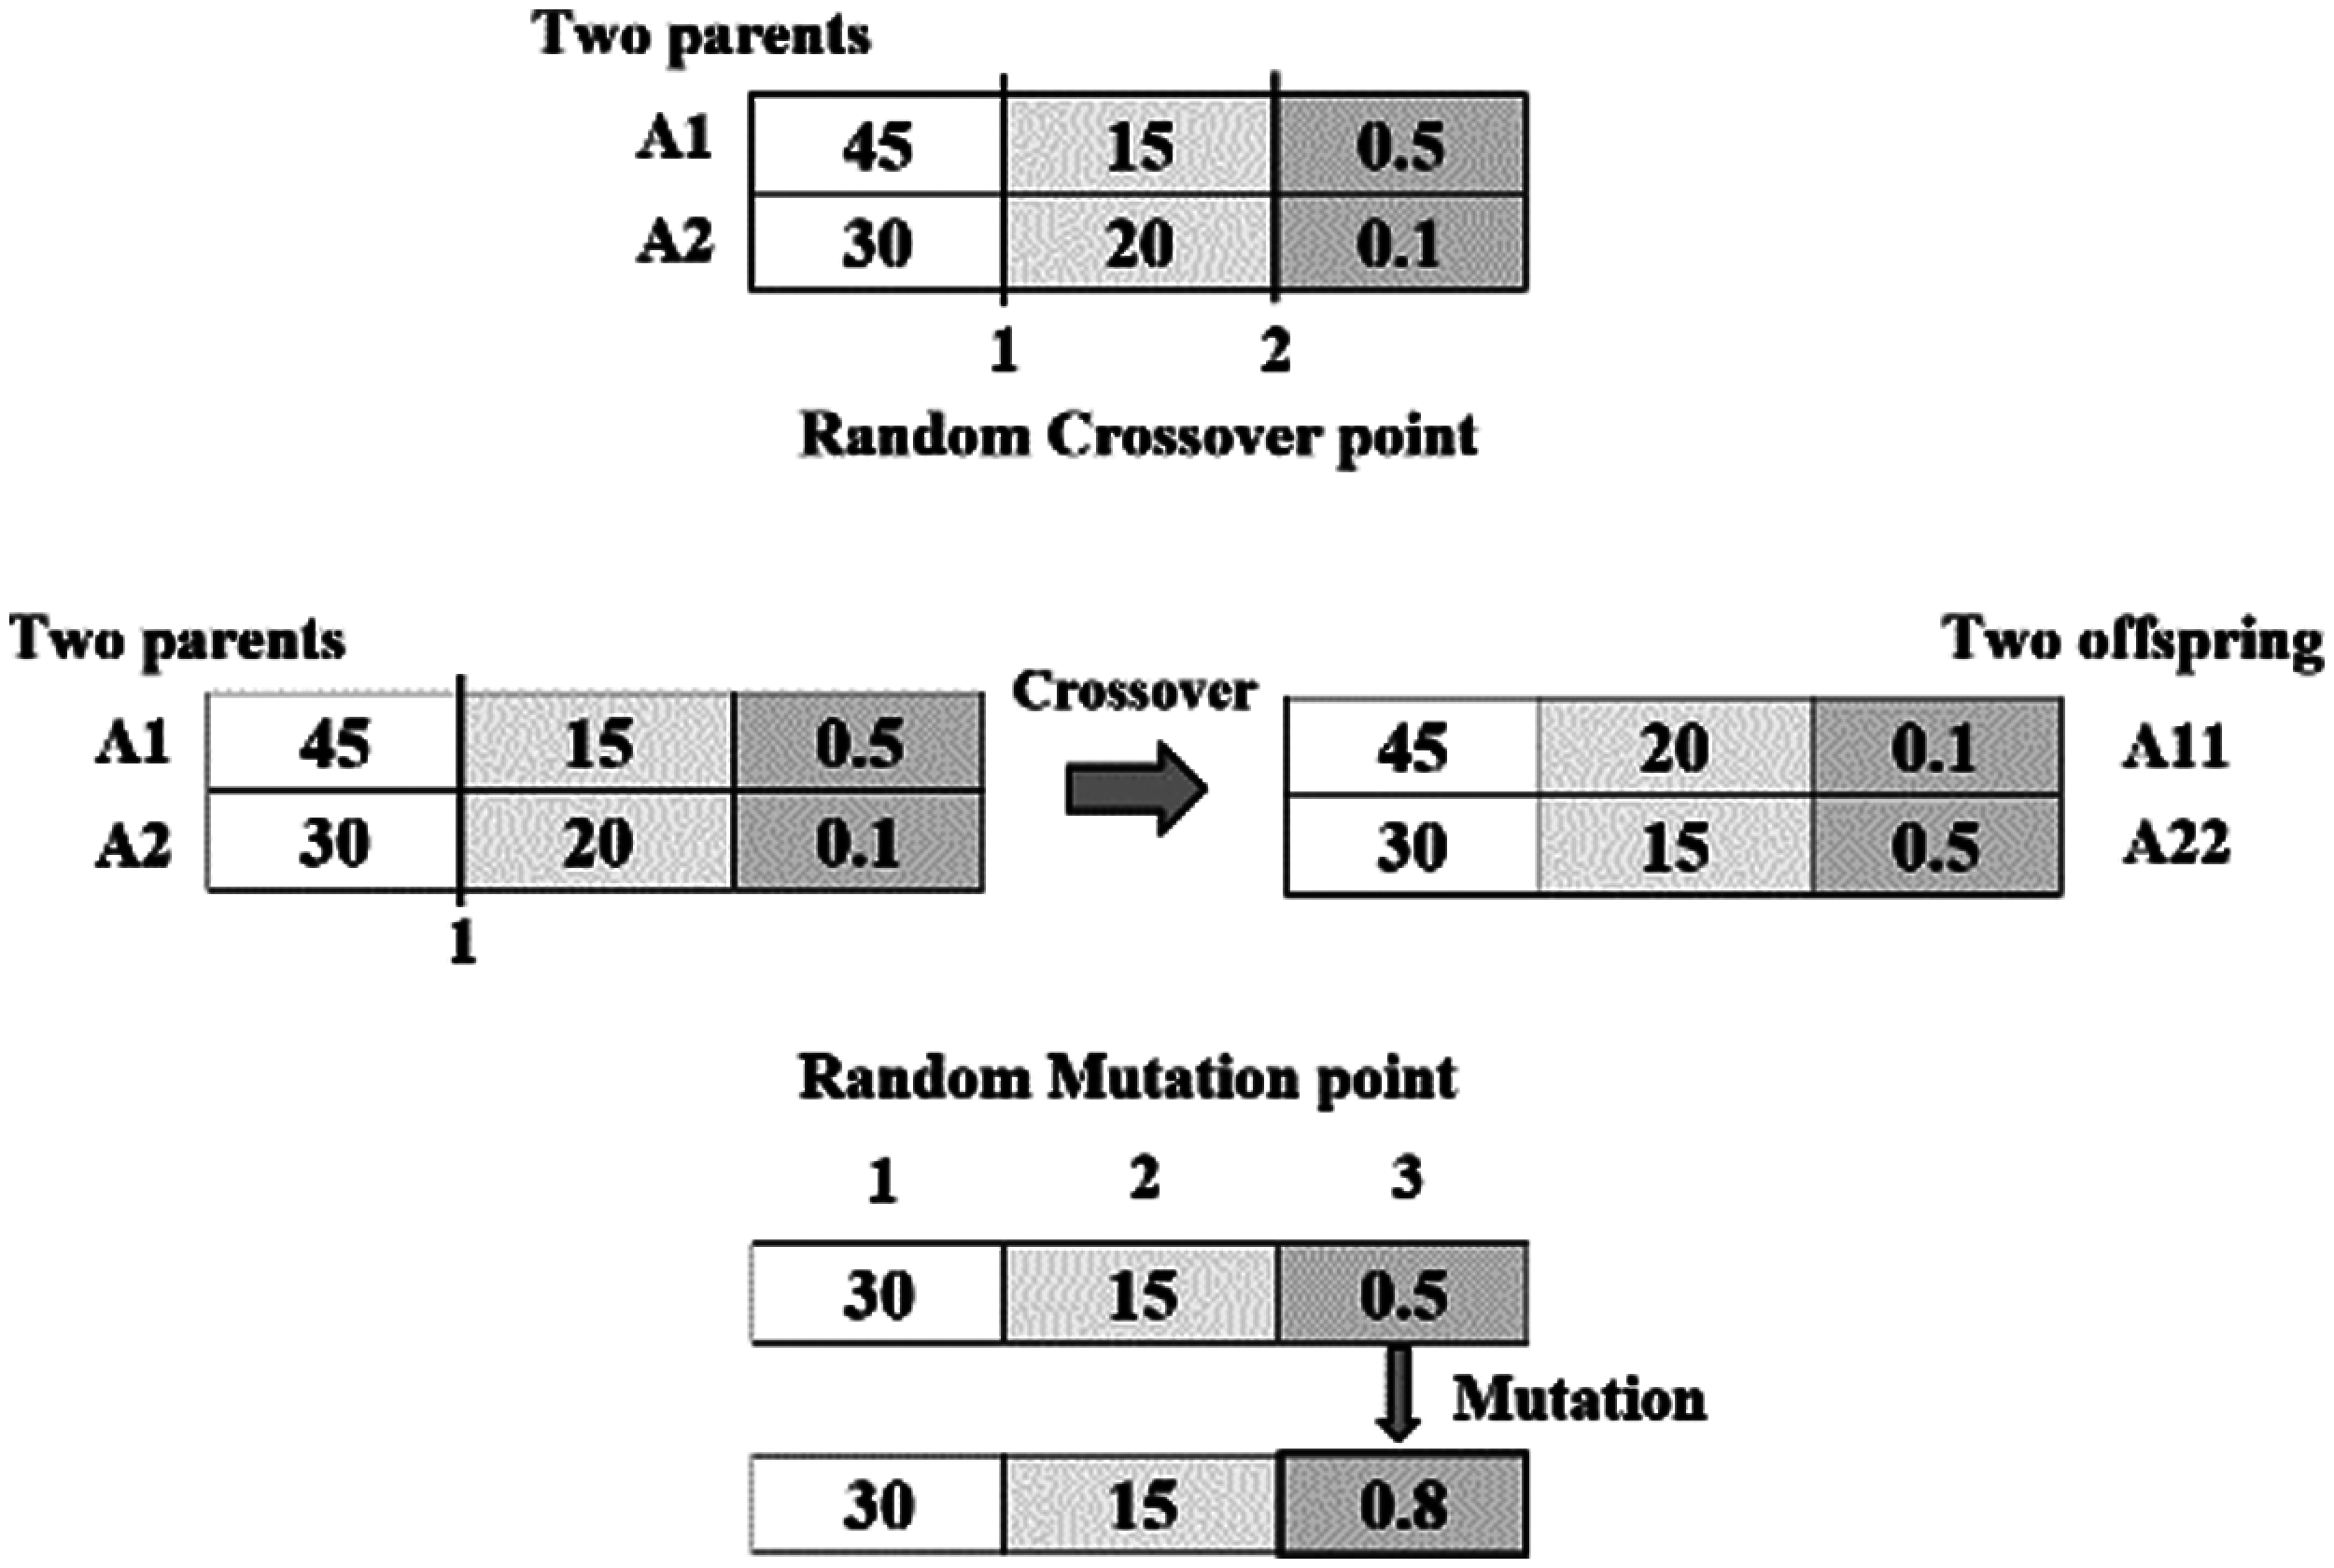
Figure 6: The crossover and mutation process of genetic algorithm design

In this subsection, we run a number of simulation using the Genetic Algorithm and select the best solution after five-time running for each scenario as follows:
3.1.1 Scenario 1: Area Size of 5 × 5 × 3 m3, 9 LEDs and 10 W per LED
Fig. 7 shows the Genetic Algorithm performance after eleven iterations. Fig. 7a shows the iteration of designed parameters. The suitable solutions of designed parameters are z-angle, semi-angle at half power, and radius which are equal to 35 degrees, 15 degrees, and 0.8 m, respectively. Also, Fig. 7b shows the maximum coverage area which is equal to 83.922%.
3.1.2 Scenario 2: Area Size of 5 × 5 × 3 m3, 12 LEDs and 7 W per LED
Fig. 8 shows the Genetic Algorithm performance after ten iterations. Fig. 8a shows the iteration of designed parameters. The suitable solutions of designed parameters are z-angle, semi-angle at half power, and radius which are equal to 32 degrees, 15 degrees, and 1 m respectively. Also, Fig. 8b shows the maximum coverage area which is equal to 73.622%.
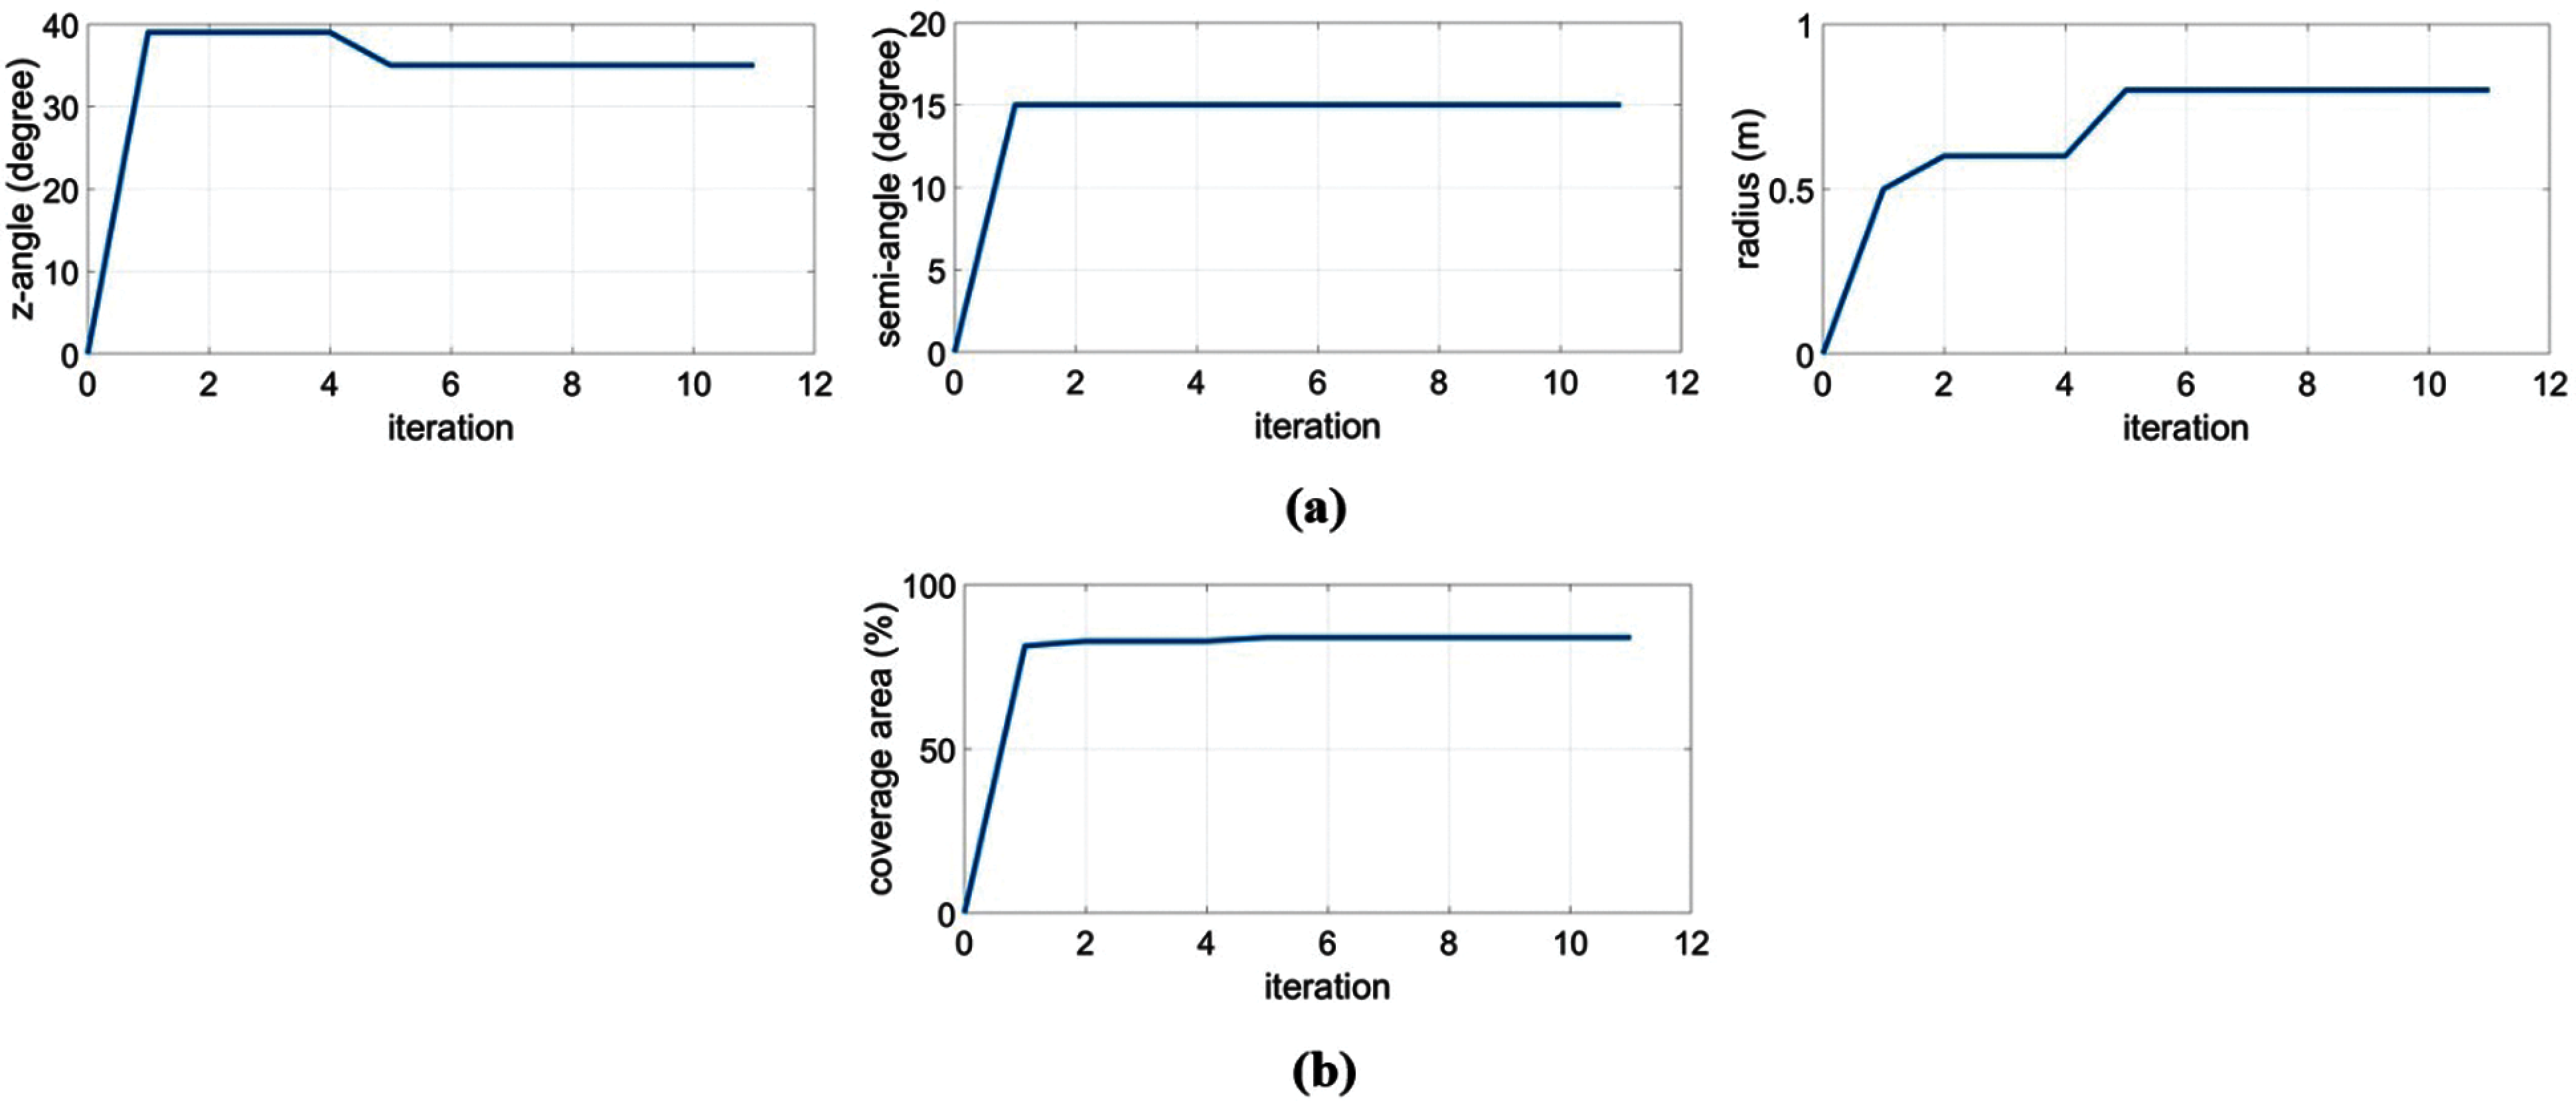
Figure 7: Genetic Algorithm Performance of scenario 1. (a) The iteration of designed parameters is as follows z-angle = 35 degrees, semi-angle at half power 15 degrees and radius = 0.8 m. (b) The maximum coverage area = 83.922%
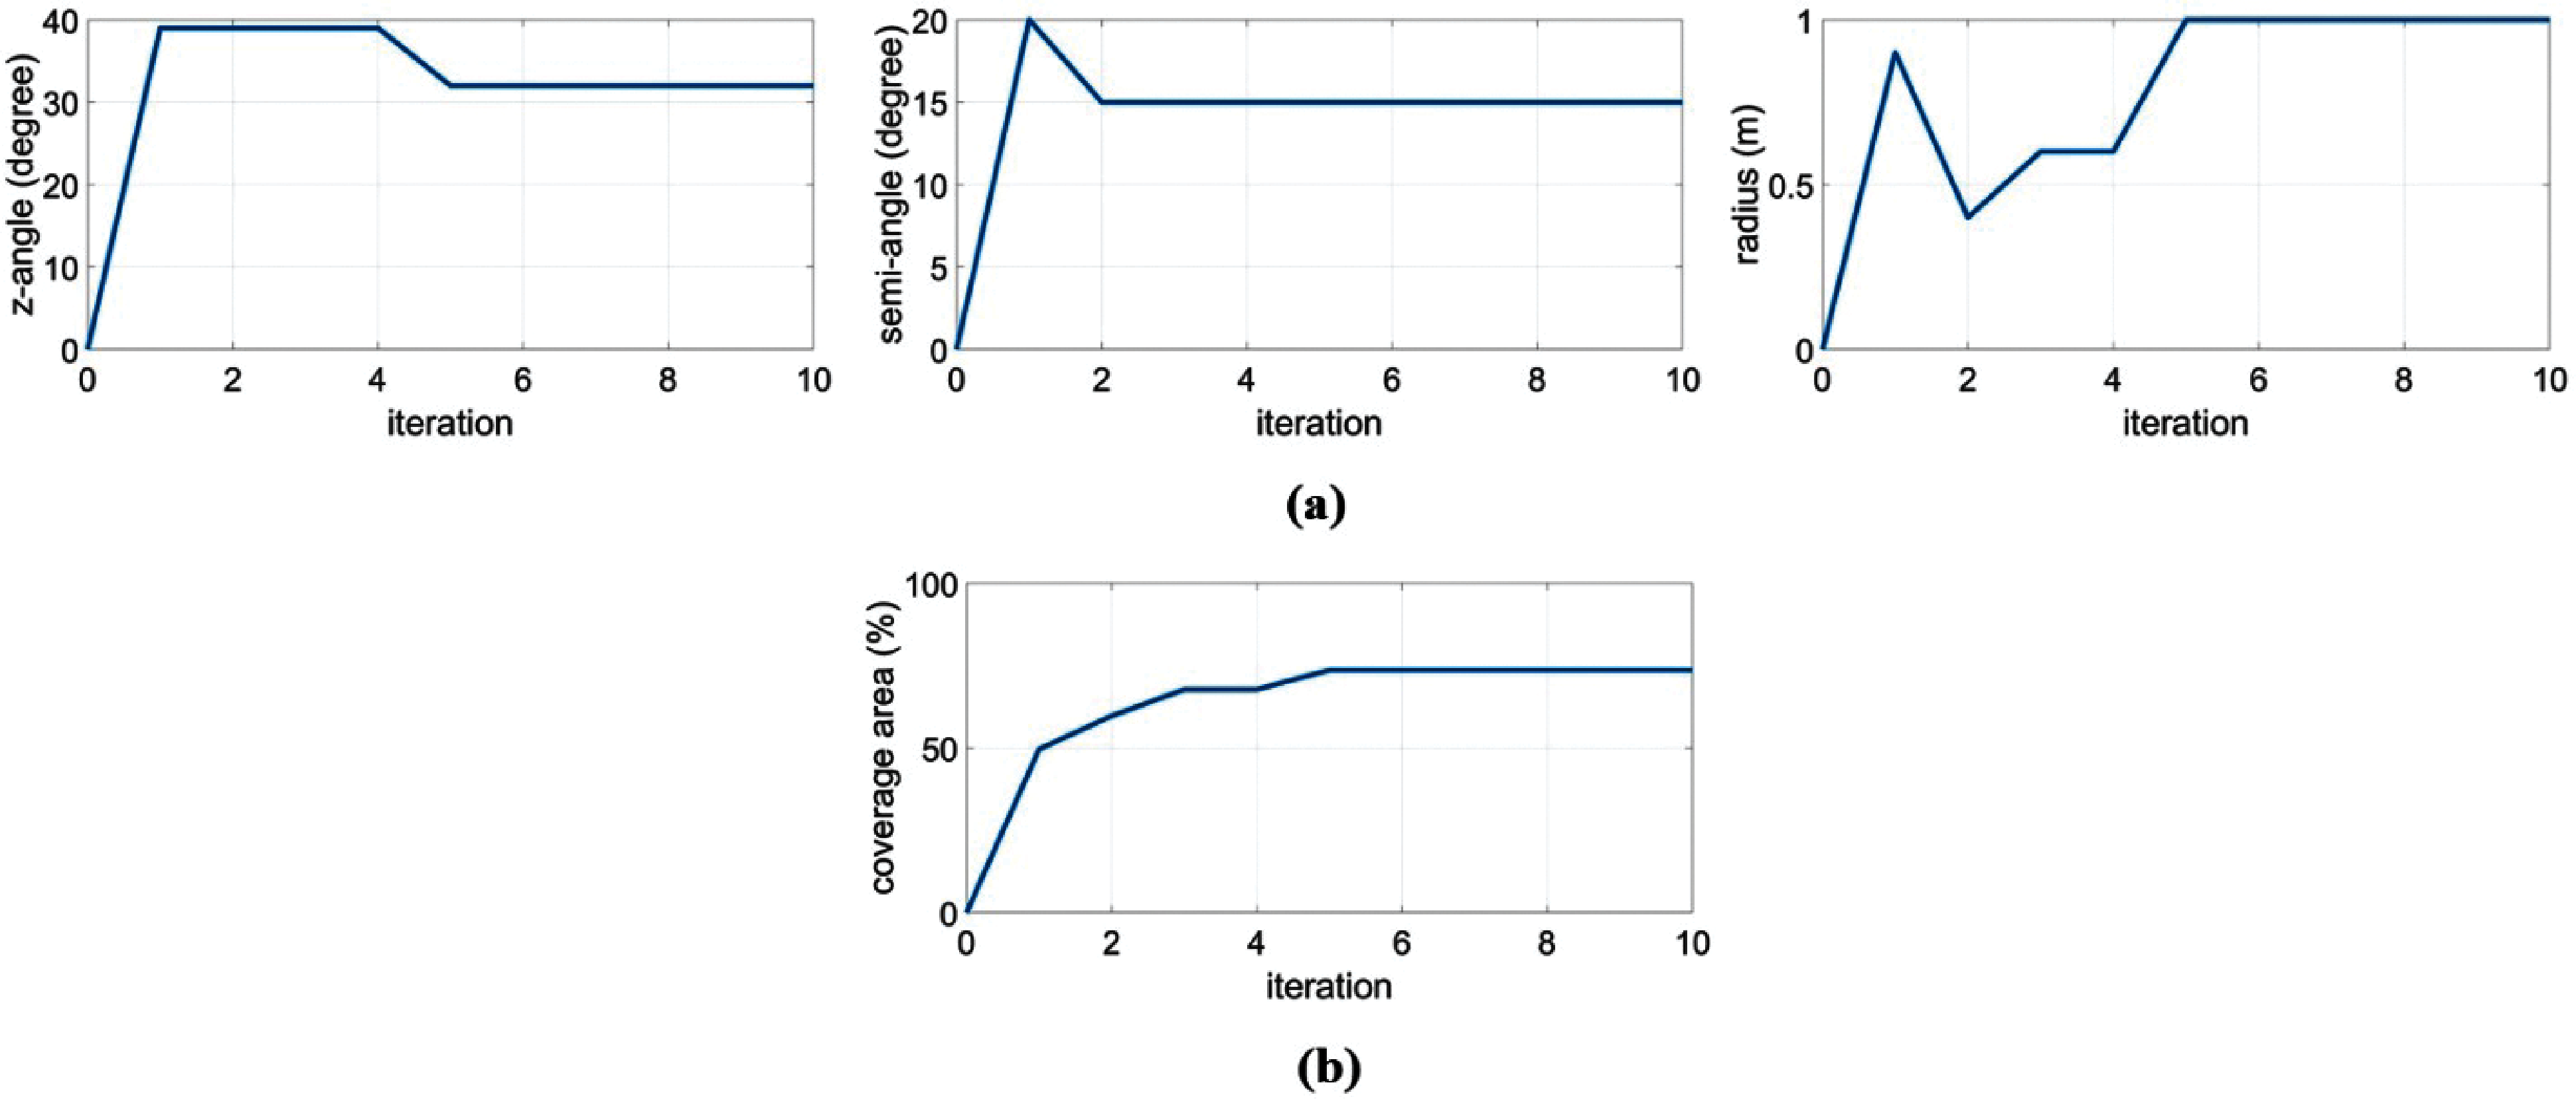
Figure 8: Genetic Algorithm Performance of scenario 2. (a) The iteration of designed parameters is as follows z-angle = 32 degrees, semi-angle at half power 15 degrees and radius = 1 m. (b) The maximum coverage area = 73.622%
3.1.3 Scenario 3: Area Size of 4 × 5 × 3 m3, 8 LEDs and 7 W per LED
Fig. 9 shows the Genetic Algorithm performance after eight iterations. Fig. 9a shows the iteration of designed parameters. The suitable solutions of designed parameters are z-angle, semi-angle at half power, and radius which are equal to 41 degrees, 20 degrees, and 1 m respectively. Also, Fig. 9b shows the maximum coverage area which is equal to 78.181%.
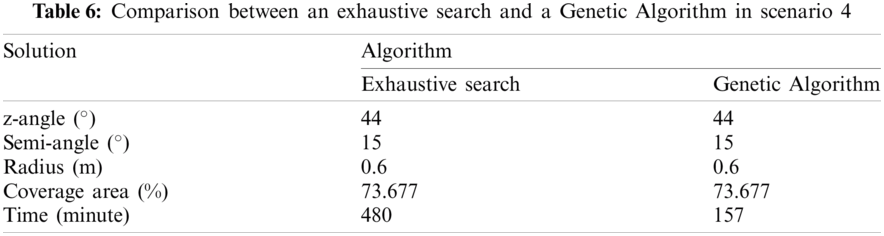
3.1.4 Scenario 4: Area Size of 6 × 6 × 3 m3, 12 LEDs and 10 W per LED
Fig. 10 shows the Genetic Algorithm performance after seven iterations. Fig. 10a shows the iteration of designed parameters. The suitable solutions of designed parameters are z-angle, semi-angle at half power, and radius which are equal to 44 degrees, 15 degrees, and 0.6 m respectively. Also, Fig. 10b shows the maximum coverage area which is equal to 73.677%.
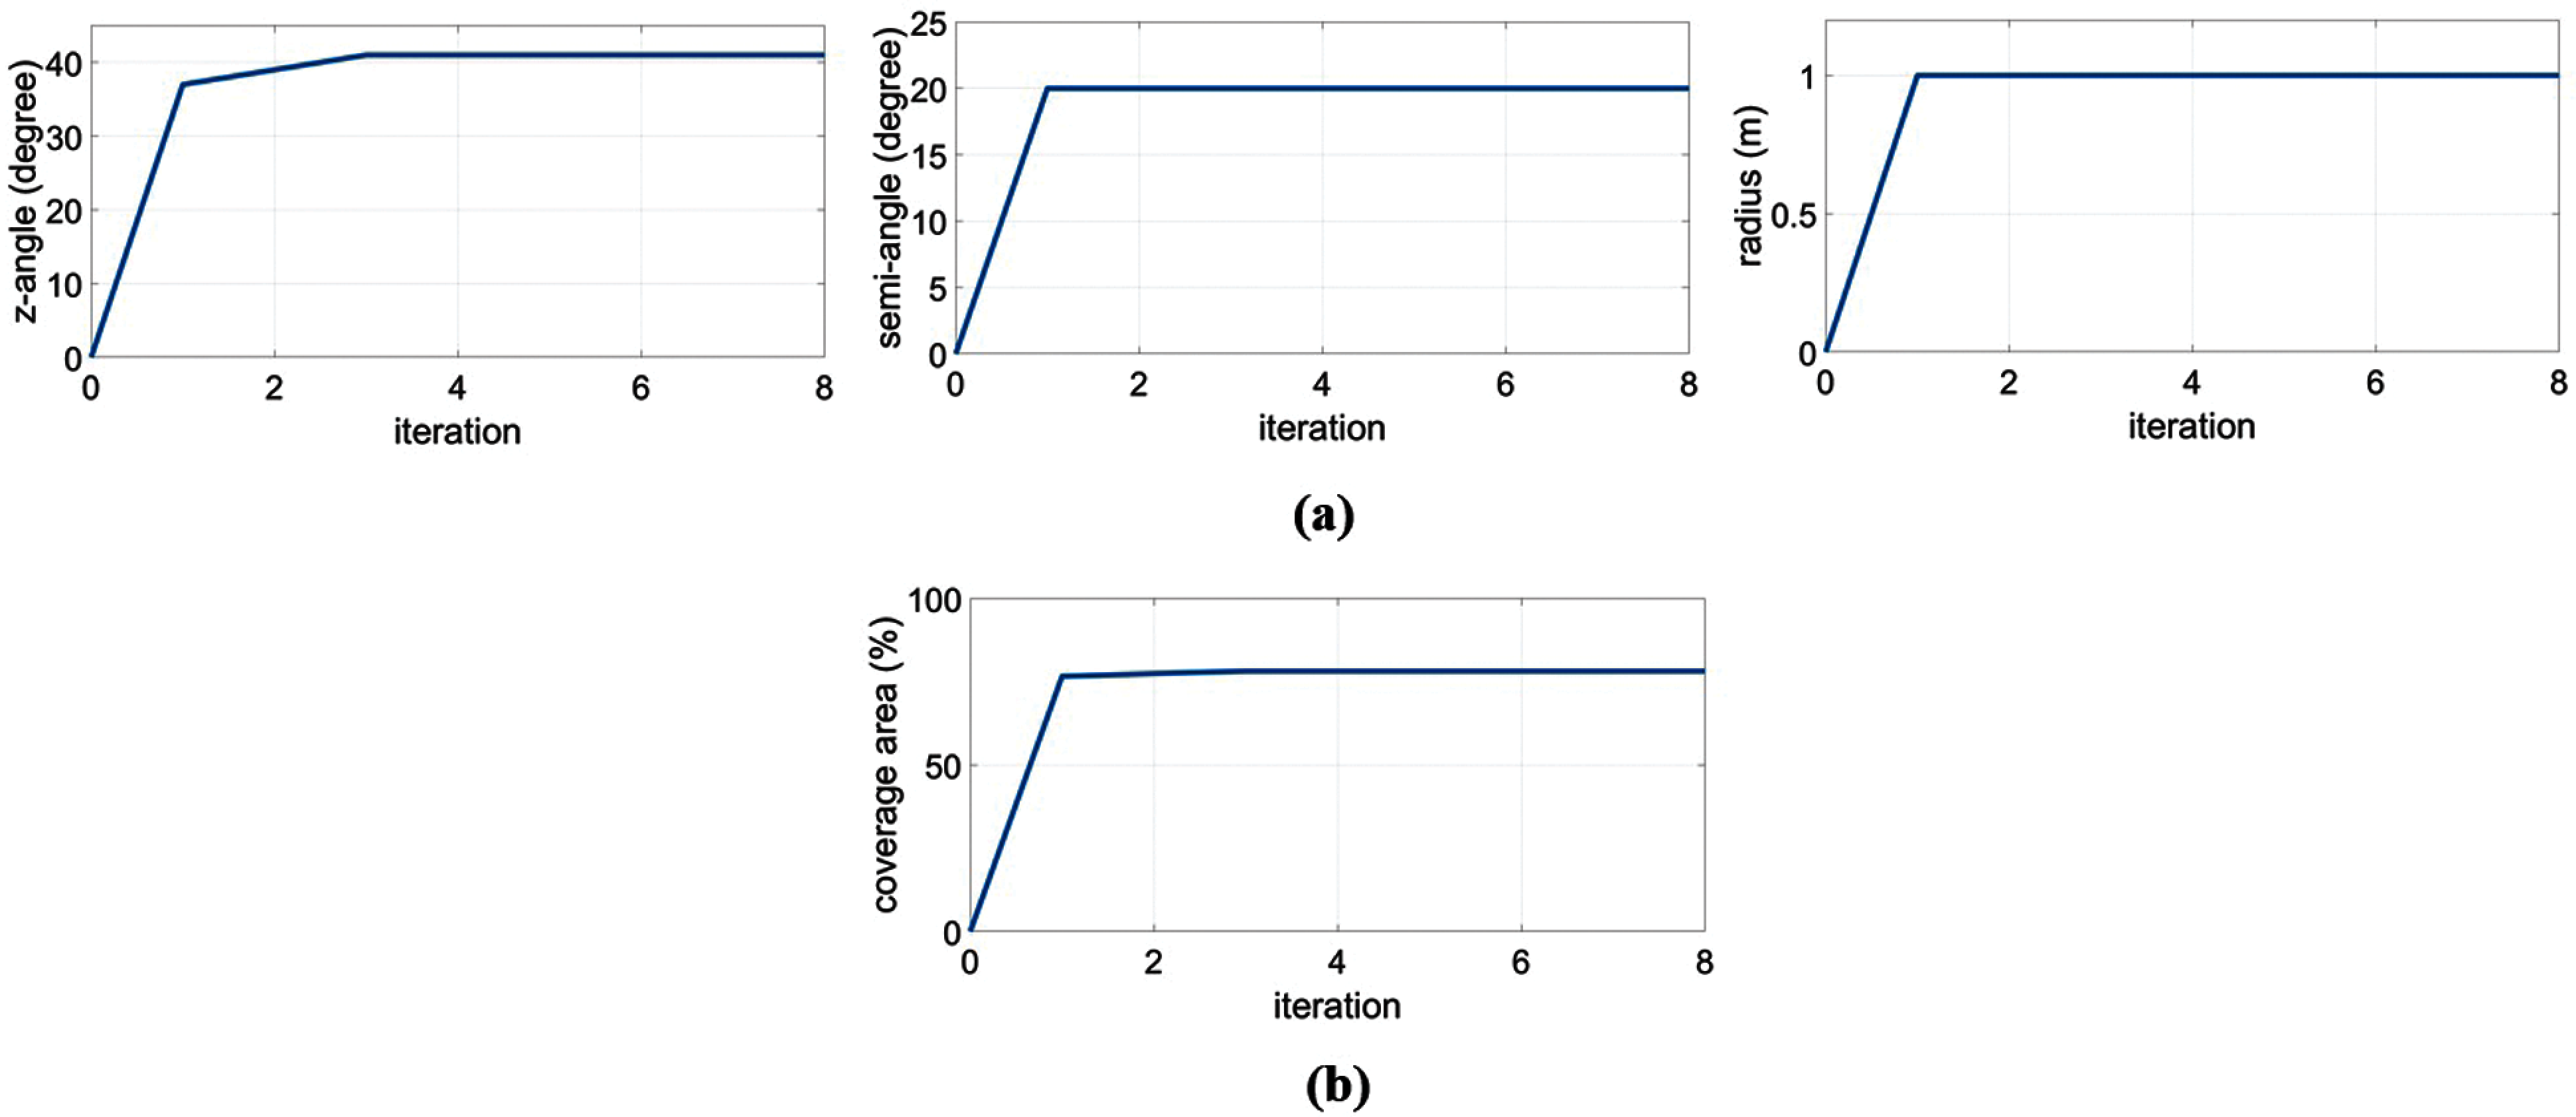
Figure 9: Genetic Algorithm Performance of scenario 3. (a) The iteration of designed parameters is as follows z-angle = 41 degrees, semi-angle at half power 20 degrees and radius = 1 m. (b) The maximum coverage area = 78.181%
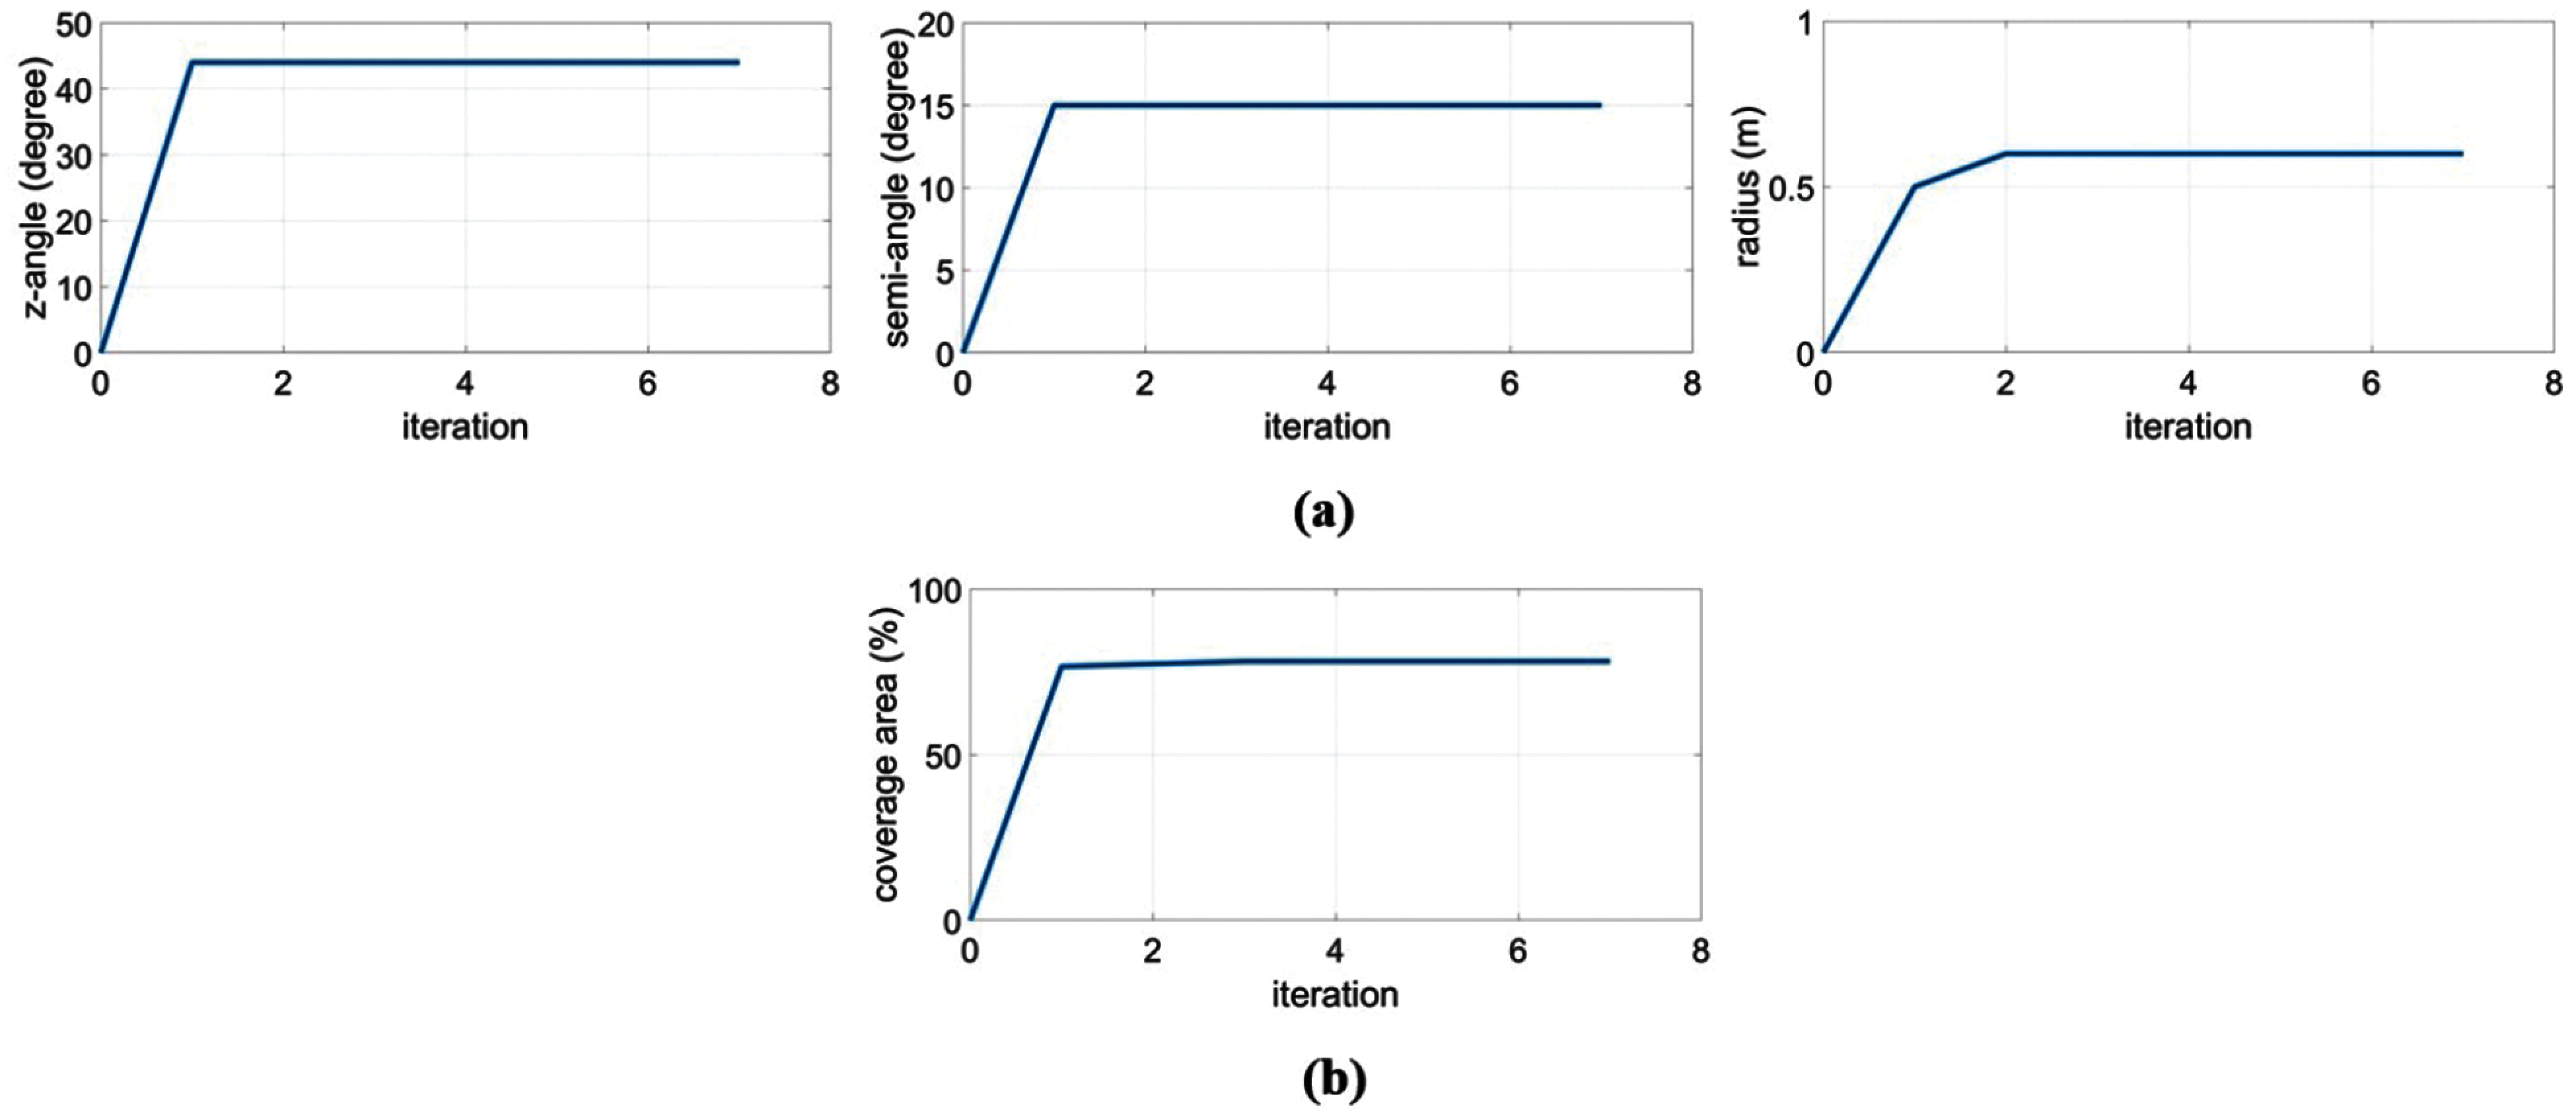
Figure 10: Genetic Algorithm Performance of scenario 4. (a) The iteration of designed parameters is as follows z-angle = 44 degrees, semi-angle at half power 15 degrees and radius = 0.6 m. (b) The maximum coverage area = 73.677%
From 4 scenarios, for GA cases, each parameter in the figure is adjusted because GA is trying to adapt itself to the suitable solution of designed parameters, which achieves the maximum coverage area. Also, we can see that ever-increasing coverage area is obtained in each iteration until reaching the highest value. So, GA can find a suitable solution of designed parameters to achieve maximum coverage area.
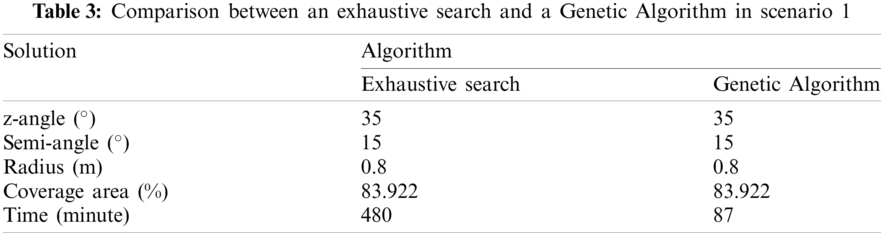
3.2 Comparison Between an Exhaustive Search and Genetic Algorithm
Tabs. 3–6 show the comparison between both algorithms, and they produce the same best results. The exhaustive search finds the solution from the search space. It takes up to 480 min to select a suitable solution which achieves the maximum coverage in each scenario, but the Genetic Algorithm finds the suitable solution by reducing the computational time which takes less time than an exhaustive search approximately 382 min in the proposed scenarios.


Also, both algorithms provide coverage illuminance equal to 100%, which has the distribution of illuminance greater than or equal to 300 lux according to the CIE standards in every scenario, as shown in Fig. 11.
Figs. 11a–11d show the distribution of illuminance for scenarios 1, 2, 3 and 4, respectively.
The coverage area is determined from the area where the communication can be performed on the receiving plane with a BER less than or equal to 10−3 as shown in Fig. 12. After using GA to find the suitable solution, the coverage area is equal to 83.922%, 73.622%, 78.181%, and 73.677% in which the system can support up to 9, 12, 8, and 12 simultaneous users, as shown in Figs. 12a–12drespectively. However, the interference among the light of LED beams is found in some areas, which is the position on the receiving plane with a BER greater than 10−3. As a result, users are unable to communicate in this interference area.
Figs. 12a–12d show the distribution of BER for scenarios 1, 2, 3 and 4, respectively.
Therefore, this paper proposes a method to increase the coverage area and reduce interference using the switched-beam technique. For example, Scenario 1 can support up to 9 simultaneous users, as shown in Fig. 13a. The position on the receiving plane with a BER greater than 10−3 is the interference area. If users want to communicate in the interference area. This can be solved by incorporating an LED beam from the closest LED beam to send data to users, as shown in Figs. 13b and 13c. Not only the switched-beam technique can provide performance enhancement of communication with an increased coverage area, but they also can effectively communicate in the interference area. However, this result indicates the loss of one user when combining the LED beams at a time.
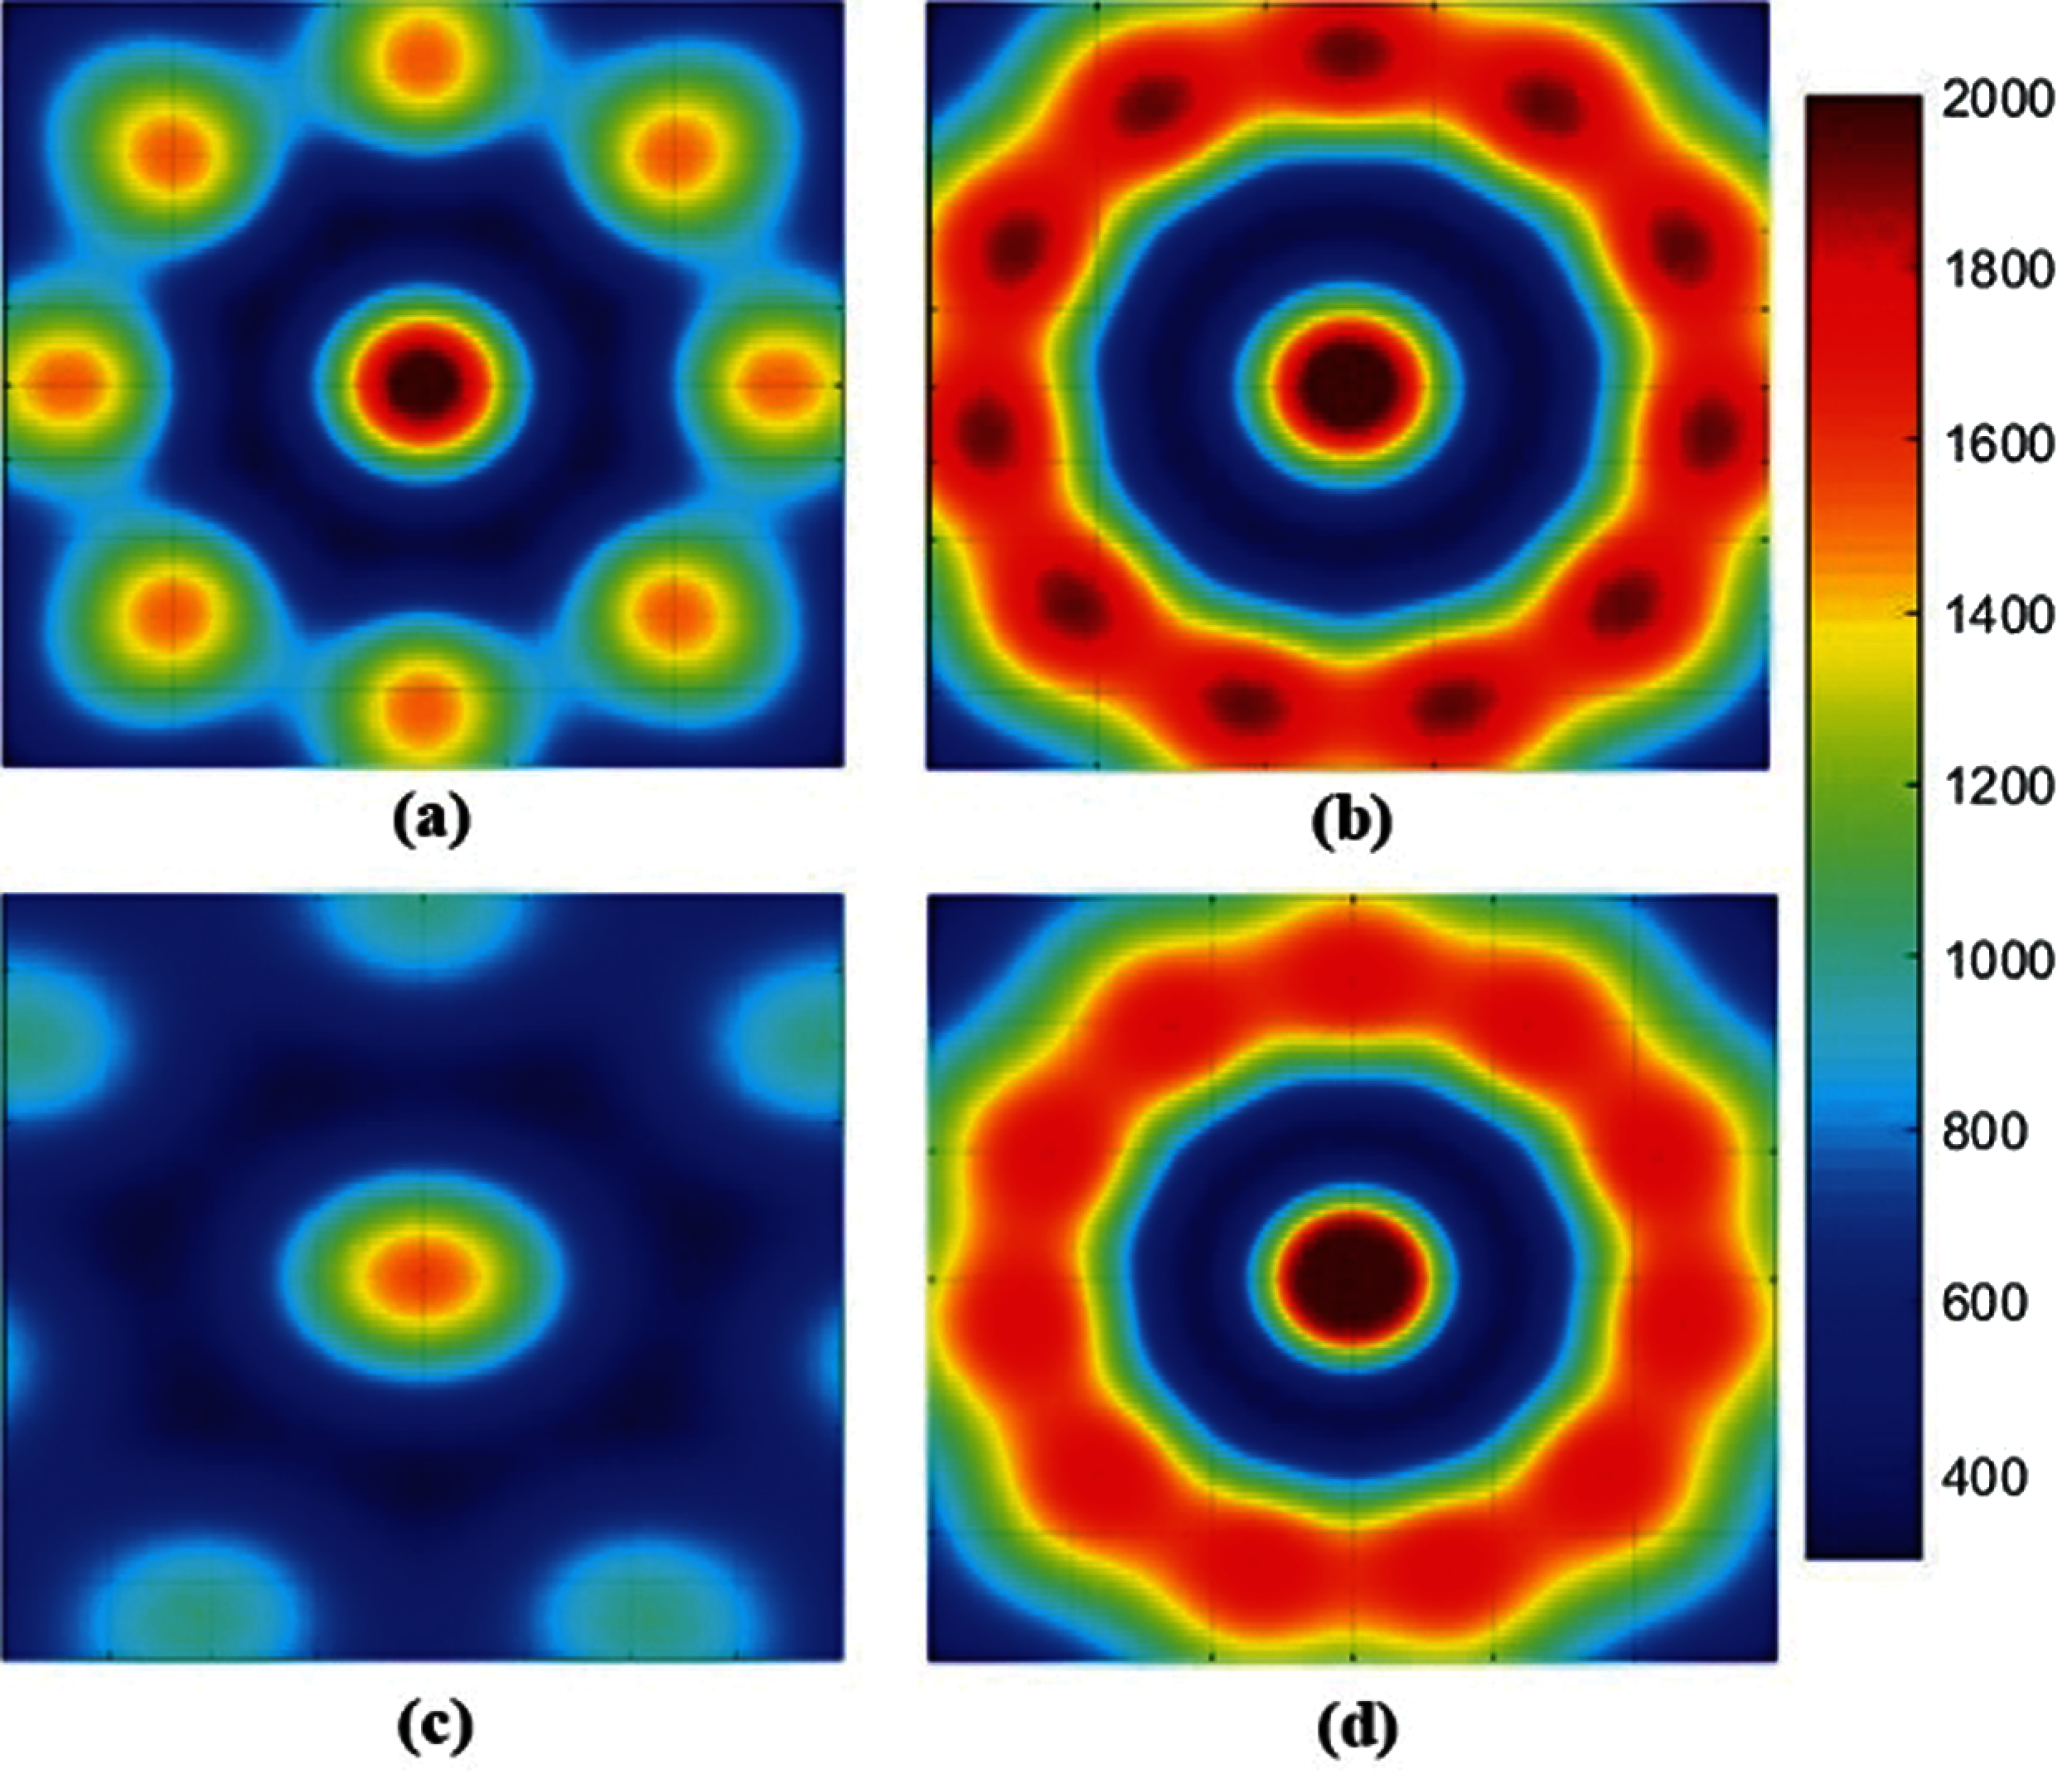
Figure 11: The distribution of illuminance, which provide coverage illuminance equal to 100%. (a) The distribution of illuminance for scenarios 1; (b) The distribution of illuminance for scenarios 2; (c) The distribution of illuminance for scenarios 3; (d) The distribution of illuminance for scenarios 4
Fig. 13a shows a regular switched-beam, Fig. 13b shows the incorporating of an LED beam in two positions, and Fig. 13c shows the incorporating of an LED beam in three positions.
The coverage area increases from 83.922% to 86.496% and 88.027%, as shown in Fig. 13a–13c, respectively. This switched-beam technique provides a good performance for all scenarios.
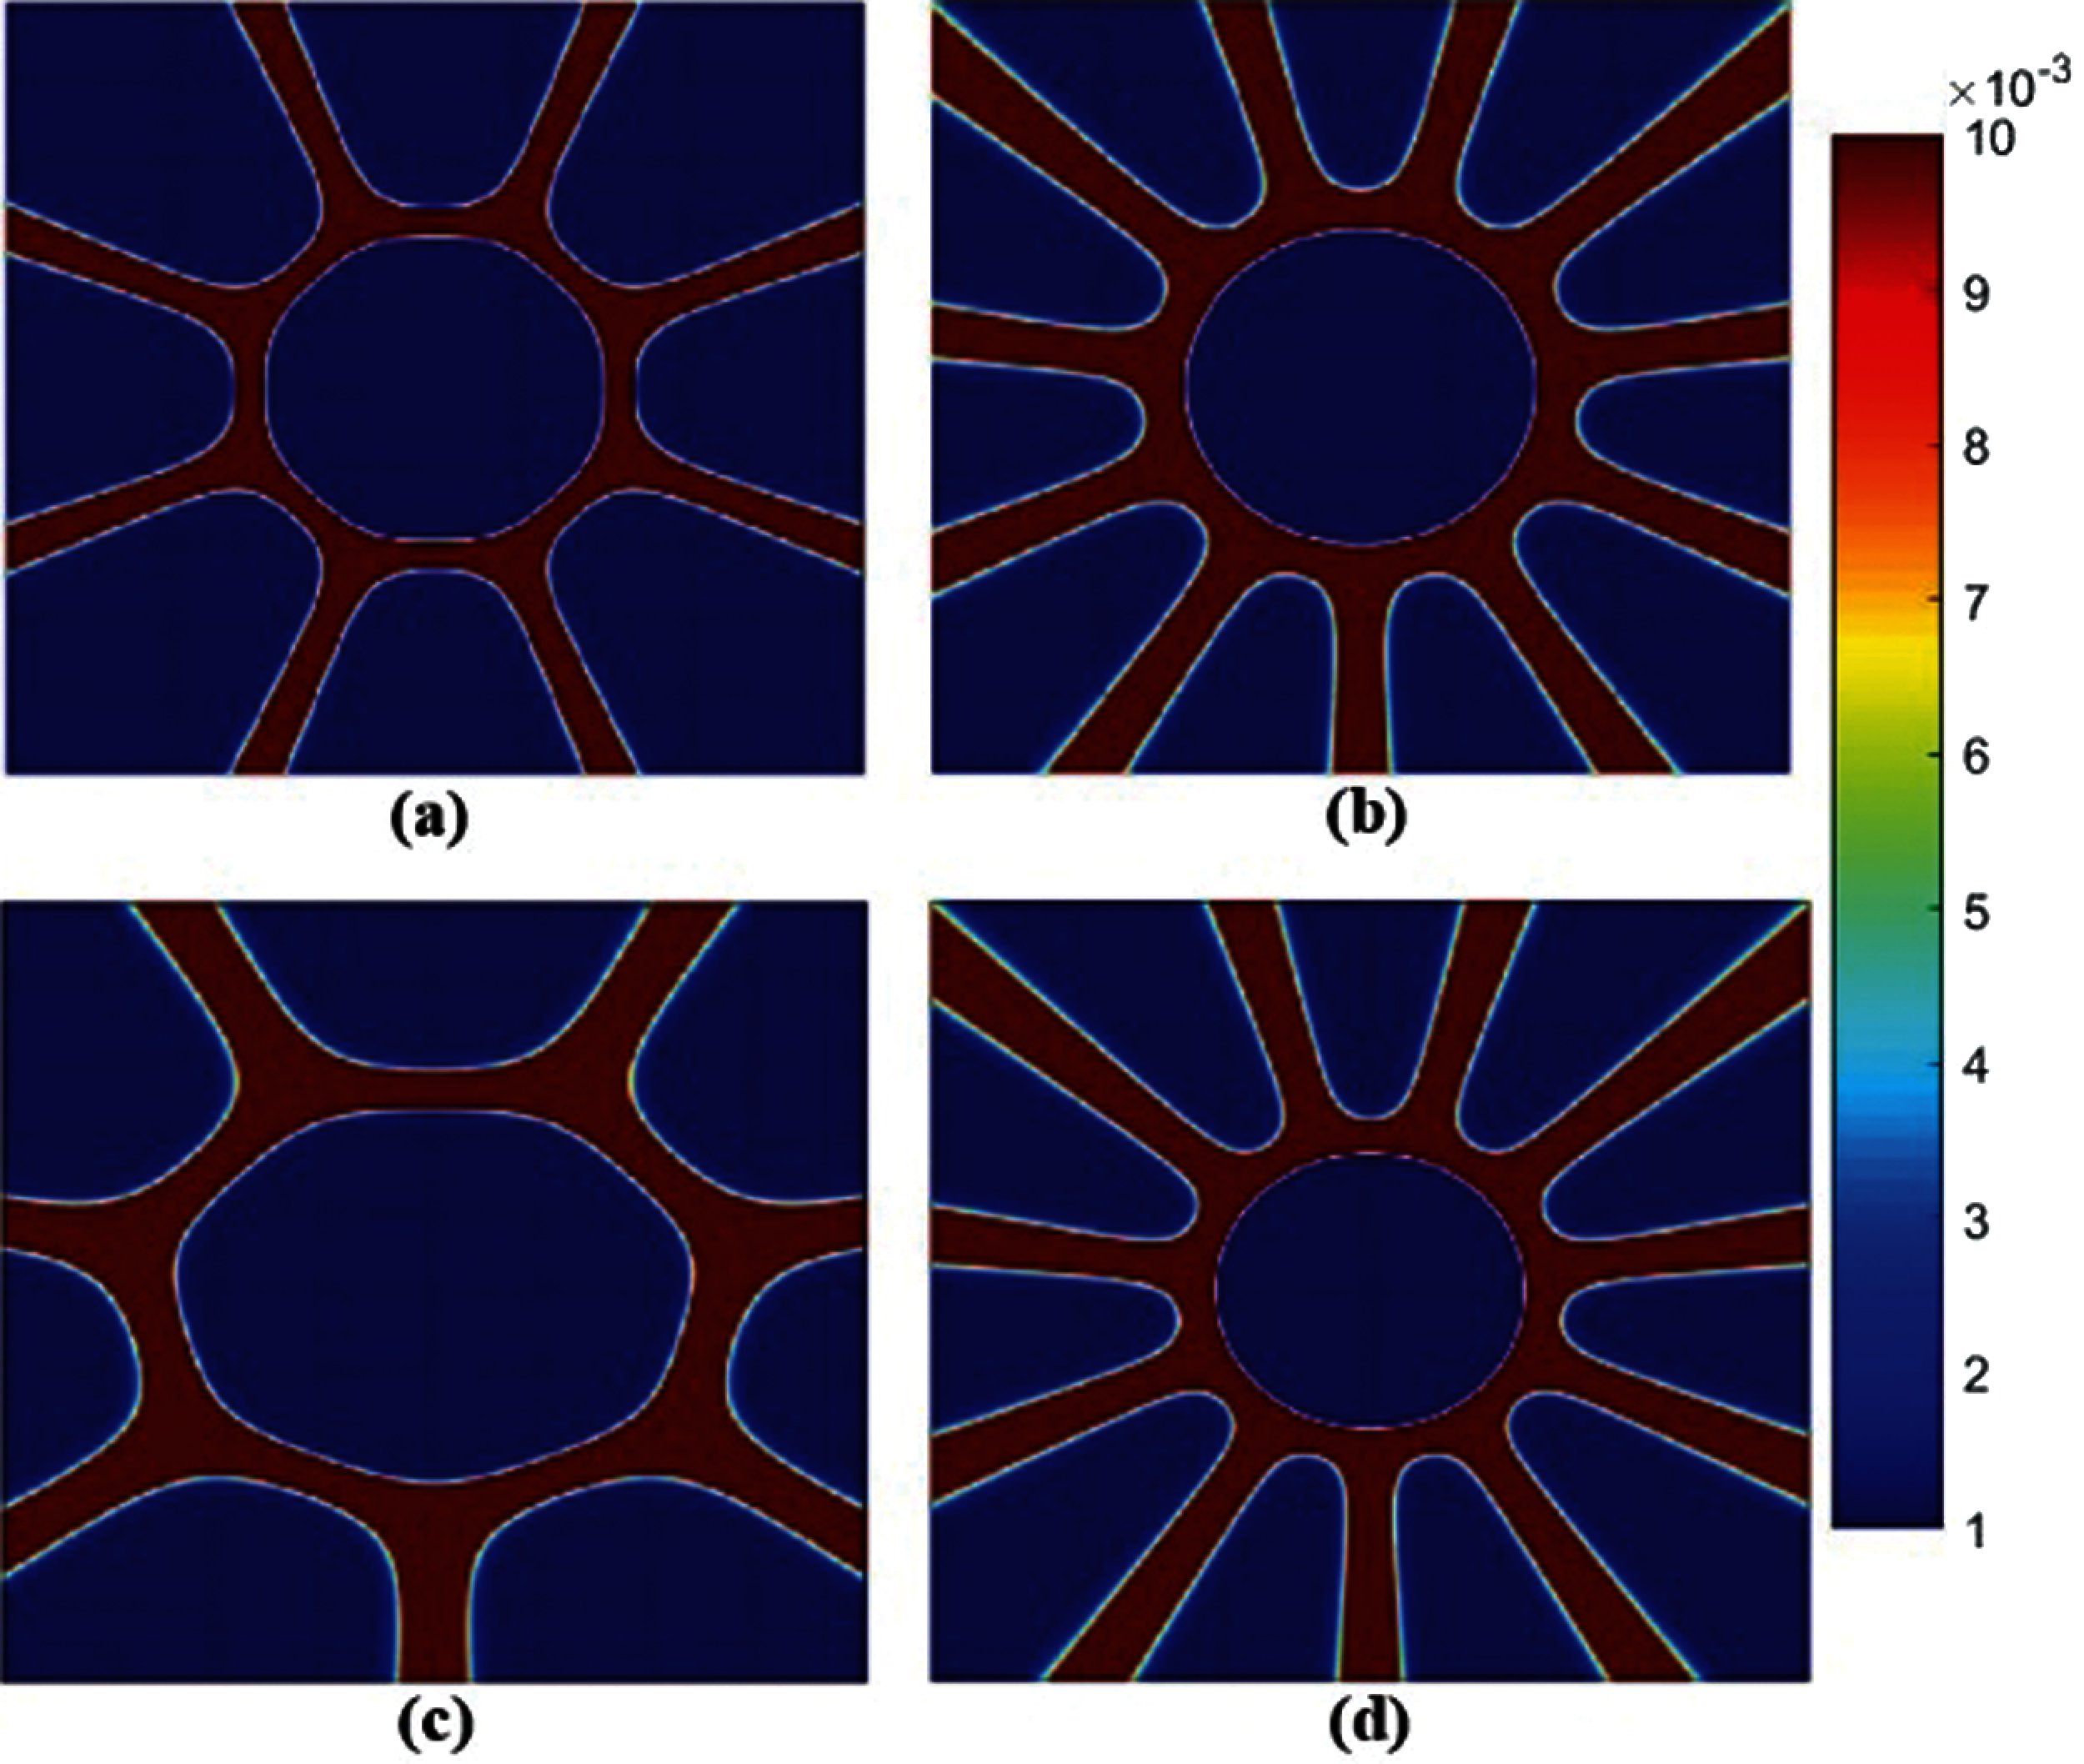
Figure 12: The distribution of Bit Error Rate, which represent the coverage area. (a) The coverage area = 83.922% in scenarios 1; (b) The coverage area = 73.622% in scenarios 2; (c) The coverage area = 78.181% in scenarios 3; (d) The coverage area = 73.677% in scenarios 4
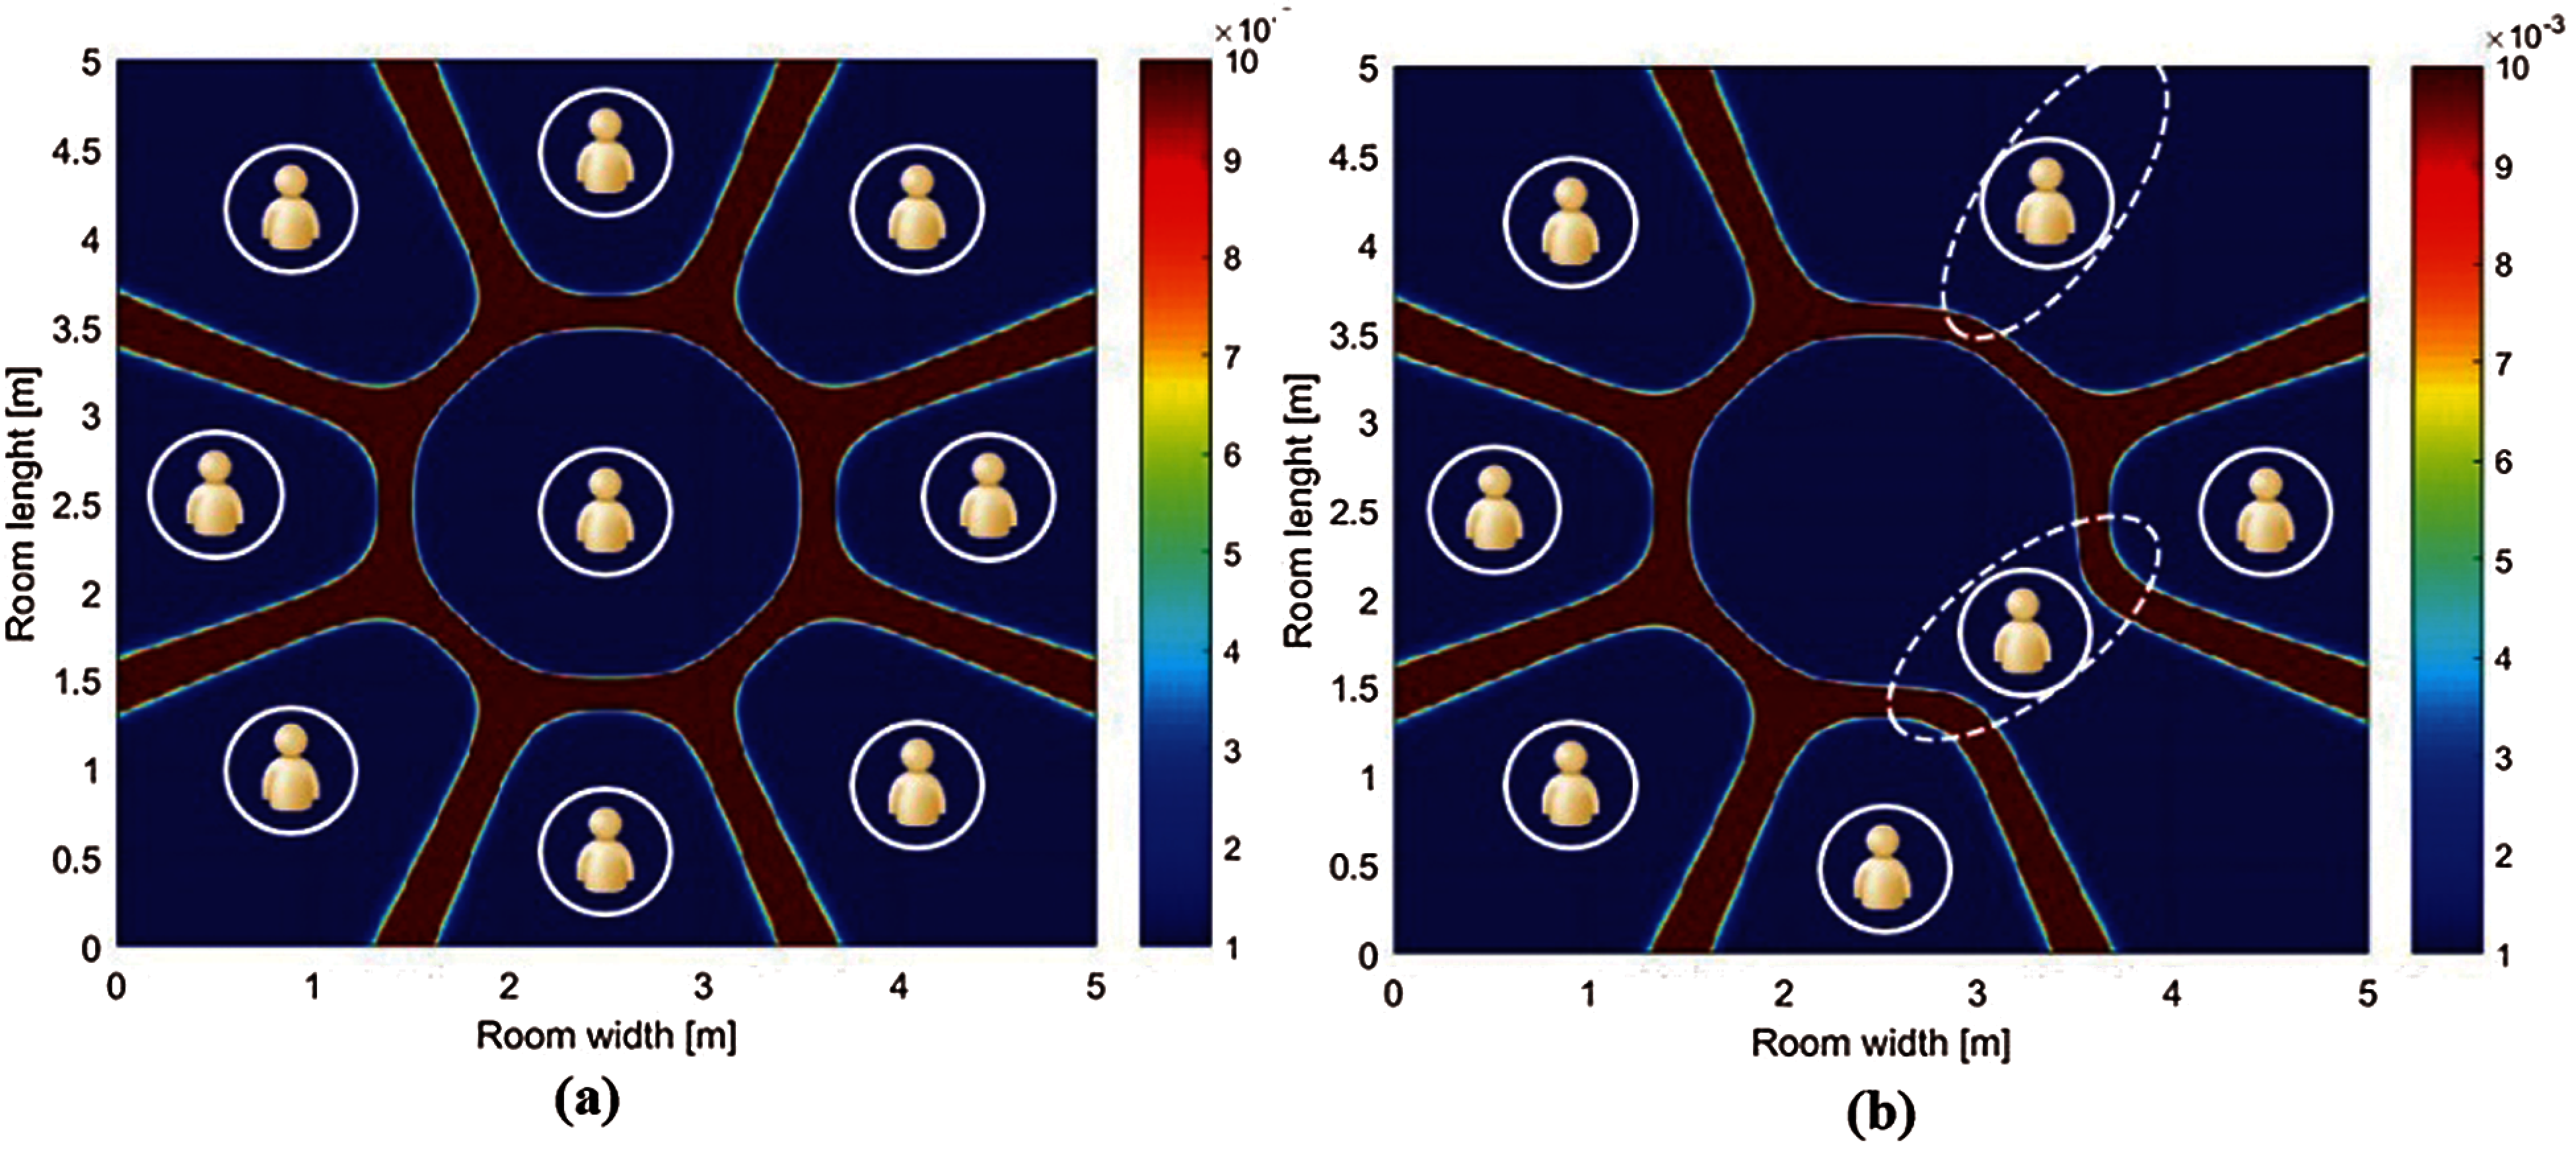
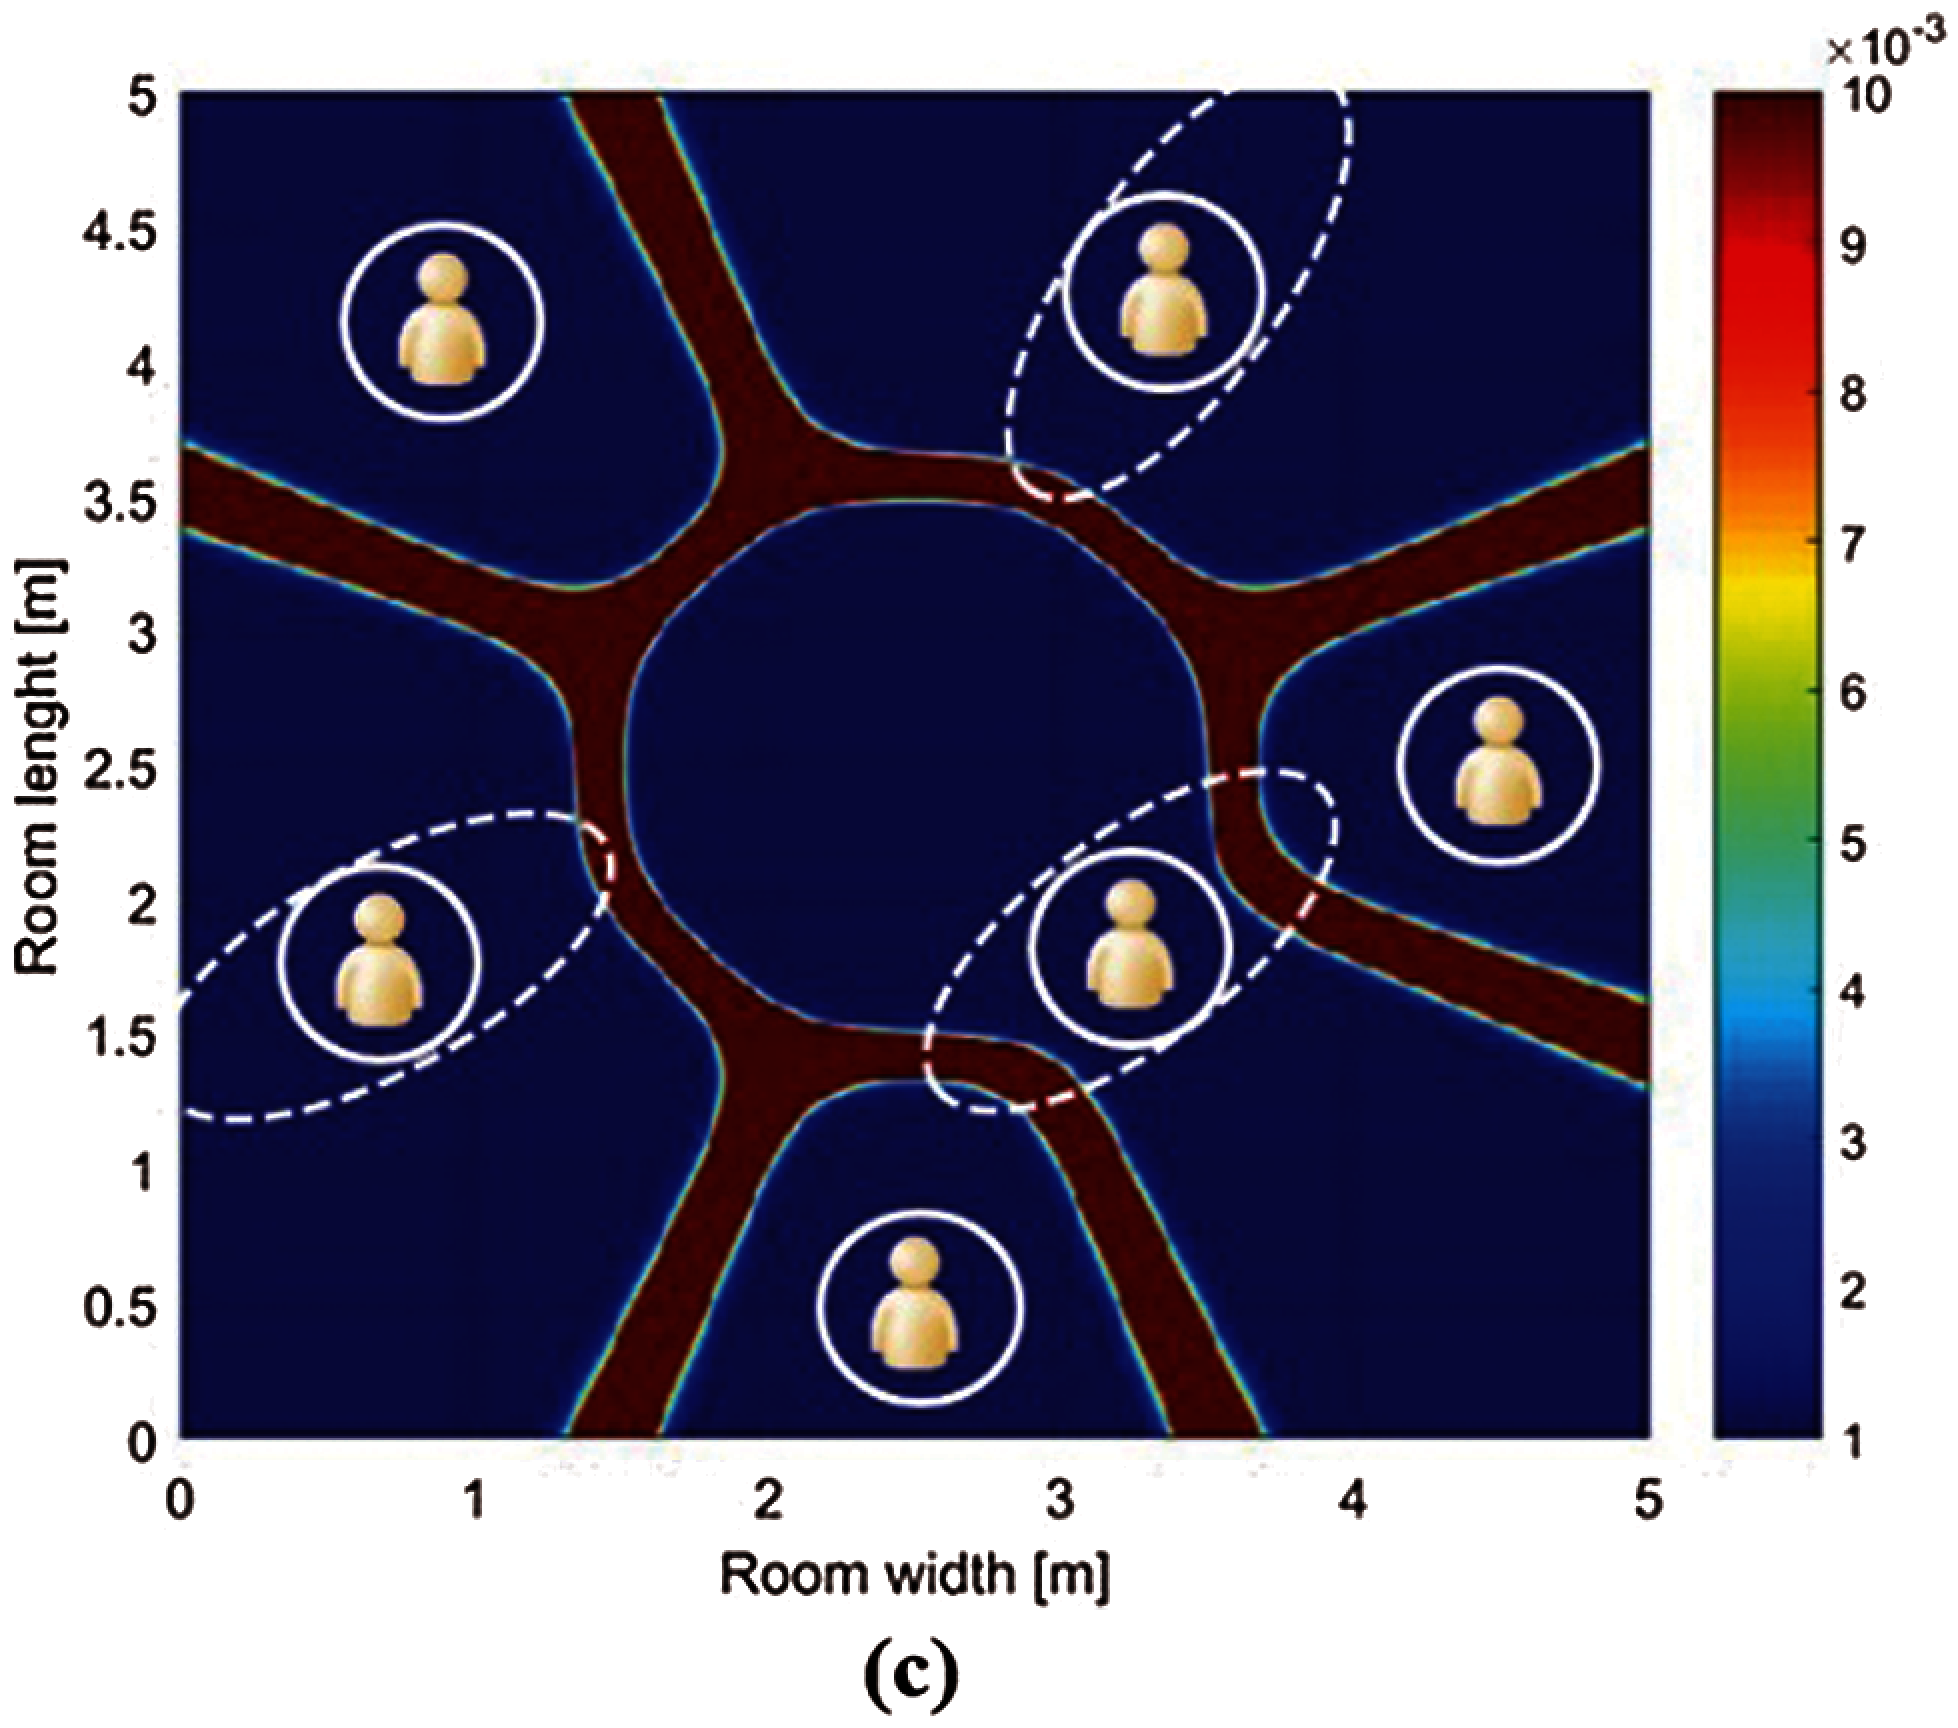
Figure 13: Example of the proposed method to increase the coverage area in scenario 1. (a) The regular switched-beam technique (b) The incorporating of an LED beam in two positions (c) The incorporating of an LED beam in three positions
This paper has presented the design of an indoor VLC system using the switched-beam technique through MATLAB programing, which has designed the LEDs to be arranged in a circular array. The communication is performed through the beam of each LED. The Genetic Algorithm is adopted to find the suitable solution for designing parameters. From the simulation results, a Genetic Algorithm can be used to find the suitable solution for designing parameters of each simulation scenario with less computational time than an exhaustive search approximately 382 min in proposed scenarios. Also, the maximum coverage area based on coverage illuminance according to the CIE standards can be achieved. Moreover, the switched-beam technique can enhance indoor VLC by increasing the number of simultaneous users and the coverage area.
Funding Statement: This work was supported by Suranaree University Technology, Nakhon Ratchasima, Thailand.
Conflicts of Interest: The authors declare that they have no conflicts of interest to report regarding the present study.
1. P. Kocharoen, “Visible light communication: Importance and Thai preparations,” in Procedia Computer Science, Chiang Mai, Thailand, pp. 51–54, 2016. [Google Scholar]
2. L. E. M. Matheus, A. B. Vieira, L. F. M. Vieira, M. A. M. Vieira and O. Gnawali, “Visible light communication: Concepts, applications and challenges,” IEEE Communications Surveys & Tutorials, vol. 21, no. 4, pp. 3204–3237, 2019. [Google Scholar]
3. A. Jovicic, J. Li and T. Richardson, “Visible light communication: Opportunities, challenges and the path to market,” IEEE Communications Magazine, vol. 51, no. 12, pp. 26–32, 2013. [Google Scholar]
4. M. Saadi, T. Ahmad, M. K. Saleem and L. Wuttisittikulkij, “Visible light communication–an architectural perspective on the applications and data rate improvement strategies,” Transactions on Emerging Telecommunications Technologies, vol. 30, no. 2, pp. e3436, 2019. [Google Scholar]
5. A. R. Ndjiongue, H. C. Ferreira and T. M. N. Ngatched, “Visible light communications (VLC) technology,” in Wiley Encyclopedia of Electrical and Electronics Engineering, Johannesburg, South Africa: Wiley Online Library, pp. 1–15, 2000. [Google Scholar]
6. M. Saadi, L. Wuttisittikulkij, Y. Zhao and P. Sangwongngam, “Visible light communication: Opportunities, challenges and channel models,” International Journal of Electronics & Informatics, vol. 2, no. 1, pp. 1–11, 2013. [Google Scholar]
7. A. G. Bell, “The photophone,” Science, vol. 1, no. 11, pp. 130–134, 1880. [Google Scholar]
8. M. Saadi, A. Bajpai, Y. Zhao, P. Sangwongngam and L. Wuttisittikulkij, “Design and implementation of secure and reliable communication using optical wireless communication,” Frequenz, vol. 68, no. 11–12, pp. 501–509, 2014. [Google Scholar]
9. Y. Tanaka, T. Komine, S. Haruyama and M. Nakagawa, “Indoor visible light data transmission system utilizing white LED lights,” IEICE Transactions on Communications, vol. 86, no. 8, pp. 2440–2454, 2003. [Google Scholar]
10. H. Haas, L. Yin, C. Chen, S. Videv, D. Parol et al., “Introduction to indoor networking concepts and challenges in liFi,” Journal of Optical Communications and Networking, vol. 12, no. 2, pp. A190–A203, 2020. [Google Scholar]
11. M. T. Niaz, F. Imdad, S. Kim and H. S. Kim, “Deployment methods of visible light communication lights for energy efficient buildings,” Optical Engineering, vol. 55, no. 10, pp. 106113, 2016. [Google Scholar]
12. P. Priyanka, M. Singh, H. S. Gill, S. Kaur and M. L. Singh, “Improvement of uniformity of illumination for circular LED arrangement in VLC system,” in 2018 Int. Conf. on Recent Innovations in Electrical, Electronics & Communication Engineering (ICRIEECEBhubaneswar, India, pp. 2214–2217, 2018. [Google Scholar]
13. S. Kim and S. Kim, “Performance improvement of visible light communications using optical beamforming,” in 2013 Fifth Int. Conf. on Ubiquitous and Future Networks (ICUFNDa Nang, Vietnam, pp. 362–365, 2013. [Google Scholar]
14. J. Remenyi, P. Varhegyi, L. Domjan, P. Koppa and E. Lorincz, “Amplitude, phase, and hybrid ternary modulation modes of a twisted-nematic liquid-crystal display at ∼400 nm,” Applied Optics, vol. 42, no. 17, pp. 3428–3434, 2003. [Google Scholar]
15. S. M. Kim, “Visible light communication employing optical beamforming: A review,” Current Optics and Photonics, vol. 2, no. 4, pp. 308–314, 2018. [Google Scholar]
16. T. H. Do, J. Hwang and M. Yoo, “Analysis of the effects of LED direction on the performance of visible light communication system,” Photonic Network Communications, vol. 25, no. 1, pp. 60–72, 2013. [Google Scholar]
17. L. A. Azizan, M. S. Ab-Rahman, M. R. Hassan, A. A. A. Bakar and R. Nordin, “Optimization of signal-to-noise ratio for wireless light-emitting diode communication in modern lighting layouts,” Optical Engineering, vol. 53, no. 4, pp. 045103, 2014. [Google Scholar]
18. G. P. Varma, “Optimum power allocation for uniform illuminance in indoor visible light communication,” Optics Express, vol. 26, no. 7, pp. 8679–8689, 2018. [Google Scholar]
19. J. Ding, Z. Huang and Y. Ji, “Evolutionary algorithm based power coverage optimization for visible light communications,” IEEE Communications Letters, vol. 16, no. 4, pp. 439–441, 2012. [Google Scholar]
20. W. Jiaan, X. Ancheng, J. Jintao and G. Linyang, “Optimization lighting layout of indoor visible light communication system based on improved artificial fish swarm algorithm,” Journal of Optics, vol. 22, no. 3, pp. 035701, 2020. [Google Scholar]
21. M. Kumar, M. Husain, N. Upreti and D. Gupta, “Genetic algorithm: Review and application,” Available at SSRN 3529843, vol. 2, no. 2, 451–454, pp. 2010. [Google Scholar]
22. Y. Zhou, Y. Li and Y. Zhang, “A negotiated pricing model for innovation services based on the multiobjective genetic algorithm,” Intelligent Automation & Soft Computing, vol. 27, no. 1, pp. 191–203, 2021. [Google Scholar]
23. T. Kamalakis, L. Dogkas and F. Simou, “Application of a genetic algorithm to optimize the performance of a visible light communications system: Key concepts and preliminary results,” in 11th Hellenic Conf. on Artificial Intelligence, New York, United States, pp. 129–134, 2020. [Google Scholar]
24. J. H. Liu, Q. Li and X. Y. Zhang, “Cellular coverage optimization for indoor visible light communication and illumination networks,” Journal of Communications, vol. 9, no. 11, pp. 891–898, 2014. [Google Scholar]
25. T. Komine and M. Nakagawa, “Fundamental analysis for visible-light communication system using LED lights,” IEEE Transactions on Consumer Electronics, vol. 50, no. 1, pp. 100–107, 2004. [Google Scholar]
26. M. Rahaim and T. D. C. Little, “SINR analysis and cell zooming with constant illumination for indoor VLC networks,” in 2013 2nd Int. Workshop on Optical Wireless Communications (IWOWNewcastle, United Kingdom, pp. 20–24, 2013. [Google Scholar]
27. L. Zeng, D. O'Brien, H. Le-Minh, K. Lee, D. Jung et al., “Improvement of date rate by using equalization in an indoor visible light communication system,” in 2008 4th IEEE Int. Conf. on Circuits and Systems for Communications, Shanghai, China, pp. 678–682, 2008. [Google Scholar]
28. N. A. Yatari Putri, A. Hambali and B. Pamukti, “VLC system performance evaluation with addition of optical concentrator on photodetector,” in 2019 IEEE Int. Conf. on Signals and Systems (ICSigSysBandung, Indonesia, pp. 167–172, 2019. [Google Scholar]
29. W. V. Bommel, “Interior lighting,” in Springer Nature Switzerland AG, Cham, Switzerland: Springer, pp. 389–406, 2019. [Google Scholar]
30. H. M. Hang and J. W. Woods, “Handbook of Visual Communications,” San Diego, California: Academic Press, pp. 147–188, 1995. [Google Scholar]
31. X. S. Yang, “Nature-inspired Optimization Algorithms,” London, United Kingdom: Elsevier, Academic Press, pp. 77–86, 2020. [Google Scholar]
32. L. M. Schmitt, “Theory of genetic algorithms,” Theoretical Computer Science, vol. 259, no. 1, pp. 1–61, 2001. [Google Scholar]
33. J. McCall, “Genetic algorithms for modelling and optimisation,” Journal of Computational and Applied Mathematics, vol. 184, no. 1, pp. 205–222, 2005. [Google Scholar]
34. J. Feng, L. Ding and Y. Wang, “Channel simulation of non-imaging optical MIMO communication,” Optics and Photonics Journal, vol. 3, no. 2, pp. 212–216, 2013. [Google Scholar]
35. H. Q. Nguyen, J. H. Choi, M. Kang, Z. Ghassemlooy, D. H. Kim et al., “A MATLAB-based simulation program for indoor visible light communication system,” in 2010 7th Int. Symp. on Communication Systems, Networks & Digital Signal Processing (CSNDSP 2010Newcastle, United Kingdom, pp. 537–541, 2010. [Google Scholar]
36. L. Zeng, D. O'Brien, H. L. Minh, G. Faulkner, K. Lee et al., “High data rate multiple input multiple output (MIMO) optical wireless communications using white LED lighting,” IEEE Journal on Selected Areas in Communications, vol. 27, no. 9, pp. 1654–1662, 2009. [Google Scholar]
 | This work is licensed under a Creative Commons Attribution 4.0 International License, which permits unrestricted use, distribution, and reproduction in any medium, provided the original work is properly cited. |