DOI:10.32604/cmc.2022.020017
| Computers, Materials & Continua DOI:10.32604/cmc.2022.020017 | |
| Article |
Plant Disease Diagnosis and Image Classification Using Deep Learning
1School of Computer Applications, Lovely Professional University Jalandhar, 144411, India
2Department of Computer Science and Engineering, Chandigarh University, Mohali, India
3Department of Computer Science and Engineering, Tailor's University, Malaysia
4Department of Computer Science, College of Computer and Information Technology, Taif University, Taif, 21944, Saudi Arabia
5Department of Computer Science, Faculty of Computer and Information Technology, King Abdulaziz University, Jeddah, 21589, Saudi Arabia
*Corresponding Author: Sahil Verma. Email: sahilverma@ieee.org
Received: 06 May 2021; Accepted: 09 July 2021
Abstract: Indian agriculture is striving to achieve sustainable intensification, the system aiming to increase agricultural yield per unit area without harming natural resources and the ecosystem. Modern farming employs technology to improve productivity. Early and accurate analysis and diagnosis of plant disease is very helpful in reducing plant diseases and improving plant health and food crop productivity. Plant disease experts are not available in remote areas thus there is a requirement of automatic low-cost, approachable and reliable solutions to identify the plant diseases without the laboratory inspection and expert's opinion. Deep learning-based computer vision techniques like Convolutional Neural Network (CNN) and traditional machine learning-based image classification approaches are being applied to identify plant diseases. In this paper, the CNN model is proposed for the classification of rice and potato plant leaf diseases. Rice leaves are diagnosed with bacterial blight, blast, brown spot and tungro diseases. Potato leaf images are classified into three classes: healthy leaves, early blight and late blight diseases. Rice leaf dataset with 5932 images and 1500 potato leaf images are used in the study. The proposed CNN model was able to learn hidden patterns from the raw images and classify rice images with 99.58% accuracy and potato leaves with 97.66% accuracy. The results demonstrate that the proposed CNN model performed better when compared with other machine learning image classifiers such as Support Vector Machine (SVM), K-Nearest Neighbors (KNN), Decision Tree and Random Forest.
Keywords: Plant diseases detection; CNN; image classification; deep learning in agriculture
In India, the agriculture sector employed a 50% workforce and contributed 19.9% of India's GDP in 2020–21. To ensure the high yield agriculture sector needs to be supported by the latest technological advancements. Agriculture crops suffer heavy losses due to insect damage and plant diseases. The expected population of the world by 2050 is 9.2 billion and to meet the food requirements, food production should increase by about 70% [1]. Food crops suffer heavy losses due to strong winds, adverse weather conditions, drought, fungi, bacteria, viruses, etc. Worldwide out of the crop losses 70–80% of losses are caused by plant diseases. Efforts should be made to reduce crop losses due to plant diseases. Early diagnosis of plant diseases can help farmers in developing defense mechanisms resulting in healthy and productive food crops. Detecting and getting rid of the diseases will aid in increasing productivity. Potato (Solanum tuberosum) is an important cash food crop. Worldwide more than 300 million metric tons of potato are produced in more than 100 different countries. In the year 2018–19, India produced about 53 million tonnes of potato. China is a top producer of potatoes followed by India, Russia, Ukraine and the USA. Potato is a root vegetable with more than 1000 different varieties is an essential staple food source and is a major vegetable crop based on its production and consumption worldwide. It is carbohydrate-rich and has good nutritional quality. The potato crop is a major source of income for farmers. Different diseases of potato are early blight caused by fungus Alternaria Solani [2], late blight fungus, Potato virus Y which is a pathogenic virus, bacterial wilt, black scurf [3] common scab, fusarium dry rot, black dot, silver scurf, pink rot, brown center, hollow heart, etc. Potato blight disease can destroy food crops. Traditionally Paddy or rice has been very important and demanding crops in South Asia [4] and with the growing population, the demand is ever increasing. More than 50% of the world's population consumes rice as their staple food. Mass loss of rice crops can be prevented if correct diagnoses of the diseases are done during the initial stage. Rice plant suffers from different biotic diseases like rice leaf blast, neck blast, steath blight, steath rot, bakanae, tungro, bacterial leaf blight, brown spot, narrow brown spot, stunt, leaf streak, [5] etc. In this paper, 4 different major rice leaf diseases including bacterial blight, blast, brown spot and tungro [6] are diagnosed. Preventive measures must be taken at an initial stage to stop the epidemic. If the disease is treated from the leaves at an early stage disease will not spread to the stem and food crop can be saved from damages. Early diagnosis and adopting preventive measures to curb these diseases can help in producing healthy tuber and increased potato and paddy yield. Computer vision techniques can be used for the diagnosis of diseases by inspecting leaf images. Computer Vision by using digital image processing can be used for plant disease image classification tasks [7]. A deep learning approach employing a CNN for image classification is presented in this paper. The developed approach for image classification shows very promising results.
This paper is organized into 6 sections. Section 1 introduces the plant diseases and the need for timely detection of plant diseases, Section 2 presents a literature review, Section 3 presents the datasets used for the study and proposes the CNN model, Section 4 discusses the implementation and performance of the proposed classifier. Activation maps outputted by the CNN model layers are discussed. Section 5 compares different performance parameters of the proposed approach with 4 other image classification algorithms. Finally, we have concluded our paper in Section 6.
Plant pathologists analyze different parts of the plants like root, kernel, stem and leaf for the classification of plant diseases. Ferentinos [8] presented a paper implementing different plant disease classification CNN model architectures diseases with high accuracy. Brahimi et al. [9] investigated 14828 images of tomato leaves infected by nine different diseases. By using localized diseased regions of the leaf, and the availability of a sufficient dataset the CNN model was able to provide 99.18% of accuracy. Plant pests had harm crops and can cause serious losses to farmers. Dawei et al. [10] in his research paper used transfer learning to improve the accuracy to indent the pests and showed promising results. Singh et al. [11]. The proposed classifier achieved 96.46% accuracy and performed better than other machine learning algorithms like (SVM, Decision Tree, Logistic Regression and KNN) as well as transfer learning approaches [12] (AlexNet, ResNet, VGG16, Inception V3). Hasan et al. [13] used a region-based CNN model for estimating the wheat yield and achieved the average accuracy ranging from 88% to 94%. The model was applied for estimating the yield production of different wheat varieties. Patil and Bodhe for plant disease detection extracted shape features of leaves of sugarcane. They used threshold segmentation and triangle segmentation for determining the leaf and lesioning area and achieved 98.6% accuracy [14]. Oppenheim et al. [15] presented a research paper titled “Using deep learning for image-based potato tuber disease detection” used computer vision for potato disease classification using a CNN model. Oppenheim et al. [16] used the CNN model to classify tubers into five different classes. Barbedo, Jiang et al. (2016) presented a research paper that identified image processing research requirements to automatically identify the diseases in the plants. The real-time apple leaf disease classification approach was proposed by Jiang et al. [17] using the VGG-Inception model and rainbow concatenation. The proposed approach when tested with the apple leaf dataset performed with a test accuracy of 97.14%. The proposed approach outperformed other well-known pre-trained models. Atole et al. [18] presented a research paper using a pre-trained AlexNet deep network for the classification of rice plants into three classes and achieved an accuracy of 91.23%. A. P. Singh presented a research paper illustrating feature selection using artificial bee colony to determine the optimal feature set required for the identification of diseases of grape plant images using a support vector machine classifier. The proposed algorithm achieved 92.14% accuracy [19]. Zhu et al. [20] applied Inception V2 with batch normalization and achieved higher accuracy when compared to Faster RCNN for plant species classification task. Zhang [21] proposed a classification framework and named it diverse region-based CNN capable of encoding context-aware representation and obtaining features. Nanehkaran et al. [22] proposed a two-step method for plant leaf disease identification namely image segmentation and image classification. An image segmentation approach based on hue, saturation and intensity was proposed. The segmented images were classified using the CNN model to achieve higher accuracy. W. Shaohua and S. Goudos (2020) demonstrated accurate and faster object detection using the deep learning model R-CNN [23]. A deep learning-based plant species identification approach (D-Leaf) was presented by Rani et al. [24]. Pre-trained models were used for feature extraction and image classification task was performed by machine learning techniques. D-leaf model with ANN classifier was able to achieve an accuracy of 94.88%.
Image classification approach for optimizing the hyper-parameters of the Support Vector Machine (SVM) model with an improved artificial bee colony nature-inspired optimization algorithm was proposed by Zhao et al. [25]. For comparative study Genetic algorithm (GA)—SVM and Particle swarm optimization PSO-SVM approaches were studied. The proposed approach for the classification of hyperspectral images performed better than other comparative methods with an accuracy of 98.28%. Nature-inspired algorithms make use of real-world optimization approaches. Popular nature-inspired optimization algorithms are genetic optimization, three-parent genetic optimization [26], parallel 3-parent genetic algorithm [27], artificial bee colony, particle swarm optimization, cuckoo search, ant colony optimization, big bang big crunch, parallel big bang big crunch [28] etc. Deep learning methods are successfully applied in different fields. ID-NET an intrusion detection system using improved mask R-CNN was proposed by Gao et al. [29] for surveillance of the power grid. The proposed model was trained for small object detection and the model performed better than the other state-of-the-art object detection models. Bhattacharya et al. [30] proposed an approach to classify bacterial blight, rice blast and brown mark disease images (total of 1500 images) with 94% accuracy. In this paper, we have proposed deep learning-based approach whose hyper-parameters can be optimized by using nature-inspired optimization algorithms.
Image Classification Machine Learning Algorithms
For Image classification using Support Vector Machine (SVM), K-Nearest Neighbors (KNN), Decision Tree and Random Forest algorithms models are trained using both rice and potato datasets for comparative analysis. Image classification models were evaluated to predict the rice and potato plant leaf diseases. The proposed CNN model showed higher performance and most suited for plant disease classification when compared with other image classification techniques. SVM is a supervised machine learning capable of inferring the output label and performs well even with small datasets. SVM outputs a hyperplane maximizing the margins. SVM employs the kernel method for classifying non-linear data. The equation of the class separator line hyperplane is y
SVM aims to maximize the classification distance Di and can be achieved by minimizing
For hyperparameter tuning is done by passing the values of c, kernel and gamma to the grid search algorithm [32–34]. Hyperparameters with the best cross-validation score are selected. Using the K-Nearest neighbors algorithm uses Euclidean distance of input image to every other point and uses majority voting from K minimum distance points to classify the image [35–37]. The generalized equation for calculating the distance is given below
3 Dataset and Proposed CNN Model
In this paper, rice and potato datasets are used. Datasets are split into 80:20 configurations where 80% of the images is used for training and 20% of the images is used for testing for both rice and potato datasets. The Rice dataset contains a total of 5932 images including 4 varieties of rice leaf diseases including Bacterial blight, Blast, Brown Spot and Tungro [40]. With 80:20 test train split for training 3785 images and for testing 947 images were used. The rice dataset sample images are shown in Fig. 1.
A potato leaf dataset containing a total of 1500 images is used in the study. 1200 images were used for training and validation and 300 images were used for testing. Dataset has images belonging to three different classes (early blight, late blight, healthy) of potato leaves. The sample of the potato leaves is shown in Fig. 2. Tab. 1 represents the number of training and testing images of the datasets.

Figure 1: Sample images of rice leaf image dataset (a) bacterial blight (b) blast (c) brown spot (d) tungro

Figure 2: Sample image of potato leaf diseases (a) early blight (b) late blight (c) healthy

During preprocessing stage, all the images are resized to 128 X 128 pixels. Resized images of the potato dataset are shown in Fig. 3.
Train: X(1200, 128, 128, 3), y = (900) Test: X(300, 128, 128, 3), y = (300)
3.2 Proposed Convolution Neural Network
A deep learning-based CNN model is proposed in this paper for reliable image classification. The proposed classifiers efficiently identify the diseased and healthy potato and rice plant leaves. A comparative study of traditional machine learning techniques along with CNN is presented in this paper. Computer vision problems dealing with images have high memory and computational requirements. For an image of height 128 pixels, width 128 pixels and 3 channels the input feature dimension is 49152. For images of a larger size, the input data becomes even substantial. Inputting this huge data to the neural network will require high computational power. CNN also known as ConvNet is a powerful deep learning technique that was designed from the biological driven models similar to how a human perceives an image into the brain using different layers. CNN captures the spatial and temporal dependencies in an image through the application of filters at different layers. Feature extraction using CNN reduces the image into a form that requires fewer computations and at the same time preserves the features needed for making the prediction [41]. CNN model makes use of layered architecture and is composed of a convolutional layer, the ReLU layer, the pooling layer, the drop out layers and fully connected layers.

Figure 3: Resized potato leaf dataset
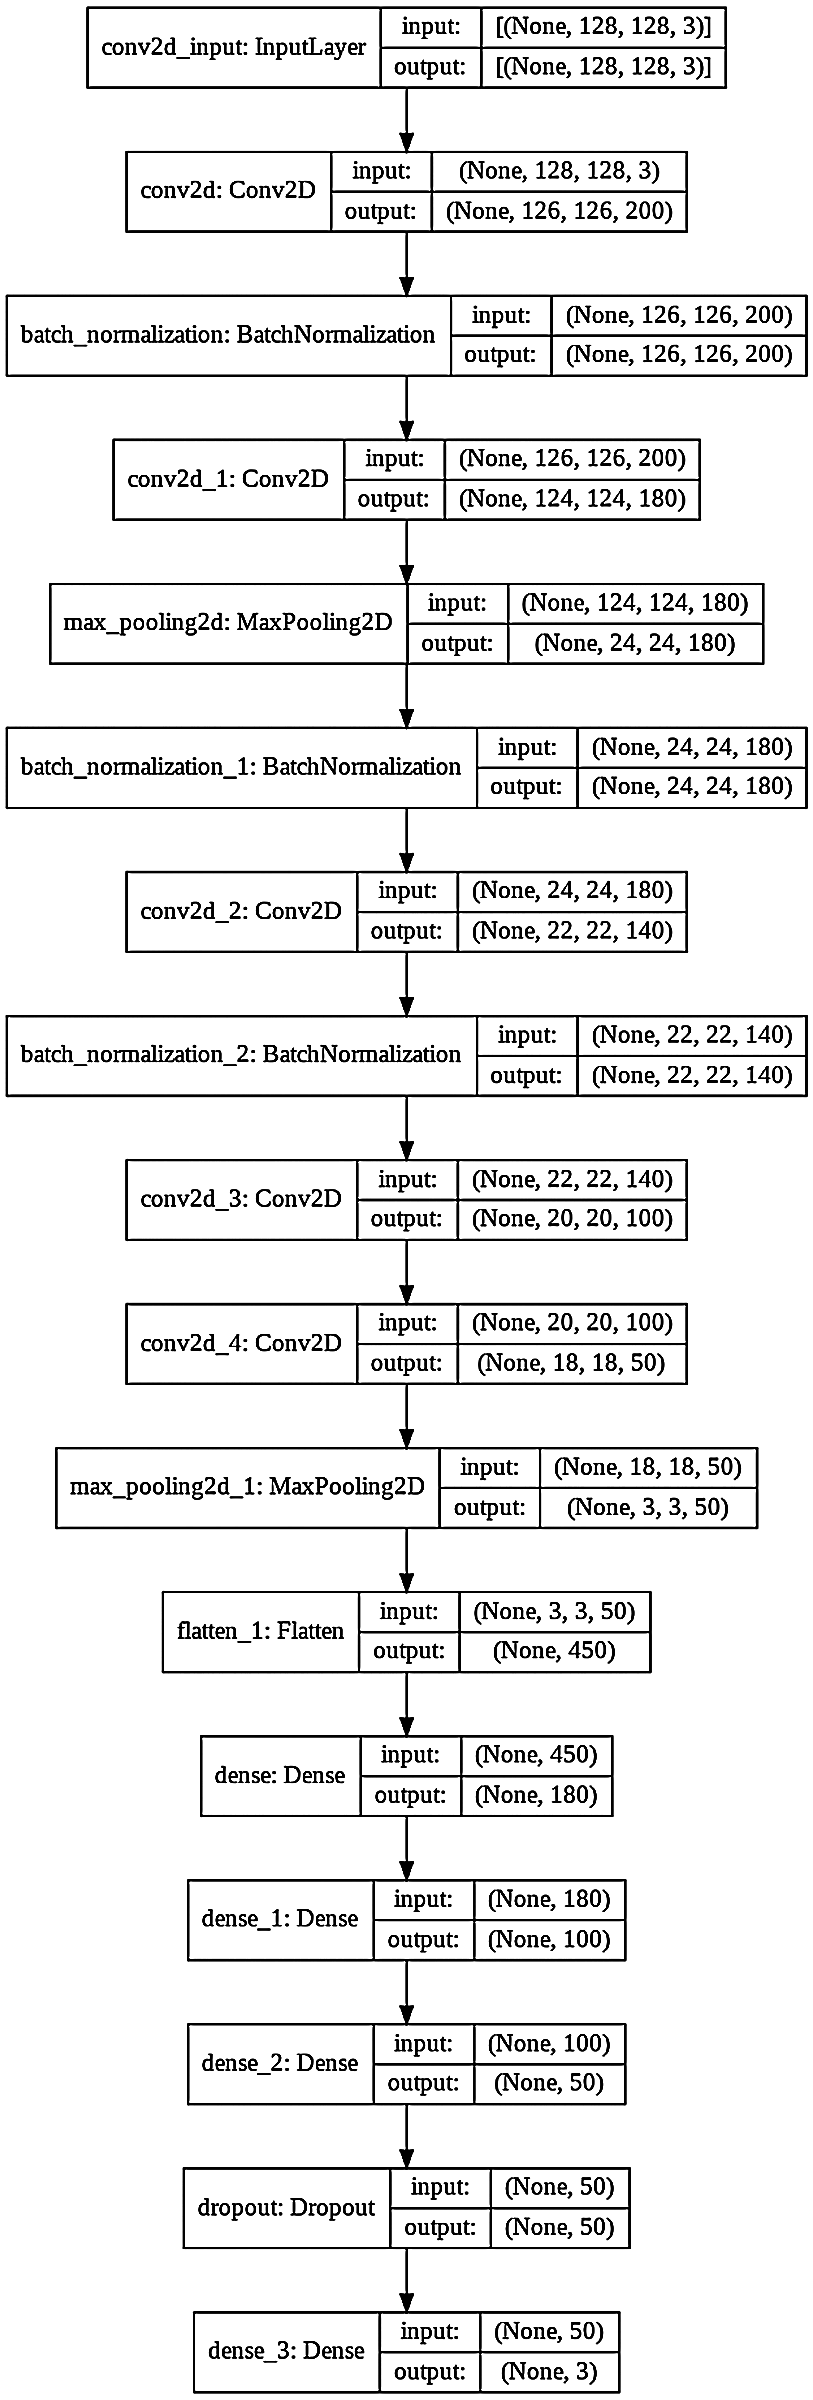
Figure 4: CNN model diagram
Convolution layers extract high-level features (detect hidden patterns) by application of a set of filters that extract useful information from an image. After the application of filters/kernels, the data is passed from the ReLU layer. ReLU sets all negative values of the convolved matrix to zero and retains positive values by using the max(a, 0) function. The processed data is inputted into another layer called the pooling layer. The pooling layer reduces the size of the inputs and speeds up processing. Different hyper-parameters at the pooling layer of the CNN model are filter size, stride, max, or average pooling. There can be n number of convolution and pooling layers in a CNN model. Fully connected layers are present at the end of a CNN model. Each node is connected to every node in the previous layer is fully connected layers. Fully connected layers are heavy data-driven layers of the CNN model. A fully connected layer performs the task of classification of the image into different classes in the output layer. The fully connected layers are also called dense layers of the CNN model to perform the task of image classification. The dropout layer is used to prevent the neural network from overfitting. Dropout is a powerful regularization [42] technique for neural networks. The softmax activation function is used at the output layer which produces a vector that represents the probability distribution of the possible output classes.
Fig. 4 displays the architecture of the proposed 16 layers CNN model. The proposed model has 5 convolution layers, 3 batch normalization layers, 2 max-pooling layers and 5 full connection layers. This proposed CNN model is trained for the diagnosis of plant leaf diseases.
4 Implementation, Performance and Discussion
To apply and evaluate the proposed approach along with other well-known state-of-the-art machine learning image classifiers for plant disease prediction we have used the python 3.7.10. The experiment was performed on Linux-5.4.109+-x86_64-with-Ubuntu-18.04-bionic using Google Colab and was accelerated by GPU Tesla P100-PCIE-16GB.
These models are trained for rice and potato datasets differently and then the model performance parameters are analyzed and compared. The proposed CNN model performed better than other classifiers for both rice as well as potato datasets. Tab. 2 presents the hyper-parameters configurations of the CNN model architecture is shown in Figs. 4 and 5.

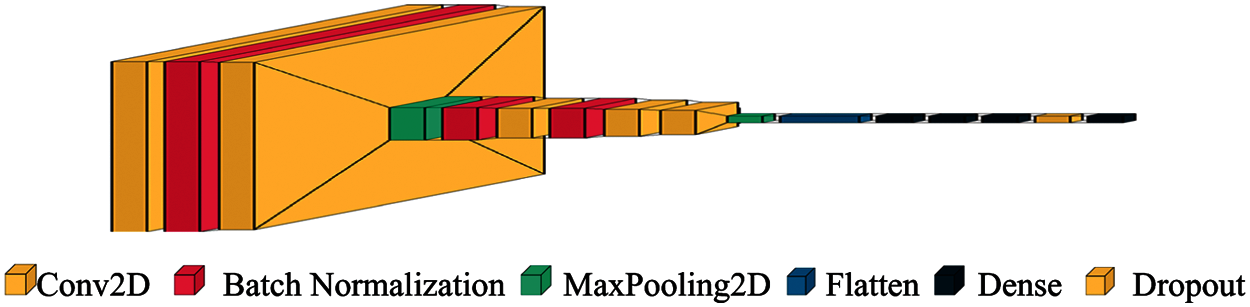
Figure 5: CNN architecture for image classification
In Deep Neural network makes accurate predictions by extracting useful features of the input image. Activation maps or feature maps are obtained by applying filters to the input image by each layer of the CNN model. Analysis of each layer's output activation maps will develop an understanding of the features extracted for a given image. Both filters and activation maps can be visualized to get an insight into the internal representation of the model for a specific input at a given layer. For a given input potato image, each layer of the model extracts features/activation maps as shown in Fig. 6.
As seen in Fig. 6 the first layer retains the full shape of the leaf retaining almost all the information or features of the initial inputted picture. Activations become less visually (by the human eye) interpretable as we analyze deeper layers. Deeper layers extract the features such as single borders, corners and angels. As a result, the deeper layers can extract more relevant information that is useful for image classification. The proposed CNN model is trained and validated. Adam optimizer of Keras with learning rate 0.0001, loss function = ‘sparse_categorical_crossentropy’ and metrics = ‘accuracy’ is used.
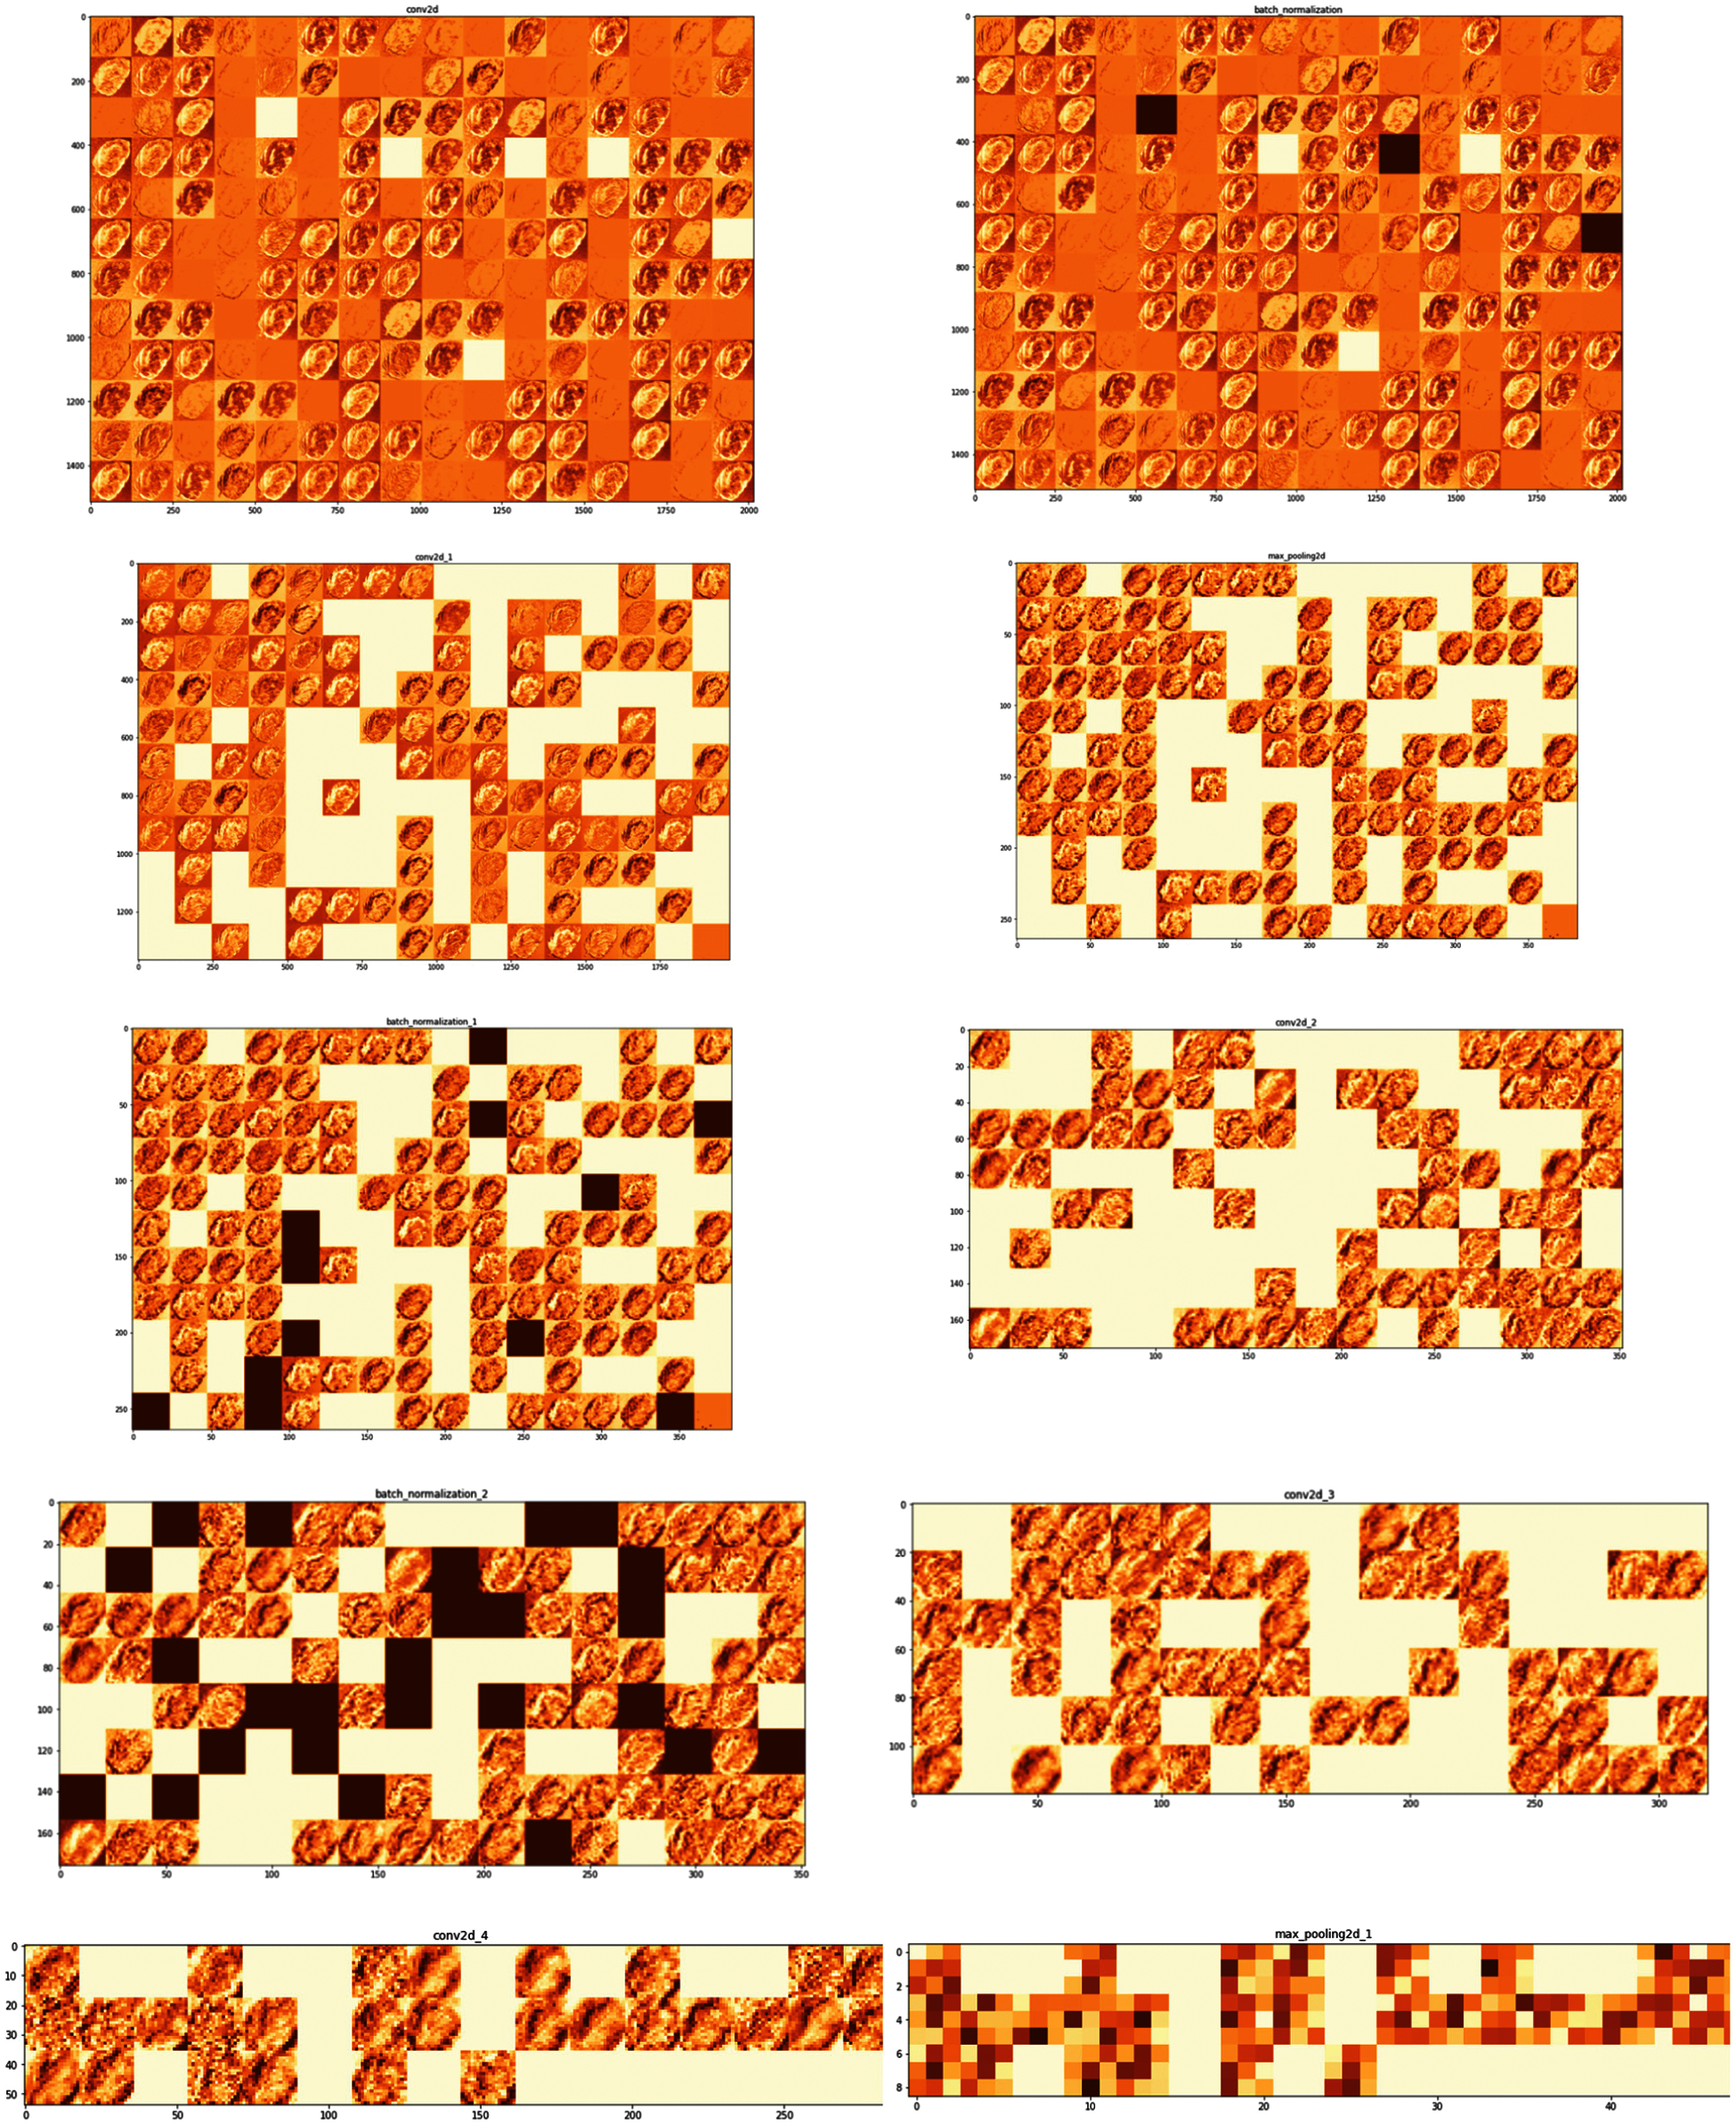
Figure 6: Feature maps extracted by different layers of the model
Training Graphs (Accuracy & Loss) of the Proposed CNN Model
The training-progress graphs for the designed CNN models trained using rice and potato datasets are shown in Figs. 7 and 8 respectively. Each graph represents model accuracy and loss for the respective models.
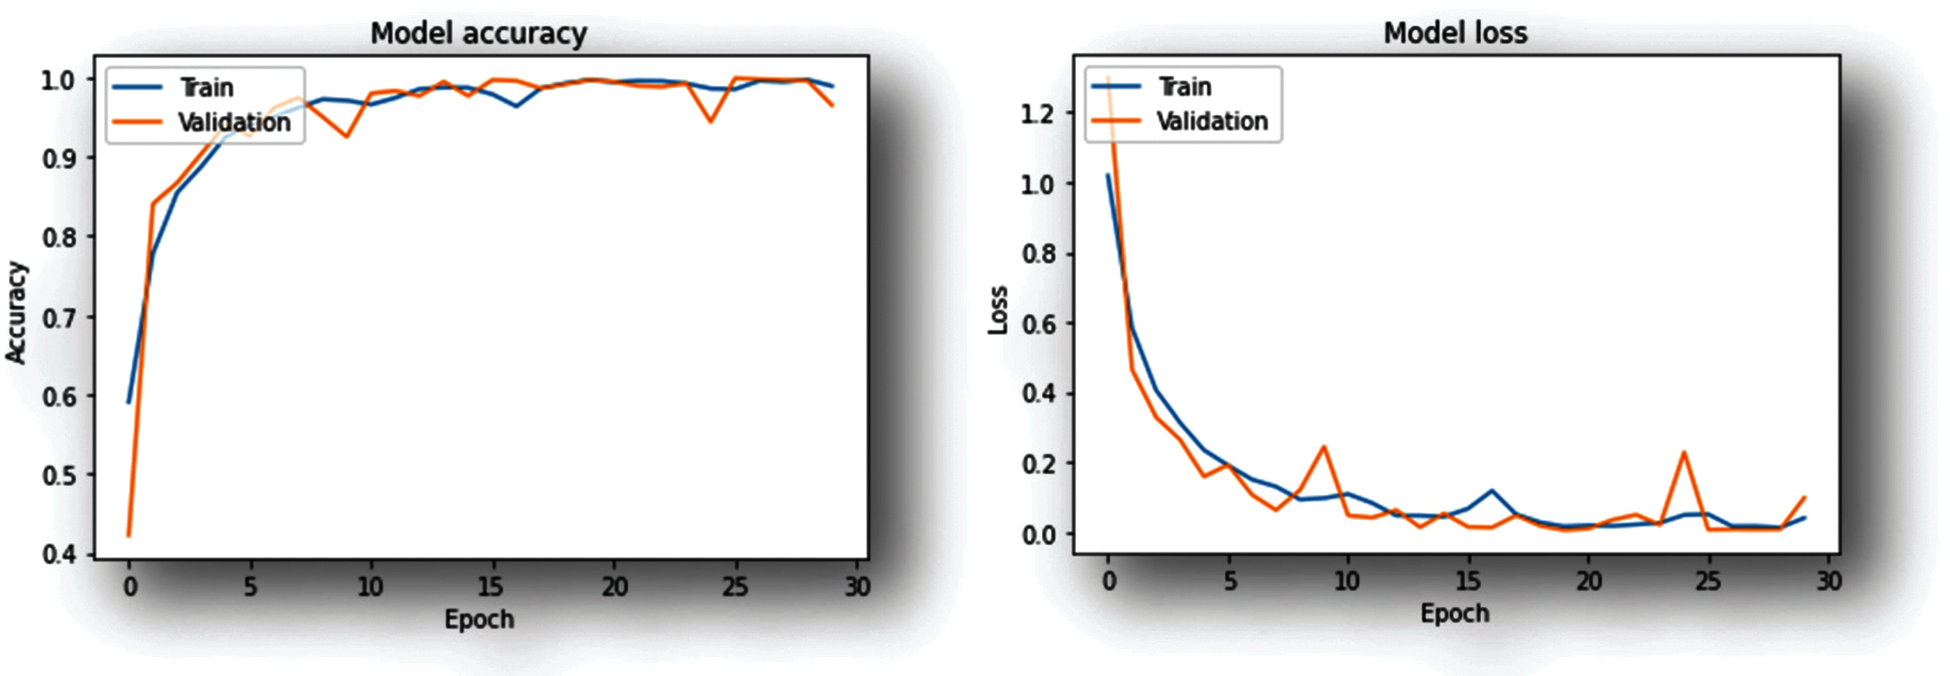
Figure 7: Training-progress graphs (CNN model trained with rice dataset)
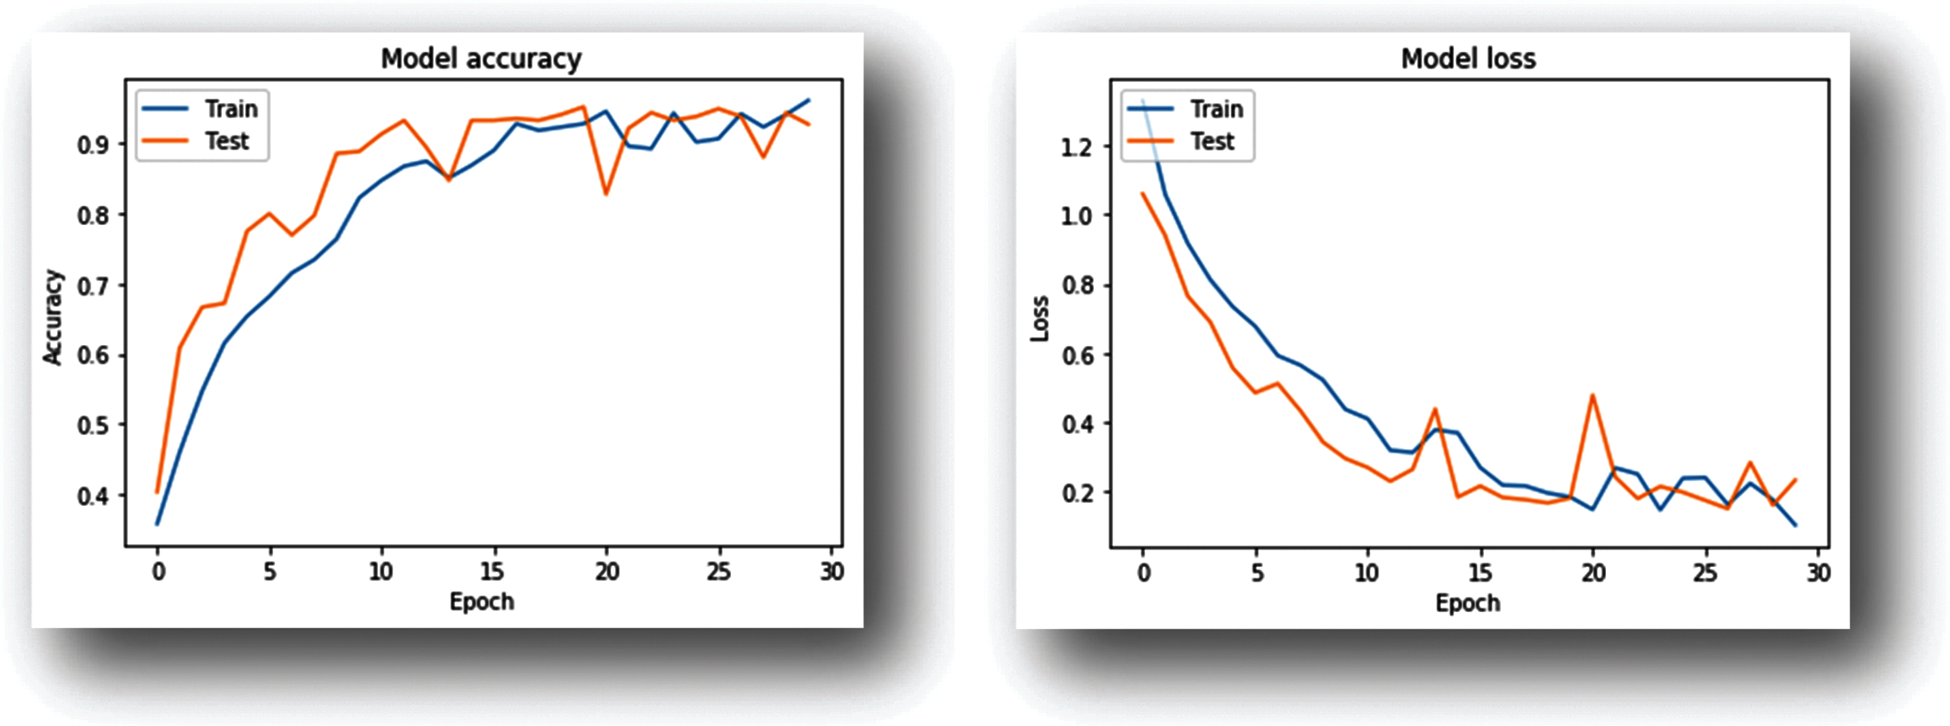
Figure 8: Training–progress graphs (CNN model trained with potato dataset)
As shown in the Graphs (Figs. 7 and 8) the accuracy improves with an increase in the number of iterations at the same time the model loss decreases. Both the training as well as validation accuracy are monitored to avoid overfitting. The model is trained for 30 epochs.
1)CNN model trained using rice dataset achieved 98.63% accuracy while executing 18th epoch.
2)For the Potato dataset CNN model during the 29th epoch achieved 97.33% validation accuracy.
For the Training CNN model with potato dataset 1200 images are used and a test set comprising of 300 images with 100 images per class for testing. Visualization of the output layer of the model trained on the potato dataset is shown in Fig. 9.
5 Performance Evaluation of Image Classification Techniques
In this study performance of different image classification models for rice and potato leaf disease datasets is analyzed. We have studied and measured the performance of these models in terms of accuracy, precision, recall and F1 score as shown in Tabs. 3 and 4. The confusion matrix is a table that gives information about how the test dataset performs on the trained model. Fig. 10 shows the confusion matrix of different classifiers applied for predicting rice diseases. Various performance measures like accuracy, precision, recall, or sensitivity and specificity of the model [43] can be calculated using the confusion matrix.


The diagonal values of the confusion matrix represent True positives (TP). For obtaining false negatives we have to add the values in the corresponding row items ignoring the true positive values. The total number of testing samples belonging to a given class can be calculated by the sum of all items of rows corresponding to that class (TP + FN). Similarly, the number of false positives (FP) for a class is obtained by adding the values of the corresponding column ignoring true positives TP for that class. The total number of true negative TN for a certain class will be the sum of all columns and rows values ignoring that class's column and row. Accuracy is defined and the sum of correct classifications divided by the total number of classifications. Sum of all diagonal elements divided by the sum of all items in the confusion metrics. Accuracy gives the overall correctness of the predicted model. Using the confusion matrix shown in Fig. 10 performance measures can be calculated using the equations from (1) to (6)
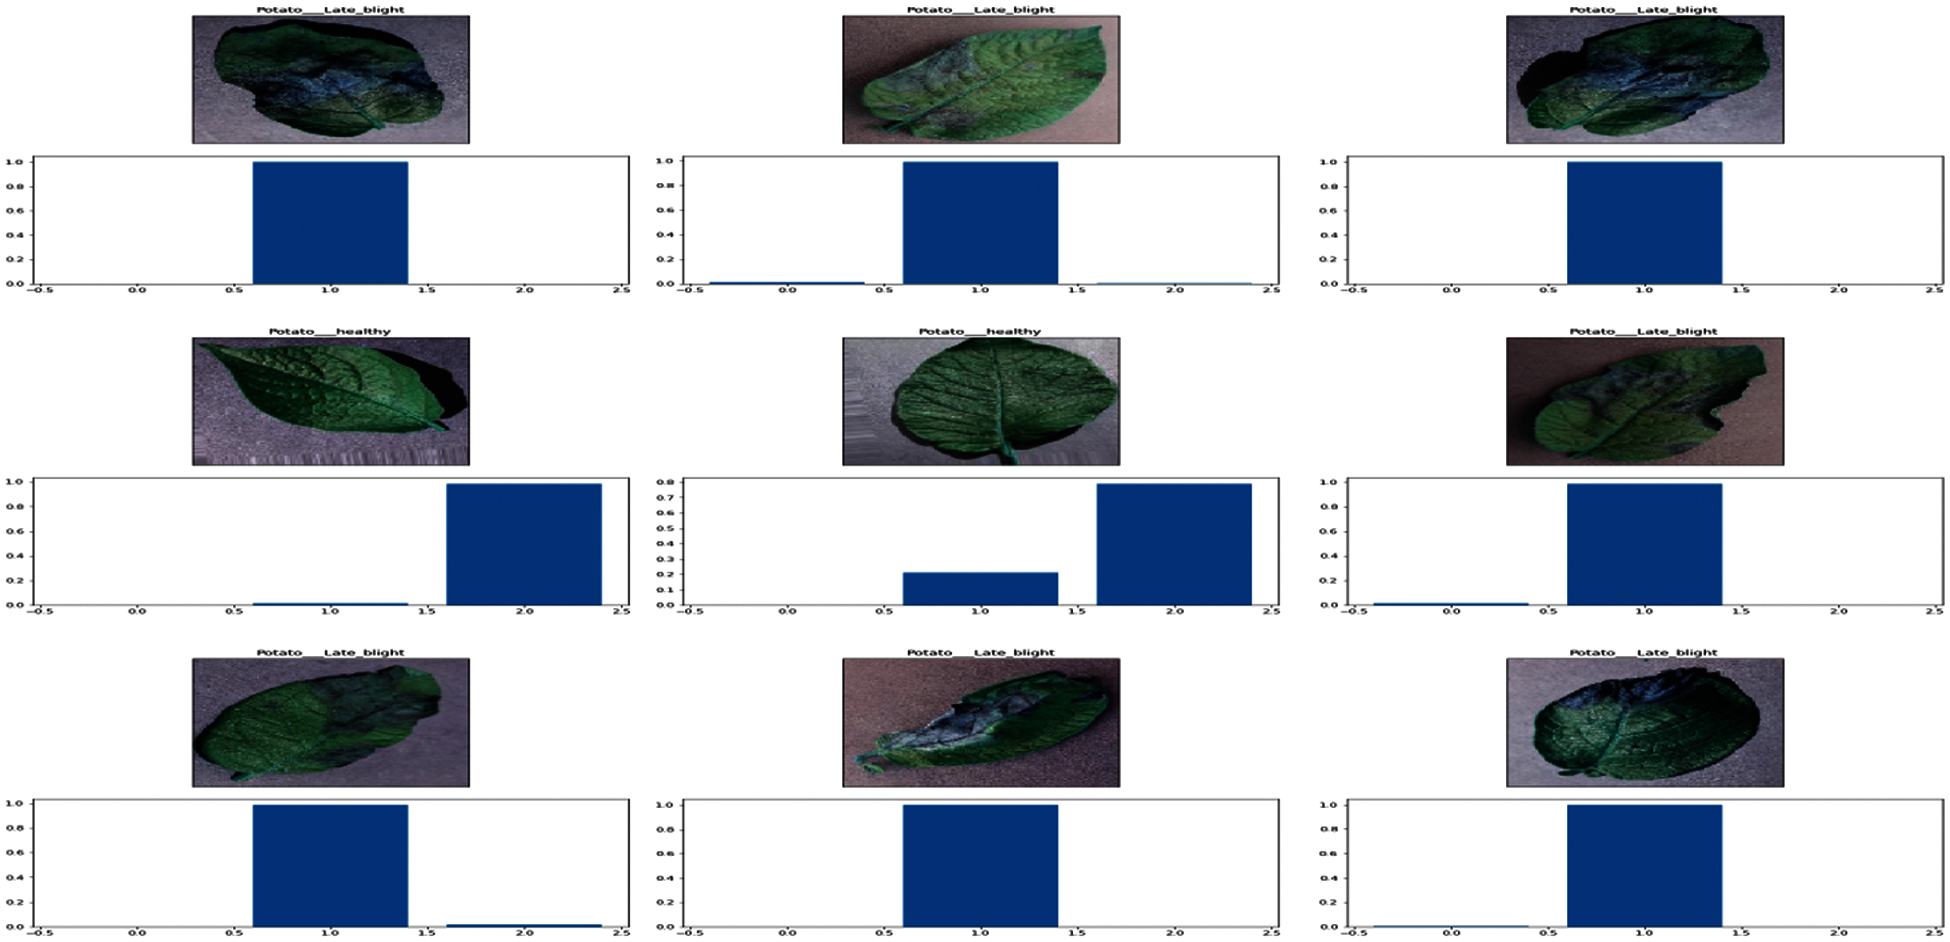
Figure 9: Probability distribution of the possible output classes
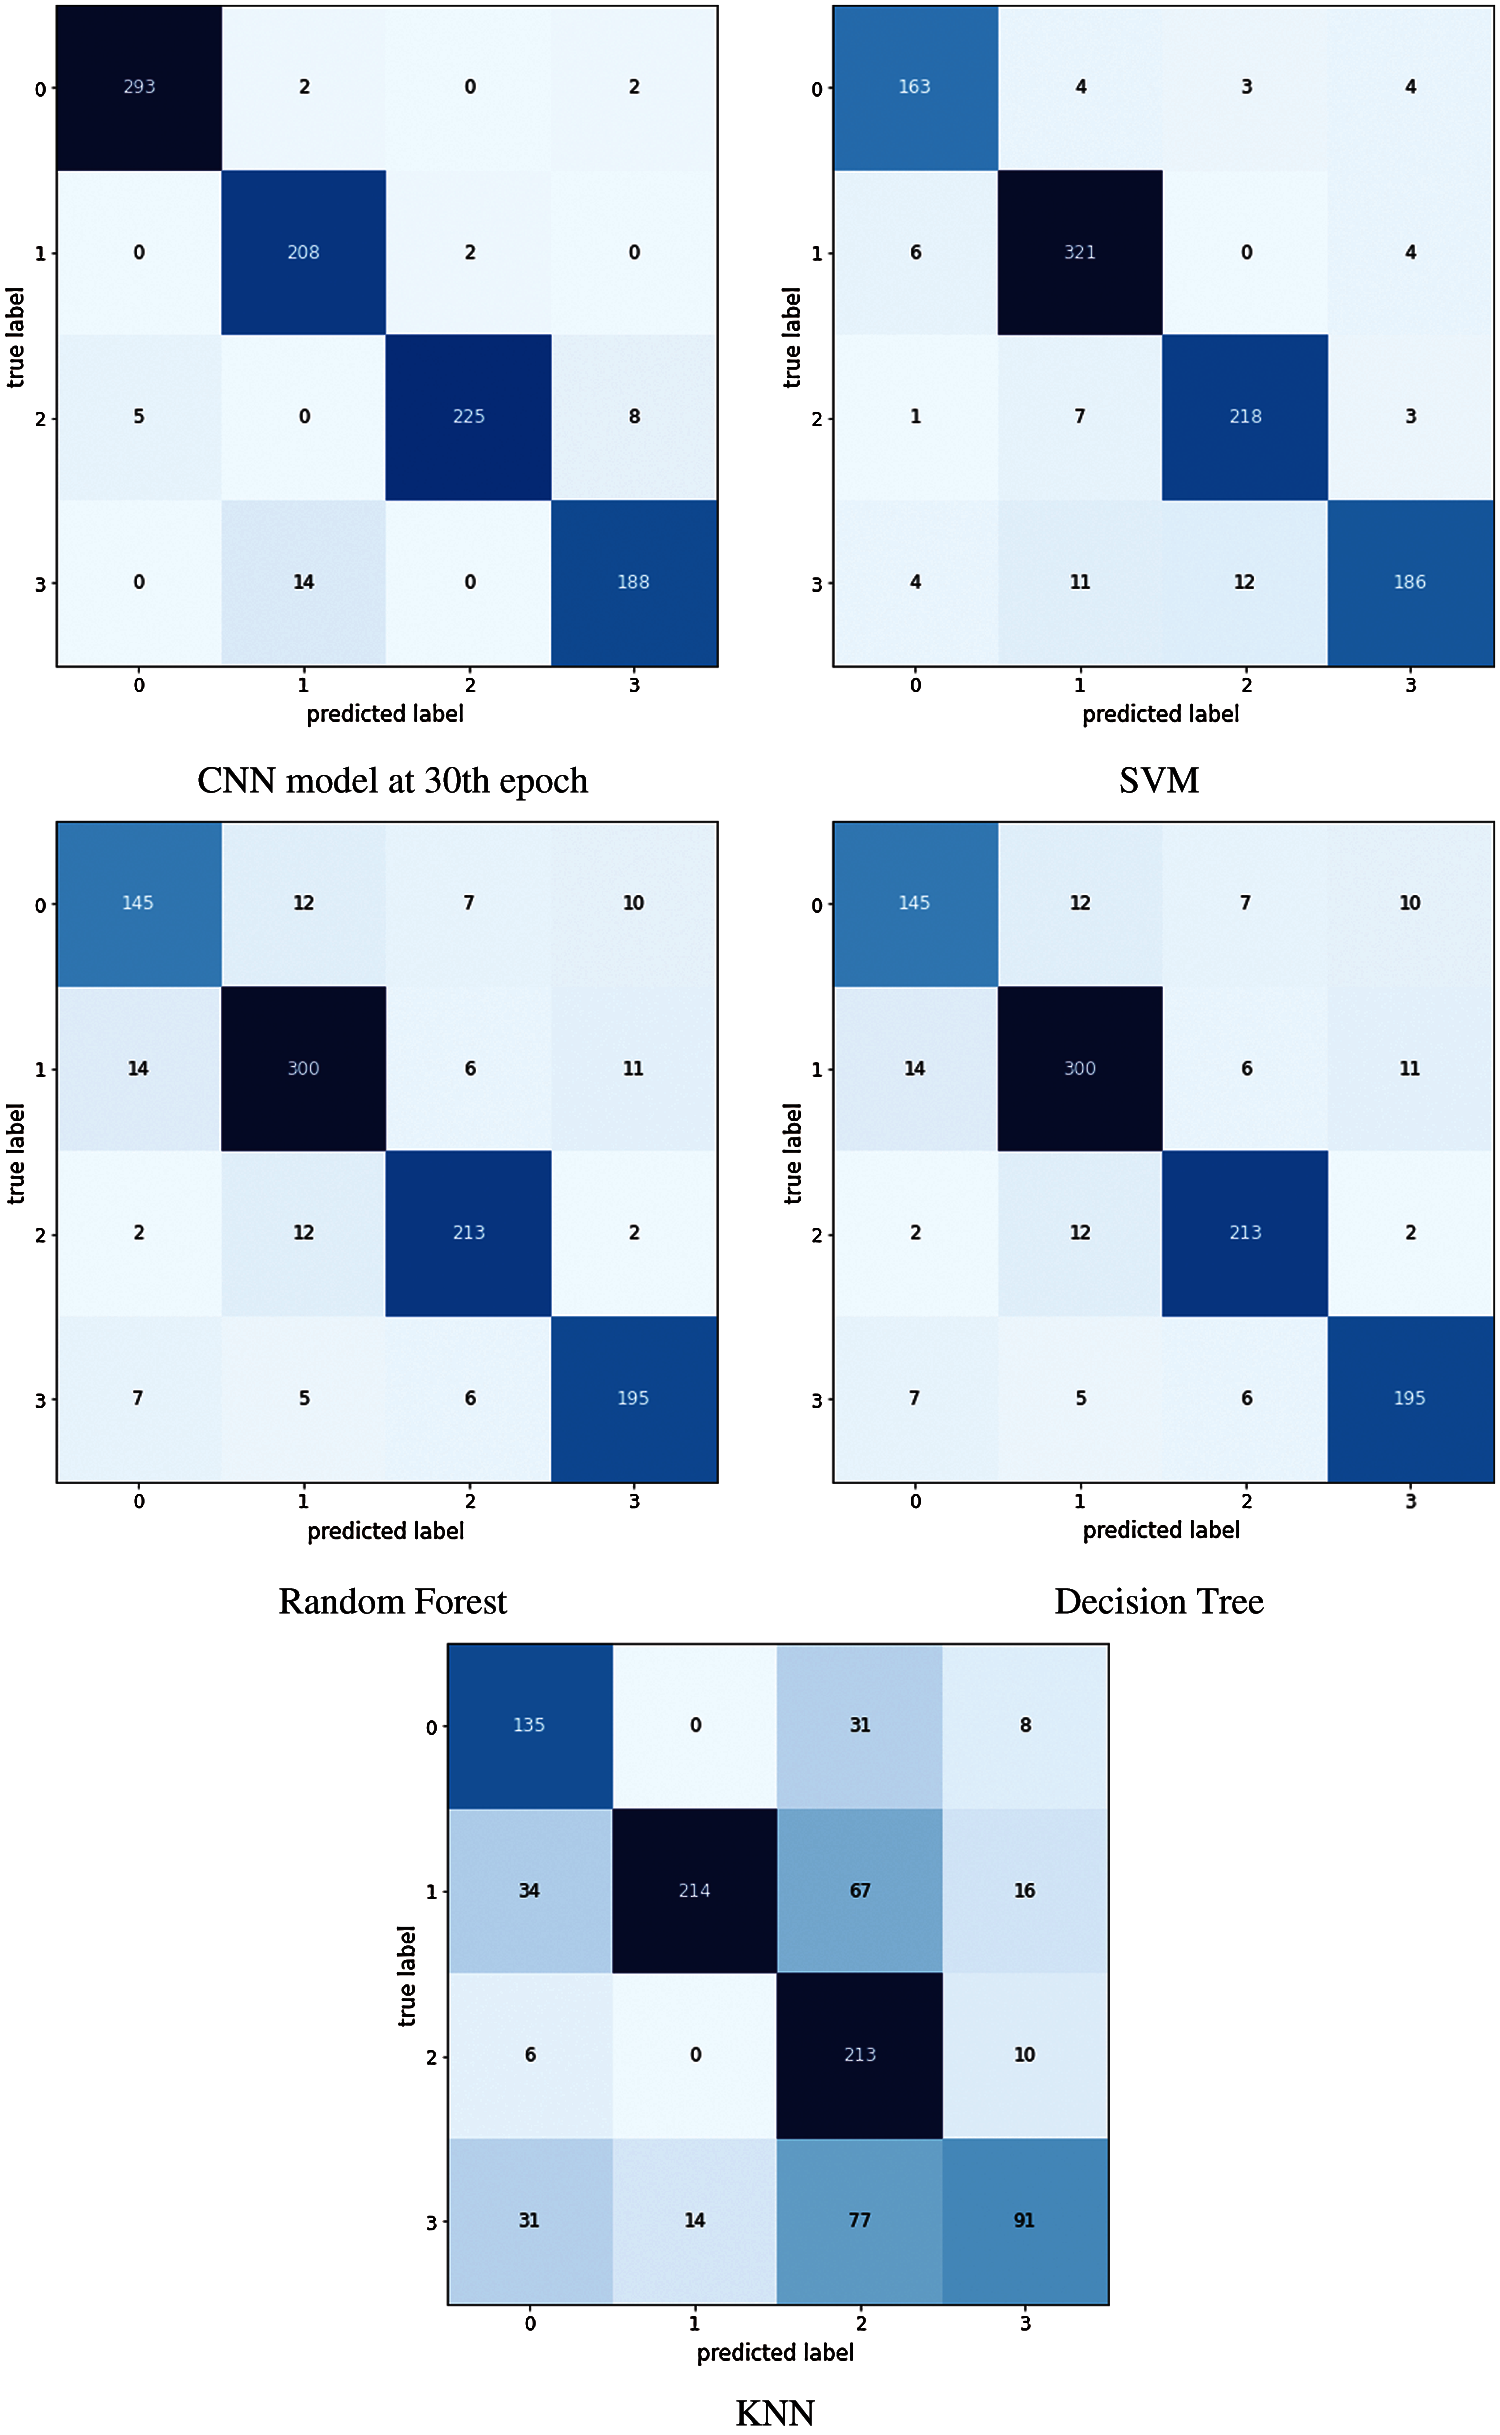
Figure 10: Confusion matrix obtained using different classifiers trained using rice dataset
This paper has proposed a CNN model for the identification of plant leaf diseases. The deep learning based CNN model was able to detect potato leaf disease with an accuracy of 97.66%. In this study, 5932 images of rice and 1500 images of infected and healthy leaves of rice and potato crop were used. The proposed deep learning CNN model demonstrated high accuracy and outperformed other state-of-the-art machine learning image classifiers like SVM, KNN, Decision Tree and Random Forest based on different performance parameters. Performance measures like accuracy, precision, F1 score, recall etc. were used for comparative study.
For future work, the hyper-parameters of the proposed CNN model like the number of the epoch, batch size, number of filters in each convolution layer, size of the filters, number of convolution layers, activation function for convolution layer, pooling after each convolution layer, number of fully connected layers, neurons per layer, etc. can be optimized using nature-inspired search and optimization algorithms. Optimized selection of these hyper-parameters can further increase the performance of the model.
Funding Statement: This research supported by KAU Scientific Endowment, King Abdulaziz University, Jeddah, Saudi Arabia under Grant Number KAU 2020/251.
Conflicts of Interest: The authors declare that they have no conflicts of interest to report regarding the present study.
1. T. Friedrich, “A new paradigm for feeding the world in 2050 the sustainable intensification of crop production,” Resource Magazine, vol. 22, no. 2, pp. 18, 2015. [Google Scholar]
2. J. E. V. D. Waals, L. Korsten and B. Slippers, “Genetic diversity among alternaria solani isolates from potatoes in South Africa,” Plant Disease, vol. 88, no. 9, pp. 959–964, 2004. [Google Scholar]
3. G. A. Secor and N. C. Gudmestad, “Managing fungal diseases of potato,” Canadian Journal of Plant Pathology, vol. 21, no. 3, pp. 213–221, 1999. [Google Scholar]
4. R. Sharma, S. Das, M. K. Gourisaria, S. S. Rautaray and M. Pandey, “A model for prediction of paddy crop disease using CNN,” in Progress in Computing Analytics and Networking, vol. 1119, pp. 533–543, 2020. [Google Scholar]
5. K. Kiratiratanapruk, P. Temniranrat, A. Kitvimonrat, W. Sinthupinyo and S. Patarapuwadol, “Using deep learning techniques to detect rice diseases from images of rice fields,” in Int. Conf. on Industrial, Engineering and other Applications of Applied Intelligent Systems, vol. 12144, pp. 225–237, 2020. [Google Scholar]
6. P. K. Sethy, N. K. Barpanda, A. K. Rath and S. K. Behera, “Deep feature based rice leaf disease identification using support vector machine,” Computers and Electronics in Agriculture, vol. 175, pp. 105527, 2020. [Google Scholar]
7. J. G. A. Barbedo, L. V. Koenigkan and T. T. Santos, “Identifying multiple plant diseases using digital image processing,” Biosystems Engineering, vol. 147, pp. 104–116, 2016. [Google Scholar]
8. K. P. Ferentinos, “Deep learning models for plant disease detection and diagnosis,” Computers and Electronics in Agriculture, vol. 145, pp. 311–318, 2018. [Google Scholar]
9. M. Brahimi, K. Boukhalfa and A. Moussaoui, “Deep learning for tomato diseases: Classification and symptoms visualization,” Applied Artificial Intelligence, vol. 31, no. 4, pp. 299–315, 2017. [Google Scholar]
10. W. Dawei, D. Limiao, N. Jiangong, G. Jiyue, Z. Hongfei et al., “Recognition pest by image-based transfer learning,” Journal of the Science of Food and Agriculture, vol. 99, no. 10, pp. 4524–4531, 2019. [Google Scholar]
11. A. Singh, P. Nath, V. Singhal, D. Anand, Kavita et al., “A new clinical spectrum for the assessment of nonalcoholic fatty liver disease using intelligent methods,” IEEE Access, vol. 8, pp. 138470–138480, 2020. [Google Scholar]
12. M. Agarwal, S. K. Gupta and K. K. Biswas, “Development of efficient CNN model for tomato crop disease identification,” Sustainable Computing: Informatics and Systems, vol. 28, pp. 100407, 2020. [Google Scholar]
13. M. M. Hasan, J. P. Chopin, H. Laga and S. J. Miklavcic, “Detection and analysis of wheat spikes using convolutional neural networks,” Plant Methods, vol. 14(1no. 100, pp. 1–13, 2018. [Google Scholar]
14. S. B. Patil and S. K. Bodhe, “Leaf disease severity measurement using image processing,” International Journal of Engineering and Technology, vol. 3, no. 5, pp. 297–301, 2011. [Google Scholar]
15. D. Oppenheim, G. Shani, O. Erlich and L. Tsror, “Using deep learning for image-based potato tuber disease detection,” Phytopathology, vol. 109, no. 6, pp. 1083–1087, 2019. [Google Scholar]
16. D. Oppenheim and G. Shani, “Potato disease classification using convolution neural networks,” Advances in Animal Biosciences, vol. 8, no. 2, pp. 244, 2017. [Google Scholar]
17. P. Jiang, Y. Chen, B. Liu, D. He and C. Liang, “Real-time detection of apple leaf diseases using deep learning approach based on improved convolutional neural networks,” IEEE Access, vol. 7, pp. 59069–59080, 2019. [Google Scholar]
18. R. R. Atole and D. Park, “A multiclass deep convolutional neural network classifier for detection of common rice plant anomalies,” International Journal of Advanced Computer Science and Applications, vol. 9, no. 1, pp. 67–70, 2018. [Google Scholar]
19. A. P. Singh, A. K. Luhach, S. Agnihotri, N. R. Sahu, D. S. Roy et al., “A novel patient-centric architectural framework for blockchain-enabled healthcare applications,” IEEE Transactions on Industrial Informatics, vol. 17, no. 8, pp. 5779–5789, 2021. [Google Scholar]
20. X. Zhu, M. Zhu and H. Ren, “Method of plant leaf recognition based on improved deep convolutional neural network,” Cognitive Systems Research, vol. 52, pp. 223–233, 2018. [Google Scholar]
21. M. Zhang, W. Li and Q. Du, “Diverse region-based CNN for hyperspectral image classification,” IEEE Transactions on Image Processing, vol. 27, no. 6, pp. 2623–2634, 2018. [Google Scholar]
22. A. Y. Nanehkaran, D. Zhang, J. Chen, Y. Tian and N. Al-Nabhan, “Recognition of plant leaf diseases based on computer vision,” Journal of Ambient Intelligence and Humanized Computing, pp. 1–18, 2020. [Google Scholar]
23. S. Wan and S. Goudos, “Faster R-cNN for multi-class fruit detection using a robotic vision system,” Computer Networks, vol. 168, pp. 107036, 2020. [Google Scholar]
24. P. Rani, Kavita, S. Verma and G. N. Nguyen, “Mitigation of black hole and gray hole attack using swarm inspired algorithm with artificial neural network,” IEEE Access, vol. 8, pp. 121755–121764, 2020. [Google Scholar]
25. C. Zhao, H. Zhao, G. Wang and H. Chen, “Improvement SVM classification performance of hyperspectral image using chaotic sequences in artificial bee colony,” IEEE Access, vol. 8, pp. 73947–73956, 2020. [Google Scholar]
26. A. Singh, S. Kumar, A. Singh and S. S. Walia, “Three-parent GA: A global optimization algorithm,” Journal of Multiple-Valued Logic & Soft Computing, vol. 32, pp. 407–423, 2019. [Google Scholar]
27. A. Singh, S. Kumar, A. Singh and S. S. Walia, “Parallel 3-parent genetic algorithm with application to routing in wireless mesh networks,” in Implementations and Applications of Machine Learning, Cham: Springer, vol. 782, pp. 1–28, 2020. [Google Scholar]
28. R. Sujatha, J. M. Chatterjee, N. Z. Jhanjhi and S. N. Brohi, “Performance of deep learning vs machine learning in plant leaf disease detection,” Microprocessors and Microsystems, vol. 80, pp. 103615, 2021. [Google Scholar]
29. F. Gao, S. Ji, J. Guo, Q. Li, Y. Ji et al., “ID-Net: An improved mask R-cNN model for intrusion detection under power grid surveillance,” Neural Computing and Applications, vol. 185, pp. 1–17, 2021. [Google Scholar]
30. S. Bhattacharya, A. Mukherjee and S. Phadikar, “A deep learning approach for the classification of rice leaf diseases,” in Intelligence Enabled Research, vol. 1109, pp. 61–69, 2020. [Google Scholar]
31. S. More, J. Singla, S. Verma, Kavita, U. Ghosh et al., “Security assured cnn-based model for reconstruction of medical images on the internet of healthcare things,” IEEE Access, vol. 8, pp. 126333–126346, 2020. [Google Scholar]
32. P. Lameski, E. Zdravevski, R. Mingov and A. Kulakov, “SVM parameter tuning with grid search and its impact on reduction of model over-fitting,” in Rough Sets, Fuzzy Sets, Data Mining, and Granular Computing, vol. 9437, pp. 464–474, 2015. [Google Scholar]
33. S. Yuanyuan, W. Yongming, G. Lili, M. Zhongsong and J. Shan, “The comparison of optimizing SVM by GA and grid search,” in 2017 13th IEEE Int. Conf. on Electronic Measurement & Instruments, pp. 354–360, 2017. [Google Scholar]
34. G. Xie, Y. Zhao, S. Xie, M. Huang and Y. Zhang, “Multi-classification method for determining coastal water quality based on SVM with grid search and KNN,” International Journal of Performability Engineering, vol. 15, no. 10, pp. 2618, 2019. [Google Scholar]
35. B. Tu, J. Wang, X. Kang, G. Zhang, X. Ou et al., “KNN-Based representation of superpixels for hyperspectral image classification,” IEEE Journal of Selected Topics in Applied Earth Observations and Remote Sensing, vol. 11, no. 11, pp. 4032–4047, 2018. [Google Scholar]
36. J. Guo and X. Wang, “Image classification based on SURF and KNN,” in 2019 IEEE/ACIS 18th Int. Conf. on Computer and Information Science (ICISpp. 356–359, 2019. [Google Scholar]
37. V. Wasule and P. Sonar, “Classification of brain MRI using SVM and KNN classifier,” in 2017 Third Int. Conf. on Sensing, Signal Processing and Security (ICSSSpp. 218–223, 2017. [Google Scholar]
38. V. Singhal, S. S. Jain, D. Anand, A. Singh, S. Verma et al., “Artificial intelligence enabled road vehicle-train collision risk assessment framework for unmanned railway level crossings,” IEEE Access, vol. 8, pp. 113790–113806, 2020. [Google Scholar]
39. A. Gandam, J. S. Sidhu, S. Verma, N. Z. Jhanjhi, A. Nayyar et al., “An efficient post-processing adaptive filtering technique to rectifying the flickering effects,” PLoS ONE, vol. 16, pp. 1–20, 2021. https://doi.org/10.1371/journal.pone.0250959. [Google Scholar]
40. P. K. Sethy, “Rice leaf disease image samples,” Mendeley Data, no. V1, 2020. [Google Scholar]
41. S. Yu, S. Jia and C. Xu, “Convolutional neural networks for hyperspectral image classification,” Neurocomputing, vol. 219, pp. 88–98, 2017. [Google Scholar]
42. S. H. Khan, M. Hayat and F. Porikli, “Regularization of deep neural networks with spectral dropout,” Neural Networks, vol. 110, pp. 82–90, 2019. [Google Scholar]
43. A. Tripathy, A. Agrawal and S. K. Rath, “Classification of sentimental reviews using machine learning techniques,” Procedia Computer Science, vol. 57, pp. 821–829, 2015. [Google Scholar]
 | This work is licensed under a Creative Commons Attribution 4.0 International License, which permits unrestricted use, distribution, and reproduction in any medium, provided the original work is properly cited. |