DOI:10.32604/cmc.2022.021218
| Computers, Materials & Continua DOI:10.32604/cmc.2022.021218 | |
| Article |
LDSVM: Leukemia Cancer Classification Using Machine Learning
1Department of Computer Science & Electronics, Universitas Gadjah Mada, Yogyakarta, 55281, Indonesia
2Department of Artificial Intelligence, The Islamia University of Bahawalpur, Bahawalpur, 63100, Pakistan
3Division of Information & Computer Technology, College of Science & Engineering, Hamad Bin Khalifa University, Doha, 5825, Qatar
*Corresponding Author: Azhari Azhari. Email: arisn@ugm.ac.id
Received: 27 June 2021; Accepted: 09 October 2021
Abstract: Leukemia is blood cancer, including bone marrow and lymphatic tissues, typically involving white blood cells. Leukemia produces an abnormal amount of white blood cells compared to normal blood. Deoxyribonucleic acid (DNA) microarrays provide reliable medical diagnostic services to help more patients find the proposed treatment for infections. DNA microarrays are also known as biochips that consist of microscopic DNA spots attached to a solid glass surface. Currently, it is difficult to classify cancers using microarray data. Nearly many data mining techniques have failed because of the small sample size, which has become more critical for organizations. However, they are not highly effective in improving results and are frequently employed by doctors for cancer diagnosis. This study proposes a novel method using machine learning algorithms based on microarrays of leukemia GSE9476 cells. The main aim was to predict the initial leukemia disease. Machine learning algorithms such as decision tree (DT), naive bayes (NB), random forest (RF), gradient boosting machine (GBM), linear regression (LinR), support vector machine (SVM), and novel approach based on the combination of Logistic Regression (LR), DT and SVM named as ensemble LDSVM model. The k-fold cross-validation and grid search optimization methods were used with the LDSVM model to classify leukemia in patients and comparatively analyze their impacts. The proposed approach evaluated better accuracy, precision, recall, and f1 scores than the other algorithms. Furthermore, the results were relatively assessed, which showed LDSVM performance. This study aims to successfully predict leukemia in patients and enhance prediction accuracy in minimum time. Moreover, a Synthetic minority oversampling technique (SMOTE) and Principal compenent analysis (PCA) approaches were implemented. This makes the records generalized and evaluates the outcomes well. PCA reduces the feature count without losing any information and deals with class imbalanced datasets, as well as faster model execution along with less computation cost. In this study, a novel process was used to reduce the column results to develop a faster and more rapid experiment execution.
Keywords: Leukemia; GSE9476; cancer; genes; classification; machine learning; ensemble LDSVM classifier
Leukemia is the most common type of blood cancer in all age groups, particularly in children. This abnormal concept is caused by increased blood cell proliferation and immature growth, which can harm red blood cells, brain tissue, and the immune system. A cell is instructed by the genetic code when to reproduce and when to die. For cancer to occur, changes in gene expression may lead to defective instructions. The production of proteins is also affected by cells because they are under the control of cells [1]. Some genes modify proteins to fix damaged cells, which may be related to cancer. If parents have these mutations, they may be inherited by their offspring. There are some genetic variations at birth, and the risk increases after lifestyle factors, such as smoking and exposure to the sun. Chemical signaling changes contribute to cancer, which dictates how the body uses the genetic material deoxyribonucleic acid (DNA). For certain cancers, a person may inherit a physical predisposition. The most significant step towards drug design and discovery is the detection of a disease that leads to the development of pharmaceutical therapies. The primary goal of gene identification and classification of the genome's diseased genes is to identify any non-disease genes. The diagnosis of a disease is critical in medicine and pharmacology to determine the best treatment method. Observing the genes associated with the disease is the first step in coping with inherent disorders. Genetic abnormalities arise because of anomalies in single genes or gene regions. Because of the numerous genes, classifying disease-related genes is a complicated task in machine learning.
Cancer is a widely defined concept that a degenerative disease occurs when cellular changes induce the uncontrolled growth and division of cells. Some cancers cause cells to overgrow, while other cancers cause cells to develop and split more rapidly. Some cancer types may result in noticeable growths called tumors, while others do not, such as leukemia. Most hematologic cancers start in the bone marrow. Blood cancers occur when abnormal blood cells start growing out of control, interrupting normal blood cell function, fighting off infection, and producing new blood cells. There are about a hundred different types of cancer. The three main types of blood cancers are leukemia, myeloma, and lymphoma. Blood and bone marrow cancers are called leukemias, which begin in the blood-forming tissue of the bone marrow. These forms of cancer are not solid tumors that develop [2]. Instead, large numbers of dysfunctional white blood cells (leukemia cells and leukemia blast cells) become so crowded that they do not have the space to live in the blood and bone marrow. Low red blood cells can make it more difficult for the body to obtain the oxygen required into its tissues, regulate blood loss, or combat infections. The four types of leukemia vary from each other, grouped according to how rapidly cancers evolve (acute or chronic) and how leukemia develops, which type of blood cells it begins with (lymphoblastic or myeloid). Acute myelogenous leukemia (AML), acute lymphocytic leukemia (ALL), chronic myelogenous leukemia (CML), and chronic lymphocytic leukemia (CLL) are the four major forms of leukemia.
Machine learning algorithms are techniques used for the identification and treatment of leukemia. This study represents the decision tree (DT), support vector machine (SVM), linear regression (LinR), naive Bayes (NB), random forest (RF), gradient boosting classifiers (GBM), and proposed ensemble LDSVM (LR + DT + SVM) machine learning algorithms used to identify leukemia in its subtypes, and presents a comparative analysis of these algorithms [3]. The DNA microarrays of the Leukemia GSE9476 cell-based dataset were collected from the Kaggle benchmark dataset repository. This dataset consists of 22285 genes associated with five different leukemia types, namely bone_marrow_CD34, bone marrow, AML, PB, and PBSC_CD34. The feature vectors of the dataset were split into two partitions, training data, and testing data, with ratios of 80% and 20%. Various machine learning algorithms have been applied to the training and prediction processes, and different experiments are performed by tuning the hyperparameters. The structure of the experimental prototype is designed based on the assumption that the proposed approach can be easily implemented with any other dataset without any manual setups. The focus is on the development of a portable, exible, and efficient method for cancer classification. The ensemble LDSVM model presents promising results that outperform other machine-learning algorithms [4]. This model is embedded with k-fold cross-validation, and grid search optimization techniques, which makes it more efficient and improves the accuracy results. The performance of the proposed novel classification approach for leukemia cancer is based on the composition of multiple components, such as k-fold cross-validation, grid-search optimization, and ensemble LDSVM which are evaluated through different scientific measures such as accuracy, precision, recall, and F1-score. The classification of leukemia cancer based on the proposed approach, is shown in Fig. 1. The contributions of this study areas follows.

Figure 1: Classification of leukemia cancer based on proposed approach
• The proposed study aims to classify leukemia cancer in patients with the highest prediction accuracy and quick response to help doctors treat patients properly and save their lives.
• The microarray of DNA genes was used as a dataset that consisted of 22285 genes associated with leukemia cancer patients and seven different machine learning models were applied to carry out the experiments with the Leukemia dataset to analyze the effects.
• The proposed approach consists of an ensemble LDSVM model that has its own novelty because of its structure with k-fold cross-validation and grid search optimization, as shown in Fig. 5. A novel LDSVM ensemble model is proposed in this study to enhance the performance and prediction accuracy.
• The proposed approach and the effects of machine learning algorithms were analyzed using evaluation parameters such as accuracy, precision, recall, and F1-score. Furthermore, comparative analyses were performed to illustrate the transparent and promising results of the proposed approach.
Principal component analysis (PCA) is a technique for performing adaptive data analysis. Moreover, it is adaptive in another sense, in that several variants of the technique have been developed and adopted to diverse data categories and structures. The synthetic minority oversampling technique (SMOTE) strategy used to deal with imbalanced datasets is to oversample the minority class in the first place. This is a type of data augmentation method. The simplest technique consists of duplicating examples from the minority class, despite the fact that these examples do not provide any new information to the model. Instead, new examples can be created by combining the elements of the current example. SMOTE and PCA techniques were employed for the generalization of records and predictions and for coping with class imbalanced datasets. The remainder of this paper is organized as follows. The relevant works addressed in this domain are presented in Section 2. The methodologies used in Section 3's experimental outcomes and interpretation are analyzed in Sections 4 and 5, and the paper is concluded in Section 6.
Data mining plays an essential role in predicting various types of Infections. Microarray technology provides recent advances in the capacity to calculate thousands of gene expressions at the exact moment. Such data analysis allows us to detect various clinical findings triggered by a few predictive genes countenance. The extraction and description of functions are conducted with the high precision of ensemble-based algorithms and a single understanding of linear regression. These allow exact rules to be extracted by describing gene expression differences between significantly expressed leukemia genes [5]. Different classification algorithms for comparison criteria such as being regulated or unmonitored, if they are operating on tiny or massive databases, binary classifier or not if huge numbers will function the dimensions can be linearly divided and obtain precision. Leukemia is a disease that affects the bone marrow and blood. Manual processing of information is time-consuming and not precise. There have been attempts to build partial/fully automated cell segmentation and classification-based systems, but they are still in the demonstration process. Several existing mechanical systems collect sub-image functionality [6]. In a study of microarray expression data from patients with systemic lupus erythematosus and PAPS, two autoimmune disorders of unknown genetic origin have several standard features. They employed an innovative statistical method for gene selection based on machine learning approaches, which included a combination of three policy discretization steps, a system of consensus selection, and multi-variable measurements of correlations. Different methods are available for the classification of cancer based on gene selection using microarray datasets. However, most of these studies did not consider detecting the minimum number of genes with high classification accuracy [7].
A voting classifier model was suggested by [8] to improve classification accuracy by integrating several classifiers' predictions. Using CART, CHAID, and QUEST classifications, the performance measure gains precision, accuracy, specificity, and sensitivity measured for handling ionosphere data. The experimental results concluded that 93.84 percent of the test data selection achieved complete accuracy for the ensemble model with the choice of functions. The authors [9] collected oral data from different diagnostic centers that housed patients with and without cancer. The data obtained and information were preprocessed for replication, and the details are incomplete. They then used various algorithms for the classification of the NMDS dataset and analyzed the algorithms. The obtained classification rate was 100% for the C4.5 algorithm and 98.7% for the random forest algorithm. A study on an automated cell count was used in the methodology of the research [9]. The explanatory method for automatic segmentation of white blood cells is discussed here. Next, the blood smear a priori data images often come from a simple threshold approaching the algorithm’s law. To obtain critical results, the marks were modified. This technique utilizes details of the composition of blood cells. In contrast to the ancient methods of using local context data, this technique is also valuable. When they perform proper segmentation, they have sharp boundaries for white blood cells.
Chandrasekar et al. submitted actual classification technical. After reviewing various classifications, algorithms have selected six simulation-based classifiers in which the tree random classifier reaches an accuracy gain of 98 percent, which is a highly significant classification accuracy [10]. Compared with various supervised algorithms, the best algorithms for classifiers were predicted. Experimental studies proved the viability of the proposed method. The template was tested with precision and recall. It was discovered that all other high-accuracy algorithms outperformed the random trees of different classification techniques. The nature of critical life-threatening clinical investigations, like breast [11] cancer, has been defined by an effective classifier. Voting classifiers can easily understand the approach and strategy for classification. Each element of the classification ``votes'' in an unweighted voting classifier community membership according to an uncertain sample and the feature value of which group is nearest. Voting by plurality/more wins. Voting classifiers were used and tested sporadically for application in gene expression data.
Ancona et al. [12] discuss colon cancer gene tumors in their research. These findings indicate that the voting categories generate the best results for another individual classifier. Classification of cancer implies model building on datasets, including datasets for the expression of microarray genes and then differentiating the class value into each case in the sample by generating the model. Diagnostic findings may enable doctors to follow the appropriate therapy protocol for patients, particularly in the early diagnosis and treatment period. Many classification techniques have recently been developed for machine learning and have been introduced in cancer classification [13]. Survival increases from 56 percent to more with an early and correct cancer diagnosis, decreasing the death rates by 86 percent in early diagnosis and treatment [14]. Therefore, an effective and reliable system is needed for the early diagnosis of cancer. The microarray data set's analysis and classification method have firmly proven that they provide an efficient way to diagnose diseases effectively, particularly in cancers.
Furthermore, the microarray may be used to calculate at once in a cell assortment expression levels of a significant number of genes. Finally, the performance of the microarray was determined using microarray data. Data from gene expression is another popular micro-array data name. The word “ensemble learning” is used to generate a cooperative procedure using algorithms and tools in the computer and other fields. Multiple learners were more successful than individual learners. Together, learning can increase flexibility and improve outcomes in many areas, such as disease diagnostics, finance, bioinformatics, healthcare, factory development, and geography [15]. By integrating classifiers using ensemble learning techniques, the precision and diversity of each classification can improve the generalization capability. Ensemble learning is also an excellent way to address the issue of class imbalances [16]. In addition, a previous study [17] suggested. All these classifiers perform well in microarray data and come from various algorithm classifications, which means that they belong to multiple practices, that is, instability, probabilism, and stability. For example, the SVM algorithm is used to identify blood sampling as acute lymphoblastic Leukemia and acute myeloid Leukemia in the lymphoid stem and myeloid stem cells. The accuracy achieved by SVM [18] was 92%. The results show that logistic regression (LR) is a perfect algorithm compared to other algorithms used in classification and projection datasets. This experiment, and therefore must be noted that to our knowledge, this is the first time this dataset is used to classify logistic regression after the data set has been preprocessed, with an optimum speed of precision, accuracy, exactness, retrieval, and F1 ranking [19].
The leukemia cancer classification was proposed using the LDSVM classifier. The aim of this study was successfully achieved, which consists of the designed methodology and relative algorithms. This section describes the dataset used for the classification algorithms and proposed methods.
The dataset was obtained from a famous benchmark dataset repository Kaggle based on the Gene Expression Omnibus (GEO) dataset associated with the Curated Microarray Database (CuMiDa) repository containing 78 hand-picked cancer micro-arrange datasets and widely curated from over 30,000 studies. CuMiDa aims to provide homogeneous and advanced biological preprocessed forms of these datasets along with numerous 3-fold benchmark validation findings to propel machine studies aimed at the investigation of cancer.
Fig. 2 demonstrates the genes dataset presentation on five different variables, AML variable is higher in comparison with other features. Other features do not provide adequate partition, or the functionality of certain mechanisms is limited to particular leukemia cancers. The leukemia cancer based dataset was used with the code name GSE9476. The DNA gene microarray dataset consists of 22285 genes and five different leukemia types such as Bone_Marrow_CD34, Bone_Marrow, AML, PB, and PBSC_CD34. Fig. 3 presents samples of genes associated with a dataset that illustrates the different gene variations in DNA microarrays.

Figure 2: Leukemia GSE9476 genes dataset presentation based on five different types

Figure 3: Variations of different gene’s data presentation based on classes
3.2 Classification Algorithms Used in Leukemia
Classification separates the data samples into target groups. For each data point, the classification technique provides the target class. Data classification is a controlled learning approach that establishes the class category [20]. The dataset was divided into training and testing datasets. Classifiers were used to train the classification accuracy based on the testing dataset. Classification in the medical field is one of the most effective data-mining methods. However, the prediction accuracy of these methods varies depending on the classification algorithm used. It is challenging to find the best algorithm for classification from all available. This study proposes an exhaustive study of various classification algorithms. The assessment success with leukemia dataset for accuracy employed different classification methods to analyze microarray data such as DT, NB, RF, GBM, LinR, SVM, and ensemble LDSVM (LR + DT + SVM) approach [21].
In Support Vector Machine (SVM), a hyperplane divides the entire space of the dataset by maximizing the class margin. A classifier training algorithm seeks the help vectors [22]. As a non-parametric technique, SVM regression relies on a set of mathematical functions. The kernel converts the 2D data entries into a 3D shape to efficiently classify and handle the outliers. SVM solves regression problems with a linear function and maps the input vectors to an n-dimensional space called a function space when dealing with nonlinear regression problems.
One of the most common and powerful data-mining techniques is the decision tree (DT). Many researchers have developed and tested this methodology well. In addition, data errors are also found in the learning process. Thus, it is crucial to work with large data volumes to achieve a decision tree algorithm that can generate a simple tree structure with high classification accuracy. In this study, we selected a dataset from Kaggle to run the decision tree algorithms. The choice of strategic division has a significant effect on the accuracy of a tree. The decision criteria are different for the classification and regression.
The entropy is expressed mathematically for 1 attribute by:
Entropy is expressed mathematically for several attributes as:
IG is defined mathematically by:
Random Forest (RF) is a tree-based ensemble model that makes predictions highly precisely based on the combination of several decision trees [23]. The bagging technique is employed in this model to train several decision trees on different samples of bootstraps [24]. In the RF sample, the training dataset with substitution is sub-sampled and is similar in size to the sample in the training dataset [25]. In their prediction processes, random forest and other classifiers use the same techniques for building decision-making bodies. Defining the attributes of the root node at each stage is a significant challenge in their development.
Logistic regression (LR) is an approach to mathematical knowledge processing in which a solution is found using one or more variables. Logistic regression is the type of regression used to predict class members' probabilities because if the target variable is categorical, it is the best learning model to use. LR processes the relationship between the group-dependent variable and one or more independent variables by calculating probabilities using a logistic function.
The voting classifier model [26] comprises individually trained classifiers whose forecasts are combined when new data is labeled. The voting classifier incorporates a single composite classification to produce a few classifiers generated by weak learners. Thus, the error of every more inefficient learning algorithm can be reduced. Combining these classifiers aims to construct a voting classifier model that enhances the classification accuracy for individual classification. Combining the three models involves a weighted voting scheme [27] in which weighting is based on each prediction's confidence value. The weights were then added, and the value was chosen with the highest number. The final selection of trust is the sum of the weights for the winning values divided by the number of models in the voting classifier. If a model does not predict greater confidence than the two combined predictions, no one will win. This ensemble of models increases classification accuracy and reduces training opportunities, as it prevents a partial decision by integrating various forecasts from the individual classifier. This study’s ensemble model combines the predictions of LR, SVM, and DT classifiers, and is then named LDSVM.
Machine learning is a computer algorithm that automatically develops by means of practice. To make predictions without being programmed directly, machine learning algorithms construct a mathematical model based on sampling data known as “workout data.” Machine learning is closely related to the use of machine statistics to make predictions. Doctors have tools and machines to detect cancer to treat patients well. They have X-rays, MRI, and CT scan for cancer detection in the medical field, but these are all based on image scanning techniques and ready solid objects in the body. Blood analyses were performed by testing the blood samples through a laboratory tool, microarray, and DNA microarray. The microscope slide was used to hold the blood DNA genes in thousands of spots for testing. The doctor needs years of experience to analyze these tests. It takes years of training to make the correct prediction to treat the patient and save life. In other words, there is always a significant problem in predicting the right type of cancer in patients. The proposed study aims to solve this problem by proposing machine learning models and comprehensively studying their effects.
In this study, different machine learning algorithms and voting classifiers have a better result of accuracy. Fig. 4 shows the steps performed for better accuracy. After fetching, data pre-processing was performed. In the next step, different preprocessing techniques are used. For example, shuffling was conducted, and then the null values were removed smoothly to deal with the data categorically. In addition, punctuation was removed from the text during pre-processing. After preprocessing, the dataset was split into two subsets for training and testing. The ratios of the dataset division were 80% and 20%. After breaking the data, machine learning models were trained using essential features, and voting classifier models were used. The voting classifier models were LR, SVM, and DT. Machine learning models are tuned using different parameters. After model training, test data were passed to the trained models to evaluate the learning model's performance and after this, other evaluation parameters were used, such as accuracy, F1-score, recall, and precision. This research collected a dataset of the maximum number of genes so that our model can be trained well on it and increase our accuracy by training our model. This model could detect cancer and treat patients in their cases well and treat them well.

Figure 4: Leukemia cancer classification based on machine learning models and ensemble LDSVM (LR + DT + SVM)
To prevent any problem, we perform shuffling on our data class-wise, so our dataset was the mix, and when we divide data into training and testing, we get good accuracy. The primary purpose of performing shuffling is to improve the performance of our model. Features already exist in terms of our genes. The dataset is already in numeric form, so no need to change it. The class data are in categorical form, but they require numeric form data to train our model. Here, the conversion was performed on categorical data and given a number for every class (e.g., bone marrow CD34 = 0). After this, it converts different classes into numeric forms, and our model works on it. All data were converted in numeric form. Using a novel approach, seven different machine learning models were applied to achieve the highest accuracy results. The results showed that the hybrid model had the best accuracy.
4.1 Proposed LDSVM Architecture
The LDSVM classification technique consists of k-fold cross-validation, grid search optimization, and an ensemble of models through voting. Fig. 5 presents the complete architecture of the proposed approach. Three machine learning models were adopted to achieve the best accuracy results with the embedding of k-fold cross-validation and grid search optimization. The major challenges in machine learning are flexibility, portability, and efficiency. The 5 folds cross validation splits the data into a defined fold that is 5 for the experiments in which each split contains five folds, which means five divisions. K-fold cross-validation gives the best scores by selecting one by every single division as testing data and others as training to choose the efficient division. The experiments were carried out with n_spliters = 5, n_repeats = 3, and random_state = 1 hyperparameters for 5-fold cross validation. It automates the data-split ion process for training. After this, the training data is passed to the machine learning model through grid search optimization which automates the hyperparameter tuning process of the models. A grid search was applied to each model and efficient hyperparameter values were selected for the efficient training of the models.

Figure 5: Structure of proposed approach based on ensemble LDSVM model
The logistic regression is implemented by using c = {100, 10, 1.0, 0.1, 0.01}, solver = {‘newton-cg’, ‘lbfgs’, ‘liblinear’, ‘sag’, ‘saga’}, max_iter = {−1, 100, 150, 200, 400} and penalty = {‘none’, ‘l1’, ‘l2’, ‘elasticnet’}. The highest accuracy achieved with these {‘C’: 10, ‘penalty’: ‘l2’, ‘max_iter’: 200, ‘solver’: ‘lbfgs’} values for logistic regression model. The SVM experimented by using c = {100, 10, 1.0, 0.1, 0.01}, kernel = {‘linear’, ‘poly’, ‘rbf’, ‘sigmoid’, ‘precomputed’}, max_iter = {−1, 100, 150, 200, 400} and gemma = {‘auto’, ‘scale’}. The best results were obtained using {c = 1.0, kernel = ‘linear’, max_iter = 200, and gemma = ‘scale’} hyperparameter values through a grid search. The DT model is used criterion = {‘gini’, ‘entropy’}, splitter = {“best,” “random”} max_depth = {10, 20, 30, 50, 70, 100} and min_sample_split = {2, 4, 5, 8, 10}. The highest prediction accuracy was obtained using {criterion = ‘entropy’, splitter = ‘random’, max_depth = 30, and min_sample_split = 2} for the DT model. These algorithms are tuned using a grid search optimization technique. After the tuning and achieved the best accuracy results by grid search optimization with each model, voting was adopted to achieve even higher accuracy results, making it more efficient for the identification of leukemia cancer patients.
After all previous steps, Evaluation criteria were performed. This qualitative research used several evaluation metrics: accuracy, f1-score, recall, and precision. These evaluation criteria were used to evaluate machine learning models and ensemble classifiers.
Accuracy is the share of the total number of accurate predictions. It shall be decided by:
where, TP = positives correctly classified/total positives, FP = negatives incorrectly classified/total negatives FP = false positive values and FN = false negative rate.
Precision is the proportion of the predicted positives as calculated using Eq. 8.
It is the percentage of positive cases that were correctly identified, as calculated using the formula.
The F1-Score is an average performance metric that computes information retrieval precision using recall metrics.
The results of the experiments on leukemia cancer classification are discussed in this section. Numerous machine learning methods have been used to improve the prediction accuracy of leukemia cancer classification. Novel machine learning classification approaches were adopted to develop a leukemia detection system for GSE9476 cells based on microarray data. Several machine learning methods are used, such as DT, NB, RF, GBM, LR, SVM, and the proposed ensemble LDSVM, to achieve the highest prediction results. Three types of machine learning algorithms, LR, DT, and SVM, were used as ensemble classifiers for the proposed approach, known as LDSVM. An analysis of the proposed LDSVM and other ML models utilizing the confusion matrix is shown in Fig. 6 by comparing the predicted and actual labels. The test data were used for evaluation. The prediction was combined as an ensemble classifier to obtain accurate results. For classification, ensemble classifiers were applied with soft and hard voting. Thus, the output shows 99.8% accuracy, using a soft voting hybrid approach with three models (LR, DT, and SVM) named LDSVM; with hard voting it reached 95.0% accuracy and 99.9% with 5 fold cross validation, grid search optimization, and LDSVM model.

Figure 6: Comparative analyses of machine learning model by using confusion matrix
The evaluation results of ensemble classifiers with evaluation parameters to improve the system's learning capabilities. Tab. 1 shows the highest accuracy achieved during the evaluations and different models with different parameters. The proposed approach with the ensemble LDSVM model achieved an accuracy of up to 99%. The results show that the accuracy improves when using the ensemble learning approach. The ensemble method used in this study is based on a confusion matrix. A confusion matrix was used to calculate classifier accuracy. Different performance parameters such as accuracy, precision, recall, and f1score result are used with different models, and LDSVM achieves a better performance. The highest accuracy was obtained for LDSVM. The LDSVM performed better than the individual classifiers.
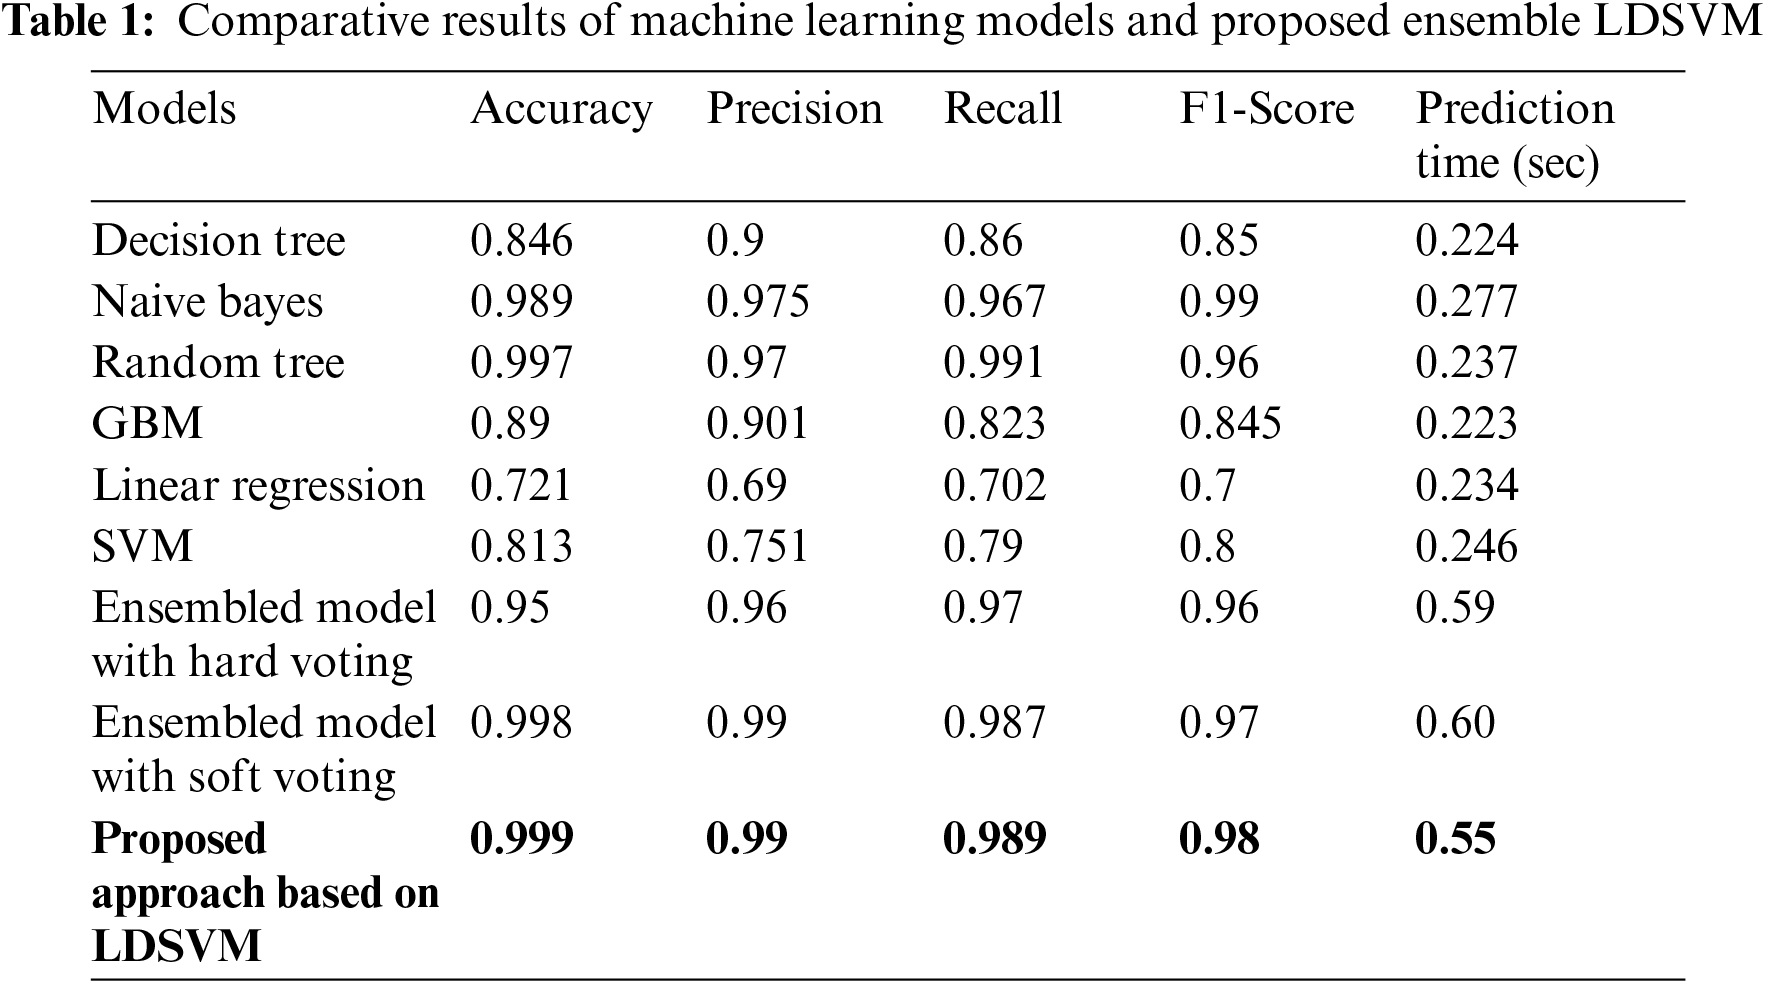
Fig. 7 shows the result of different performance parameters using other machine learning models. The best machine learning algorithms such as decision tree, random forest, naïve Bayes, gradient boosting, linear regression, and SVM. The training set is sent to all selected machine learning algorithms, and the validation set is sent to the output of the classifier. Owing to the effectiveness of the LDSVM, an accuracy of 99% was achieved. However, in the context of leukemia cancer, it is more compatible to work with overfit data, and run time is very fast to process leukemia cancer, and many issues can be solved with the LDSVM. The results show that the LDSVM in the proposed approach with soft voting achieves 99.9% accuracy. Tab. 1 shows a comparison of the prediction time as well. The least time is 0.223 s obtained with the GBM model, which is much faster, but it risks the patient’s life by showing 89.0% accuracy. Ensemble models consume more time than GBM because they consist of three models but show much higher accuracy results. The LDSVM with hard voting performs predictions in 0.59 s, 0.60 s with soft voting, and with the proposed approach, it shows a little bit faster by 0.55 s.

Figure 7: Performance parameters result of different classifier
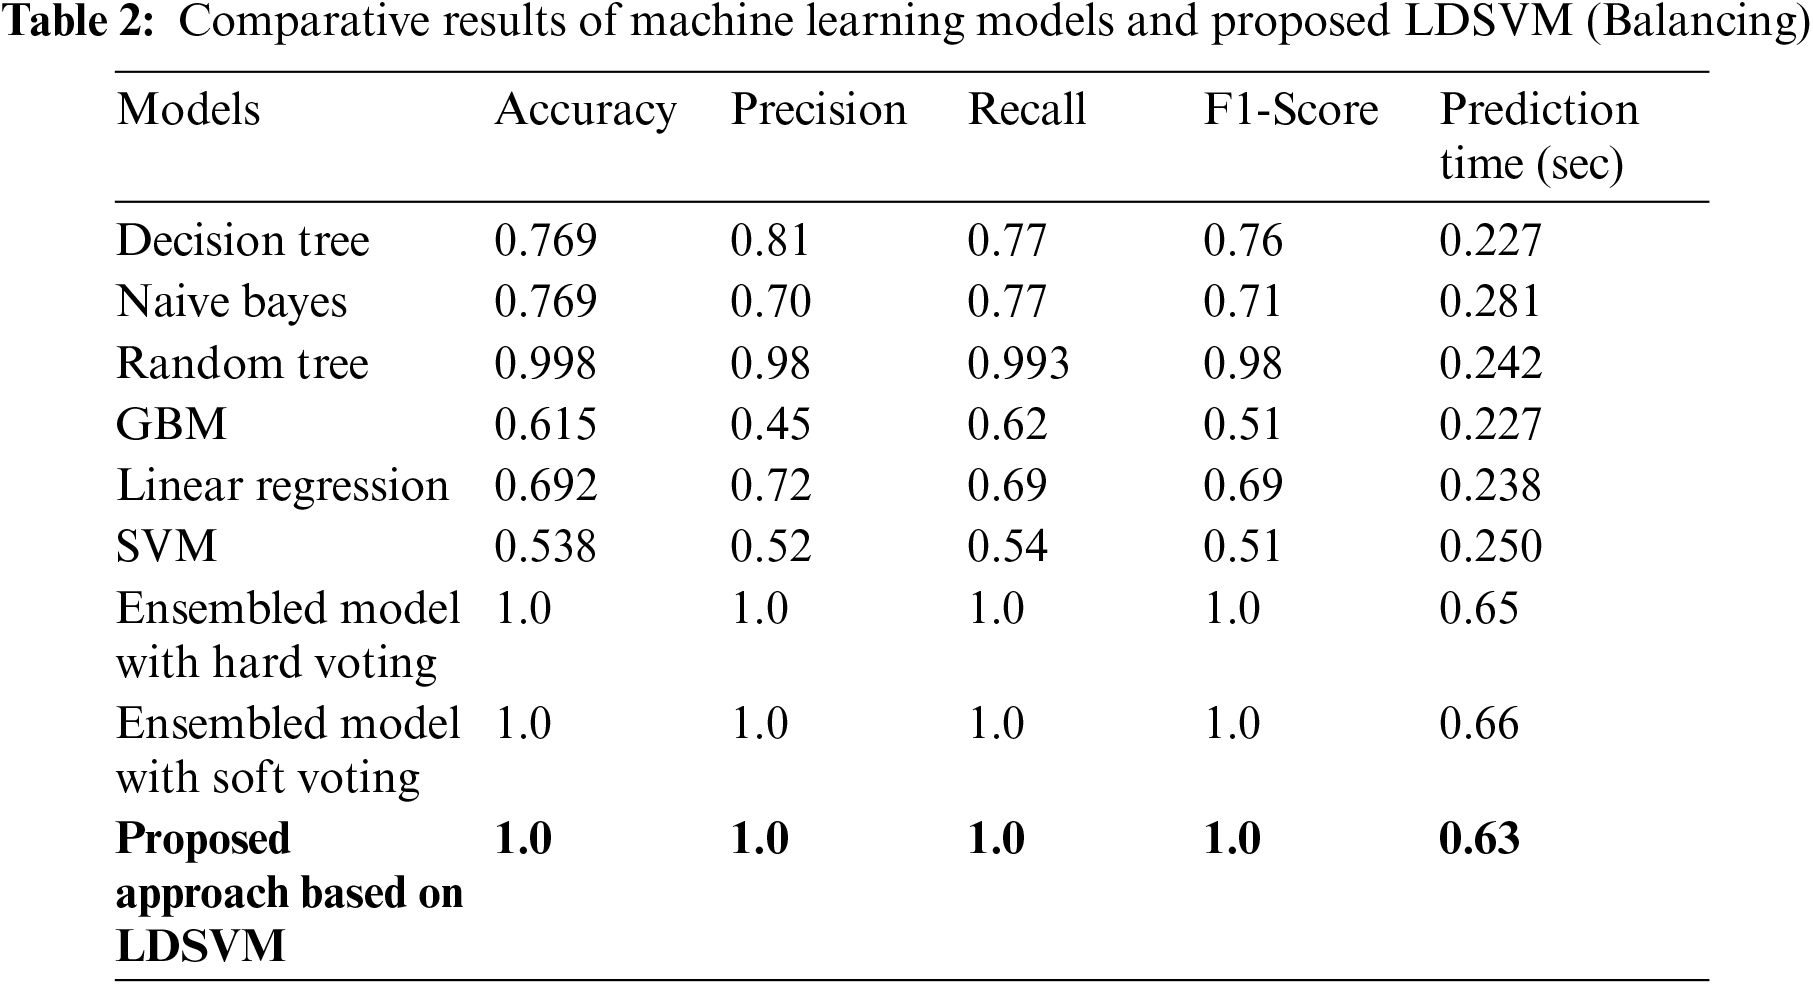
Tab. 2 display the results of Machine Learning and Proposed LDSVM with balancing technique along with a comparison of prediction times. With the suggested LDSVM, the shortest forecast time is 0.63 s, and the highest accuracy is reached. Fig. 8 shows the result of using the PCA technique to reduce the feature count from 22285 columns to 48 new columns.

Figure 8: Cumulative variance against the number of components
A comparison of the proposed and previous techniques is discussed to illustrate the novelty of the proposed approach. Tab. 3 presents machine learning and deep learning approaches proposed by different authors to classify leukemia. Machine learning models are less complex than deep learning models, which show faster training and prediction results than deep learning models. The accuracy of the first four related studies related to machine learning was higher than 95%. One of them achieved an accuracy rate of 99.1%. The last two studies were related to deep learning approaches, which showed the highest accuracy rate of 99.3%.
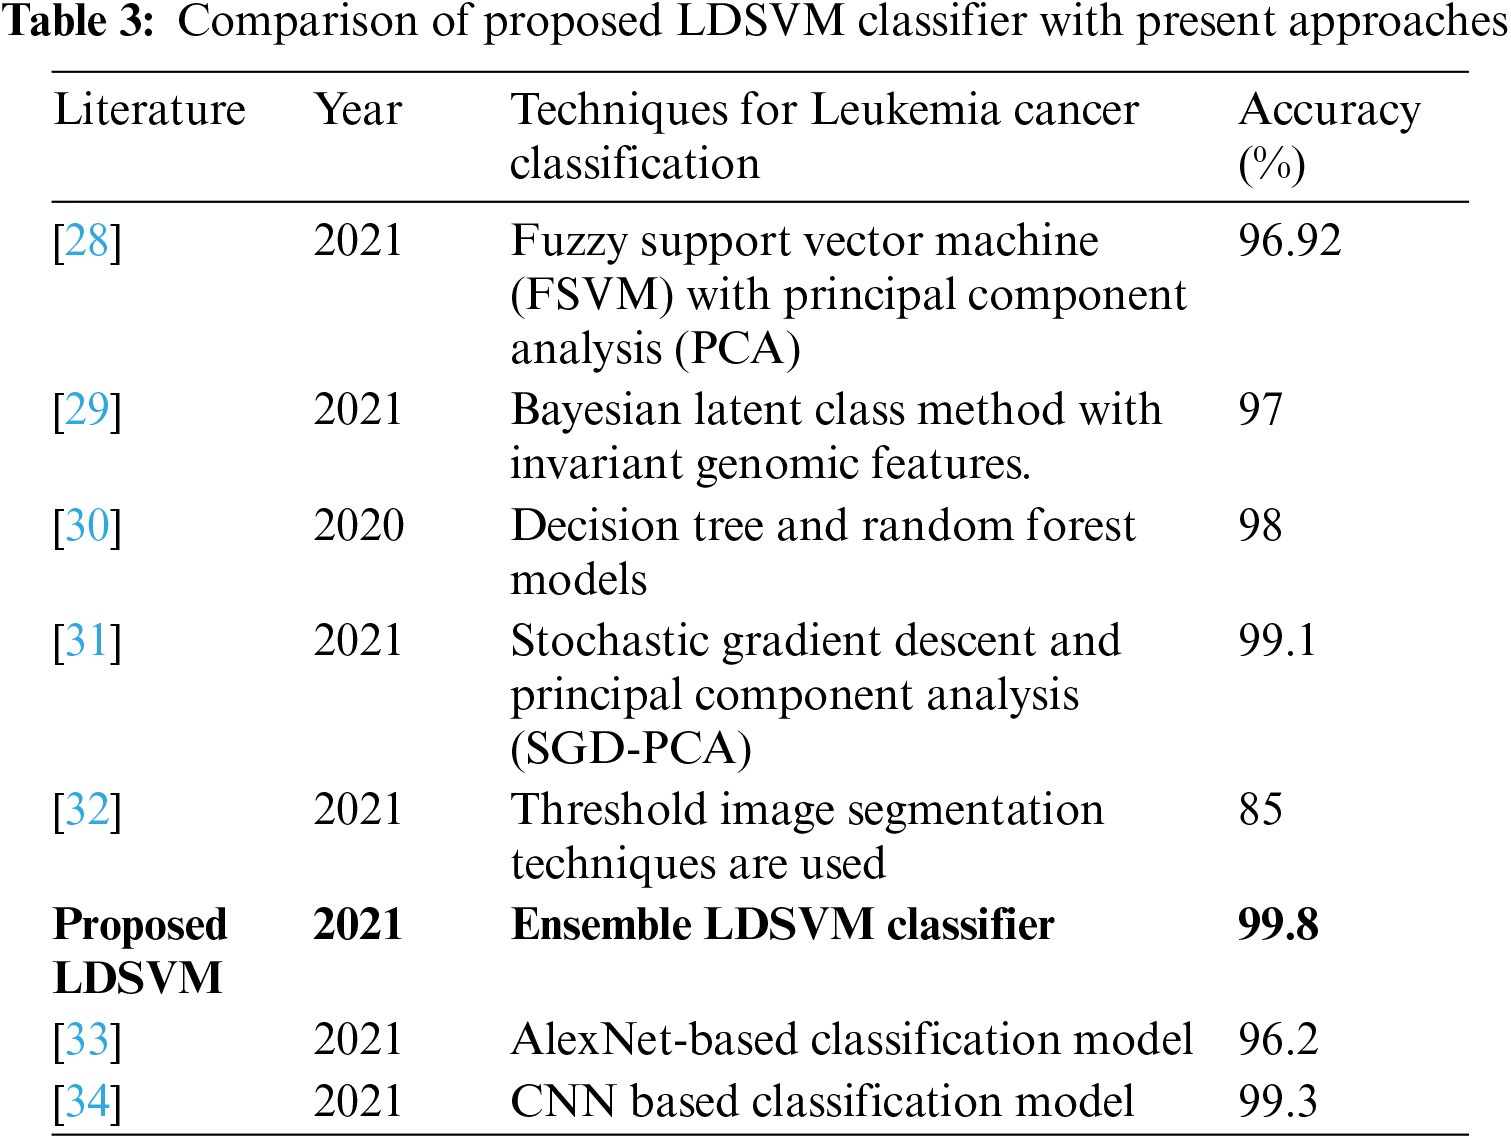
Therefore, the proposed study focuses on machine learning algorithms to find the best optimized, less complex, and fast prediction model that helps to classify leukemia in patients with accurate results to save patients' lives without false prediction. The proposed LDSVM is a combined model of LR, DT, and SVM by tuning and adjusting several hyperparameters that show the highest accuracy results of 99.8%.
The algorithms of machine learning are becoming more common. Leukemia cancer classification is proposed based on DNA microarray data using the proposed approach, which consists of a novel structure of classification methods. This study proposed machine-learning best algorithms for leukemia cancer classification. The three machine learning algorithms SVM, LR, and DT are combined using voting classifiers, named LDSVM and analyzing the classification results using these algorithms on leukemia. This study focuses on the voting classifier for accuracy, which works best on the chosen dataset. We have fulfilled our goal of accessing and investigating three selected algorithms based on the classification to predict the best leukemia pattern. The best leukemia-based voting classifier achieved the best accuracy. The primary objective of this study was to demonstrate the efficiency of voting classifiers in improving the classification accuracy. Three algorithms, SVM, LR, and DT, and their novel ensemble patterns were studied on the chosen dataset. Statistical measurements, such as accuracy, specificity, and sensitivity, were used to investigate the output of all the classifiers. The output of each classifier was also studied. Accuracy of the classification of three models and the ensemble model for training and testing data before and after the choice of functions. The proposed LDSVM model with hard voting achieves an accuracy of 0.95, and with a soft vote of 0.998, and with the balancing technique, an accuracy of 100% was achieved with minimum prediction time. The proposed approach achieves an accuracy result with 5 fold cross validation using grid search optimization for LDSVM to obtain outperform results. Voting classifier models work well in all respects, which enables our dataset to be categorized in this model. In future work, we propose that these observations suggest that the algorithm evaluated in machine learning can change the conventional classification methods for use in the medical field or, in general, bioinformatics. As the PCA technique works well for computation in the future, we need more data for better working of the model.
Acknowledgement: The authors would like to thank the Editor and the anonymous reviewers for their insightful comments and constructive suggestions that certainly improved the quality of this paper.
Funding Statement: The authors received no specific funding for this study.
Conflicts of Interest: The authors declare that they have no conflicts of interest to report regarding the present study.
1. A. Vasighizaker, A. Sharma and A. Dehzangi, “A novel one-class classification approach to accurately predict disease-gene association in acute myeloid leukemia cancer,” PLOS One, vol. 14, no. 12, pp. 2–12, 2019. [Google Scholar]
2. R. Nall, “Medical news today,” in What to Know about Cancer. Brighton, Uniter Kingdom: Medical News Today, 2020. [Online]. Available at: http://www.medicalnewstoday.com/articles/323648#what-is-cancer. [Google Scholar]
3. I. J. Maria, T. Devi and D. Ravi, “Machine learning algorithms for diagnosis of leukemia,” International Journal of Scientific & Technology Research, vol. 9, no. 11, pp. 267–270, 2020. [Google Scholar]
4. F. S. Esmail, M. B. Senousy and M. Ragaie, “Predication model for leukemia diseases based on data mining classification algorithms with best accuracy,” International Journal of Computer and Information Engineering, vol. 10, no. 5, pp. 842–851, 2016. [Google Scholar]
5. B. Rajeswari and A. Rajini, “Survey on data mining algorithms to predict leukemia types,” International Journal for Research in Science Engineering & Technology, vol. 2, no. 5, pp. 42–46, 2015. [Google Scholar]
6. M. Madhukar, S. Agaian and A. T. Chronopoulos, “Deterministic model for acute myelogenous leukemia classification,” in IEEE Int. Conf. on Systems, Man, and Cybernetics (SMCSeoul Korea (Southpp. 433–438, 2012. [Google Scholar]
7. C. Oprea, “Performance evaluation of the data mining classification methods,” Information Society and Sustainable Development, vol. 2344, pp. 249–253, 2014. [Google Scholar]
8. P. Pujari and J. B. Gupta, “Improving classification accuracy by using feature selection and ensemble model,” International Journal of Soft Computing and Engineering (IJSCE), vol. 2, no. 2, pp. 380–386, 2012. [Google Scholar]
9. R. J. Suji and S. P. Rajagopalan, “An automatic oral cancer classification using data mining techniques,” International Journal of Advanced Research in Computer and Communication Engineering, vol. 2, no. 10, pp. 3759–3765, 2013. [Google Scholar]
10. R. M. Chandrasekar and V. Palaniammal, “Performance and evaluation of data mining techniques in cancer diagnosis,” IOSR Journal of Computer Engineering, vol. 15, no. 5, pp. 39–44, 2013. [Google Scholar]
11. S. S. Shajahaan, S. Shanthi and V. ManoChitra, “Application of data mining techniques to model breast cancer data,” International Journal of Emerging Technology and Advanced Engineering, vol. 3, no. 11, pp. 362–369, 2013. [Google Scholar]
12. N. Ancona, R. Maglietta, A. Piepoli, A. D'Addabbo, R. Cotugno et al., “On the statistical assessment of classifiers using DNA microarray data,” BMC Bioinformatics, vol. 7, no. 1, pp. 1–14, 2006. [Google Scholar]
13. K. Kourou, T. P. Exarchos, K. P. Exarchos, M. V. Karamouzis and D. I. Fotiadis, “Machine learning applications in cancer prognosis and prediction,” Computational and Structural Biotechnology Journal, vol. 13, no. 3, pp. 8–17, 2015. [Google Scholar]
14. M. Montazeri, M. Mohadeseh, M. Mahdieh and B. Amin, “Machine learning models in breast cancer survival prediction,” Technology and Health Care, vol. 24, no. 1, pp. 31–42, 2016. [Google Scholar]
15. N. Alrefai, “Ensemble machine learning for leukemia cancer diagnosis based on microarray datasets,” International Journal of Applied Engineering Research, vol. 14, no. 21, pp. 4077–4084, 2019. [Google Scholar]
16. A. Ali, S. M. Shamsuddin and A. L. Ralescu, “Classification with class imbalance problem,” International Journal Advances in Soft Computing and its Applications, vol. 5, no. 3, pp. 176–204, 2013. [Google Scholar]
17. M. Morovvat and A. Osareh, “An ensemble of filters and wrappers for microarray data classification,” Machine Learning and Applications: An International Journal, vol. 3, no. 2, pp. 1–17, 2016. [Google Scholar]
18. J. Laosai and K. Chamnongthai, “Acute leukemia classification by using SVM and K-Means clustering,” in Int. Electrical Engineering Congress (IEECONChonburi, Thailand, IEEE, pp. 1–4, 2014. [Google Scholar]
19. A. Karim, A. Azhari, S. B. Belhaouri, A. A. Qureshi and M. Ahmad, “Methodology for analyzing the traditional algorithms performance of user reviews using machine learning techniques,” Algorithms, vol. 13, no. 8, pp. 202, 2020. [Google Scholar]
20. D. Tomar and S. Agarwal, “A survey on data mining approaches for healthcare,” International Journal of Bio-Science and Bio-Technology, vol. 5, no. 5, pp. 241–266, 2013. [Google Scholar]
21. X. F. Du, S. C. H. Leung, J. L. Zhang and K. K. Lai, “Demand forecasting of perishable farm products using support vector machine,” International Journal of Systems Science, vol. 44, no. 3, pp. 556–567, 2013. [Google Scholar]
22. F. Rustam, I. Ashraf, A. Mehmood, S. Ullah and G. S. Choi, “Tweets classification on the base of sentiments for US airline companies,” Entropy, vol. 21, no. 11, pp. 1078, 2019. [Google Scholar]
23. V. Svetnik, A. Liaw, C. Tong, J. C. Culberson, R. P. Sheridan et al., “Random forest: A classification and regression tool for compound classification and QSAR modeling,” Journal of Chemical Information and Computer Sciences, vol. 43, no. 6, pp. 1947–1958, 2003. [Google Scholar]
24. G. Biau and E. Scornet, “A random forest guided tour,” Test, vol. 25, no. 2, pp. 197–227, 2016. [Google Scholar]
25. L. Breiman, “Bagging predictors,” Machine Learning, vol. 24, no. 2, pp. 123–140, 1996. [Google Scholar]
26. M. Pal, “Ensemble learning with decision tree for remote sensing classification,” World Academy of Science, Engineering and Technology, vol. 36, pp. 258–260, 2007. [Google Scholar]
27. A. M. Elsayad, “Diagnosis of erythemato-squamous diseases using ensemble of data mining methods,” ICGST-BIME Journal, vol. 10, no. 1, pp. 13–23, 2010. [Google Scholar]
28. I. R. Fauzi, Z. Rustam and A. Wibowo, “Multiclass classification of leukemia cancer data using fuzzy support vector machine (fsvm) with feature selection using principal component analysis (PCA),” Journal of Physics: Conference Series, vol. 1725, no. 1, pp. 12012, 2021. [Google Scholar]
29. H. Awada, A. Durmaz, C. Gurnari, A. Kishtagari, M. Meggendorfer et al., “Machine learning integrates genomic signatures for subclassification beyond primary and secondary acute myeloid leukemia,” in Blood, Vol. 2021. Washington, USA: American Society of Hematology, 2021. [Google Scholar]
30. M. A. Hossain, M. I. Sabik, M. M. Rahman, S. N. Sakiba, A. K. M. M. Islam et al., “An effective leukemia prediction technique using supervised machine learning classification algorithm,” in Proc. of Int. Conf. on Trends in Computational and Cognitive Engineering: Advance in Intelligent Systems and Computing, Singapore, Springer Nature Singapore Pte Ltd., vol. 1309, pp. 723, 2021. [Google Scholar]
31. G. J. Mahdi, B. A. Kalaf and M. A. Khaleel, “Enhanced supervised principal component analysis for cancer classification,” Iraqi Journal of Science, vol. 62, no. 4, pp. 1321–1333, 2021. [Google Scholar]
32. M. A. K. Sharma, “Modified method of diagnosis of blood cancer using MRI classification through machine learning,” Turkish Journal of Computer and Mathematics Education, vol. 12, no. 10, pp. 3509–3513, 2021. [Google Scholar]
33. M. Shaheen, R. Khan, R. R. Biswal, M. Ullah, A. Khan et al., “Acute myeloid leukemia (AML) detection using alexnet model,” Hindawi Complexity, vol. 2021, no. 6658192, pp. 1–8, 2021. [Google Scholar]
34. P. K. Das and S. Meher, “An efficient deep convolutional neural network based detection and classification of acute lymphoblastic leukemia,” Expert Systems with Applications, vol. 183, no. 15311, pp. 1–14, 2021. [Google Scholar]
 | This work is licensed under a Creative Commons Attribution 4.0 International License, which permits unrestricted use, distribution, and reproduction in any medium, provided the original work is properly cited. |