DOI:10.32604/cmc.2022.021856
| Computers, Materials & Continua DOI:10.32604/cmc.2022.021856 | |
| Article |
The Mathematical Model for Streptococcus suis Infection in Pig-Human Population with Humidity Effect
1Department of Mathematics, Faculty of Science, Mahasarakham University, Mahasarakham, 44150, Thailand
2Department of Mathematics, Faculty of Science, Khon Kaen University, Khon Kaen, 40002, Thailand
*Corresponding Author: Din Prathumwan. Email: dinpr@kku.ac.th
Received: 17 July 2021; Accepted: 27 September 2021
Abstract: In this paper, we developed a mathematical model for Streptococcus suis, which is an epidemic by considering the moisture that affects the infection. The disease is caused by Streptococcus suis infection found in pigs which can be transmitted to humans. The patients of Streptococcus suis were generally found in adults males and the elderly who contacted pigs or who ate uncooked pork. In human cases, the infection can cause a severe illness and death. This disease has an impact to the financial losses in the swine industry. In the development of models for this disease, we have divided the population into 7 related groups which are susceptible pig compartment, infected pig compartment, quarantined pig compartment, recovered pig compartment, susceptible human compartment, infected human compartment, and recovered human compartment. After that, we use this model and a quarantine strategy to analyze the spread of the infection. In addition, the basic reproduction number
Keywords: Streptococcus suis; mathematical model; stability analysis; infectious disease; reproduction number
Nowadays, one of the major problems in the world is zoonotic pathogen such as Rift Valley fever, SARS, pandemic influenza H1N1 2009, Yellow fever, Avian Influenza (H5N1) and (H7N9), West Nile virus [1], the Middle East respiratory syndrome coronavirus (MERSCoV) [2], and novel coronavirus (COVID-19) [3]. Streptococcus suis is an infectious agent which is widely found in pigs around the world. This pathogen is generally found in the upper respiratory tract, genital, and alimentary tracts of the pigs [4,5]. Streptococcus suis is a Gram-positive bacterium and a facultative anaerobic bacterium which is a primary agent of sepsis and meningitis in pigs [6,7]. In pig farms, the disease can transmit from pig to pig rapidly. The reported rate of mortality in pigs from Streptococcus suis is about 20% [8]. It can classify at least 35 serotypes, for examples, serotypes 1 to 31, 33, and 1/2 [9,10]. Serotypes 1 to 9 and 14 are most commonly found in pigs around the world [11,12].
In 1968, the first human who was infected with Streptococcus suis was found in Denmark [4,5]. This situation confirms that Streptococcus suis can transmit from pig to human. Serotype 2 is reported that it is frequently found in human infections [13,14], but in some cases, the infections are caused by other serotypes. Kerdsin et al. reported that serotypes 2 and 14 are involved in human cases that found in Thailand [15,16]. Dutkiewicz et al. presented that disease found in human caused by S. suis serotypes 2, 4, 5, 14, 16, 21 and 24 [12]. S. suis serotype 9 which is the most common found in pigs in Europe was found the first case infection in human in May 2013 locating in northern of Thailand [17]. In addition, Hatrongjit et al. reported the first case of serotype 31 in human [18] in the central region of Thailand. The common symptoms of this disease in human are fever, headache, meningitis, septicemia, arthritis, pneumonia, and hearing loss [19].
To prevent the spread of the disease, the mathematical models become powerful tools for describing the dynamics of the disease. They can forecast the future behaviors of the disease with many assumptions. The solutions of the model can be simulated satisfying the given parameters from the hypothesis. Recently, many mathematical models have been used to describe the behavior of infectious disease [20–24]. Rahman et al. proposed the nonlinear SEITR fractional order model of tuberculosis disease by using Atangana-Baleanu derivative which consists of 5 population groups [25]. Arfan et al. [26] presented the fractional order model to predict the dynamic of tumor with drug intervention. The nonlinear fractional order mathematical model for predicting the dynamic of COVID-19 was created by Shah et al. [27]. Almuqrin et al. proposed the fractional model for forecasting the transmission of Ebola virus in bats population by using Atangana-Baleanu fractional derivative [28]. Srivastava et al. improved the mathematical model for studying the dynamic of diabetes patients [29]. Alzaid et al. [30] studied the dynamic of HIV-1 infection by using the mathematical model and showed that the mathematical model is efficient . The fractional order model of HIV with source term was proposed by Shah et al. to consider the behavior of CD4 + T-cells which depending on the concentration of the viral load [31]. The symmetry and asymmetry concepts can be linked to the epidemic model [32–34].
A number of research studied the disease from Streptococcus suis on epidemiology and medicine. However, a few pieces of the research proposed and studied the mathematical model for Streptococcus suis. Shen et al. [35] proposed the SIQRW model to explore the outbreaks of S. Suis. Giang et al. proposed the stochastic model and SEI model to predict the behavior of the disease and fitted the model parameters with collected data [9]. The proposed models consider the transmission on pig population only. However, to our knowledge, no research considering the disease transmission between pigs and humans for Streptococcus suis.
In this paper, we propose a mathematical model to describe the disease transmission of Streptococcus suis in humans and pigs. The novelty of this work is the improved mathematical model from one species to two species population. We classify the population of pigs and humans into 4 classes and 3 classes, respectively. This work contains the analysis of the model and numerical simulations to study the dynamic behavior of the disease. We also find the basic reproduction numbers to explain the rapid transmission and study the stability of the solution of the model.
This paper is constructed as follows; In Section 2, we present the mathematical model which expresses the Streptococcus suis transmission. The analysis of the proposed model is shown in Section 3 which includes a basic reproduction number, equilibrium points, and their stability. The numerical simulations are given in Section 4 and follow by a conclusion in Section 5.
In this section, we describe the model formulation of Streptococcus suis disease transmission in humans and pigs. Based on the classical epidemiology model, we propose a new generalized model of Streptococcus suis infection which is SIQR-SIR model. There are some facts about the environmental factors such as temperature and relative humidity [36–38]. So, we consider the effect of the moisture in the air for disease transmission in the pig farm.
The investigated population is divided into two subpopulations. These are pig population and human population. Then, both subpopulations of pigs and human are separated into four classes and three classes, respectively. These are a pig susceptible class (
and
where
We can write the dynamic equations for
The new infection in pigs can be described . where
The model of disease transmission by Streptococcus suis can be represented by the system of differential equations as follows:
where
Eq. (1a) expresses the rate of change of the population of susceptible pig. The number of susceptible pigs increases only via birth
Eq. (1b) expresses the rate of change of the population of the infected pig. On the right-hand side, the first term represents the number of infected pigs increases due to susceptible pig becoming infected pig with the rate
Eq. (1c) expresses the rate of change of the population of the isolated pig. On the right-hand side, the first term represents the increase in the population of isolated pig due to the isolation of infected pig with the rate
Eq. (1d) expresses the rate of change of the population of the recovered pig. On the right-hand side, the first term represents the increase in the population of the recovered pig due to treatment with the rate
Eq. (1e) expresses the rate of change of the population of susceptible human. The number of susceptible pigs increases only via birth
Eq. (1f) expresses the rate of change of the population of the infected human. On the right-hand side, the first term and second term represent the number of the infected human increases due to susceptible human becoming infected human by contact with the infected pigs
Eq. (1g) expresses the rate of change of the population of recovered human. On the right-hand side, the first term represents the increase in the population of recovered human due to treatment with the rate
Let
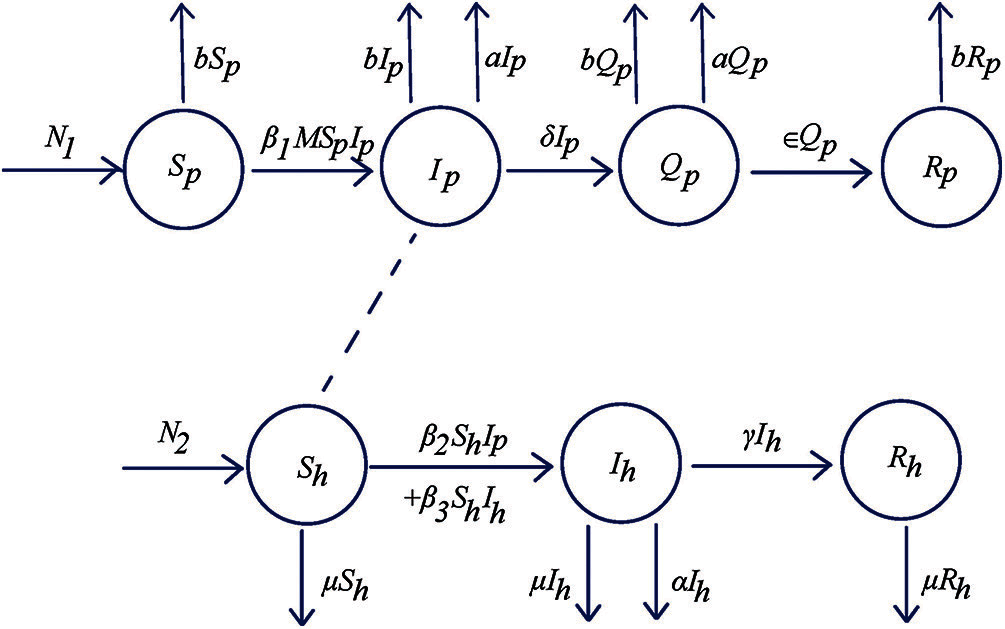
Figure 1: Flowchart of SIQR-SIR (Susceptible-Infectious-Isolation-Recovery-Susceptible-Infectious-Recovery) model for human and pigs
The values of population classes
Let
and
and
Therefore, the positive invariant of the system (1) is
The equilibria are obtained by setting all equations of the system (1) to be zero.
By solving the system (4), We get three equilibrium points:
i) Disease-free equilibrium
ii) Pig disease free equilibrium
Note that,
iii) The endemic equilibrium
with
Note that,
The basic reproduction number is the expected number of secondary cases produced by a single infection in a completely susceptible population. To compute the basic reproduction number and to study the local stability of the equilibrium, we use the next generation matrix method [40,41]. We define
The corresponding Jacobian matrices are
Then, we obtain
We obtain three eigenvalues of
Hence, the spectral radii are
3.3 The Stability of Disease-Free Equilibrium
Theorem 1. The disease-free equilibrium point
Proof. The model system (1) has the Jacobian matrix at the point
The corresponding eigenvalues of
Note that
Therefore, the disease-free equilibrium
3.4 The Stability of Pig Disease Free Equilibrium
Theorem 2. The pig disease free equilibrium
Proof. The pig disease-free equilibrium
exists and is positive if
The model system (1) has the Jacobian matrix at the point
The corresponding eigenvalues of
Note that
Therefore, the pig disease free equilibrium
3.5 The Stability of Endemic Equilibrium
Theorem 3. The endemic equilibrium
Proof. The endemic equilibrium
where
exists and is positive if
The model system (1) has the Jacobian matrix at the point
where
The corresponding eigenvalues of
where
and
Next, we consider
and
We obtain that
Then, let us consider
Since
Then, we get
If
Thus, the eigenvalues
Therefore, the endemic equilibrium
We can draw the bifurcation diagram to describe the basic reproduction numbers and stability as shown in Fig. 2.
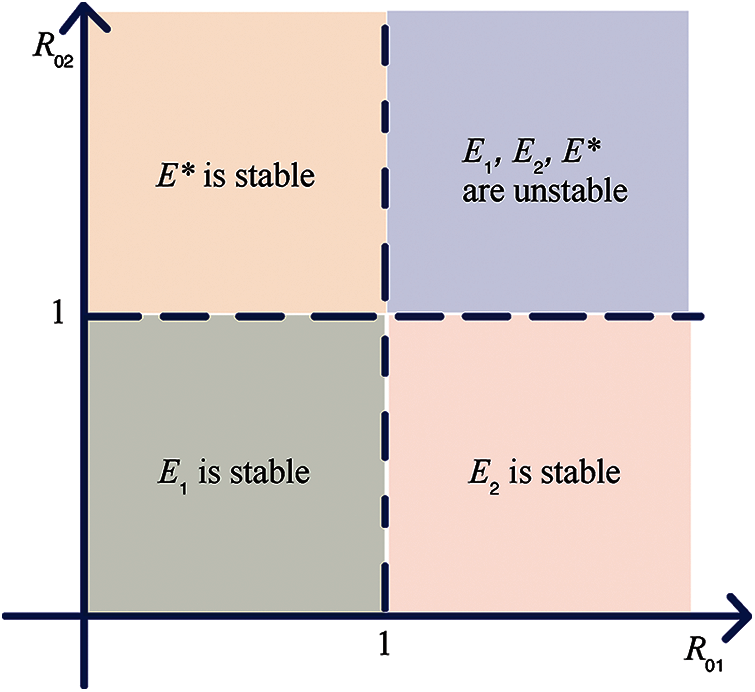
Figure 2: The bifurcation region
4 Numerical Examples and Discussion
The numerical results of the system (1) are computed by using MATLAB with the given initial values:
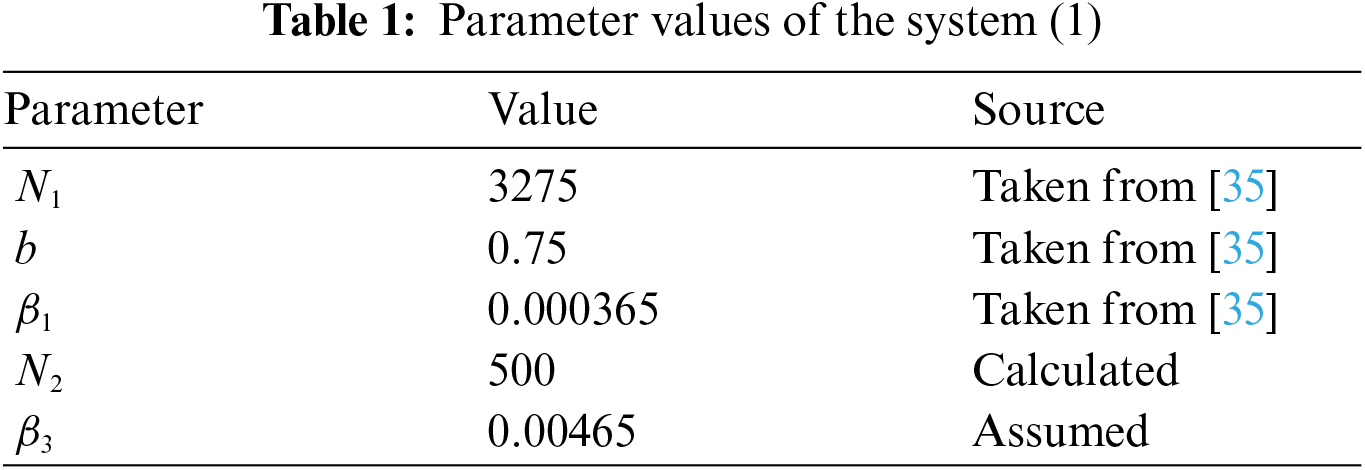
The numerical results of the system (1) with the parameter values as shown in Tab. 1. Note that the parameters and initial values are obtained from data in [35] and [42].
The solution trajectories tend to the disease-free equilibrium
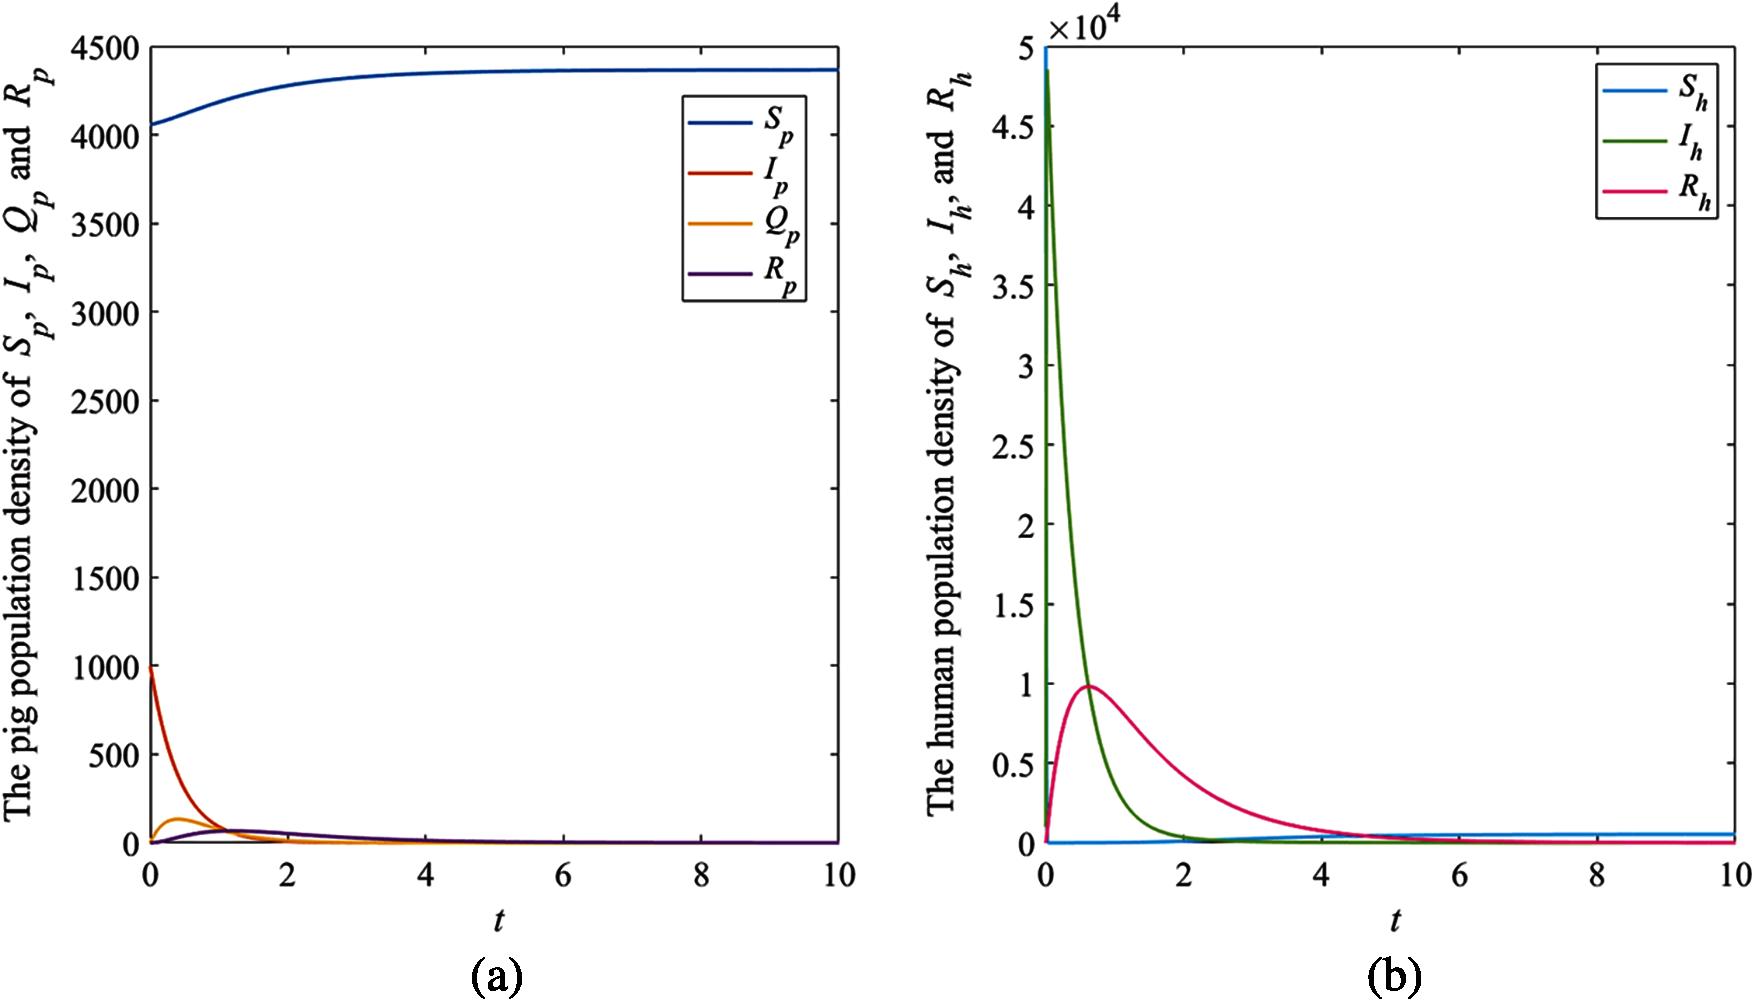
Figure 3: The simulation results of the system (1), (a) The plots of asymptotic population density of pig susceptible population
The results showed that the number of pig infectious cases dramatically decreased in the first quarter. After that, the decreasing of pig infectious cases slowly decreased. Then, it tended to the equilibrium value. Fig. 3a, the number of pig susceptible population increased after infectious cases were recovered. In addition, the isolated population increased when the number of infectious cases increased to control the spread of the disease. Then, it decreased after the number of infectious cases decreased. In human case (Fig. 3b), the number of infectious populations increased in the first quarter, then the number increased and approached to the equilibrium number. Therefore, the parameters of this case provided that the disease died out.
The solution trajectories tend to the disease-free equilibrium
The results showed that the number of pig infectious cases dramatically decreased in the first quarter. After that, the decreasing of pig infectious cases slowly decreased. Then, it tended to the equilibrium value. The number of pig susceptible population increased after infectious cases decreased. In human case (Fig. 4b), the number of infectious populations dramatically increased in the first quarter, then it decreased and approached to the equilibrium number. Therefore, the result of this case indicated that the disease in pig died out while it still appeared in human.
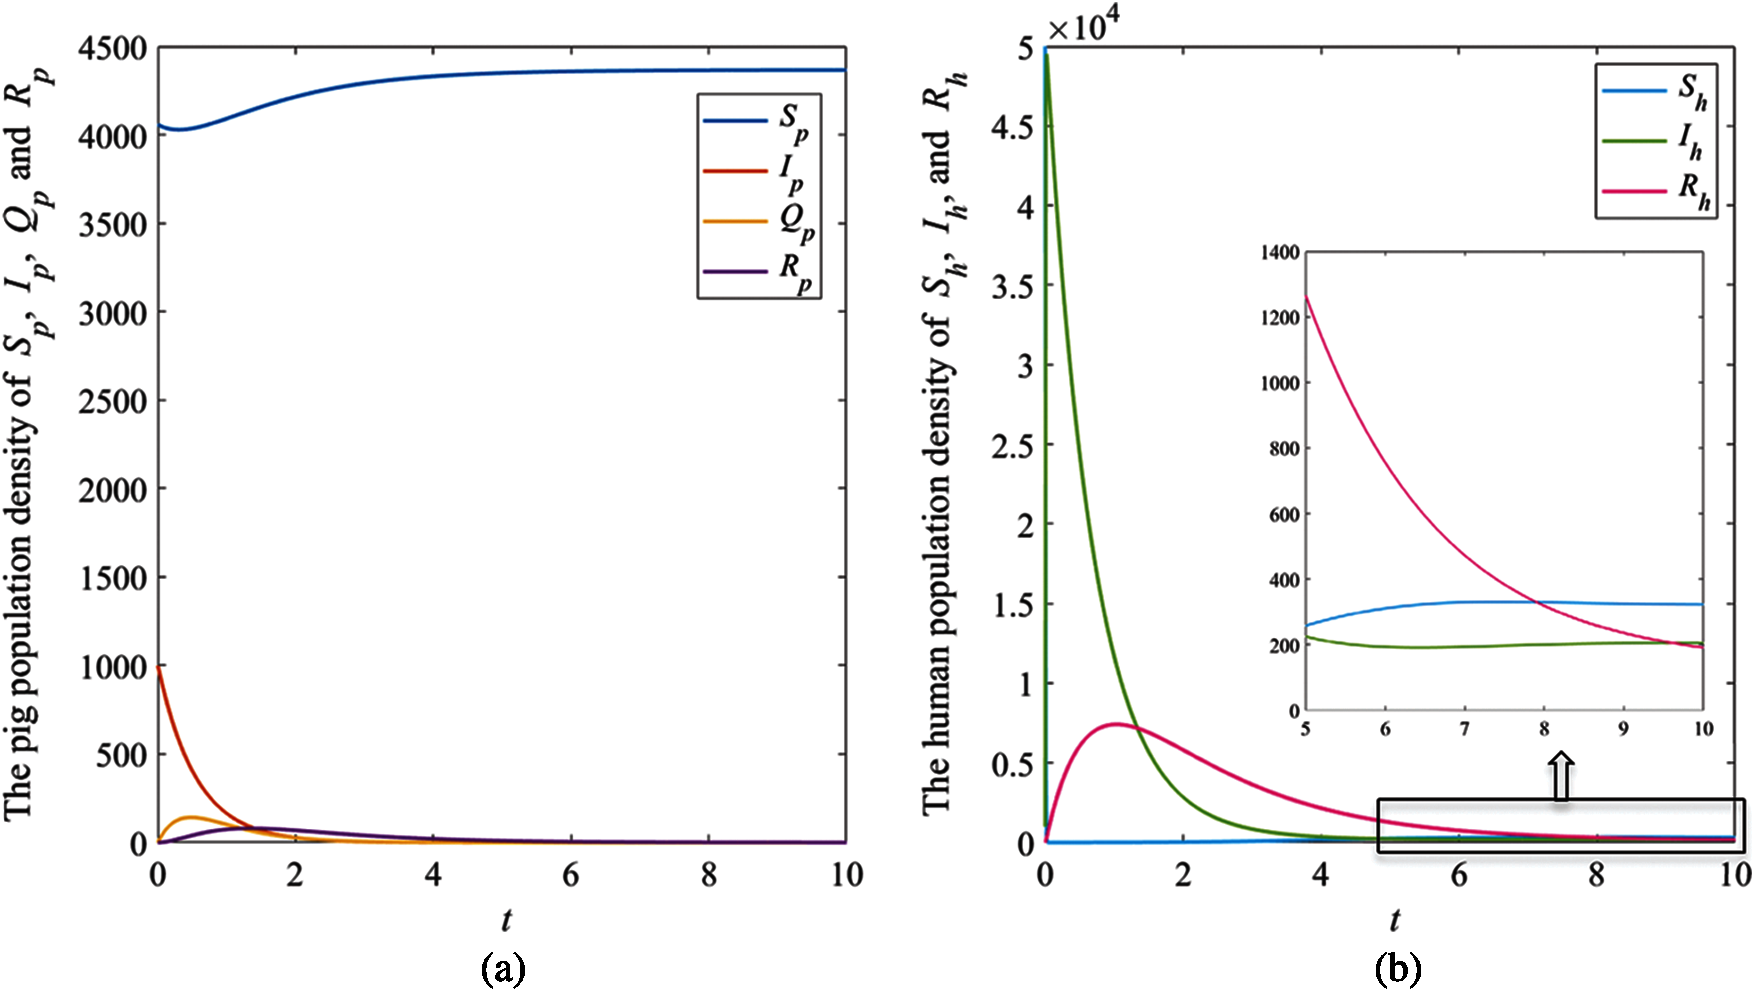
Figure 4: The simulation results of the system (1), (a) The plots of asymptotic population density of pig susceptible population
The numerical results of the system (1) with the remaining parameter values
To consider the effect of moisture, the numerical results of the system (1) with the remaining parameter values
In Fig. 6, the result indicates that when the relative humidity
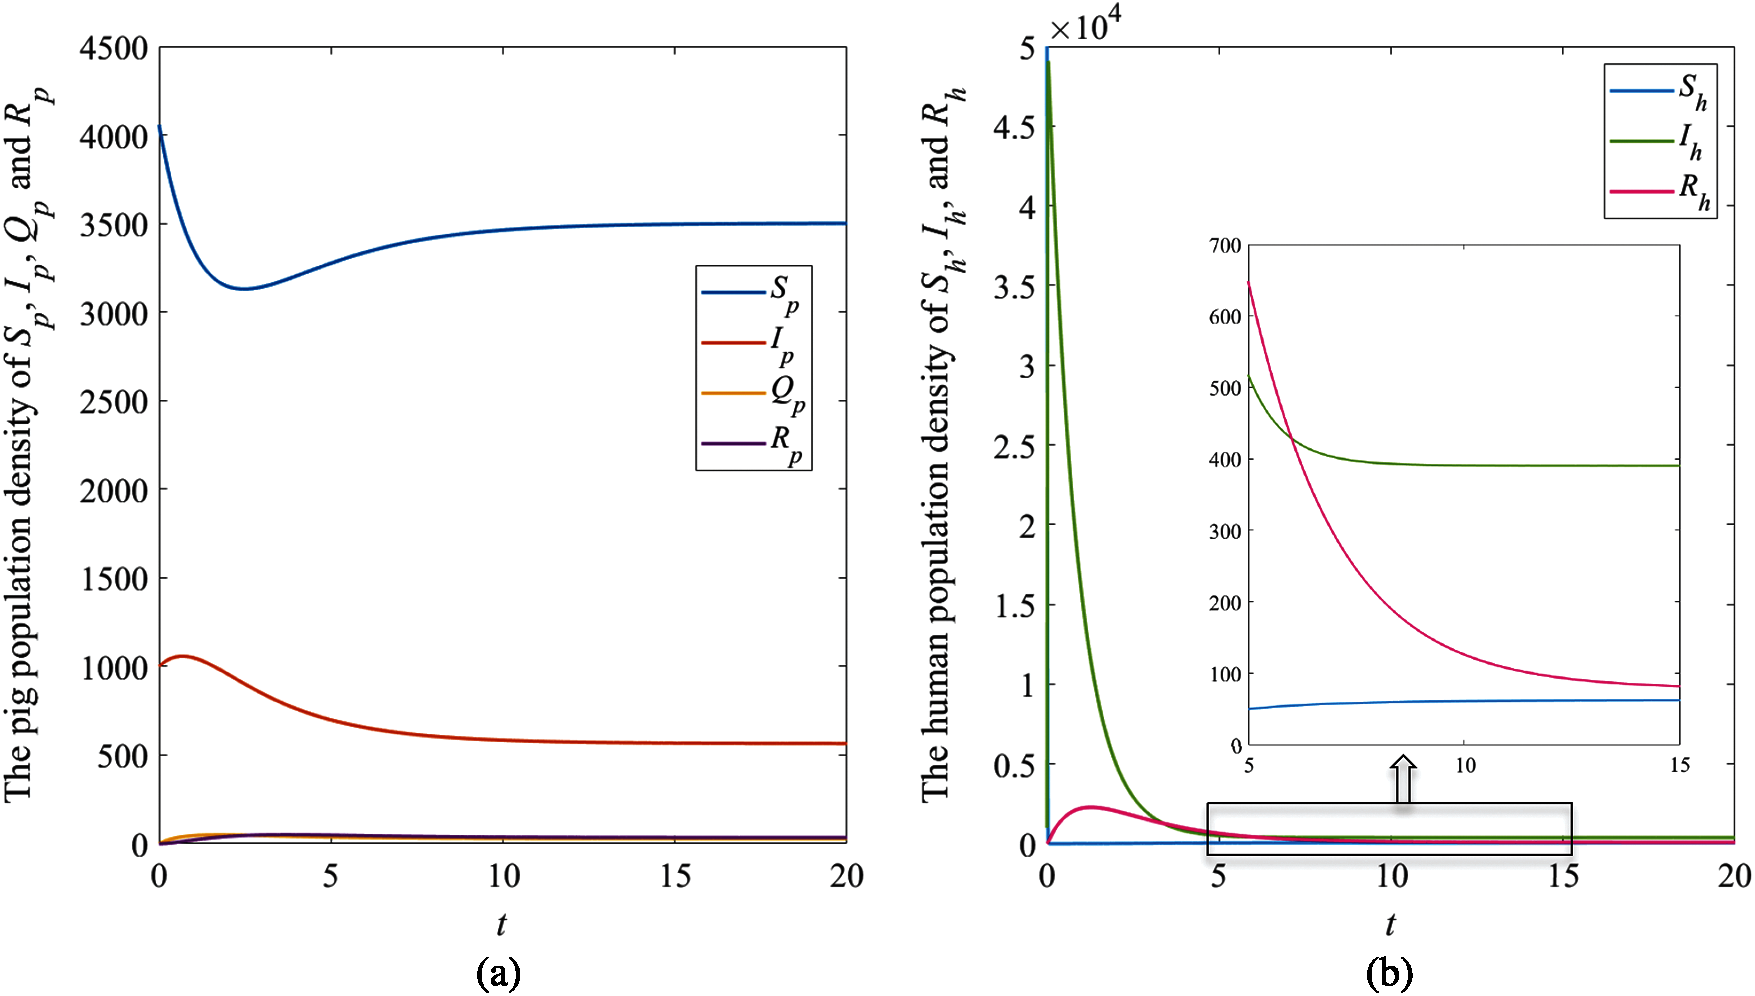
Figure 5: The simulation results of the system (1), (a) The plots of asymptotic population density of pig susceptible population
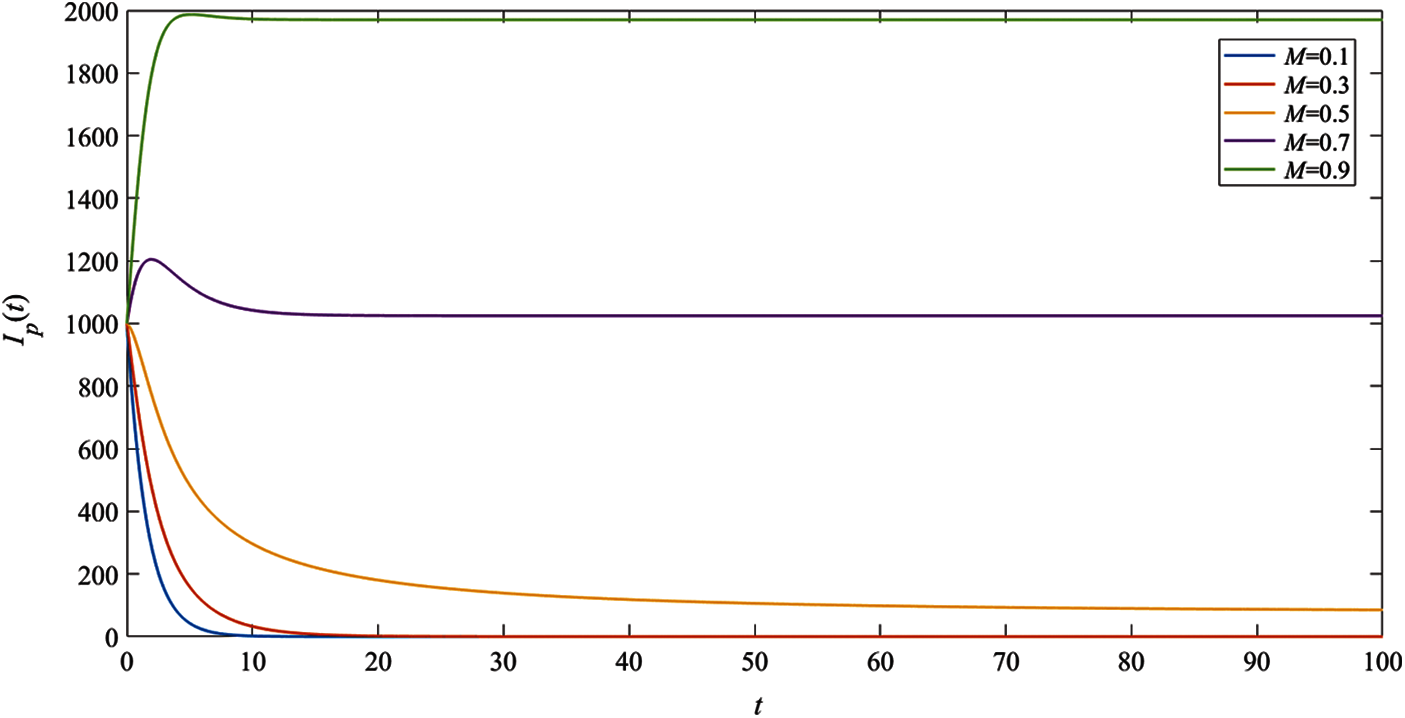
Figure 6: The simulation results of the pig infectious population
We have proposed the mathematical model for predicting the disease transmission of Streptococcus suis between pigs and humans, which is developed from the
Acknowledgement: This research was financially supported by the young researcher development project of Khon Kaen University. Appreciation is extended to Faculty of Science, Khon Kaen University, Khon Kaen, Thailand.
Funding Statement: This research was financially supported by the young researcher development project of Khon Kaen University.
Conflicts of Interest: The authors declare that they have no conflicts of interest to report regarding the present study.
1. K. E. Jones, N. G. Patel, M. A. Levy, A. Storeygard, D. Balk et al., “Global trends in emerging infectious diseases,” Nature, vol. 451, pp. 990–993, 2008. [Google Scholar]
2. F. Li and L. Du, “MERS coronavirus: An emerging zoonotic virus,” Viruses, vol. 11, no. 7, pp. 663, 2019. [Google Scholar]
3. J. S. Mackenzie and D. W. Smith, “COVID-19: A novel zoonotic disease caused by a coronavirus from China: What we know and what we don't,” Microbiology Australia, vol. 41, no. 1, pp. 45–50, 2020. [Google Scholar]
4. Z. R. Lun, Q. P. Wang, X. G. Chen, A. X. Li and X. Q. Zhu, “Streptococcus suis: An emerging zoonotic pathogen,” The Lancet. Infectious Diseases, vol. 7, no. 3, pp. 201–209, 2011. [Google Scholar]
5. H. J. Huh, K. J. Park, J. H. Jang, M. Lee, J. H. Lee et al., “Streptococcus suis meningitis with bilateral sensorineural hearing loss,” The Korean Journal of Laboratory Medicine, vol. 31, no. 3, pp. 205–211, 2011. [Google Scholar]
6. Y. Feng, H. Zhang, Z. Wu, S. Wang, M. Cao et al., “Streptococcus suis infection,” Virulence, vol. 5, no. 4, pp. 477–497, 2014. [Google Scholar]
7. M. Gajdács, A. Németh, M. Knausz, I. Barrak, A. Stájer et al., “Streptococcus suis: An underestimated emerging pathogen in Hungary?, ” Microorganisms, vol. 8, no. 9, pp. 1292, 2020. [Google Scholar]
8. N. Dekker, A. Bouma, I. Daemen, D. Klinkenberg, L. van Leengoed et al., “Effect of spatial separation of pigs on spread of streptococcus suis serotype 9, ” PLOS ONE, vol. 8, no. 4, pp. e61339, 2013. [Google Scholar]
9. E. Giang, B. M. Hetman, J. M. Sargeant, Z. Poljak and A. L. Greer, “Examining the effect of host recruitment rates on the transmission of streptococcus suis in nursery swine populations, ” Pathogens, vol. 9, no. 3, pp. 174, 2020. [Google Scholar]
10. M. Okura, M. Osaki, R. Nomoto, S. Arai, R. Osawa et al., “Current taxonomical situation of streptococcus suis,” Pathogens, vol. 5, no. 3, pp. 45, 2016. [Google Scholar]
11. G. Goyette-Desjardins, J. Auger, J. Xu, M. Segura and M. Gottschalk, “Streptococcus suis, an important pig pathogen and emerging zoonotic agent—an update on the worldwide distribution based on serotyping and sequence typing,” Emerging Microbes and Infections, vol. 3, no. 1, pp. 1–20, 2014. [Google Scholar]
12. J. Dutkiewicz, J. Sroka, V. Zajac, B. Wasinski, E. Cisak et al., “Streptococcus suis: A re-emerging pathogen associated with occupational exposure to pigs or pork products. part I—Epidemiology, ” Annals of Agricultural and Environmental Medicine, vol. 24, no. 4, pp. 683–695, 2017. [Google Scholar]
13. M. Gottschalk, J. Xu, C. Calzas and M. Segura, “Streptococcus suis: A new emerging or an old neglected zoonotic pathogen?, ” Future Microbiol, vol. 5, no. 3, pp. 371–391, 2010. [Google Scholar]
14. K. Oishi, A. Kerdsin, S. Dejsirilert, P. Puangpatra, S. Sripakdee, “Genotypic profile of streptococcus suis serotype 2 and clinical features of infection in humans, Thailand,” Emerging Infectious Diseases, vol. 17, no. 5, pp. 835–842, 2011. [Google Scholar]
15. A. Kerdsin, D. Takeuchi, A. Nuangmek, Y. Akeda, M. Gottschalk et al., “Genotypic comparison between streptococcus suis isolated from pigs and humans in Thailand,” Pathogens, vol. 9, no. 1, pp. 50, 2020. [Google Scholar]
16. A. Kerdsin, K. Oishi, S. Sripakdee, N. Boonkerd, P. Polwichai et al., “Clonal dissemination of streptococcus suis serotype 14 in Thailand,” Journal of Medical Microbiology, vol. 58, no. 11, pp. 1508–1513, 2009. [Google Scholar]
17. A. Kerdsin, R. Hatrongjit, M. Gottschalk, D. Takeuchi, S. Hamada et al., “Emergence of streptococcus suis serotype 9 infection in humans,” Journal of Microbiology, Immunology and Infection, vol. 50, no. 4, pp. 545–546, 2017. [Google Scholar]
18. R. Hatrongjit, A. Kerdsin, M. Gottschalk, D. Takeuchi, S. Hamada et al., “First human case report of sepsis due to infection with streptococcus suis serotype 31 in Thailand,” BMC Infectious Diseases, vol. 15, pp. 392, 2015. [Google Scholar]
19. J. Dutkiewicz, V. Zajac, J. Sroka, B. Wasinski, E. Cisak et al., “Streptococcus suis: A re-emerging pathogen associated with occupational exposure to pigs or pork products. part II-pathogenesis,” Annals of Agricultural and Environmental Medicine, vol. 25, no. 1, pp. 186–203, 2018. [Google Scholar]
20. J. F. Moxnes and K. Hausken, “Mathematical modelling of acute virus influenza a infections,” Mathematical and Computer Modelling of Dynamical Systems, vol. 18, no. 5, pp. 521–538, 2012. [Google Scholar]
21. U. Panbaba and S. Garba, “Stability analysis and optimal control for yellow fever model with vertical transmission,” International Journal of Applied and Computational Mathematics, vol. 6, pp. 105, 2020. [Google Scholar]
22. D. Prathumwan, K. Trachoo and I. Chaiya, “Mathematical modeling for prediction dynamics of the coronavirus disease 2019 (COVID-19) pandemic, quarantine control measures,” Symmetry, vol. 12, no. 9, pp. 1404, 2020. [Google Scholar]
23. K. Liang, “Mathematical model of infection kinetics and its analysis for COVID-19, SARS and MERS,” Infection, Genetics and Evolution, vol. 82, pp. 104306, 2020. [Google Scholar]
24. M. Sohaib and Attaullah, “Mathematical modeling and numerical simulation of HIV infection model,” Results in Applied Mathematics, vol. 7, pp. 100118, 2020. [Google Scholar]
25. M. U. Rahman, M. Arfan, Z. Shah, P. Kumam and M. Shutaywi, “Nonlinear fractional mathematical model of tuberculosis (TB) disease with incomplete treatment under atangana-baleanu derivative,” Alexandria Engineering Journal, vol. 60, no. 3, pp. 2845–2856, 2021. [Google Scholar]
26. M. Arfan, K. Shah, A. Ullah, M. Shutaywi, P. Kumam et al., “On fractional order model of tumor dynamics with drug interventions under nonlocal fractional derivative,” Results in Physics, vol. 21, pp. 103783, 2021. [Google Scholar]
27. K. Shah, R. U. Din, W. Deebani, P. Kumam and Z. Shah, “On nonlinear classical and fractional order dynamical system addressing COVID-19,” Results in Physics, vol. 24, pp. 104069, 2021. [Google Scholar]
28. M. A. Almuqrin, P. Goswami, S. Sharma, I. Khan, R. S. Dubey et al., “Fractional model of ebola virus in population of bats in frame of atangana-baleanu fractional derivative,” Results in Physics, vol. 26, pp. 104295, 2021. [Google Scholar]
29. H. M. Srivastava, R. S. Dubey and M. Jain, “A study of the fractional-order mathematical model of diabetes and its resulting complications,” Mathematical Methods in the Applied Sciences, vol. 42, pp. 4570–4583, 2019. [Google Scholar]
30. S. S. Alzaid, B. S. T. Alkahtani, S. Sharma and R. S. Dubey, “Numerical solution of fractional model of hiv-1 infection in framework of different fractional derivatives,” Journal of Function Spaces, vol. 2021, pp. 6642957, 2021. [Google Scholar]
31. Z. Shah, R. Jan, P. Kumam, W. Deebani and M. Shutaywi, “Fractional dynamics of HIV with source term for the supply of new CD4+ T-cells depending on the viral load via caputo–Fabrizio derivative,” Molecules, vol. 26, pp. 1806, 2021. [Google Scholar]
32. P. Magal and G. Webb, “The parameter identification problem for SIR epidemic models: Identifying unreported cases,” Journal of Mathematical Biology, vol. 77, pp. 1629–1648, 2018. [Google Scholar]
33. M. De la Sen, A. Ibeas, S. Alonso-Quesada and R. Nistal, “On a SIR model in a patchy environment under constant and feedback decentralized controls with asymmetric parameterizations,” Symmetry, vol. 11, no. 3, pp. 430, 2019. [Google Scholar]
34. M. De la Sen, A. Ibeas and R. Agarwal, “On confinement and quarantine concerns on an SEIAR epidemic model with simulated parameterizations for the COVID-19 pandemic,” Symmetry, vol. 12, no. 10, pp. 1646, 2020. [Google Scholar]
35. C. Shen, M. Li, W. Zhang, Y. Yi, Y. Wang et al., “Modeling transmission dynamics of streptococcus suis with stage structure and sensitivity analysis,” Discrete Dynamics in Nature and Society, vol. 2014, pp. 432602, 2014. [Google Scholar]
36. W. Anna, A. Anna, B. Annette, S. Marie, G. Bengt et al., “Streptococcus suis in Swedish grower pigs: Occurrence, serotypes, and antimicrobial susceptibility,” Acta Veterinaria Scandinavica, vol. 62, pp. 36, 2020. [Google Scholar]
37. S. Dee, A. Carlson, N. Winkelman and M. Corey, “Effect of management practices on the streptococcus suis carrier rate in nursery swine,” Journal of the American Veterinary Medical Association, vol. 203, no. 2, pp. 295–299, 1993. [Google Scholar]
38. G. Zou, J. Zhou, R. Xiao, L. Zhang, Y. Cheng et al., “Effects of environmental and management-associated factors on prevalence and diversity of streptococcus suis in clinically healthy pig herds in China and the United Kingdom,” Applied and Environmental Microbiology, vol. 84, no. 8, pp. e02590–17, 2018. [Google Scholar]
39. T. M. Chen, J. Rui, Q. P. Wang, Z. Y. Zhao, J. A. Cui et al., “A mathematical model for simulating the phase-based transmissibility of a novel coronavirus,” Infectious Diseases of Poverty, vol. 9, pp. 24, 2020. [Google Scholar]
40. P. van den Driessche and J. Watmough, “Reproduction numbers and sub-threshold endemic equilibria for compartmental models of disease transmission,” Mathematical Biosciences, vol. 180, no. 1–2, pp. 29–48, 2002. [Google Scholar]
41. O. Diekmann, J. A. P. Heesterbeek and M. G. Roberts, “The construction of next-generation matrices for compartmental epidemic models,” The Royal Society Interface, vol. 7, no. 47, pp. 873–885, 2009. [Google Scholar]
42. Statista, Thailand: Birth rate from 2008 to 2018 (per 1,000 inhabitants). Statista, 2020. [Online]. Available: https://www.statista.com/statistics/977294/crude-birth-rate-inthailand/. [Google Scholar]
 | This work is licensed under a Creative Commons Attribution 4.0 International License, which permits unrestricted use, distribution, and reproduction in any medium, provided the original work is properly cited. |