DOI:10.32604/cmc.2022.022508
| Computers, Materials & Continua DOI:10.32604/cmc.2022.022508 | |
| Article |
Twitter Arabic Sentiment Analysis to Detect Depression Using Machine Learning
Department of Computer Science, College of Computer Science and Information Technology, Imam Abdulrahman Bin Faisal University, P.O. Box 1982, Dammam, 31441, Saudi Arabia
*Corresponding Author: Reem A. Almakki. Email: ReemAbAlmakki@gmail.com
Received: 10 August 2021; Accepted: 11 October 2021
Abstract: Depression has been a major global concern for a long time, with the disease affecting aspects of many people's daily lives, such as their moods, eating habits, and social interactions. In Arabic culture, there is a lack of awareness regarding the importance of facing and curing mental health diseases. However, people all over the world, including Arab citizens, tend to express their feelings openly on social media, especially Twitter, as it is a platform designed to enable the expression of emotions through short texts, pictures, or videos. Users are inclined to treat their Twitter accounts as diaries because the platform affords them anonymity. Many published studies have detected the occurrence of depression among Twitter users on the basis of data on tweets posted in English, but research on Arabic tweets is lacking. The aim of the present work was to develop a model for analyzing Arabic users’ tweets and detecting depression among Arabic Twitter users. And expand the diversity of user tweets, by adding a new label (“neutral”) so the dataset include three classes (“depressed”, “non-depressed”, “neutral”). The model was created using machine learning classifiers and natural language processing techniques, such as Support Vector Machine (SVM), Random Forest (RF), Logistic Regression (LR), K-nearest Neighbors (KNN), AdaBoost, and Naïve Bayes (NB). The results showed that the RF classifier outperformed the others, registering an accuracy of 82.39%.
Keywords: Depression; sentiment analysis; twitter; supervised learning; machine learning
Depression is the most common mental illness that renders a person hopeless, sad, and frustrated; it also diminishes one's self-esteem. According to the World Health Organization (WHO), depression affects 264 million people worldwide [1]. In Arabic countries, the lack of awareness regarding this disorder has left many people undiagnosed and untreated. However, Twitter is considered a powerful tool for disseminating information and a rich resource of views on many topics, including politics, business, economics, and social issues [2]. And it can be helpful to state people's emotions.
The members of Saudi Arabian society are very active on Twitter; as reported in a Business intelligence (BI) study, 41% of online users in the country use the Twitter platform [3]. Most Twitter users tend to express their feelings through texts, media, emojis, and hashtags. Instead of speaking out about their problems, they share their emotions through tweets. Sometimes, people share private information, such as their health statuses such as depression symptoms.
Depression is one of the most well-known mental health disorders and it is considered as a major issue for mental health practitioners. Therefore, there is a need for a system to detect the depression, which can help in the prevention and detection of depression. Motivated by this need, in this paper, we propose to develop a model for analyzing Arabic users’ tweets and detecting depression among Arabic Twitter users.
In consideration of the above-mentioned issues, this study was aimed at experimentally identifying depressed Arabic Twitter users on the basis of tweet data. The examination was conducted using natural language processing (NLP) and machine learning techniques. Although such an experiment has been widely conducted on the English language, limited research has been done on the Arabic language. So, this research aims to expand this field since there is a lack of studies in Arabic.
To achieve the objective of the study, we documented tweets from people who completed the Center for Epidemiologic Studies Depression (CES-D) scale [4] or self-declared themselves as suffering from depression over the Twitter platform. The recorded tweets (4542 tweets), were then labeled as posted by depressed, neutral, and non-depressed before the dataset was pre-processed using NLP. A supervised machine learning model for classifying the tweets into appropriate categories was developed. The models used which are SVM, RF, LR, KNN, AdaBoost, and NB were compared using performance measures (accuracy, recall, precision, and F1 score), after which the most accurate was used to predict the occurrence of depression among users on the basis of Arabic tweets.
This paper is organized as follows: Section 2 discusses the Review of Related Literature and Background. Section 3 presents the Description of the Methodology. Section 4 presents the Performance Measurement. Section 5 presents the Experimental Results and Discussion. Finally, the Conclusion and Future Work are identified in Section 6.
2 Review of Related Literature and Background
This section presents a background to Arabic sentiment analysis and depression and reviews related literature.
Conducting a sentiment analysis of texts in the Arabic language is more complex than that directed toward English texts because the former is characterized by more forms than other languages. The formal variant of Arabic is Modern Standard Arabic (MSA), but this is rarely used in spoken interactions. The most frequently used informal variant is Dialectal Arabic (DA), especially for communication purposes. A total of 30 major Arabic dialects differs from MSA, the approaches used to translate difficult MSA terms are ineffective when applied to DA translation. Recently, Arabic researchers have developed solutions for different dialects, but these remain minimally inaccurate and cover only a few dialects [5].
Depression is considered a global concern. It is a very common disease, as it affects people across the world. Over 264 million people have recently been afflicted with depression [1], which comes in many forms, each accompanied by its own symptoms [6]. The most popular form is major depressive disorder (MDD), which influences the ability of individuals to do daily tasks, such as sleep, eat, study, work, and have fun [6]. Depression does not have a target age, as it may begin at a young age. Curbing depression is essential to saving people's lives [7]. In Arabic culture, the stigma on mental illness is deeply entrenched, and there is a lack of awareness regarding this issue [8].
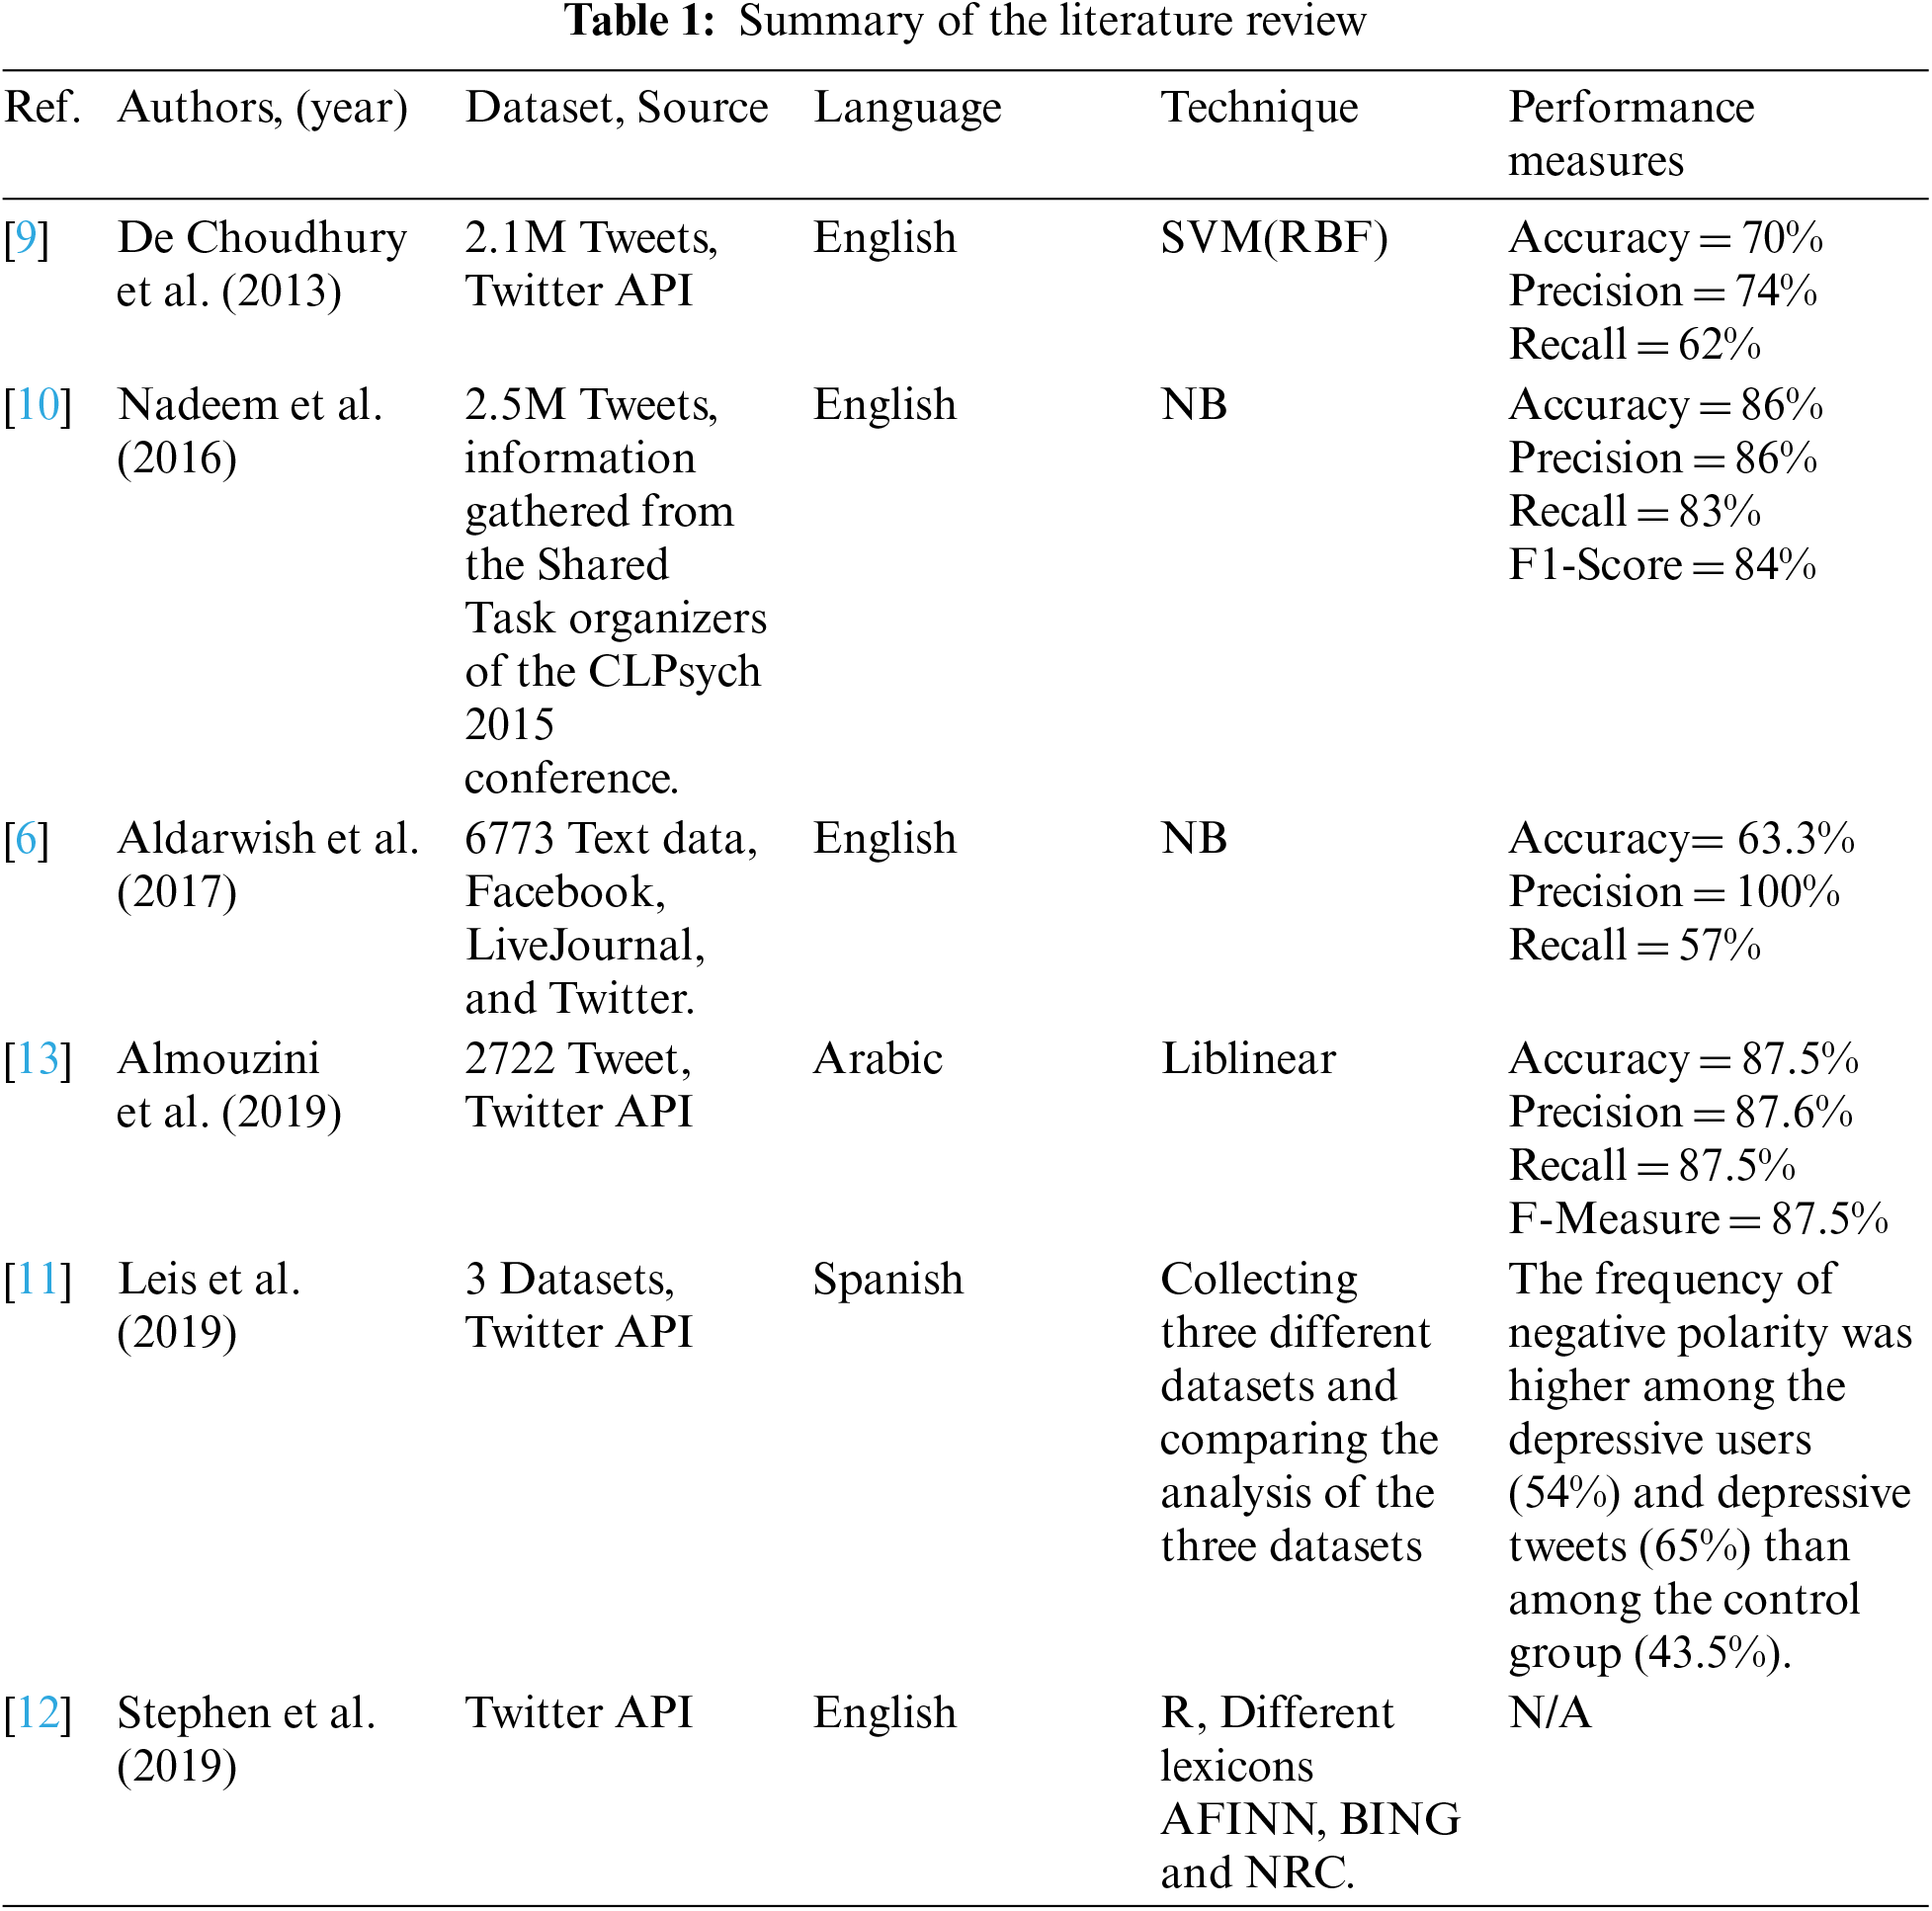
De Choudhury et al. [9] documented timeline tweets from 476 users who answered the CES-D questionnaire. They found that depressed people engage in fewer activities, express negative emotions, and share more medical and relational concerns online than individuals without this illness. Using SVM, the authors constructed a model whose best performance was an RBF kernel scoring of 70% in terms of accuracy.
Nadeem et al. [10] recorded tweets from Twitter users who set their profiles to “public” and declared over the platform that they have depression (e.g., a post that says, “Today I was diagnosed with depression.”). Then, they used a bag-of-words approach, which involved placing every word in a bag and then measuring its frequency of appearance. Finally, they tested different supervised classifiers and found that the optimal accuracy (i.e., 86%) was achieved by a naïve Bayes classifier.
Multiple datasets were used by Leis et al. [11] in their research. In the first phase, they used three datasets, namely, two depressive tweet datasets and one control dataset. In the second phase, they compared their analyses and used part-of-speech (POS) tagging with an NLP tool to identify the behavioral patterns of depressed Twitter users. The results revealed that depressive users less actively post tweets than non-depressed users. When they tweet, they do so more frequently between 23:00 and 6:00. The findings also indicated that verbs and the first-person singular are most often used by depressive users.
Aldarwish et al. [6] used two datasets. The first dataset was collected from three social network sites (SNS): Facebook, Live Journal, and Twitter. Using the 2073 depressed posts and 2073 non-depressed posts, the first dataset was manually trained to categorize posts into one of the nine symptoms of depression as defined by the American Psychiatric Association Diagnostic and Statistical Manual (DSM-IV). The second dataset contained all patient SNS posts. They proposed a system that uses Rapid Miner to test SVM and NB models. When using a supervised NB model, the results showed 100% precision, 57% recall, and 63% accuracy.
Stephen et al. [12] collected their dataset from users who identified as depressed. To reach more users, they implemented specific keywords used by those who identified as depressed. Their aim was to identify how to calculate depression levels by evaluating the sentiment score produced by the algorithm. The score was checked manually to determine whether the algorithm could correctly understand depression levels within user posts. Three lexicons were used for sentiment analysis, including BING, NRC, and AFINN. Each of the three lexicons gave a final sentiment score with differing magnitudes. The average after normalizing the values into “−1” and “+1” was taken to calculate the final sentiment score. When examining Twitter cases, the authors determined that user engagement patterns on Twitter were different for all posts except those demonstrating the depression interval.
In 2019, an experiment with two phases was conducted by Almouzini et al. [13]. The first phase collected Tweets from Arabic Twitter users who answered CES-D questionnaires. The questionnaires were then labeled as either “depressed” or “non-depressed” based on CES-D and Patient Health Questionnaire-9 (PHQ-9) scales. After being labeled, the dataset was cleaned, and the features were extracted as feature vectors consisting of negation handling and a bag-of-unigrams. The second phase generated a supervised machine learning model that predicted which Arabic users were depressed. Using a Liblinear classifier in this phase, optimal accuracy was recorded at 87.5%. Tab. 1 summarizes the related literature section.
Similar research by Almouzini et al. [13] has only been conducted once when using two label classes (“depressed” and “non-depressed”) to evaluate the Arabic language. To expand the diversity of user Tweets included in this study, a new label (“neutral”) was added that contained Tweets not considered “depressive,” as they exist without subscribing to any symptoms, such as prayers, song lyrics, or Duaa (prayers). Through this study, six classifiers were be used to predict whether users were depressed: SVM, RF, LR, KNN, AdaBoost, and NB.
3 Description of the Methodology
This section will discuss the: Dataset collection, dataset-preprocessing, features extraction and generating the models as shown in Fig. 1.

Figure 1: Methodology diagram
The dataset was collected from Arabic Twitter users who answered the CES-D survey. Moreover, as the study's target audience was Arabic speakers, the CES-D scale was translated into Arabic. The CES-D scale is a short, self-reporting scale that contains 20 questions. It is designed to measure depressive symptomatology [4]. Two questions were added to the survey: the first question asked if the user could include their Twitter username. The second question asked if the user tended to express their feelings on Twitter. In addition to the CES-D survey, the dataset was collected by using a dictionary of depressive phrases. For example,  which means, “I am diagnosed with depression.”
All Tweets collected and filtered from the users were labeled manually. The dataset was divided into three labels: (“depressed,” “non-depressed,” and “neutral.”) Within the (“depressed”) class, Tweets contained at least one symptom of depression. Within the (“non-depressed”) class, Tweets contained positive messages, such as,  meaning, “I am happy today, I love my friends.” Finally, the (“neutral”) class contained Tweets that are considered neither (“depressed” or “non-depressed”) in nature, such as songs, movies, Duaa (prayers), a famous quote, advice, or a question.
The dataset contains three columns: Column [0] represents the Tweet's full text, and Column [1] represents the signs of depression within the Tweet. The signs of depression include the nine symptoms described in the American Psychiatric Association Diagnostic Depression Nine Symptoms [14] (shown in Tab. 2), as well as two additional signs found frequently within depressed Arabic Twitter users—mood swings and feeling lonely. The final sign was a generalized term, as some Tweets did not provide a specific symptom. For example,  , which means, “I'm very depressed today.” As such, this was considered a general sign titled “feeling depressed.” The last column, Column [2], contained the three class labels (“depressed,” “non-depressed,” and “neutral”). Fig. 2 presents the percentage of each depressed class symptoms in the dataset. The study showed that 45% of the Tweets generally talked about how sad and depressed they were, 9% of the Tweets indicated that depressed Arabic users wrote about their lack of sleep, 9% of the Tweets indicated that they had gotten too much sleep, and 8% of the Tweets revealed suicidal thinking; a sensitive topic and dangerous sign of depression amongst users.

Figure 2: The percentage of each symptom of the depressed class
Tab. 2 shows the number of Tweets for each symptom listed under the “depressed” class. And Tab. 3 presents the number of Tweets for each class, as well as the total number of Tweets within the collected dataset.


In this stage, the dataset was cleaned and prepared with the proper application of natural language processing (NLP) techniques, including normalization, stop word filtering, and stemming. This was applied as follows:
In this step of pre-processing, the dataset was cleaned and normalized into a uniform text. This step was implemented by writing a Python script using pyarabic libraries and the regular expression “re.” The application of the normalization stage was conducted through the following steps:
Step 1: Removing usernames, URLs, hashtags, punctuation, and repeated letters. For example,  was converted into
  Arabic characters were also normalized into one representation. For example, the alef letter
  was converted to
Step 2: Removing Arabic diacritics such as the Tatweel. For example,  was converted into
  . The Tashkel, for example,
  was converted into
Stop words are terms that are removed from the text without impacting its meaning. These words appear more frequently in a document [15]. In addition to dialect stop words (e.g.,  ), a large, open source Sourceforge Arabic stop words dictionary was used for this step. Further, negation words (e.g.,
  ) were kept, as they change the meaning of the text.
Tokenization is the process of splitting sentences into smaller, more meaningful sections (Tokens) to help text exploring [16]. For example,  was tokenized into
  This step was done by using the pyarabic tokenize method.
The stemming phase included removing large portions of a word, like a prefix or suffix, in order to return it to the root of the word. For example,  was converted into
  In Arabic, a root word is a word used in its basic form so that multiple nouns and verbs can be created by adding affixes to it [17]. This step was implemented by accessing the nltk library using the ISRIStemmer proposed by Taghva et al. [18].
We aimed to find the best techniques to reach our goal, which was to detect depression within Arabic tweets using machine learning. We accomplished this by finding the best model features that gave the highest performance accuracy. Different N-gram ranges and TF-IDF methods were used to extract the required features. Six supervised machine learning models were used to train the dataset, including: SVM, RF, LR, KNN, AdaBoost, and NB. As a result, we found the feature combination that gave optimal accuracy.
3.5.1 Term Frequency–Inverse Document Frequency (TF-IDF)
Term frequency-inverse document frequency (TF-IDF) is commonly used for text classification. Term-frequency is the number of times a word appears within a document (Eq. (1)). Inverse document frequency is a weight term scheme that gives tokens that appear more frequently in documents a lower impact, or weight, and gives tokens that occur less frequently a higher weight [19] (Eq. (2)).
where “TF(t, d)” is the number of times the word “t” appears in the document “d” and,
where “n” is the total number of documents, and “DF(t)” is the number of documents that contain the word “t”.
N-grams extract characters or words from a text, and are used in stemming, spelling check, and text compression. N-grams are used as an approach to find similarities between N-grams. The N value must be an integer and is set to be a unigram n = 1 (one word or character), a bigram n = 2 (two words or characters), or a trigram n = 3 (three words or characters) [20]. For applying the N-gram technique, we used the Sklearn. Feature_extraction. text Count Vectorizer class that passes an N-gram range (min, max). This class combines the N-gram sequences into one dictionary. The N-gram range (1,1) was set to unigram only, and the same logic applied to the ranges (2,2) and (3,3). For example, the text, “I was very upset today” was divided into the following:
-N-gram range (1,1): {‘was': 3, ‘very': 2, ‘upset': 1, ‘today': 0}.
-N-grams range (1,2): {‘was': 5, ‘very': 3, ‘upset': 1, ‘today': 0, ‘was very': 6, ‘very upset': 4, ‘upset today': 2}.
-N-gram range (1,3): {‘was': 6, ‘very': 3, ‘upset': 1, ‘today': 0, ‘was very': 7, ‘very upset': 4, ‘upset today': 2, ‘was very upset': 8, ‘very upset today': 5}.
-N-grams range (2,2): {‘was very': 2, ‘very upset': 1, ‘upset today': 0}.
-N-grams range (2,3): {‘was very': 3, ‘very upset': 1, ‘upset today': 0, ‘was very upset': 4, ‘very upset today': 2}.
-N-grams range (3,3): {‘was very upset': 1, ‘very upset today': 0}.
This class ignores any text that is less than a uni-character (e.g., “a” and “I”).
Six supervisor machine learning models were implemented using Python, Sklearn, and GridSearchCV libraries to determine the classification models. The classifiers were as follows:
NB is a probabilistic classifier that uses the Bayes theorem, where all features (attributes) are assumed to be independent of each other [21]. The following equation (Eq. (3)) shows the NB model:
where “P(C|X)” is the posterior probability of class given predictor, “P(X)” is the prior probability of predictor, “P(C)” is the prior probability of class, and “P(X|C)” is the likelihood of the probability predictor class given.
3.6.2 Support Vector Machine (SVM)
SVM is a classifier that uses risk minimization theory to find the optimal separating hyperplane within the feature space. Simple SVM is used for linear regression and classification problems. To use the SVM classifier in a non-linear space, kernel functions must be used (e.g., RBF and Sigmoid) [22]. The following equation (Eq. (4)) demonstrates the RBF kernel:
where “
RF is a combination of tree predictors that predicts the class label by randomly generating a forest. The forest is a collection of multiple decision trees, and each tree has the value of a random vector sampled independently. Each tree is then distributed equally among all trees. The final classification is based on majority voting [23].
AdaBoost (Ensemble) is an approach applied to textual or numeric data types. Ensembles split the data repeatedly and continue to re-assign different weights to the training data. This ensures misclassified data from the first split will be reassigned correctly during the next data split. This process continues until the best data split is found [24].
3.6.5 K-Nearest Neighbors (KNN)
KNN is a classifier that uses distance, such as the Euclidean distance function, to classify new, unknown data points based on existing data points nearby. The distance function calculates the distance between two points, and the “K” value shows the size of the neighborhood. Unknown data points are classified based on simple voting [25].
3.6.6 Logistic Regression (LR)
LR is a binary logistic model. LR is used based on one or more features to estimate the probability of binary response. The author Nadeem describe LR as a discrete choice model, as it is not technically qualified as a classification method. The relationship between the binary variables and the features are clarified through the use of the (Eq. (5)) below. However, for multi-class text classifications, a multinomial extension must be used [10].
where “F(X)” expresses the dependent variable probabilities, and “β0 + β1X” expresses the perfect fit parameters for the sake of success cases.
The evaluation of classifiers was measured with accuracy, precision, recall, and the use of an F1-score. We calculated the performance measurement for the classifiers with the following equations, where “TP” represents a true positive, “TN” represents a true negative, “FP” represents a false positive, and “FN” represents a false negative:
Precision was measured by calculating the false positives of the classifier.
Recall was measured by calculating the false negatives of the classifier.
The F1-score was calculated by taking the weighted harmonic average of the recall and precision measurements.
5 Experimental Results and Discussion
In this section, a comparison of all classifiers is presented and a discussion of the effect of TF-IDF on text classification. In Tab. 4 This comparison of all classifiers is based on the results of the accuracy, recall, precision, and F1-score model evaluation results. These results were obtained from the optimal parameters of the grid. After collecting and pre-processing the dataset, the dataset was split: 80% of the data was designated for training, and 20% was designated for testing in addition to using a 10-fold cross-validation.

By comparing the performance of the six classifiers through the use of N-grams and TF-IDF, RF obtained the highest accuracy rate at 82.39%, and scored 82.40%, 82.67%, and 82.53% for precision, recall, and F-score, respectively. The classifier that showed the least accuracy was KNN, with a rate of 79.75%.
Since social media provides a wide platform for personal expression, people tend to interact with each other. In contrast, those who are depressed are less active and are often more isolated from others in social media. One method of viewing the online interactions of depressed Arabic users is through their mentions count. The more mentions users have, the more interactive they get. To find out how much depressed, non-depressed and neutral Twitter users are interactive with mentions, we counted the numbers of times a user has mentioned or replied to other people with a counter using a Python script. Based on the results of the counters shown in Fig. 3, it is obvious that depressed Twitter users are less interactive with other users. This result provides evidence that depressed Twitter users are more isolated than non-depressed Twitter users.

Figure 3: Mention interaction
Another avenue for examining Arabic Twitter users is evaluating the emojis they use within their Tweets. Emojis show emotions and can sometimes be better than words. To analyze the emojis used by users we counted the most frequent emojis used by all users in the dataset. Based on the emoji count results, Fig. 4 illustrates that depressed users chose negative emojis more frequently, such as the broken heart emoji or the crying face emoji. It was also shown that these users tend to use less emojis than non-depressed users.
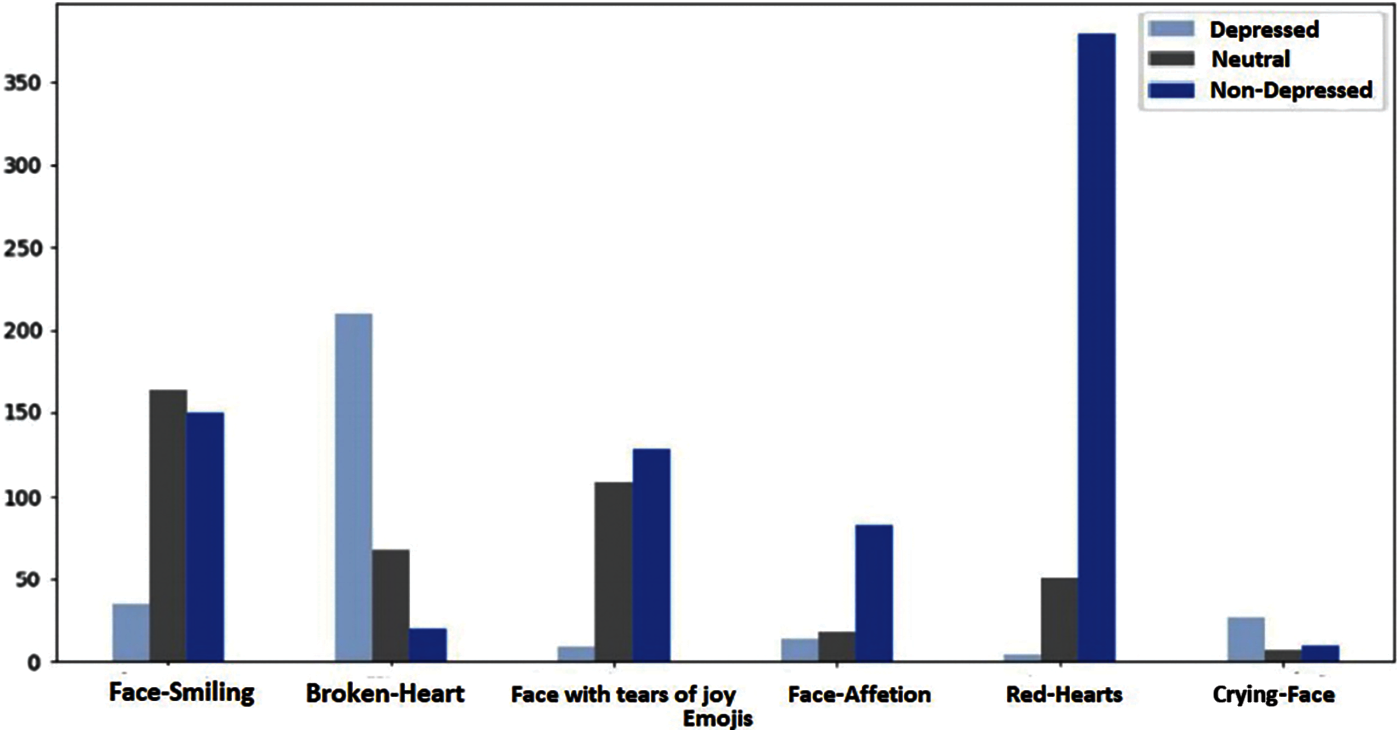
Figure 4: Emojis interaction
Figs. 5 and 6 show the word cloud for depressed and non-depressed classes. The most frequently used Arabic words appear in the bigger font, and the less frequently used Arabic words appear in the smaller font. So, this indicates the most used words by depressed people to express their emotions for the depressed class, and it is the same for the non-depressed class.
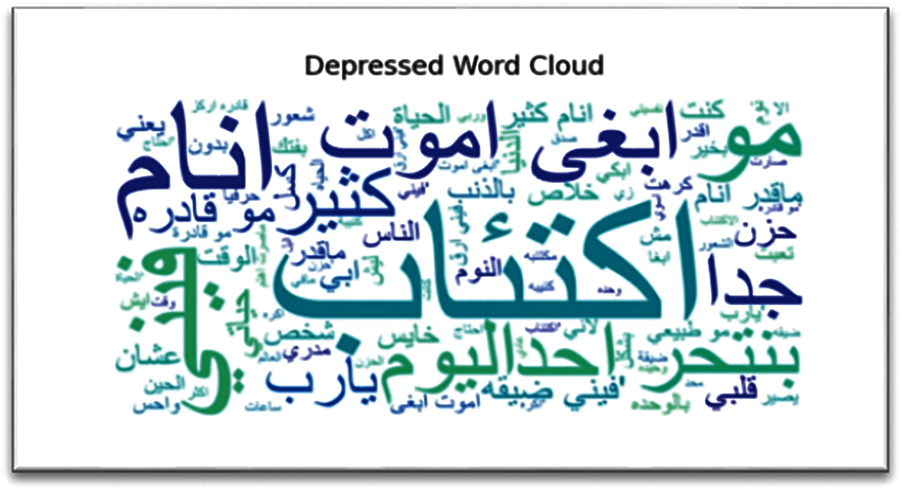
Figure 5: Depressed word cloud
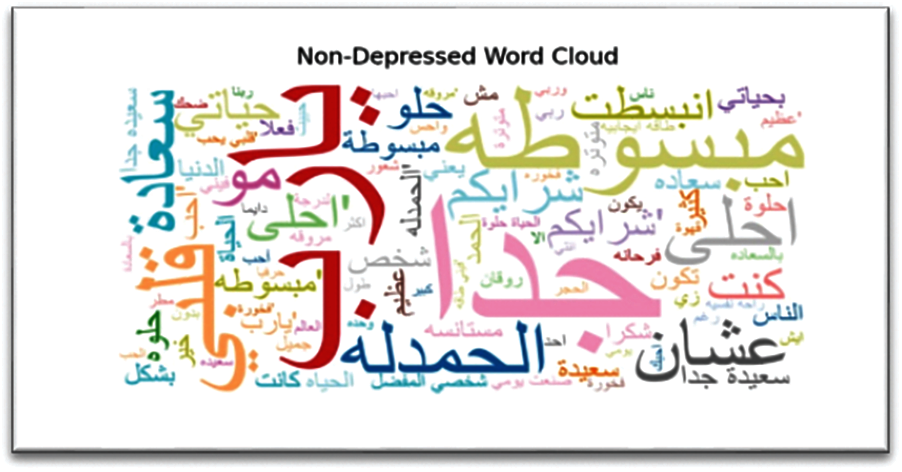
Figure 6: Non-depressed word cloud
The feature extraction was tested in the dataset with N-grams with count vectorizer only and N-grams with count vectorizer and TF-IDF vectorizer. Fig. 7 illustrates that the TF-IDF method that integrates N-grams improves classifier performance.
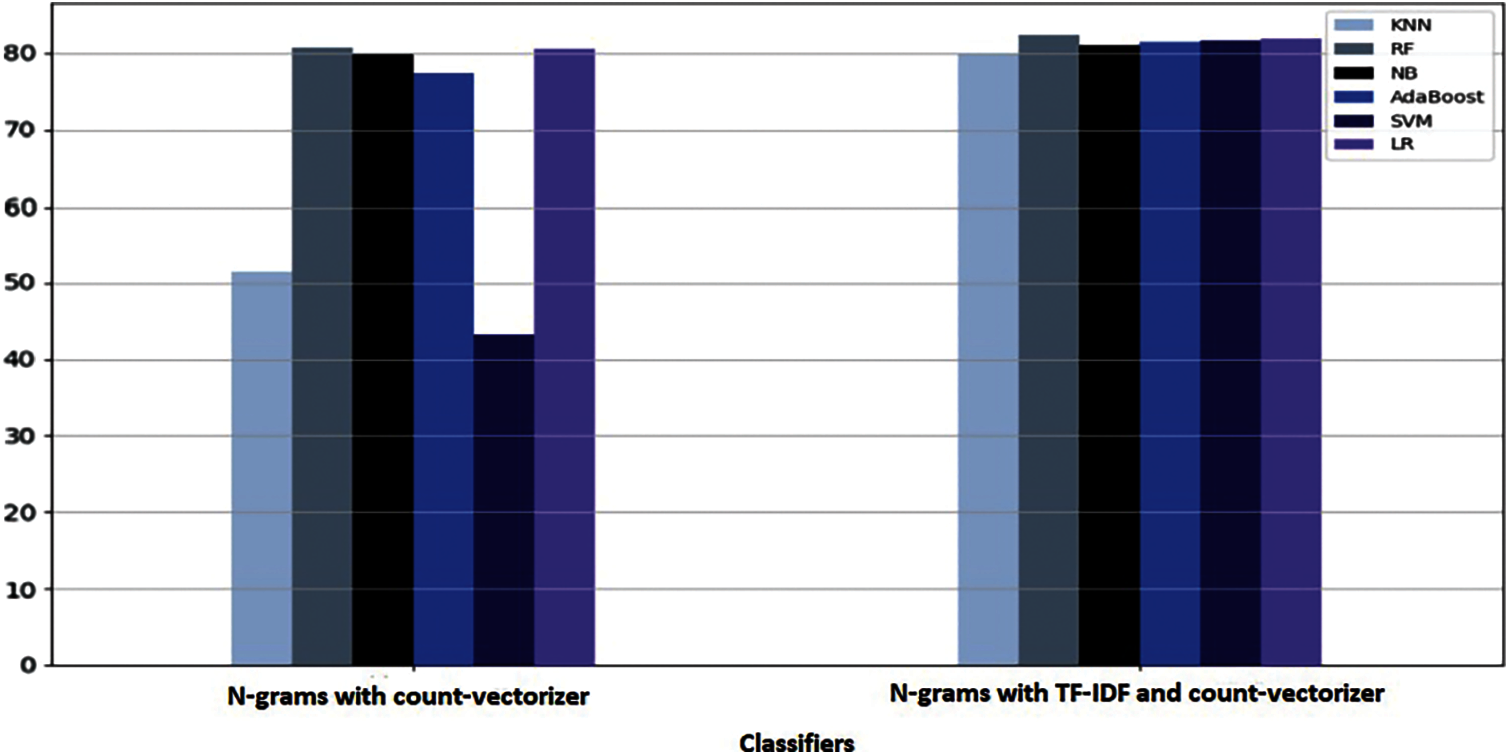
Figure 7: The impact of TF-IDF on text classification
Based on the results discussed above, Arabic people do share their feelings on Twitter. The results show that depressed people demonstrate specific behaviors within their tweets. Users do not show a lot of interaction with others based on their mentions count, and they often use negative words to describe their symptoms, like suicidal thoughts or sleeping disorders. Further, though these users do not extensively use emojis, they do use them in a negative way. This study evaluated the consistent behavior of Tweets to train a supervised machine learning model. Arabic Tweets were collected and labeled manually into (“depressed,” “non-depressed,” and “neutral”) categories, a label (“neutral”) was added to expand the diversity of user tweets. After pre-processing the dataset, six different supervised machine learning text classifiers were used to predict which Twitter users were depressed. The optimal performance of this research was obtained by RF with an accuracy of 82.39%.
In terms of future work, the performance of the machine learning model might be improved by increasing the size of the collected dataset, testing more classifiers, and including additional features in the dataset such as the time of Tweets.
Acknowledgement: We hope that our work will benefit the community by sharing awareness of the existence of the depression in our community and expanding the Arabic sentiment analysis research scope, and we would like to thank everyone that has shared our survey or filled it and participated by providing their Twitter username so we could collect the dataset.
Funding Statement: This study was supported by Deanship of Scientific Research at Imam Abdulrahman Bin Faisal University, under the project No. 2021-184-CSIT.
Conflicts of Interest: The authors declare that they have no conflicts of interest to report regarding the present study.
1. World Health Organization, “Depression,” 2020. [Online]. Available: https://www.who.int/news-room/fact-sheets/detail/depression. [Google Scholar]
2. E. Martínez-Cámara, M. T. Martín-Valdivia, L. A. Ureña-López and A. R. Montejo-Ráez, “Sentiment analysis in twitter,” Natural Language Engineering, vol. 20, no. 1, pp. 1–28, 2012. [Google Scholar]
3. Ministry of Communications and Information Technology, “Saudi Arabia is the most twitter-crazy country in the world: Business insider,” 2013. [Online]. Available: https://www.mcit.gov.sa/en/media-center/news/91426. [Google Scholar]
4. L. S. Radloff, “The CES-d scale: A self-report depression scale for research in the general population,” Applied Psychological Measurement, vol. 1, no. 3, pp. 385–401, 1977. [Google Scholar]
5. N. Al-Twairesh, H. Al-Khalifa, A. Al-Salman and Y. Al-Ohali, “Arasenti-tweet: A corpus for arabic sentiment analysis of Saudi tweets,” in Procedia Computer Science, vol. 117, pp. 63–72, 2017. [Google Scholar]
6. M. M. Aldarwish and H. F. Ahmed, “Predicting depression levels using social media posts,” in IEEE 13th Int. Symp. on Autonomous Decentralized Systems, Bangkok, Thailand, pp. 277–280, 2017. [Google Scholar]
7. M. Marcus, M. T. Yasamy, M. Van Ommeren, D. Chisholm and S. Saxena, “Depression: A global public health concern,” Tech. rep., WHO Department of Mental Health and Substance Abuse, Oct. 2012. Also available as http://www.who.int/mental_health/management/depression/who_paper_depression_wfmh_2012.pdf. [Google Scholar]
8. R. Merhej, “Stigma on mental illness in the arab world: Beyond the socio-cultural barriers,” International Journal of Human Rights in Healthcare, vol. 12, no. 4, pp. 285–298, 2019. [Google Scholar]
9. M. De Choudhury, M. Gamon, S. Counts and E. Horvitz, “Predicting depression via social media,” in AAAI Conf. on Weblogs and Social Media, Ann Arbor, US, 2013. [Google Scholar]
10. M. Nadeem, M. Horn, G. Coppersmith and S. Sen, “Identifying depression on twitter,” arXiv:1607.07384, 2016. [Google Scholar]
11. A. Leis, F. Ronzano, M. A. Mayer, L. I. Furlong and F. Sanz, “Detecting signs of depression in tweets in spanish: Behavioral and linguistic analysis,” The Journal of Medical Internet Research, vol. 21, no. 6, pp. 1–16, 2019. [Google Scholar]
12. J. J. Stephen and P. Prabu, “Detecting the magnitude of depression in twitter users using sentiment analysis,” International Journal of Electrical and Computer Engineering, vol. 9, no. 4, pp. 3247–3255, 2019. [Google Scholar]
13. S. Almouzini, M. Khemakhem and A. Alageel, “Detecting arabic depressed users from twitter data,” Procedia Computer Science, vol. 163, pp. 257–265, 2019. [Google Scholar]
14. American Psychiatric Association, “What is depression?,” 2020. [Online]. Avalible: https://www.psychiatry.org/patients-families/depression/what-is-depression. [Google Scholar]
15. A. Alajmi, E. M. Saad and R. R. Darwish, “Toward an arabic stop-words list generation,” International Journal of Computer Applications, vol. 46, no. 8, pp. 8–13, 2012. [Google Scholar]
16. S. Vijayarani, J. Ilamathi and N. Nithya, “Preprocessing techniques for text mining an overview,” International Journal of Computer Science & Communication Networks, vol. 5, no. 1, pp. 7–16, 2015. [Google Scholar]
17. G. Kanaan, R. Al-Shalabi, M. Ababneh and A. Al-Nobani, “Building an effective rule-based light stemmer for arabic language to improve search effectiveness,” in 2008 Int. Conf. on Innovations in Information Technology, Al Ain, United Arab Emirates, pp. 312–316, 2008. [Google Scholar]
18. K. Taghva, R. Elkhoury and J. Coombs, “Arabic stemming without a root dictionary,” in Int. Conf. on Information Technology: Coding and Computing (ITCC’05Las Vegas, NV, USA, pp. 152–157, 2005. [Google Scholar]
19. X. Tian and W. Tong, “An improvement to TF: Term distribution based term weight algorithm,” in The 2nd Int. Conf. on Networks Security, Wireless Communications and Trusted Computing, Wuhan, China, pp. 252–255, 2010. [Google Scholar]
20. P. Majumder, M. Mitra and B. B. Chaudhuri, “N-gram: A language independent approach to IR and NLP,” in Int. Conf. on Universal Knowledge and Language, Goa, India, 2002. [Google Scholar]
21. S. B. Kim, K. S. Han, H. C. Rim and S. H. Myaeng, “Some effective techniques for naive Bayes text classification,” IEEE Transactions on Knowledge and Data Engineering, vol. 18, no. 11, pp. 1457–1466, 2006. [Google Scholar]
22. Z. Liu, X. Lv, K. Li and S. Shi, “Study on SVM compared with the other text classification methods,” in 2nd Int. Workshop on Education Technology and Computer Science, Wuhan, China, pp. 219–222, 2010. [Google Scholar]
23. D. Xue and F. Li, “Research of text categorization model based on random forests,” in 2015 IEEE Int. Conf. on Computational Intelligence and Communication Technology, Ghaziabad, India, pp. 173–176, 2015. [Google Scholar]
24. M. Li, P. Xiao and J. Zhang, “Text classification based on ensemble extreme learning machine,” arXiv:1805.06525, 2018. [Google Scholar]
25. K. Khamar, “Short text classification using kNN based on distance function,” International Journal of Advanced Research in Computer and Communication Engineering, vol. 2, no. 4, pp. 1916–1919, 2013. [Google Scholar]
 | This work is licensed under a Creative Commons Attribution 4.0 International License, which permits unrestricted use, distribution, and reproduction in any medium, provided the original work is properly cited. |